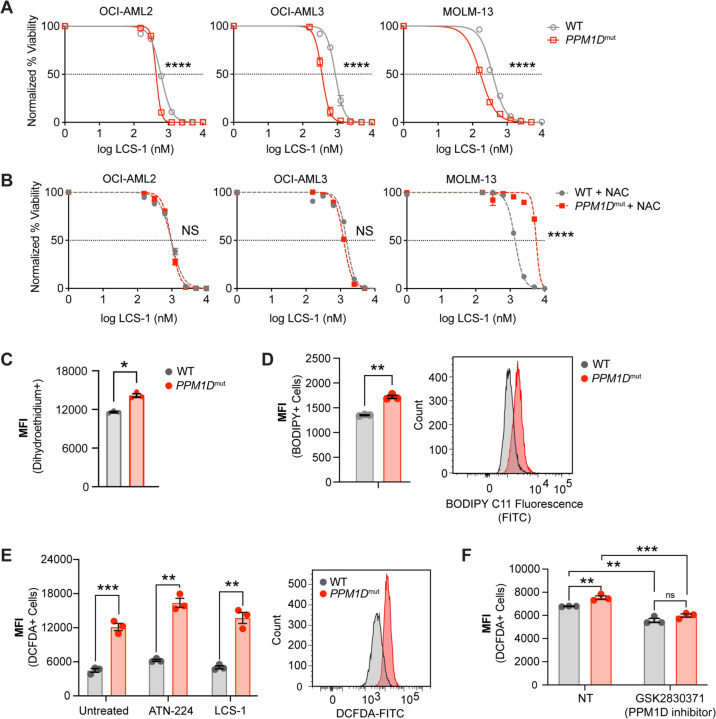
Figure 2. PPM1D-mutant cells are sensitive to SOD1 inhibition and have increased oxidative stress.
(A,B) Dose response curves for cell viability with SOD1-inhibitor (LCS-1) (A) or LCS-1 in combination with 0.25 uM NAC (B) in WT and PPM1D-mutant leukemia cell lines after 24-hours. Mean ± SD (n=3) is shown with a non-linear regression curve. All values are normalized to the baseline cell viability with vehicle, as measured by MTT assay. (C) Endogenous cytoplasmic superoxide levels of WT and PPM1D-mutant leukemia cell lines were measured using dihydroethidium (5 uM). The mean fluorescence intensity (MFI) of dihydroethidium was measured by flow cytometry. Mean ± SD (n=3) is shown. (D) Lipid peroxidation measured using BODIPY 581/591 staining (2.5 uM) of WT and PPM1D-mutant OCI-AML2 cells. The MFI was measured by flow cytometry. Mean ± SD (n=3) is shown. (E-F) Measure of total reactive oxygen species using 2’,7’–dichlorofluorescin diacetate (DCFDA) staining (10 uM) measured by flow cytometry. WT and PPM1D-mutant OCI-AML2 cells were measured at baseline and 24-hrs after SOD1 inhibition (ATN-224 12.5 uM, LCS-1 0.625 uM) (E) or 24-hrs after pharmacologic PPM1D inhibition (GSK2830371, 5 uM) (F); unpaired t-tests were used for statistical analyses, ns=non-significant (p>0.05), **p<0.01, ***p<0.001, ****p<0.0001.

