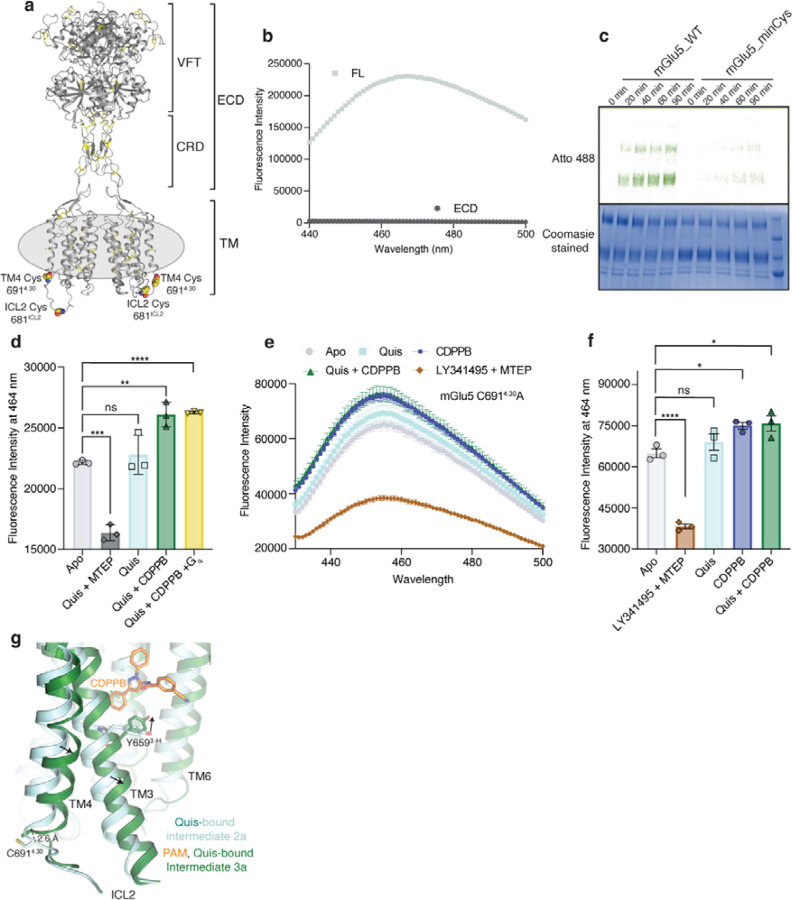
Extended Data Figure 10: Characterisation of minimal cysteine mGlu5 and ICL2 conformation.
(a) Residues Cys6914.30 and Cys681ICL2 that contribute to background labeling with dyes are shown as spheres. Other cysteine residues in the receptor are shown as yellow sticks.
(b) mGlu5 full-length and ECD alone (VFT and CRD) were labeled with the cysteine reactive dye, monobromobimane. Though no signal was seen for ECD (dark grey), full-length (FL) mGlu5 produced a bimane spectrum (light grey). This implies that mGlu5 TMs have cysteine residues that are exposed to being labeled with bimane. n = 1 individual experiment.
(c) WT and minimal cysteine (C6914.30A and C681ICL2A) constructs were labeled with Atto488. Unlike WT, the minimal cysteine construct exhibits almost no background labeling for the times tested.
(d) Fluorescence intensity at 464 nm for mGlu5 WT labeled with bimane (reading out on ICL2 conformation from Fig 3e) is plotted for the different ligand conditions. Though there is no significant difference between Apo (light grey) and Quis (cyan), the addition of Quis and CDPPB (dark green) showed a significant change. No further change was detected with the addition of Gq to the Quis and CDPPB condition (yellow). The addition of MTEP resulted in a significant decrease in fluorescence intensity (dark grey). Data represented as mean ± SD, ns = 0.5326, p= 0.0001***, p = 0.0026**, p < 0.0001****, unpaired t-test (two-tailed), n = 3 individual experiments.
(e) Bimane spectra of mGlu5 in nanodiscs labeled only at C681ICL2 (C6914.30A construct). Unlike adding Quis (cyan) which resulted in no change in the spectrum, the addition of CDPPB alone (blue) or Quis and CDPPB (dark green) increases the fluorescence. On the other hand, LY341495 and MTEP (brown) cause a decrease in fluorescence. Data represented as mean ± SEM, n = 3 individual experiments.
(f) Plotting the fluorescence intensity at 464 nm for bimane data in Extended Data Figure 10e shows a significant difference between CDPPB alone (blue), Quis and CDPPB (dark green), and LY341495 and MTEP (brown) compared to Apo (grey). Data represented as mean ± SEM, ns = 0.5713, p < 0.0001, p = 0.0257* (Apo vs CDPPB), p < 0.0160* (Apo vs Quis + CDPPB), unpaired t-test (two-tailed), n = 3 individual experiments.
(g) Comparison of Quis-bound (cyan) and CDPPB, Quis-bound structures (dark green) showing changes in TM3 and TM4. Also shown is the position of residue C6914.30 which is bimane labeled in the WT construct (Figure 3e, Extended Figure 10e).

