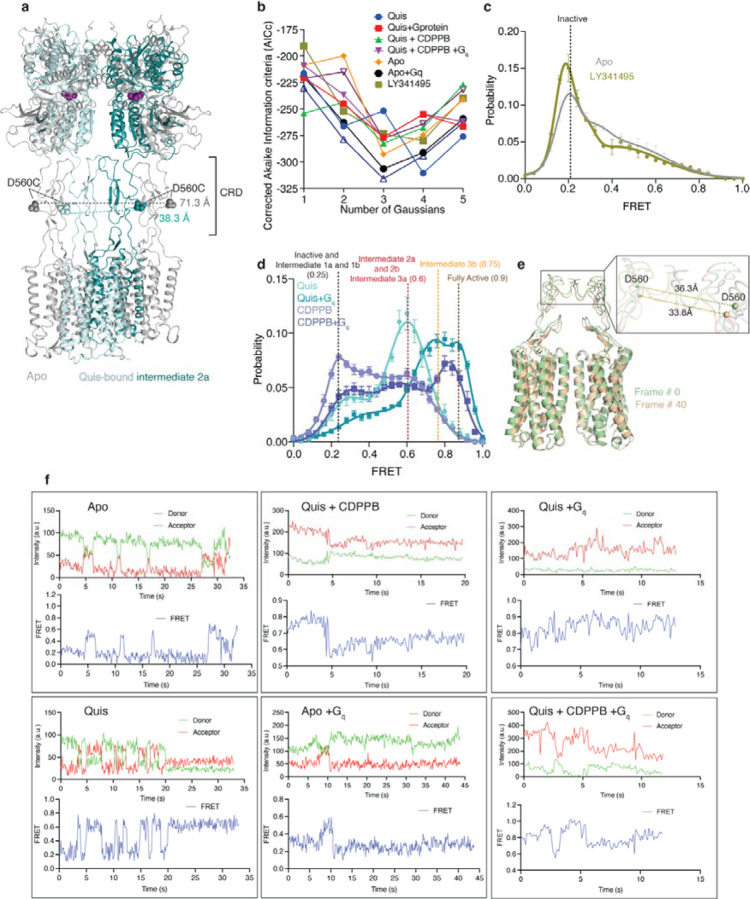
Extended Data Figure 11: smFRET fitting statistics and analysis.
(a) Interdye distance between residue D560 in Apo (grey, 71.3 Å) and Quis-bound Intermediate 2a (36.3 Å). Both these distances correlated well with the observed FRET values (Figure 4b).
(b) Plot of the Akaike information criterion (corrected for small sample size, AICc) values for analysis with 1 to 5 Gaussians fits for the smFRET data. The AICc values showed broad minima at 3 and 4 fits. 3 Gaussians were used to fit the data.
(c) smFRET data showing the comparison of Apo (grey, N=319) and antagonist-bound mGlu5 (brown, N=245).
(d) The addition of CDPPB alone results in two FRET peaks, one at ~ 0.25, Intermediate 1b state, and the other at ~ 0.6, the Intermediate 2b state (slate, N=329). In the presence of Quis (teal), the same two FRET peaks are seen except with different relative proportions of the two states.
(e) The addition of Gq to the Quis-alone sample shifts the population to the high FRET states, Intermediate 3b (~ 0.75) and Fully Active (~ 0.9) at the expense of the Intermediate 2a (~ 0.6) and Intermediate 1a (~ 0.25) peaks. For the CDPPB alone sample, the addition of Gq results in the appearance of a high FRET peak with a decrease, but not complete disappearance of the Intermediate 2b (~ 0.6) and Intermediate 1b (~ 0.25) peaks.
(f) 3Dflex analysis of frames 0 and 40 showing a change in distance between the CRDs.
(g) Example smFRET traces showing donor (green), and acceptor (red) intensity values as well as the calculated FRET values (blue) for a series of ligand conditions with and without Gq.

