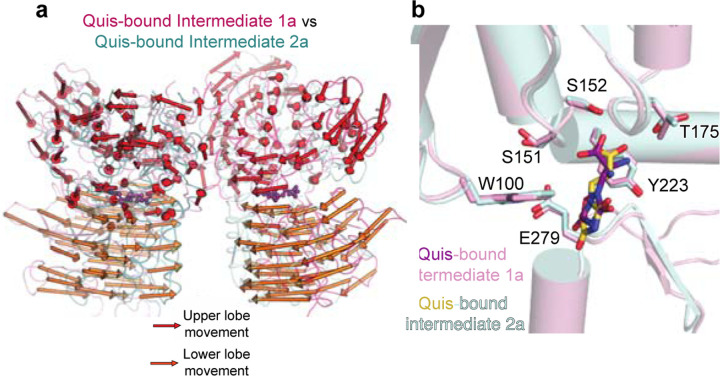
Extended Data Figure 4: Comparison of Quis-bound Intermediate 1a and Quis-bound Intermediate 2a structures.
(a) Comparing the movement of the VFTs in the Quis-bound Intermediate 1a (light pink, magenta) and the Quis-bound Intermediate 2a states (cyan and teal) show large rearrangements in the lower lobe, with relatively smaller changes in the upper lobe. Arrows represent the movement of every 5 Cα atoms from the Intermediate 1a state to the Intermediate 2a state.
(b) Single protomer alignment of Quis-bound Intermediate 2a (cyan) and Quis-bound Intermediate 1a (light pink) structures show no change in the Quis binding pocket.

