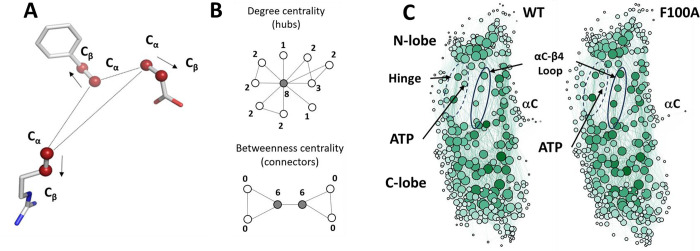
Figure 6. Local Spatial Pattern (LSP) alignment method.
(A). Spatial patterns detected by the LSP-alignment are formed by Cα-Cβ vectors. Both mutual positions and orientation in space of these vectors are taken into account. (B). Two major centralities that characterize graphs. Degree centrality (DC) is the sum of connections for each node. The highlighted node in the middle has the highest DC value of 8. Residues with high level of DC are local “hubs”. Betweenness Centrality (BC) of a node is the number of shortest paths between all other pairs of nodes that pass through this node. Two highlighted nodes are the main connectors in the graph with BC equal to 6. Residues with high level of BC are global connectors between local hubs. (C) Visualization of Protein Residue Networks (PRNs) of PKA before and after the mutation laid out by Gephi software package using ForceAtlase2 algorithm. The diameter of nodes is proportional to the residues DC. Nodes with higher BC have darker color. Four residues from the αC-β4 loop (103–106) are highlighted by oval. The Hinge region is indicated by the dashed oval.

