

Abstract
Safety assessment in retroviral vector-mediated gene therapy remains challenging. In clinical trials for different blood and immune disorders, insertional mutagenesis led to myeloid and lymphoid leukemia. We previously developed the In Vitro Immortalization Assay (IVIM) and Surrogate Assay for Genotoxicity Assessment (SAGA) for pre-clinical genotoxicity prediction of integrating vectors. Murine hematopoietic stem and progenitor cells (mHSPCs) transduced with mutagenic vectors acquire a proliferation advantage under limiting dilution (IVIM) and activate stem cell- and cancer-related transcriptional programs (SAGA). However, both assays present an intrinsic myeloid bias due to culture conditions. To detect lymphoid mutants, we differentiated mHSPCs to mature T cells and analyzed their phenotype, insertion site pattern, and gene expression changes after transduction with retroviral vectors. Mutagenic vectors induced a block in differentiation at an early progenitor stage (double-negative 2) compared to fully differentiated untransduced mock cultures. Arrested samples harbored high-risk insertions close to Lmo2, frequently observed in clinical trials with severe adverse events. Lymphoid insertional mutants displayed a unique gene expression signature identified by SAGA. The gene expression-based highly sensitive molecular readout will broaden our understanding of vector-induced oncogenicity and help in pre-clinical prediction of retroviral genotoxicity.
Keywords: gene therapy, retroviral vectors, genotoxicity prediction, lymphoid insertional mutagenesis, Lmo2 insertion, preclinical risk assessment
Graphical abstract
Rothe and colleagues describe a pre-clinical in vitro safety assay to predict retroviral vector-induced genotoxicity in lymphoid cells based on phenotypic characteristics, insertion site analysis, and gene expression patterns.
Introduction
Retroviral vectors (RVs) are efficient genetic tools to correct monogenetic diseases, such as severe combined immunodeficiencies (SCIDs), hemoglobinopathies, or lysosomal storage disorders.1 However, strong promoter and enhancer elements derived from retroviral long terminal repeat (LTR) regions can activate genes close to the integration sites by insertional mutagenesis. LTR-driven gammaretroviral vectors (γRVs) led to vector-induced oncogenicity in several clinical trials. Clonal dominance was followed by myelodysplastic syndromes (MDSs) and myeloid leukemias or by lymphoid leukemias.2,3,4,5 For a long time, adenosine deaminase deficiency (ADA)-SCID seemed to be an exception with no documented severe adverse events (SAEs); until recently a case of acute lymphoblastic T cell leukemia was observed after treatment with Strimvelis.6,7 In general, SAEs in clinical trials were triggered by the dysregulation of proto-oncogenes such as LMO2, MECOM, or PRDM16. Currently, self-inactivating lentiviral vectors (SIN-LVs), lacking the enhancer and promoter sequences in the LTRs, with internal promoters are the preferred choice for a safer clinical application.8,9,10 However, several patients developed a clonal imbalance with dominant MECOM or PRDM16 integrations, and some of them progressed to MDS after treatment with eli-cel, a SIN-LV for the treatment of cerebral adrenoleukodystrophy.11 Insertional dysregulation of gene expression was likely caused by the internal synthetic myeloproliferative sarcoma virus enhancer, negative control region deleted, dl587rev primer-binding site substituted (MND) promoter. Early and current SAEs highlight the need to better understand and reliably predict RV genotoxicity. Despite the increased safety of lentiviral vectors over LTR-driven gammaretroviral vectors, the choice of strong internal viral promoters poses a critical risk factor. The usual pre-clinical safety assessment of RV involves serial transplantations of transduced cells into wild-type, disease, or tumor-prone mouse models.12 These studies are limited by spontaneous tumor development, long waiting times, and an intrinsic lack of sensitivity. From an animal welfare perspective, in vivo models require many animals, and the endpoint is the onset of leukemia, adding extra suffering to the animals.
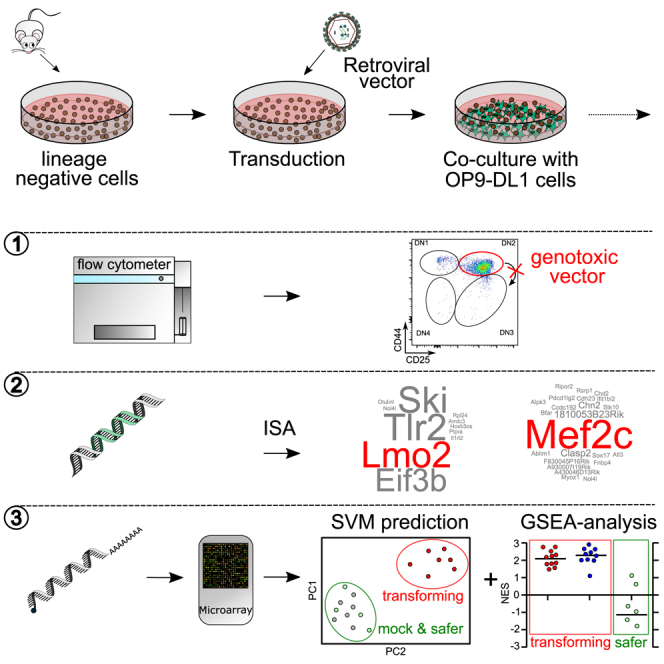
We previously developed the In Vitro Immortalization Assay (IVIM)13,14 and Surrogate Assay for Genotoxicity Assessment (SAGA),15 currently used for in vitro risk assessment of integrating vectors. IVIM quantifies the mutagenic potential of RV based on the acquisition of a proliferation advantage under limiting dilution conditions of murine hematopoietic stem and progenitor cells (mHSPCs) transduced with mutagenic vectors. The IVIM assay can detect the genotoxic potential of the vector configurations that caused the SAEs in early clinical trials as well as SIN-LV designs with strong viral internal promoters. Hence, it has been accepted by regulatory authorities in Europe, the United States, Australia, and Canada as part of the pre-clinical safety package.16,17,18,19,20,21 The more sensitive approach, SAGA, evaluates the activation of gene expression programs connected to oncogenesis and stem cell-like properties during cell immortalization using machine learning algorithms. The molecular readout of SAGA provides a more reliable and accurate prediction than the relatively variable replating phenotype of the IVIM assay. As the culture conditions are shared between IVIM and SAGA, both assays suffer from an intrinsic myeloid differentiation bias and mainly detect clones harboring insertions near Mecom. As the majority of SAEs were linked to lymphoid leukemia and LMO2 activation, the inability to detect lymphoid insertional mutants remains an important drawback of IVIM and SAGA.
Zhou, Sorrentino, and colleagues described vector-induced in vitro immortalization of early lymphoid progenitors with activation of Lmo2 and Mef2c.22 Their work revealed that transduction with mutagenic vectors induced a block in T cell differentiation at the double-negative (DN) 2 stage that could be used as a surrogate readout for insertional mutagenesis. However, in retroviral vector-mediated gene therapies, the usual starting population is HSPCs. To increase the predictive value of the system, we hypothesized that a similar developmental block as described by Zhou and colleagues could be obtained when transducing mHSPCs under suitable culture conditions promoting lymphoid differentiation. Therefore, we established an assay for differentiation of mHSPCs to mature T cells using the OP9-DL1 co-culturing system23 and compared the effects of different RV designs regarding differentiation status, insertion site profiles, and gene expression changes. Using the SAGA pipeline, we showed that the DN2 differentiation arrest induced by mutagenic vectors correlates with the activation of a distinct transcriptional profile in early T cell progenitors. The lymphoid assay can detect clones with dominant Lmo2 insertions, reproducing the observations from the early and current SAEs. The assay described here combines a highly sensitive molecular readout with phenotypic characteristics to specifically predict lymphoid genotoxicity using mHSPCs as starting population. The lymphoid branch of IVIM/SAGA complements the standard myeloid safety package and enables a broader pre-clinical analysis of retroviral vector-induced transformation, toward clinical translation of better pretested and safer vectors.
Results
Lymphoid safety assay for in vitro assessment of insertional mutagenesis
In vitro tests for vector-induced insertional mutagenesis like IVIM and SAGA mainly detect insertional mutants of the myeloid lineage.13,14,15 To screen for lymphoid mutants, we established a T cell differentiation assay using the OP9-DL1 co-culturing system23 and lineage negative (lin–) mHSPCs as starting population. Normally, lymphoid progenitors differentiate from the DN stages (DN1: CD44–/CD25+; DN2: CD44+/CD25+; DN3: CD44+/CD25–; DN4: CD44–/CD25–) to double-positive (DP; CD4+/CD8+) and finally turn into mature single-positive (SP; CD4+ or CD8+) T cells.24 Zhou and colleagues identified lymphoid insertional mutants based on a differentiation block at the DN2 stage.22 Ectopic expression of the leukemogenic transcription factor (TF) LMO2 was also shown to induce a similar DN2 arrest.25
Here, we compared the effects of the LTR-driven γRV RSF91 (positive control in myeloid IVIM/SAGA assays), an SIN-LV overexpressing human LMO2 (SIN-LV.LMO2), and a safer vector design with a weaker cellular internal promoter (SIN-LV.EFS; Figure 1A). 1 day after thawing, the mHSPCs were transduced under STIF cytokine conditions,26 described to maintain the HSPCs’ stem cell-like phenotype in vitro. To prime the cells into the lymphoid direction, 5 ng/mL human FMS-like tyrosine kinase 3 ligand (hFLT3-L) and 5 ng/mL murine/human interleukin 7 (IL-7) were added to the STIF cytokine cocktail. Transduced and mock cells were cultured for up to 53 days with OP9-DL1 mitomycin C (MMC)-inactivated feeder cells in freshly reconstituted alpha minimum essential medium (α-MEM) with 10 ng/mL mSCF, 5 ng/mL hFLT-3L, and 1 ng/mL human/murine IL-7 (Figures 1B and 1C). The samples were analyzed for their differentiation status, insertion site profile, and gene expression patterns at different time points.
Figure 1.

Overview of the lymphoid assay for insertional mutagenesis
(A) Retroviral vector designs tested. RSF91 is a γRV, with the SFFV promoter in its LTR driving transgene expression. It is used as the positive control in myeloid IVIM/SAGA assays. SIN-LV.LMO2 constitutively expresses human LMO2 and was used as a positive control for lymphoid immortalization. SIN-LV.EFS contains the anti-silencing ubiquitous chromatin opening element CBX3 coupled to the EFS promoter driving transgene expression. All vectors express the fluorescent protein mCherry. (B) Schematic representation of the experimental setup. 1 day after thawing, the lin– cells were transduced with different RVs and cultured on a monolayer of OP9-DL1 MMC-inactivated cells under lymphoid conditions. Every 3–4 days, the lin– cells were replated to a new feeder layer and analyzed by flow cytometry. Cells were harvested at different time points to analyze the vector insertion sites and gene expression changes. On day 26, part of each culture was sorted into the DN subpopulations according to CD4, CD8, CD44, and CD25 markers. The remaining unsorted bulk cells were kept in culture for up to 53 days. (C) Cytokine conditions and medium used throughout the assay. The lin– cells were thawed (day −1) and transduced (day 0) in StemSpan medium under STIF conditions (50 ng/mL mSCF, 20 ng/mL mTPO, 20 ng/mL mIGF-2, 10 ng/mL hFGF-1), supplemented with 5 ng/mL IL-7 (human/murine) and hFLT3-L. For co-culturing with the OP9-DL1 cells, the basal medium was freshly reconstituted α-MEM containing 20% fetal bovine serum (FBS), IL-7, mSCF, and hFLT-3L. To induce terminal T cell differentiation, mSCF and IL-7 were reduced at the stated time points. wPRE: Woodchuck post-transcriptional regulatory element; IRES: internal ribosome entry site; SFFV: spleen focus-forming virus; CBX3: chromobox protein homolog 3; EFS: elongation factor 1α short.
Considering that several parameters influence lymphoid differentiation,23,27,28 we adjusted the cytokine concentrations, basal media, and serum batches to promote terminal T cell differentiation. To that end, IL-7 and mSCF were reduced on days 12 and 15, respectively (Figures 1B and 1C).
Mutagenic vectors induce a block in T cell differentiation, unlike a safer vector design
Most RSF91-transduced samples (16 out of 25) developed a block in T cell differentiation with more than 50% DN2 cells of all DN cells by the end of culture measured by flow cytometry (Figures 2A and 2B). Ectopic overexpression of LMO2 by an SIN-LV induced a complete DN2 block in all experiments at a faster rate compared to insertional mutagenesis by RSF91. Mock samples (23 out of 26) showed a constant decrease of DN2 cells throughout the assay to levels below 30% of all DN cells (Figures 2A and 2B). For the remaining three untransduced cultures, we still detected between 30% and 50% DN2 cells by the end of culture (Figure 2B, Table S1). For RSF91, a significant increase in the DN2 population became visible after at least 20 days in culture and was coupled to enhanced proliferation and a blast-like morphology of cells (Figures 2C–2E).
Figure 2.

Mutagenic vectors induced an arrest in lymphoid differentiation
(A) Representative flow cytometry analysis of samples after 30 days of culture showing the different T cell subpopulations determined by CD4, CD8, CD44, and CD25 markers after excluding myeloid markers (CD11b/Gr-1). After gating on the DN T cells, the individual DN stages 1–4 are presented in the lower panel. IDs of samples shown are as follows: mock: 190726–3; SIN-LV.EFS: 200131–6; RSF91: 190726–5; SIN-LV.LMO2: 190726–11. (B) Comparison of the DN2 percentages at the end of culture, measured by flow cytometry. (C) Cell proliferation at the end of culture expressed as expansion factor per day. The total cell number on the last day of culture of each sample was divided by the number of seeded cells in the previous time point multiplied by the time span between counts. (D) Cohens d values reflecting the effect size between the mean expansion factors shown in (C). (E) Cytospin analysis of mock and transduced samples after 30 days in culture (stained with May-Grünwald/Giemsa, 40x magnification). Mature T cells are indicated with black arrows, and while red arrows indicate blasts. IDs of samples shown are as follows: mock: 190726–1; SIN-LV.EFS: 200131–6; RSF91_NIM: 190726–7; RSF91_IM: 190726–5; SIN-LV.LMO2: 190726–9. (F) Example of the DN2 kinetics from experiment ID 190726. The RSF91 replicates that developed the DN2-block (immortalized, IM) are represented with a filled line (n = 3). One RSF91 replicate that did not show the blocked phenotype (non-immortalized, NIM) is shown with a dashed red line. For SIN-LV.LMO2 and mock samples, n = 4. The cutoff at 30% (dotted black line) represents the maximum amount of DN2 cells observed for the majority of mock samples by the end of culture. (G) Representative flow cytometry histograms showing CD127 (IL-7Rα) expression in the DN2 subpopulation of samples after 30 days in culture. For each vector, only transduced (mCherry+) DN2 cells were analyzed, and the correspondent FMO was used as a negative control and a mock sample from the same experiment as a positive control. IDs of samples shown are as follows: SIN-LV.EFS: 200131–5; RSF91_NIM: 200131–7_ RSF91_IM: 190322–5; SIN-LV.LMO2: 190322–9. In all cases, statistical analysis was performed with Kruskal-Wallis test followed by Dunn’s multiple comparison post hoc with Bonferroni-Holm correction for multiple testing. Each data point of the scattered plots represents an individual sample. ∗∗p < 0.01; ∗∗∗∗p < 0.0001; ns = not significant. All experiment IDs can be found in Table S1. FMO: fluorescence minus one.
Nine RSF91-transduced samples and all cultures transduced with the safer vector design (SIN-LV.EFS) did not develop the DN2 block. These samples behaved similarly to mock in their DN2/DP kinetics, did not acquire a proliferation advantage, and showed mature lymphocyte morphology (Figure 2E). The DN2 kinetics of a prototypical experiment are depicted in Figure 2F. RSF91-transduced samples with normal differentiation behavior were labeled as non-immortalized (NIM) to distinguish them from the RSF91-transduced cultures with the differentiation block or immortalized (IM) phenotype.
IL-7 is a crucial component for in vivo and in vitro lymphoid differentiation. Its receptor’s (IL-7R) expression is tightly regulated across the DN stages.29 Therefore, we compared the IL-7R levels (CD127 marker or IL7Rα chain) between samples by flow cytometry. In the absence of a differentiation block (SIN-LV.EFS, mock, and RSF91_NIM), the IL-7R was regulated as described in previous studies, with increased expression during DN2–DN3 stages, followed by downregulation upon entering terminal differentiation. In contrast, all DN2-blocked progenitors (RSF91_IM and SIN-LV.LMO2) downregulated IL-7R expression (Figure 2G).
Integration site analysis reveals switch from polyclonality to oligoclonality during in vitro T cell differentiation of transduced samples
The vector copy number (VCN) was similar between the different vector types used and ranged from 1 to 12 copies per diploid genome (Figure 3A). To investigate the insertion sites associated with the immortalized phenotype, we used the INSPIIRED workflow and bioinformatic pipeline.30,31
Figure 3.

Insertion site analysis of transduced samples: diversity of the sequence pool
(A) VCN determination by ddPCR of all transduced samples that yielded a successful INSPIIRED reaction (see Table S1), using the latest time point available. Three samples were excluded due to very low VCN values not matching the percentage of mCherry+ cells detected by flow cytometry (190614–8, 210527–5, 210527–6). For the sample highlighted in red, less than 10 ng was used for VCN determination, which could have affected the quality of the result. See materials and methods and Table S1 for further details on included samples. (B) Number of unique insertion sites obtained after alignment to the mouse genome. Early time points refer to samples taken between days 12 and 15, and late time points, to samples taken after day 30. (C) Gini coefficients estimate the sequence abundance contribution, with high values indicating few insertions dominate the sequence pool. (D) Shannon diversity indices reflect the diversity of the sequence pool. A low index corresponds to an oligoclonal integration pattern. (E) UC50 values of individual samples representing the amount of insertions covering 50% of the sequence pool. A low value suggests few integrations are overall dominant. ddPCR: droplet digital PCR. Each data point of the scattered plots represents an individual sample.
Overall, the sequencing statistics were similar among all transduced samples regardless of the differentiation status or vector used. We observed initial polyclonality (days 12–15), which was followed by a clonal restriction at late time points (days 33–54), indicated by a reduction in the number of unique insertion sites (UISs; Figure 3B) and a decrease in diversity of the sequence pool (high Gini coefficients and low Shannon indices and UC50 values; Figures 3C–3E). The reduction in polyclonality revealed by the sequencing results correlated with a sustained increase in the percentage of transduced cells (mCherry+) for all vector types, measured by flow cytometry (Figures S1A–S1C).
Insertions close to and within transcriptional units were preferred by all three vectors, although by SIN-LVs to an expectedly higher extent (Figure S1D). The RSF91 vector followed the general tendency of γRV to integrate into the close vicinity of CpG islands and GC-rich sequences, marking promoter regions of actively transcribed genes (Figure S1E). The SIN-LVs clustered at a 100-kb distance from CpG islands but not in their immediate vicinity and generally disfavored GC-rich regions, correlating with the known insertional preferences of SIN-LV.32
Mutagenic retroviral vectors integrate into and dysregulate clinically relevant lymphoid proto-oncogenes
Out of the 15 RSF91_IM samples analyzed with INSPIIRED, 10 contained integrations close to the leukemogenic TFs Lmo2 or Mef2c among the top 10 most abundant sequences (Figure 4A). These insertions were associated with Lmo2 and Mef2c upregulation after prolonged culture, as measured by ddPCR in bulk cultures, also observed for the SIN-LV.LMO2 construct (Figures 4B and 4C, Table S1). In contrast, the expression of both genes in late time points was reduced to minimal levels for mock, SIN-LV.EFS, and RSF91_NIM.
Figure 4.

ISA and clonal dynamics of transduced samples
In (A), (D), (E), (F), and (G), the colored bars represent the top 10 most abundant insertions, while the remaining integrations are depicted pooled together in a gray bar. All the insertion sites shown correspond to a unique chromosomal position. (A) Top 10 insertions found for all RSF91_IM samples taken after 20 days in culture. Lmo2, Mef2c, and Prdm16 high-risk insertions are highlighted in bold red. Lincred1 insertions are depicted in a different color (bold blue), highlighting their indirect effect through Lmo2 dysregulation. (B) and (C) show the mRNA levels of Lmo2 and Mef2c, respectively, measured by ddPCR from early (before day 20) and the latest time point available. All values were normalized to the expression of the housekeeping gene β-actin. Statistical analysis was performed with Kruskal-Wallis test followed by Dunn’s multiple comparison post hoc with Bonferroni-Holm correction for multiple testing. Each data point represents an individual sample. ∗∗p < 0.01; ∗∗∗∗p < 0.0001; ns = not significant. (D) Top 10 insertions for RSF91_NIM samples. No high-risk integrations were detected. (E) and (F) Comparison of the insertion site distribution in early and late time points of two RSF91_IM replicates with a Mef2c dominant integration. IDs: 190726–6 (E); 230111–7 (F). (G) Comparison of the insertion site distribution between days 33 and 54, showing clonal fluctuation in one RSF91_IM replicate (ID: 200131–9). The Mef2c integrations highlighted in bold red correspond to two unique insertion sites according to the chromosomal position. (H) DN2 kinetics of the sample shown in (G), determined by flow cytometry analysis. The arrows indicate the time points where the samples for ISA were taken. All sample IDs can be found in Table S1.
All insertions near Lmo2 were found in reverse orientation and clustered mainly within the first intron, except for two integrations detected at a 10-kb distance upstream of the start of the coding region. Mef2c nearby integrations were located in the same direction as the gene and also within the first intron.
Additionally, dominant insertions near Lincred1 were part of the top 10 of five RSF91_IM samples, and the most abundant in three of them. This gene is located ∼44 kb upstream of Lmo2, and the detected integrations laid in four cases in between both genes in reverse orientation. Only one of the Lincred1 insertions happened within the third intron but also in reverse orientation. Even though Lincred1 was the nearest gene to the insertion site, these samples also showed increased Lmo2 expression, suggesting the genotoxic effect was most likely mediated by Lmo2 dysregulation (Table S1), still in the range of influence of the vector’s LTR elements.
Two cultures displaying the DN2 block lacked Lmo2, Mef2c, or Lincred1 insertions but harbored integrations in or near other leukemia-associated candidates (Rin1,33 Elmo1, 34 Igf2bp2, 35 Mmp14, 36 Meis137). No insertions neighboring Lmo2 or Mef2c and no mRNA upregulation of those genes were detected in the RSF91_NIM samples (Figures 4B–4D). However, some cultures also contained potentially oncogenic insertions close to Adgrg1,38 Actl6a,39 Bahcc1,40 Hes1,41 Inpp4b,42 Itgam,43 Jmjd1c,44 Igf1r,45 Lgr5,46 Phf8,47 and Wee1.48
Based on the immunophenotyping and insertion site analysis (ISA) at different time points, we evaluated the clonal dynamics within RSF91-transduced samples. Consistently, the DN2 block became visible by flow cytometry after at least 20 days in culture (Table S1), and it coincided with the uprising of Lmo2 and Mef2c dominant insertions detected by ISA. Only two RSF91-transduced samples harbored an abundant insertion close to Mef2c at a late time point (after day 20) that was also the most abundant already by day 12–15 (Figures 4E and 4F). However, most RSF91-transduced cultures were characterized by more fluctuation in their clonal composition. Therefore, the clone that became dominant by the end of culture could not be inferred from early time points. For example, the comparison of the top 10 insertions from two late time points of one RSF91_IM replicate (days 33 and 54) yielded no common UISs according to the exact chromosomal position. On the contrary, the five most abundant integrations from day 54 (VCN = 5.66), including Lincred1 and the oncogenic Runx1,49 were detected on day 33 at a very low contribution (0.09%–0.22%). These findings mirrored the DN2 kinetics, where a pronounced decrease of the DN2 population after day 33 was followed by a considerable increase, reflecting the outgrowth of the new dominant clone (Figures 4G and 4H). The coexistence of more than one dominant clone with high-risk insertions was observed in another RSF91_IM sample harboring Mef2c (33.25%) and Prdm16 (3.01%; frequently detected in the myeloid assay) integrations in the top 10.
For SIN-LV.EFS and SIN-LV.LMO2, no dominant insertions close to Lmo2 or Mef2c were detected, consistent with the absence of a differentiation block in SIN-LV.EFS-transduced cultures. Nevertheless, we still found potentially oncogenic insertions close to Zeb2,50 Serpinb2,51 Sema3A,52 Npm1,53 Msr1,54 Kif1b,55 Calcrl,56 Sox4,57 Fgfr1op2,58 and Meis137 in the top 10 of SIN-LV.EFS-transduced replicates (Figure S1F).
SAGA-XL identifies lymphoid genotoxicity predictors in DN2-sorted and in bulk culture samples
The myeloid SAGA classifier described in Schwarzer et al.15 was developed with a combination of unsupervised filtering and support vector machine (SVM) employing recursive feature elimination (RFE) and a genetic algorithm.15 To develop a model for a lymphoid immortalization signature (SAGA-XL), we followed a similar bioinformatic strategy. We performed microarray analyses of RNA samples from late bulk culture time points, a similar population as conventionally used for analysis in the myeloid SAGA assays. To investigate whether a particular signature was associated with the cells developing the immortalized phenotype, we separately analyzed DN2-sorted samples from day 26. As implemented in the standard SAGA pipeline, after binary logarithmic transformation (log2), the raw data from each population were split ten times in training (70%) and validation (30%) sets, using mock and RSF91 as criteria for randomization. The training sets were processed by quantile normalization, batch correction, and unsupervised filtering, followed by SVM-RFE with a radial kernel. The top 10 features most frequently selected by cross-validated SVM-RFE across the 10 splits (Table 1) were used to train an SVM with radial kernel to predict validation sets, which were first normalized and add-on batch corrected. The resulting balanced accuracies, specificity, and sensitivity values indicated a promising model performance for both populations (bulk = balanced accuracy: confidence interval (CI): 0.698–1.000, point estimate: 0.889; specificity: CI: 0.665–1.000, point estimate: 0.864; sensitivity: CI: 0.714–1.000, point estimate: 0.914; DN2-sorted samples = balanced accuracy: CI: 0.910–1.000, point estimate: 0.957; specificity: CI: 0.820–1.000, point estimate: 0.915; sensitivity: CI: 1.000–1.000, point estimate: 1.000).
Table 1.
Top 10 features most frequently selected for each population
| Population | Probe ID | Gene symbol | Times selected (of 10) | log2FCa | FDRb |
|---|---|---|---|---|---|
| DN2c | A_51_P289392 | Naip1 | 10 | 1.59 | 1.61E-06 |
| A_51_P140710 | Sox14 | 10 | 1.55 | 3.38E-02 | |
| A_51_P295996 | Ccl3 | 3 | 1.49 | 1.34E-01 | |
| A_55_P2083368 | Gm2044 | 3 | 1.34 | 1.12E-05 | |
| A_52_P641132 | Klra15 | 2 | 1.34 | 1.61E-06 | |
| A_52_P496726 | Cntn4 | 1 | 1.20 | 8.51E-02 | |
| A_55_P2013893 | Samd13 | 1 | 1.01 | 2.69E-05 | |
| A_66_P121002 | Mrgpra1 | 1 | 0.98 | 2.83E-01 | |
| A_55_P2151638 | Rasd1 | 1 | 0.83 | 1.55E-01 | |
| Bulk | A_51_P317941 | Perp | 6 | 3.96 | 1.03E-02 |
| A_55_P1982916 | Tspoap1 | 6 | 3.22 | 1.03E-02 | |
| A_51_P249215 | Ptger2 | 4 | 2.00 | 1.29E-02 | |
| A_51_P473498 | Gpr171 | 4 | 1.96 | 1.59E-02 | |
| A_52_P236398 | Tmem108 | 4 | 1.73 | 1.03E-02 | |
| A_52_P51024 | Gna15 | 3 | 1.31 | 1.03E-02 | |
| A_55_P2083988 | Lmo2 | 3 | 1.26 | 4.09E-02 | |
| A_51_P450888 | Rtn4r | 3 | 1.21 | 4.11E-02 | |
| A_52_P279687 | Lrp8 | 3 | 1.16 | 1.04E-02 | |
| A_66_P111660 | Mt1 | 3 | 1.10 | 9.40E-02 |
The log2 fold change (FC) was calculated based on the expression levels between RSF91 and MOCK.
FDR: false discovery rate, calculated by Bonferroni-Holm correction.
DN2: double-negative 2.
Similarly to the standard myeloid SAGA core set, the lymphoid features found in both populations were mainly associated with hematological malignancies (Lmo2,59 Ccl3,60 Gna15,61 Rtn4r,62 Mt1,63 Rasd164), developmental processes (Sox14,65 Perp66), and other types of cancer (Lrp8,67 Ptger2,68 Gpr17169). Strikingly, one of the genes most frequently selected for DN2-sorted samples, Naip1, is also part of the 11 predictors in the myeloid SAGA approach.15 Naip1 is an anti-apoptotic gene, which, to our knowledge, has not yet been directly correlated with oncogenesis.
For further validation, the feature sets were applied to predict all samples in a leave-one-batch-out approach. The DN2-sorted samples, including SIN-LV.LMO2 and SIN-LV.EFS, were reliably predicted in transforming and untransforming (Figure 5A). The same analysis on the bulk cultures using the corresponding selected features also revealed an efficient predictive performance and clear separation on the principal component analysis (PCA) plots (Figure 5B). The high area under the curve (AUC), sensitivity, and specificity values (Figures 5C and 5D) indicated a high predictive power of both models. In contrast, randomly selected markers yielded poor model accuracy and unclear separation between groups, as shown in Figure S2 (panels S2A and S2B for the DN2-sorted samples and panels S2C and S2D for the bulk cultures). To account for the class imbalance in DN2-sorted samples (more transforming than untransforming), the analysis with random markers was repeated without the SIN-LV.LMO2 group (Figures S2E and S2F), yielding similarly low model performance. In contrast, re-analysis of the DN2-sorted samples without SIN-LV.LMO2 using the selected DN2 features did not affect the overall clear separation of classes and good performance of the model (Figures S2G and S2H).
Figure 5.

Gene expression analysis and genotoxicity prediction of lymphoid samples with SAGA-XL
In all PCA plots, the SVM predictions are represented with different shapes (circle = untransforming, triangle = transforming) and the vector designs with color codes (MOCK = gray, SIN-LV.EFS = green, RSF91 = red, SIN_LV.LMO2 = blue). (A) and (B) correspond to the PCA analysis of DN2-sorted samples with DN2 features (A) and bulk samples with the bulk features (B). The ROC curves depicted in (C) and (D) correspond to the prediction of all samples with the leave-one-batch-out approach using the DN2 features on the DN2-sorted samples (C) or the bulk features on bulk samples (C). (E) and (F) show the NES values obtained with SAGA-XL-GSEA for DN2 samples using the DN2 features (E) and for bulk samples using the bulk features (F). The mean NES values are depicted above the graph. Statistical comparison vs. RSF91 is displayed below the mean NES and was performed with Kruskal-Wallis with Dunn’s post-hoc and Bonferroni-Holm correction for multiple testing in (E) and with Mann-Whitney-U in (F). The respective ROC curves for the SAGA-XL-GSEA approach using the selected features are depicted in (G) and (H). (I) SAGA-XL-SVM prediction of bulk samples using DN2 features. (J) SAGA-XL-GSEA prediction of bulk samples using the DN2 features. (K) and (L) Respective ROC curves for (I) and (J). AUC: area under the curve; PC: principal component; NES: normalized enrichment score; GSEA: gene set enrichment analysis; SVM: support vector machine.
Principal component 1 analysis using the bulk features on bulk samples taken at different time points revealed that the immortalization signature induced by RSF91 became more pronounced after at least 20 days in culture, coinciding with the ISA and immunophenotyping clonal tracking results (Figure S3A).
The level of upregulation of the selected features and their relative influence in the separation between the transforming group (RSF91) versus mock is shown in Table 1 and in Figures S3B–S3E. In the DN2 population, the top four most frequently selected predictors (Naip1, Sox14, Ccl3, and Gm2044) seemed to have the most decisive influence on classification. Re-analyses of the DN2-sorted population using only these four features revealed an efficient prediction comparable to the full set (Figures S3F and S3G).
Additionally, the conventional SAGA pipeline evaluates the enrichment of the SAGA core set genes in transduced samples with the gene set enrichment analysis (GSEA) tool. We used the new lymphoid features for GSEA analysis of DN2 and bulk cultures, comparing each transduced sample to the mean of all mock controls. For both populations, the mean normalized enrichment score (NES) for RSF91-transduced samples (>1.00) indicated an enrichment of the lymphoid features and, hence, high mutagenic risk (Figures 5E and 5F). In contrast, SIN-LV.EFS was consistently identified as untransforming (mean NES <1.00), in line with our previous results in the myeloid setting for a similar vector design. The balanced accuracies for the SAGA-XL-GSEA approach (DN2: CI: 0.869–1.000, point estimate: 0.964; sensitivity: CI: 1.000–1.000, point estimate: 1.000; specificity: CI: 0.697–1.000, point estimate: 0.895; bulk: CI: 0.571–1.000, point estimate: 0.838; sensitivity: 0.666–1.000, point estimate: 0.816; specificity: CI: 0.645–1.000, point estimate: 0.885), together with the AUC, sensitivity and specificity values (Figures 5G and 5H) suggested again a high predictive power.
Genotoxicity predictors from DN2-sorted samples can assess mutagenicity in bulk cultures
The bulk cultures are complex samples with different types of cells, including DN1–4, terminally differentiated T cells, and myeloid cells. Arrested samples were characterized by the clonal dominance of the DN2 subpopulation, which showed a distinct gene expression pattern when analyzed by SAGA-XL. We now investigated whether the immortalization signature detected in the DN2-sorted samples could also be used for classification of bulk cultures. The top 10 DN2 features applied on the bulk cultures resulted in a clear distinction between transforming and untransforming groups (Figure 5I) as well as a mean NES of 1.46 for the mutagenic vector RSF91 in SAGA-XL-GSEA and of −0.35 for the safer design SIN-LV.EFS (Figure 5J). Based on the balanced accuracies (SAGA-XL-SVM: CI: 0.722–1.000, point estimate: 0.864; sensitivity: CI: 0.908–1.000, point estimate: 0.968; specificity: CI: 0.510–1.000, point estimate: 0.760; SAGA-XL-GSEA: CI: 0.712–1.000, point estimate: 0.916; sensitivity: CI: 0.425–1.000, point estimate: 0.833; specificity: CI: 1.000–1.000, point estimate: 1.000), AUC, specificity, and sensitivity values (Figures 5K and 5L), the general predictive power of both approaches looked similarly promising. The influence of each of the DN2-selected features on the prediction of bulk cultures and their level of dysregulation are depicted in Figures S3H and S3I.
These results suggest that the immortalization signature of DN2-blocked insertional mutants represents the main difference between the groups as it can be used for the prediction of unsorted bulk cultures.
Assessment of the predictive performance of SAGA-XL on SIN-LV with different mutagenic potential
To test whether SAGA-XL was sensitive enough to identify other mutagenic designs that are not as strong as an LTR-driven gamma retroviral vector, we evaluated an SIN-LV with the internal spleen focus-forming virus (SFFV) promoter driving eGFP expression (Figure S4A). In light of the recent vector-induced MDS cases observed in the current CALD trial,5 we also tested the same vector configuration as in this trial (SIN-LV with an internal viral-derived MND promoter) but with either RAG1 or RAG2 as transgenes (Figure S4A, kindly provided by Frank Staal, Leiden University School of Medicine, Netherlands). Of note, both MND-driven vectors have already been tested in the myeloid IVIM and SAGA assays. Here, SIN-LV.MND.RAG1 scored negative, while SIN-LV.MND.RAG2 consistently gave a positive result, with dominant clones harboring Mecom insertions.
In the lymphoid SAGA-XL assay, no significant differences in the DN2-phenotype were observed for the SIN-LV.MND vectors in comparison to mock or the safer design SIN-LV.EFS. In contrast, one of the SIN-LV.SF-transduced samples developed the DN2 block (Figure S4B). However, no evident proliferation advantage was seen for the three vector constructs (Figures S4C and S4D).
The VCN values for all additional vectors were in range with previously measured samples (Figure S4E). ISA with INSPIIRED revealed the same switch from poly- to oligoclonality described in the previous sections for the other vector types tested. This was illustrated by the reduction in the UIS, UC50 values and Shannon indices, and increased Gini indices (Figures S4F–S4I). While no high-risk insertions and no Lmo2 or Mef2c dysregulation was detected for the MND vectors, the SIN-LV.SF-transduced sample with the differentiation block harbored a dominant Lmo2 integration, coupled to the correspondent mRNA upregulation detected by ddPCR (Figures S5A–S5C). Analysis with SAGA-XL revealed a clear tendency for the SIN-LV.SF and SIN-LV.MND.RAG1 vectors toward transforming potential only when using the DN2 features (both on the DN2-sorted samples and on bulk cultures) as shown by the SVM prediction (Figures S6A–S6C) and the mean NES in SAGA-XL-GSEA above 1 (Figures S6D–S6F). In contrast, SIN-LV.MND.RAG2 was mostly classified as untransforming by both approaches.
To further validate SAGA-XL, all available bulk culture samples, including some mock and RSF91-transduced completely unseen by the pipeline, were classified using the bulk features and the DN2 markers, demonstrating an overall promising performance in both SVM prediction (Figures S7A–S7D) and SAGA-XL-GSEA (Figures S7E–S7H).
Discussion
Insertional mutagenesis is still a major risk factor in retroviral vector-based gene therapy. The safety assays IVIM and SAGA have been used by several research groups and companies to test the genotoxic potential of pre-clinical RV.16,17,18,19,20,70 However, lymphoid insertional mutants cannot be detected under the standard myeloid IVIM/SAGA settings, potentially missing additional safety aspects determined by the lineage involved. In the early X-SCID trials with SAE,3 synergistic effects between the transgene (IL2RG), the oncogenic insertions close to LMO2, and the promoter activity in a lymphoid-deficient context most likely played a critical role in the development of the T-ALL.
Here, we present an in vitro assay to detect retroviral vector-induced lymphoid insertional mutants using mHSPCs as starting population. As a surrogate readout for insertional mutagenesis, we combined phenotypic characteristics evidencing the functional consequences of genotoxicity, i.e., T cell differentiation block at the DN2 stage, with the dysregulation of a specific gene expression signature elicited during lymphoid immortalization. Our approach reproduces in an in vitro assay the frequently observed oncogenic insertions near Lmo2 using a similar starting population as in human gene therapy clinical trials (HSPCs), potentially increasing the predictive value of the results.
The lymphoid safety assay can detect the mutagenic potential of known genotoxic vector configurations (LTR-driven γRV and SIN-LV with a strong internal viral promoter) and distinguish them from safer alternatives currently preferred in the gene therapy field (SIN-LV.EFS). The EFS promoter used in our study is an intronless version of the ubiquitous EF-1 promoter and was coupled to the CBX3 anti-silencing element.71 The original format of the CBX3 element (HNRPA2B1-CBX3) was reported by Knight and colleagues to induce upregulation of a gene neighboring the vector’s insertion site through aberrant splicing and generation of a fusion transcript with the cellular mRNA.72 Even when the splice donor site responsible for this event is not present in the shorter CBX3 element, there is yet no specific information available regarding its safe use in retroviral vector gene transfer. In addition, a study by Rad and colleagues showed the EF-1 promoter is enriched for T cell-specific TF binding sites, leading to increased transgene expression upon T cell differentiation.73 In combination, the presence of the CBX3 element and the potentially higher promoter activity on lymphoid cells might be connected with the clonal selection over time in the SIN-LV.EFS-transduced samples. However, this could also be an inevitable outcome of long-term in vitro cultivation of primary cells rather than a safety concern, considering the normal differentiation pattern of the SIN-LV.EFS-transduced samples and their in general non-mutagenic profile assessed by SAGA-XL, resembling untransduced mock cultures.
Lmo2 and Mef2c mRNAs were highly upregulated only in the samples with the DN2 block (RSF91_IM and SIN-LV.LMO2), even in the absence of the corresponding nearby insertions, suggesting these TFs may be part of a more downstream common immortalization pathway. In line with Zhou’s findings,22 Mef2c expression was slightly altered in the absence of the correspondent insertion. On the contrary, Lmo2 was upregulated in the presence of either Lmo2, Lincred1, or Mef2c dominant insertions, supporting previous work proposing Mef2c as an upstream transactivator of Lmo2.74
To develop the lymphoid SAGA-XL classifier, we analyzed bulk cultures (population conventionally used for myeloid SAGA) and DN2-sorted samples (population evidencing the immortalized phenotype) with the pipeline as described in Schwarzer et al..15 None of the 10 most frequent predictors overlapped between the two populations. This was not surprising, as bulk cultures included different types of cells besides DN2, such as cells from the other DN stages, mature T cells, and myeloid cells. Hence, insertional mutants with diverse malignant lineage potential might be coexisting in arrested bulk samples. It has already been described how myeloid leukemia can originate from leukemic T cell progenitors due to their intrinsic lineage plasticity.75 An important advantage of analyzing bulk cultures is their practicality since long protocols with considerable added stress for the cells are needed for sorting the DN2 subpopulation. When using the DN2 features to classify the bulk cultures, we still obtained an accurate classification, probably because the DN2-blocked cells are the main drivers of the phenotype.
Despite the differences between populations, the predictors found in both cases were generally involved in similar biological and disease processes (embryonic development, maintenance of pluripotency, cancer, and leukemia). SAGA-XL identified Lmo2 as a powerful genotoxicity predictor only for the bulk cultures. Considering Lmo2 is normally expressed in early DN T cell stages and downregulated upon lymphoid maturation,76 its differential expression between unperturbed DN2-sorted T cells and those potentially immortalized by a mutagenic vector might not yield such high predictive power. Similarly, although Mecom is the most common oncogenic target in patients with SAEs affecting the myeloid compartment, it is also not part of the standard myeloid SAGA core set. On the other hand, the marker Naip1, so far not correlated with immortalization, was the most frequently selected predictor in both the myeloid and lymphoid settings. Taken together, our data suggest the algorithm behind SAGA(-XL) might be looking for the activation of early common key perturbances induced by mutagenic vectors, with the potential to develop into a full-scale immortalization phenotype. Importantly, the solution presented here could be improved by increasing sample size. As shown with the re-analysis of DN2-sorted samples using only the top four most frequently selected DN2 features, it would even be possible to further reduce the oncogenic core set, thus facilitating a potential pipeline transfer to simpler technologies such as qPCR.
One of the biggest bottlenecks in gene therapy safety assessment is covering the partially unknown broad spectrum of mutagenicity lying in between untransduced cells and the LTR-driven γRV extreme with a sensitive and reliable enough assay. In that regard, the positive results in all three aspects of the lymphoid assay (phenotype, ISA, and gene expression) for the SIN-LV.SF vector, even when few replicates were analyzed, highlighted the assay’s predictive value. Strikingly, when testing the SIN-LV.MND.RAG1/RAG2 vectors, we obtained different results than in the myeloid branch, where MND.RAG2 was clearly classified as mutagenic and MND.RAG1 scored negative. On the contrary, in the lymphoid setting, MND.RAG1 showed disturbed expression of the DN2 oncogenic signature, though no altered phenotype or high-risk insertion sites were detected. Of note, the Rag1 and Rag2 genes are involved in the T cell receptor recombination, essential to generate functional T cells.77 Synergistic effects between the specific transgene and the expression levels of the viral-derived MND promoter in a defined lineage context might account for the differences in scores between branches and could serve as a practical example of how the lymphoid and myeloid assays might complement each other. The results from both the lymphoid and myeloid IVIM/SAGA assays should be interpreted in probabilistic terms on how likely a specific vector design is to induce genotoxicity. Some aspects that might play a role in the final outcome and could potentially increase the frequency of the mutagenic events, like the disease background, are hard to model in in vitro assays.
The main challenge of this assay is the reproducibility of the lymphoid differentiation. In three out of 13 independent experiments, some untransduced mock cultures developed a block between DN2 and DN3 stages with almost no generation of DP and SP T cells (Figures S8A–S8E). Hence, to validate the phenotypic readout, we set a cutoff of at least 10% DP T cells in untransduced cultures to include the experiment in downstream analysis. Of note, the arrested mock samples did not acquire a proliferation advantage nor downregulated the expression of CD127, underlining the difference between this type of block and that induced by mutagenic vectors. In-depth analysis of one of these experiments with unusual differentiation (ID 200703, Figure S9A) showed that the SAGA-XL assay still worked. We observed the differences regarding proliferation capacity, Lmo2 and Mef2c expression, general insertion site profile, and SAGA-XL prediction between mock, SIN-LV.EFS-, and RSF91-transduced samples, similar to our previous analyses (Figures S9B–S9D). INSPIIRED detected dominant Lmo2 and Lincred1 insertions only for the RSF91-transduced cultures (Figure S9E), and the SAGA-XL-SVM classifier perfectly identified mock, SIN-LV.EFS, and RSF91 in their correspondent groups (Figures S9F and S9G). Lastly, the inclusion of the altered mocks in the untransduced group for SAGA-XL-GSEA analysis did not influence the overall prediction and led to almost identical results as shown before (Figures S9H–S9M). Considering as well that, in general, some of the RSF91-transduced cultures did not develop the DN2 block (RSF91_NIM) but were still identified as mutagenic by the SAGA-XL classifier, our data reaffirm the higher sensitivity and predictive power of the molecular readout compared to only relying on phenotypic characteristics. Similarly, in the myeloid IVIM assay, RSF91 often does not lead to the replating phenotype (surrogate parameter of immortalization in this setting), and mock samples sometimes show spontaneous background proliferation. For both the lymphoid and myeloid SAGA approach, the dysregulation of gene sets linked to immortalization was observed in the absence of the classic flow cytometry-based or replating phenotype. However, a shared limitation in both settings regarding determining the specific transformation mechanism still remains.
Nonetheless, to further improve the reproducibility of the assay, we are currently investigating the relevant sources of variability, such as the feeder cells, the IL-7 cytokine dose and batches, and the purity of the lin-starting population. Alternative feeder cells, like the MS5-DL1 murine stromal cell line78 or feeder-free systems with the Notch ligand provided as immobilized chimeric protein79 or bound to magnetic beads80 might increase the reproducibility. A side-by-side comparison of various lin-batches with different purities could also potentially shed light on the variable differentiation outcomes.
Some aspects of the lymphoid safety assay still need refinement, and more data are necessary to build a more reliable lymphoid SAGA classifier. With more than 15 years in practical use, the myeloid IVIM/SAGA assays are still considerably more robust than the lymphoid counterpart. Nonetheless, our work provides a unique platform for the genotoxicity assessment of RV combining gene expression profiling, ISA, and functional effects, specifically targeted to the lymphoid lineage to complement the current myeloid approach. In the future, the SAGA principle could be expanded to other tissues or, ideally, to human cells and be exploited for risk assessment of other gene therapy techniques such as transposons and gene-editing tools (e.g., CRISPR-Cas9). The further fine-tuning of IVIM/SAGA and the continuous development of improved vector designs will help to generate safer retroviral gene therapies.
Materials and methods
Retroviral vectors, production, and titration
The γRV RSF91 has been described previously.81,82 It contains the SFFV promoter in its LTR (GenBank: AJ224005), a modified woodchuck hepatitis virus post-transcriptional regulatory element (wPRE∗),83 and encodes for the fluorescent protein mCherry. SIN-LV.LMO2 encodes the cDNA of the human LMO2 gene (GenBank: NM_001142315), linked through an internal ribosomal entry sequence (IRES) to the fluorescent protein mCherry, driven by the internal SFFV promoter.25 This vector contains the standard wPRE element. SIN-LV.EFS contains the elongated factor 1α short (EFS) as internal promoter fused to the CBX3 ubiquitous opening chromatin element, the modified wPRE∗, and encodes for a modified version of mCherry (mChEY).84,85 SIN-LV.SF contains SFFV as internal promoter driving eGFP expression.86 The SIN-LV.MND.RAG1/RAG2 vectors stocks were kindly provided by Frank Staal, Leiden University School of Medicine, Netherlands. Transgene expression in these vectors is driven by the viral-derived MND promoter (myeloproliferative sarcoma virus enhancer, negative control region deleted, dl587rev primer binding site substituted promoter).20
All vector stocks were generated by transient transfection of HEK 293T cells with 5 μg of transfer vector, 12 μg of either pcDNA3.HIV-1.GP 4xCTE (LV gag/pol) or pcDNA3.MLV.GP (γRV gag/pol),86 5 μg of pRSV-Rev (only LV, provided by T. Hope, Northwestern University, Chicago, IL, USA), and 2 μg of pMD.G (VSVg envelope),87 using the calcium phosphate precipitation method as described before.82 Viral supernatants were concentrated by ultracentrifugation for 2 h at 82.740 x g (4°C) and stored at −80°C until further use. Titration was performed on HT1080 cells (RSF91, SIN-LV.LMO2) or 32D cells (SIN-LV.EFS) as described before.86,88 Briefly, after transduction with serial dilutions of the concentrated viral supernatant and spinoculation for 1 h at 700 x g, the percentage of cells expressing mCherry was determined by flow cytometry and used to calculate the titer.
Expansion of OP9-DL1 cells and treatment with MMC
OP9-DL1 cells expressing the Notch ligand delta-like 123 were obtained from Andreas Krueger and Juan Carlos Zúñiga-Pflücker and cultivated in freshly reconstituted alpha minimum essential medium (α-MEM + GlutaMAX, no nucleosides, powder; Gibco/Thermo Fisher Scientific, Schwerte, Germany) supplemented with 20% fetal bovine serum (FBS Brazil One; PAN Biotech, Aidenbach, Germany), 100 U/mL penicillin, 100 μg/mL streptomycin (PAN Biotech), and 2.2 g/L of sodium bicarbonate (PAN Biotech, Aidenbach, Germany).
MMC from Streptomyces caespitosus (Sigma-Aldrich/Merck, Munich, Germany) was used to mitotically inactivate the OP9-DL1 cells following a protocol based on the suspension-adhesion method described before.89 Briefly, after 2–4 weeks of expansion, 1.2 × 10⁶ OP9-DL1 cells were seeded per 10-cm dish and incubated for 3 h at 37°C to ensure attachment. MMC was reconstituted following the manufacturer’s instructions and added to each dish in a concentration of 10 μg/mL. The cells were incubated for exactly 2 h at 37°C. After incubation, the medium was discarded, and each dish was washed five times with Dulbecco’s Phosphate-Buffered saline (DPBS; PAN Biotech). The inactivated cells were detached with 1x Trypsin/EDTA (PAN Biotech), pooled together, and frozen in aliquots using 90% FBS and 10% dimethyl sulfoxide (DMSO; Merck, Darmstadt, Germany) for later use in the co-culture experiments.
VCN by ddPCR
For mean VCN determination, genomic DNA (gDNA) was isolated with the QIAamp DNA Blood Mini Kit (Qiagen, Hilden, Germany). VCN was determined on 50 ng of isolated gDNA with a Taqman approach on a QX200 ddPCR system (Bio-Rad, Feldkirchen, Germany) as previously described.90 The number of viral sequences was normalized to the genomic reference sequence of polypyrimidine tract binding protein 2 (Ptbp2). Primer pairs and probes for the wPRE element (viral vector detection; wPRE-forward: 5′-GAGGAGTTGTGGCCCGTTGT-3′; wPRE-reverse: 5′- TGACAGGTGGTGGCAATGCC-3′; wPRE-probe: 5′-FAM-CTGTGTTTGCTGACGCAAC-BHQ1-3′) and for Ptbp2 (PTBP2-forward: 5′-TCTCCATTCCCTATGTTCATGC-3′; PTBP2-reverse: 5′- GTTCCCGCAGAATGGTGAGGTG-3′; PTBP2-probe: 5′-JOE- ATGTTCCTCGGACCAACTTG-BHQ1-3′) were used in a 20-μL qPCR reaction using the ddPCR system and following the manufacturer’s instructions. The amplified products were measured with the QX200 droplet reader, and the concentration of each target per μL and resulting VCN values were determined with the QuantaSoft software (Bio-Rad). The threshold for droplet positivity was manually adjusted in each experiment following the manufacturer’s recommendations, as it was not automatically recognized in some cases.
The sample 190614–8 (Table S1) with 0.184 vector copies was excluded from the final analysis. The number of positive droplets for the reference gene was in the normal range, but very few were generated for the wPRE target, not correlating with the 91.8% of mCherry+ cells detected by flow cytometry for that sample in the previous time point to when the sample for VCN analysis was harvested. The number of cells collected for VCN was lower than the usual minimum of 1.00 × 10⁵, and the DNA amounts and quality obtained after isolation were very low (1.8 ng/μL). This sample was nevertheless used for whole genome amplification (WGA) and later for INSPIIRED analysis, yielding several sequences.
For samples 210527–4, −5, and −6, the percentages of mCherry+ cells on the day the DNA sample was taken were 86.2%, 80.9%, and 87.7%, respectively, not matching with the ultra-low VCN values obtained. For VCN determination, less than 10 ng was used, which might explain the unreliable VCN results. These samples were WGA and used for INSPIIRED. For sample 210527–4, the WGA material yielded only two reads and therefore failed.
For samples 210527–11, −12, and −15, less than 10 ng was used for VCN determination. No fluorescent reporters were included in these constructs for comparison with the VCN values.
ISA reaction of WGA-210527-7 and −11 failed with 0–2 reads being retrieved.
Isolation of lin– bone marrow cells, transduction, and co-culture with OP9-DL1 feeders
Lin– cells were isolated from tibias, femurs, and iliac crests of 8- to 12-week-old female C57BL/6J mice (Janvier Labs, Saint Berthevin, France) and magnetically separated using the lineage cell depletion kit (Miltenyi Biotec, Bergisch Gladbach, Germany) containing lineage-specific antibodies. Before the magnetic separation, two subsequent histopaque (Sigma-Aldrich) gradient centrifugations were performed to enrich for mononuclear cells. The isolated cells were cryopreserved in aliquots using 90% FBS and 10% DMSO.
For each experiment, the lin– cells were thawed and pre-stimulated for 24 h before transduction in StemSpan SFEM (STEMCELL Technologies, Cologne, Germany) supplemented with 100 U/mL penicillin, 100 μg/mL streptomycin, 5 ng/mL human/murine IL-7 (Cytheris S.A., Issy les Moulineaux, France, and PeproTech, Hamburg, Germany), 5 ng/mL hFLT-3L (PeproTech), and the STIF cytokines:26 50 ng/mL mSCF (PeproTech), 20 ng/mL mTPO (PeproTech), 20 ng/mL mIGF2 (R&D Systems, Minneapolis, MN, USA), and 10 ng/mL hFGF1 (PeproTech).
Transduction of 1.00 × 10⁵ lin– cells with the RVs was performed on 10 μg/cm2 RetroNectin-coated (TaKaRa, Otsu, Japan) 24-well plates as described before13 using the same medium as the pre-stimulation step, with an additional 4 μg/mL of protamine sulfate (Sigma-Aldrich). 1 day after transduction, the cells were transferred to a layer of confluent OP9-DL1 MMC-treated cells, seeded the day before, and the medium was changed to α-MEM with 100 U/mL penicillin, 100 μg/mL streptomycin, 20% FBS, 1 ng/mL IL-7, 5 ng/mL mSCF, and 5 ng/mL hFLT-3L (α-MEM complete). The lin– cells were transferred to new layers of OP9-DL1 cells every 3–4 days.23 On each replating, the cells were counted with the CASY cell counter (Roche Innovatis/Schärfe System, Reutlingen, Germany), analyzed by flow cytometry (see below), and cell material was harvested when possible for later DNA and RNA isolation and downstream analysis. Cytospin slides were prepared and stained with May-Grünwald/Giemsa solution at early (days 12–15) and late time points (after day 30). The slides were visualized with the NanoZoomer S210 Digital slide scanner (Hamamatsu, Hamamatsu City, Japan) using 40x objectives. Cell morphology was analyzed with the NDP.view2 software (Hamamatsu).
Flow cytometry and sorting
The cells were first washed with PBS supplemented with 2% FBS and 2 mM EDTA (Invitrogen/Thermo Fisher Scientific) and blocked with TruStain FcX anti-mouse CD16/32 antibody (Biolegend, San Diego, CA, USA). Afterward, staining was performed with the following anti-mouse antibodies: CD44-PE-Cy7 (IM7), CD25-APC (PC61), CD4-FITC (RM4-5), CD8-APC-Cy7 (53–6.7), CD11b-AF700 (M1/70), Ly-6G/Ly-6C -AF700 (Gr-1; RB6-8C5), and CD127-BV785 (A7R34), all from Biolegend (San Diego, CA, USA). Dead cells were stained with 0.2 mg/mL of 4′,6-diamidino-2-phenylindole (DAPI, Sigma-Aldrich). The samples were either measured with the CytoFLEX S (Beckman Coulter, Krefeld, Germany) or sorted for specific subpopulations with the BD FACSAria Fusion cell sorter (BD Biosciences, San Jose, CA, USA). Data analysis was performed using CytExpert (Beckman Coulter) and FlowJo (Tree Star, Ashland, OR) software. Sorted samples were stored in RNAzol B (WAK-Chemie Medical GmbH) at −80°C until isolation.
Insertion site analysis with INSPIIRED
Vector insertion sites were determined using the INSPIIRED (integration site pipeline for paired-end reads) pipeline described before.30,31 Samples with very low gDNA amounts after isolation were first amplified with the WGA REPLI-g mini kit (Qiagen), following the manufacturer’s instructions. For INSPIIRED, between 70 and 1,000 ng of native or WGA amplified gDNA were sonicated using the S220 Focused-ultrasonicator (Covaris, Woburn, MA, USA), purified using AMPure beads in a 0.7-fold ratio, and end-repaired with the NEBNext Ultra II End Repair/dA-Tailing module (New England Biolabs [NEB], Frankfurt, Germany). Previously generated specific linkers were ligated to the end-repaired DNA samples with the NEBNext Ultra II Ligation Module (NEB). After another round of purification using AMPure beads (0.7-fold bead-to-sample ratio), nested PCRs were performed to amplify the vector-genome junctions, adding Illumina adapter sequences and using specific index primers and sample-specific linker primers. The PCR products were visualized on 2% agarose gels, measured by Qubit, and pooled into DNA libraries that were transferred to the research core unit genomics (RCUG) of Hannover Medical School for quality control with a Bioanalyzer device and analysis by Illumina sequencing on flow cells with 1 million clusters. Linker and primer sequences used for PCR reactions are available upon request.
Downstream bioinformatic processing was generally performed as described by Berry and colleagues.30 The analysis files necessary to run the INSPIIRED pipeline were downloaded from GitHub (https://github.com/BushmanLab/INSPIIRED). Demultiplexed sequences in FASTQ format were generated according to the individual index primers used, quality checked, aligned, and annotated to the mouse genome (mm9). The plasmid vector sequences served as a reference for LTR regions and vector trimming. The processing and alignment statistics were exported before uploading the results to a local database. After creating a sample management database, reports with all integration site data were generated and used for customized post-processing in Excel and GraphPad Prism (GraphPad Prism, San Diego, CA, USA). For the analysis of RSF91-transduced samples, a database with background insertions sites originated from ancient RV integrations in the mouse genome was generated by analyzing mock samples in every gamma-run. These background insertions were filtered out from the results of transduced samples. Gini, Shannon, and UC50 values were re-calculated accordingly.
Reverse transcription of RNA and quantification by ddPCR
RNA was isolated using the Direct-zol RNA Mini- or Microkit (Zymo Research, Freiburg, Germany), depending on the number of input cells, and reverse-transcribed with the QuantiTect Reverse Transcription Kit (Qiagen) following the manufacturer’s instructions. Probes and primer pairs targeting Mef2c (Mm.PT.58.9749652), Lmo2 (Mm.PT.58.31113581), and the housekeeping Actb (Mm.PT.39a.22214843.g) were purchased from Integrated DNA Technologies (IDT, Coralville, Iowa, USA) and used in a duplex qPCR reaction for quantification of the cDNA products using the ddPCR device (Bio-Rad) as described before.91 The concentration of each target per μL was analyzed using the QuantaSoft software (Bio-Rad). The threshold for droplet positivity was manually adjusted in each experiment following the manufacturer’s recommendations. The concentrations of Mef2c and Lmo2 for each transduced sample were normalized by the housekeeping and plotted as absolute values in molecules/μL.
Samples excluded from the final analysis due to lack of signal for targets and housekeeping were as follows: 190726–1, 190726–2, 200131–1, 200131–2, 200131–3, 200131–4 (from early time points), and 190906–2, 190906–12 (from late time points). Samples 190614–1, 190614–2, and 190614–7 from late time points were not analyzed due to too low RNA amounts after isolation (<75 ng RNA in total with poor quality measured by Nanodrop). No samples were harvested for the early time point of experiment ID 190614 due to the low number of cells. All sample IDs can be found in Table S1.
Microarray acquisition and processing
Microarrays using the isolated RNA were performed by the RCUG team of Hannover Medical School and as previously described in detail in Schwarzer et al. Briefly, when possible, 100 ng (or less if not available) of total RNA was used to prepare Aminoallyl-UTP-modified (aaUTP) cRNA (Amino Allyl MessageAmp II Kit; Thermo Fisher Scientific), applying one round of amplification as directed by the company, except for a 2-fold downscaling of all reaction volumes. Before the reverse transcription reaction, 1 μL of 1:5,000 dilution of Agilent’s One-Color Spike-in Kit stock solution (Agilent Technologies) was added to the total RNA used for each sample. The labeling of aaUTP-cRNA was performed with Alexa Fluor 555 Reactive Dye (Thermo Fisher Scientific) following the manufacturer’s instructions with the Amino Allyl MessageAmp II Kit (2-fold downscaled reaction volumes). Afterward, cRNA fragmentation, hybridization, and washing steps were carried out as recommended in “One-Color Microarray-Based Gene Expression Analysis Protocol V5.7,” except that 500 ng of each fluorescently labeled cRNA population was used for hybridization. Slides were scanned using the Agilent Micro Array Scanner G2565CA (pixel resolution 3 μm, bit depth 20). Data extraction was performed with the “FeatureExtraction Software V10.7.3.1” using the extraction protocol file “GE1_107_Sep09.xml.”
SAGA-XL analysis and SAGA-XL-GSEA
The adaptation of features for the lymphoid conditions was performed on datasets from bulk and DN2-sorted populations. Both datasets were 10 times stratified in training (70%) and validation (30%) sets, randomized by mock and RSF91 (DN2: MOCK = 13, RSF91 = 16; bulk: MOCK = 16, RSF91 = 20). Validation sets were not used in feature selection or parameter tuning. Training sets were normalized and batch corrected (DN2 population: 6 batches; bulk: 7 batches)92,93 with Combat as described in Schwarzer et al..15 An unsupervised filter was applied as the first feature reduction step, followed by RFE on an SVM with radial kernel. Cross-validation was conducted to assess model performance during feature selection and nested cross-validation for hyperparameter tuning.94,95 In a final step, the generated features were used to train an SVM with radial kernel to predict the validation sets, which were first normalized and add-on batch corrected. For further analysis, the statistics resulting from the 10 splits were bundled. The frequency of the selected features during the 10 splits was determined for each population.
To analyze the performance of the feature sets, a leave-one-batch-out approach was used. The predictions were used to determine overall specificity and sensitivity. Receiver operating characteristic (ROC) curves for the predictions with their according AUC were generated.96 In both populations, the SIN-LV.EFS-transduced samples (DN2 = 5; bulk = 12) were added for prediction and visualization by PCA. Only for the DN2 analysis, the SIN.LV-LMO2-transduced samples (n = 12) were also incorporated for prediction and visualization by PCA. Additionally, the top 10 features found in the DN2 population were used to predict all the bulk samples.
For visualization of the classification, PCAs were performed, and the data were plotted in the first two principal components.97 All calculations were performed in R 4.0.5 on a server running in Ubuntu 20.04.3.98
For SAGA-XL-GSEA, the samples were read in, quantile-normalized, averaged, and log2-transformed within each assay using the R package “limma.”95 The matrix was looped subsetting for mock and the sample that should be analyzed and is contrasted to the mock. The log fold change was pre-sorted in descendant order. A unique value for transduced samples was set based on the filename to test them against the group of all mock samples. The feature sets generated before for bulk and DN2 were defined as the gene sets applied on the comparison between all mock samples of the respective population and single transduced samples. After running the function “fgsea” from the “fgsea” package,99 the samples with NES >1.00 were considered as transforming as defined in the myeloid SAGA assay.15
For further analysis, the bioinformatic script was adapted and run by changing the input needed for investigation of the MND.RAG1 and MND.RAG2 vectors and the material that was excluded during the feature search process.
Statistical analysis and preparation of figures
Statistical analysis was performed with GraphPad Prism 6 and with R 4.0.5 on a server running in Ubuntu 20.04.3. Data were presented as mean ± SD unless specified. Statistical significance was determined with Kruskal-Wallis using Dunn’s post hoc and Bonferroni-Holm correction for all cases with three or more groups or otherwise Mann-Whitney-U. The test used was indicated in the figure captions. ∗p < 0.05; ∗∗p < 0.01; ∗∗∗p < 0.001; ∗∗∗∗p < 0.0001; ns = not significant. All figures were designed using the Inkscape software (https://inkscape.org/) and GraphPad Prism 6/9.
Data and code availability
All data associated with this paper can be found in the main text. RAW and processed expression data from all experiments have been deposited in gene expression omnibus under the GEO accession GSE241160.
Acknowledgments
This work was funded by the Federal State of Lower Saxony under the “R2N - Reduce and Replace in Lower Saxony” consortium (grant agreement 74ZN1574), by the German Research Foundation, Germany (REBIRTH Center for Translational Regenerative Medicine through the State of Lower Saxony, MWK: ZN3440; SFB738). This project has received funding from the European Union’s Horizon 2020 research and innovation programme under grant agreement n° 755170 (RECOMB).
We are grateful to the RCUG (Research Core Unit Genomics) team at Hannover Medical School for their valuable support with the sequencing of DNA libraries and microarray acquisition. We thank Ekaterina Takmakova (Institute of Experimental Hematology, Hannover Medical School) for providing the eGFP version of the SIN-LV.LMO2 vector. We thank Frank Staal (Leiden University School of Medicine, Netherlands) for providing the RAG1/RAG2 constructs. We are grateful to Matthias Ballmaier of the Cell Sorting Core Facility of the Hannover Medical School for performing the sortings.
Author contributions
A.L.B., V.D., F.M., J.F., O.D.-B., D.S. and M.R. acquired the data. A.L.B., A.Schambach and M.R. designed the experiments and analyzed and interpreted the data. A.Schwarzer and E.A.-D. performed bioinformatic analysis. A.L.B., M.R., and P.J.-N. performed bioinformatic analysis and wrote the manuscript. A.Schambach supervised the study and revised the manuscript. All authors reviewed the paper.
Part of this work used data collected and text generated within the framework of a PhD thesis at the Institute of Experimental Hematology, Hannover Medical School, under the supervision of A.Schambach and M.R.
Declaration of interests
The authors declare no competing interests.
Footnotes
Supplemental information can be found online at https://doi.org/10.1016/j.omtm.2023.08.017.
Supplemental information
References
- 1.Morgan R.A., Gray D., Lomova A., Kohn D.B. Hematopoietic Stem Cell Gene Therapy: Progress and Lessons Learned. Cell Stem Cell. 2017;21:574–590. doi: 10.1016/j.stem.2017.10.010. [DOI] [PMC free article] [PubMed] [Google Scholar]
- 2.Braun C.J., Boztug K., Paruzynski A., Witzel M., Schwarzer A., Rothe M., Modlich U., Beier R., Göhring G., Steinemann D., et al. Gene therapy for Wiskott-Aldrich syndrome--long-term efficacy and genotoxicity. Sci. Transl. Med. 2014;6:227ra33. doi: 10.1126/scitranslmed.3007280. [DOI] [PubMed] [Google Scholar]
- 3.Hacein-Bey-Abina S., Garrigue A., Wang G.P., Soulier J., Lim A., Morillon E., Clappier E., Caccavelli L., Delabesse E., Beldjord K., et al. Insertional oncogenesis in 4 patients after retrovirus-mediated gene therapy of SCID-X1. J. Clin. Invest. 2008;118:3132–3142. doi: 10.1172/JCI35700. [DOI] [PMC free article] [PubMed] [Google Scholar]
- 4.Stein S., Ott M.G., Schultze-Strasser S., Jauch A., Burwinkel B., Kinner A., Schmidt M., Krämer A., Schwäble J., Glimm H., et al. Genomic instability and myelodysplasia with monosomy 7 consequent to EVI1 activation after gene therapy for chronic granulomatous disease. Nat. Med. 2010;16:198–204. doi: 10.1038/nm.2088. [DOI] [PubMed] [Google Scholar]
- 5.Cellular, tissue, and gene therapies advisory committee June 9-10, 2022 meeting announcement. 2022. https://www.fda.gov/advisory-committees/advisory-committee-calendar/cellular-tissue-and-gene-therapies-advisory-committee-june-9-10-2022-meeting-announcement-06092022#event-materials
- 6.Orchard Therapeutics. Orchard Statement on Strimvelis®, a Gammaretroviral Vector-Based Gene Therapy for ADA-SCID. 2020. [Google Scholar]
- 7.Strimvelis® (Autologous CD34+ Enriched Cell Fraction that Contains CD34+ Cells Transduced with Retroviral Vector that Encodes for the Human Adenosine Deaminase [ADA] cDNA Sequence): First Case of Lymphoid T Cell Leukaemia after Insertional Oncogenesis. 2021. [Google Scholar]
- 8.Zychlinski D., Schambach A., Modlich U., Maetzig T., Meyer J., Grassman E., Mishra A., Baum C. Physiological Promoters Reduce the Genotoxic Risk of Integrating Gene Vectors. Mol. Ther. 2008;16:718–725. doi: 10.1038/mt.2008.5. [DOI] [PubMed] [Google Scholar]
- 9.Schambach A., Zychlinski D., Ehrnstroem B., Baum C. Biosafety Features of Lentiviral Vectors. Hum. Gene Ther. 2013;24:132–142. doi: 10.1089/hum.2012.229. [DOI] [PMC free article] [PubMed] [Google Scholar]
- 10.Staphorst L., Holland M., Pretorius L., Pretorius M.W., Quiroz D., Naldini L., Trono D., Staphorst L., Holland M., Pretorius L., et al. Self-Inactivating Lentivirus Vector for Safe and Efficient In Vivo Gene Delivery ROMAIN. J. Virol. 2017;29:26–44. doi: 10.1080/10429247.2016.1278140. [DOI] [Google Scholar]
- 11.Business Wire Bluebird Bio Announces FDA Priority Review of Biologics License Application for Eli-Cel Gene Therapy for Cerebral Adrenoleukodystrophy (CALD) in Patients without a Matched Sibling Donor - Bluebird Bio, Inc. 2021. https://investor.bluebirdbio.com/news-releases/news-release-details/bluebird-bio-announces-fda-priority-review-biologics-license-0
- 12.Montini E., Cesana D., Schmidt M., Sanvito F., Ponzoni M., Bartholomae C., Sergi Sergi L., Benedicenti F., Ambrosi A., Di Serio C., et al. Hematopoietic stem cell gene transfer in a tumor-prone mouse model uncovers low genotoxicity of lentiviral vector integration. Nat. Biotechnol. 2006;24:687–696. doi: 10.1038/nbt1216. [DOI] [PubMed] [Google Scholar]
- 13.Modlich U., Bohne J., Schmidt M., Von Kalle C., Knöss S., Schambach A., Baum C. Cell-culture assays reveal the importance of retroviral vector design for insertional genotoxicity. Blood. 2006;108:2545–2553. doi: 10.1182/blood-2005-08-024976. [DOI] [PMC free article] [PubMed] [Google Scholar]
- 14.Modlich U., Navarro S., Zychlinski D., Maetzig T., Knoess S., Brugman M.H., Schambach A., Charrier S., Galy A., Thrasher A.J., et al. Insertional transformation of hematopoietic cells by self-inactivating lentiviral and gammaretroviral vectors. Mol. Ther. 2009;17:1919–1928. doi: 10.1038/mt.2009.179. [DOI] [PMC free article] [PubMed] [Google Scholar]
- 15.Schwarzer A., Talbot S.R., Selich A., Morgan M., Schott J.W., Dittrich-Breiholz O., Bastone A.L., Weigel B., Ha T.C., Dziadek V., et al. Predicting genotoxicity of viral vectors for stem cell gene therapy using gene expression-based machine learning. Mol. Ther. 2021;29:3383–3397. doi: 10.1016/j.ymthe.2021.06.017. [DOI] [PMC free article] [PubMed] [Google Scholar]
- 16.Punwani D., Kawahara M., Yu J., Sanford U., Roy S., Patel K., Carbonaro D.A., Karlen A.D., Khan S., Cornetta K., et al. Lentivirus Mediated Correction of Artemis-Deficient Severe Combined Immunodeficiency. Hum. Gene Ther. 2017;28:112–124. doi: 10.1089/hum.2016.064. [DOI] [PMC free article] [PubMed] [Google Scholar]
- 17.Huang J., Khan A., Au B.C., Barber D.L., López-Vásquez L., Prokopishyn N.L., Boutin M., Rothe M., Rip J.W., Abaoui M., et al. Lentivector Iterations and Pre-Clinical Scale-Up/Toxicity Testing: Targeting Mobilized CD34+ Cells for Correction of Fabry Disease. Mol. Ther. Methods Clin. Dev. 2017;5:241–258. doi: 10.1016/J.OMTM.2017.05.003. [DOI] [PMC free article] [PubMed] [Google Scholar]
- 18.Negre O., Bartholomae C., Beuzard Y., Cavazzana M., Christiansen L., Courne C., Deichmann A., Denaro M., de Dreuzy E., Finer M., et al. Preclinical Evaluation of Efficacy and Safety of an Improved Lentiviral Vector for the Treatment of β-Thalassemia and Sickle Cell Disease. Curr. Gene Ther. 2015;15:64–81. doi: 10.2174/1566523214666141127095336. [DOI] [PMC free article] [PubMed] [Google Scholar]
- 19.Wolstein O., Boyd M., Millington M., Impey H., Boyer J., Howe A., Delebecque F., Cornetta K., Rothe M., Baum C., et al. Preclinical safety and efficacy of an anti–HIV-1 lentiviral vector containing a short hairpin RNA to CCR5 and the C46 fusion inhibitor. Mol. Ther. Methods Clin. Dev. 2014;1:11. doi: 10.1038/MTM.2013.11. [DOI] [PMC free article] [PubMed] [Google Scholar]
- 20.Garcia-Perez L., van Eggermond M., van Roon L., Vloemans S.A., Cordes M., Schambach A., Rothe M., Berghuis D., Lagresle-Peyrou C., et al. Successful Preclinical Development of Gene Therapy for Recombinase-Activating Gene-1-Deficient SCID. Mol. Ther. Methods Clin. Dev. 2020;17:666–682. doi: 10.1016/J.OMTM.2020.03.016. [DOI] [PMC free article] [PubMed] [Google Scholar]
- 21.Poletti V., Charrier S., Corre G., Gjata B., Vignaud A., Zhang F., Rothe M., Schambach A., Gaspar H.B., Thrasher A.J., Mavilio F. Preclinical Development of a Lentiviral Vector for Gene Therapy of X-Linked Severe Combined Immunodeficiency. Mol. Ther. Methods Clin. Dev. 2018;9:257–269. doi: 10.1016/j.omtm.2018.03.002. [DOI] [PMC free article] [PubMed] [Google Scholar]
- 22.Zhou S., Fatima S., Ma Z., Wang Y.-D., Lu T., Janke L.J., Du Y., Sorrentino B.P. Evaluating the Safety of Retroviral Vectors Based on Insertional Oncogene Activation and Blocked Differentiation in Cultured Thymocytes. Mol. Ther. 2016;24:1090–1099. doi: 10.1038/mt.2016.55. [DOI] [PMC free article] [PubMed] [Google Scholar]
- 23.Holmes R., Zúñiga-Pflücker J.C., Zuniga-Pflucker J.C. The OP9-DL1 System: Generation of T-Lymphocytes from Embryonic or Hematopoietic Stem Cells In Vitro. Cold Spring Harb. Protoc. 2009;2009 doi: 10.1101/pdb.prot5156. pdb.prot5156. [DOI] [PubMed] [Google Scholar]
- 24.Ceredig R., Rolink T. A positive look at double-negative thymocytes. Nat. Rev. Immunol. 2002;2:888–897. doi: 10.1038/nri937. [DOI] [PubMed] [Google Scholar]
- 25.Koniaeva E., Stahlhut M., Lange L., Sauer M.G., Kustikova O.S., Schambach A. Conditional Immortalization of Lymphoid Progenitors via Tetracycline-Regulated LMO2 Expression. Hum. Gene Ther. 2020;31:183–198. doi: 10.1089/hum.2019.212. [DOI] [PubMed] [Google Scholar]
- 26.Maetzig T., Brugman M.H., Bartels S., Heinz N., Kustikova O.S., Modlich U., Li Z., Galla M., Schiedlmeier B., Schambach A., Baum C. Polyclonal fluctuation of lentiviral vector-transduced and expanded murine hematopoietic stem cells. Blood. 2011;117:3053–3064. doi: 10.1182/blood-2010-08-303222. [DOI] [PubMed] [Google Scholar]
- 27.Wang H., Pierce L.J., Spangrude G.J. Distinct roles of IL-7 and stem cell factor in the OP9-DL1 T-cell differentiation culture system. Exp. Hematol. 2006;34:1730–1740. doi: 10.1016/j.exphem.2006.08.001. [DOI] [PMC free article] [PubMed] [Google Scholar]
- 28.Six E.M., Benjelloun F., Garrigue A., Bonhomme D., Morillon E., Rouiller J., Cacavelli L., Blondeau J., Beldjord K., Hacein-Bey-Abina S., et al. Cytokines and culture medium have a major impact on human in vitro T-cell differentiation. Blood Cells Mol. Dis. 2011;47:72–78. doi: 10.1016/j.bcmd.2011.04.001. [DOI] [PubMed] [Google Scholar]
- 29.Carrette F., Surh C.D. IL-7 signaling and CD127 receptor regulation in the control of T cell homeostasis. Semin. Immunol. 2012;24:209–217. doi: 10.1016/j.smim.2012.04.010. [DOI] [PMC free article] [PubMed] [Google Scholar]
- 30.Berry C.C., Nobles C., Six E., Wu Y., Malani N., Sherman E., Dryga A., Everett J.K., Male F., Bailey A., et al. INSPIIRED: Quantification and Visualization Tools for Analyzing Integration Site Distributions. Mol. Ther. Methods Clin. Dev. 2017;4:17–26. doi: 10.1016/j.omtm.2016.11.003. [DOI] [PMC free article] [PubMed] [Google Scholar]
- 31.Sherman E., Nobles C., Berry C.C., Six E., Wu Y., Dryga A., Malani N., Male F., Reddy S., Bailey A., et al. INSPIIRED: A Pipeline for Quantitative Analysis of Sites of New DNA Integration in Cellular Genomes. Mol. Ther. Methods Clin. Dev. 2017;4:39–49. doi: 10.1016/j.omtm.2016.11.002. [DOI] [PMC free article] [PubMed] [Google Scholar]
- 32.Mitchell R.S., Beitzel B.F., Schroder A.R.W., Shinn P., Chen H., Berry C.C., Ecker J.R., Bushman F.D. Retroviral DNA Integration: ASLV, HIV, and MLV Show Distinct Target Site Preferences. PLoS Biol. 2004;2:e234. doi: 10.1371/JOURNAL.PBIO.0020234. [DOI] [PMC free article] [PubMed] [Google Scholar]
- 33.Thai M., Ting P.Y., McLaughlin J., Cheng D., Müschen M., Witte O.N., Colicelli J. ABL fusion oncogene transformation and inhibitor sensitivity are mediated by the cellular regulator RIN1. Leukemia. 2011;25:290–300. doi: 10.1038/leu.2010.268. [DOI] [PMC free article] [PubMed] [Google Scholar]
- 34.Capala M.E., Vellenga E., Schuringa J.J. ELMO1 is upregulated in AML CD34+ stem/progenitor cells, mediates chemotaxis and predicts poor prognosis in normal karyotype AML. PLoS One. 2014;9:e111568. doi: 10.1371/journal.pone.0111568. [DOI] [PMC free article] [PubMed] [Google Scholar]
- 35.He X., Li W., Liang X., Zhu X., Zhang L., Huang Y., Yu T., Li S., Chen Z. IGF2BP2 overexpression indicates poor survival in patients with acute myelocytic leukemia. Cell. Physiol. Biochem. 2018;51:1945–1956. doi: 10.1159/000495719. [DOI] [PubMed] [Google Scholar]
- 36.Shirvaikar N., Jalili A., Mirza I., Ilnitsky S., Korol C., Larratt L.M., Turner A.R., Janowska-Wieczorek A. MMP-14 Mediates Migration of Acute Myelogenous Leukemia Cells. Blood. 2008;112:2943. doi: 10.1182/blood.v112.11.2943.2943. [DOI] [Google Scholar]
- 37.Rosales-Avoa J.A., Torres-Flores J., Aguilar-Lemarroy A., Gurrola-Díaz C., Hernández-Flores G., Ortiz-Lazareno P.C., Lerma-Díaz J.M., De Celis R., González-Ramella Ó., Barrera-Chaires E., et al. MEIS1, PREP1, and PBX4 are differentially expressed in acute lymphoblastic leukemia: Association of MEIS1 expression with higher proliferation and chemotherapy resistance. J. Exp. Clin. Cancer Res. 2011;30:1–12. doi: 10.1186/1756-9966-30-112. [DOI] [PMC free article] [PubMed] [Google Scholar]
- 38.Wang Y.-H., Yao C.-Y., Lin C.-C., Gurashi K., Amaral F., Jerez A., Somervaille T.C., Hou H.-A., Chou W.-C., Batta K., et al. A Three Gene Leukemic Stem Cell Signature Score Is Robustly Prognostic in Chronic Myelomonocytic Leukemia. Blood. 2022;140:1104–1105. doi: 10.1182/BLOOD-2022-165449. [DOI] [PubMed] [Google Scholar]
- 39.Zhong P.Q., Zhong L., Yao J.J., Liu D.D., Yuan Z., Liu J.M., Chen M., Yao S.F., Zhao Y., Liu L., et al. ACTL6A interacts with p53 in acute promyelocytic leukemia cell lines to affect differentiation via the Sox2/Notch1 signaling pathway. Cell. Signal. 2019;53:390–399. doi: 10.1016/J.CELLSIG.2018.11.009. [DOI] [PubMed] [Google Scholar]
- 40.Fan H., Lu J., Guo Y., Li D., Zhang Z.M., Tsai Y.H., Pi W.C., Ahn J.H., Gong W., Xiang Y., et al. BAHCC1 binds H3K27me3 via a conserved BAH module to mediate gene silencing and oncogenesis. Nat. Genet. 2020;52:1384–1396. doi: 10.1038/s41588-020-00729-3. [DOI] [PMC free article] [PubMed] [Google Scholar]
- 41.Nakahara F., Sakata-Yanagimoto M., Komeno Y., Kato N., Uchida T., Haraguchi K., Kumano K., Harada Y., Harada H., Kitaura J., et al. Hes1 immortalizes committed progenitors and plays a role in blast crisis transition in chronic myelogenous leukemia. Blood. 2010;115:2872–2881. doi: 10.1182/BLOOD-2009-05-222836. [DOI] [PubMed] [Google Scholar]
- 42.Zhang F., Zhu J., Li J., Zhu F., Zhang P. IRF2-INPP4B axis participates in the development of acute myeloid leukemia by regulating cell growth and survival. Gene. 2017;627:9–14. doi: 10.1016/J.GENE.2017.06.001. [DOI] [PubMed] [Google Scholar]
- 43.Huang S., Zhang B., Fan W., Zhao Q., Yang L., Xin W., Fu D. Identification of prognostic genes in the acute myeloid leukemia microenvironment. Aging (Albany NY) 2019;11:10557–10580. doi: 10.18632/AGING.102477. [DOI] [PMC free article] [PubMed] [Google Scholar]
- 44.Chen M., Zhu N., Liu X., Laurent B., Tang Z., Eng R., Shi Y., Armstrong S.A., Roeder R.G. JMJD1C is required for the survival of acute myeloid leukemia by functioning as a coactivator for key transcription factors. Genes Dev. 2015;29:2123–2139. doi: 10.1101/GAD.267278.115. [DOI] [PMC free article] [PubMed] [Google Scholar]
- 45.Medyouf H., Gusscott S., Wang H., Tseng J.-C., Wai C., Nemirovsky O., Trumpp A., Pflumio F., Carboni J., Gottardis M., et al. High-level IGF1R expression is required for leukemia-initiating cell activity in T-ALL and is supported by Notch signaling. J. Exp. Med. 2011;208:1809–1822. doi: 10.1084/jem.20110121. [DOI] [PMC free article] [PubMed] [Google Scholar]
- 46.Cosgun K.N., Robinson M.E., Deb G., Yang X., Xiao G., Sadras T., Lee J., Chan L.N., Kume K., Mangolini M., et al. Lgr5-mediated restraint of β-catenin is essential for B-lymphopoiesis and leukemia-initiation. bioRxiv. 2020 doi: 10.1101/2020.03.12.989277. Preprint at. [DOI] [Google Scholar]
- 47.Fu Y., Yang Y., Wang X., Yin X., Zhou M., Wang S., Yang L., Huang T., Xu M., Chen C. The histone demethylase PHF8 promotes adult acute lymphoblastic leukemia through interaction with the MEK/ERK signaling pathway. Biochem. Biophys. Res. Commun. 2018;496:981–987. doi: 10.1016/j.bbrc.2018.01.049. [DOI] [PubMed] [Google Scholar]
- 48.Hu J., Wang T., Xu J., Wu S., Wang L., Su H., Jiang J., Yue M., Wang J., Wang D., et al. WEE1 inhibition induces glutamine addiction in T-cell acute lymphoblastic leukemia. Haematologica. 2021;106:1816–1827. doi: 10.3324/haematol.2019.231126. [DOI] [PMC free article] [PubMed] [Google Scholar]
- 49.Grossmann V., Kern W., Harbich S., Alpermann T., Jeromin S., Schnittger S., Haferlach C., Haferlach T., Kohlmann A. Prognostic relevance of RUNX1 mutations in T-cell acute lymphoblastic leukemia. Haematologica. 2011;96:1874–1877. doi: 10.3324/haematol.2011.043919. [DOI] [PMC free article] [PubMed] [Google Scholar]
- 50.Goossens S., Wang J., Tremblay C.S., De Medts J., T’sas S., Nguyen T., Saw J., Haigh K., Curtis D.J., Van Vlierberghe P., et al. ZEB2 and LMO2 drive immature T-cell lymphoblastic leukemia via distinct oncogenic mechanisms. Haematologica. 2019;104:1608–1616. doi: 10.3324/HAEMATOL.2018.207837. [DOI] [PMC free article] [PubMed] [Google Scholar]
- 51.Lee N.-H., Park S.-R., Lee J.W., Lim S., Lee S.-H., Nam S., Kim D.Y., Hah S.Y., Hong I.-S., Lee H.-Y. SERPINB2 Is a Novel Indicator of Cancer Stem Cell Tumorigenicity in Multiple Cancer Types. Cancers. 2019;11:499. doi: 10.3390/cancers11040499. [DOI] [PMC free article] [PubMed] [Google Scholar]
- 52.Yang Z.G., Wen R.T., Qi K., Li J., Zheng G.X., Wang Y.F., Hong Y.G., Zhang Y.M. The Neuropilin-1 Ligand, Sema3A, Acts as a Tumor Suppressor in the Pathogenesis of Acute Leukemia. Anat. Rec. 2019;302:1127–1135. doi: 10.1002/AR.24016. [DOI] [PubMed] [Google Scholar]
- 53.Kunchala P., Kuravi S., Jensen R., McGuirk J., Balusu R. When the good go bad: Mutant NPM1 in acute myeloid leukemia. Blood Rev. 2018;32:167–183. doi: 10.1016/J.BLRE.2017.11.001. [DOI] [PubMed] [Google Scholar]
- 54.Chen Y., Sullivan C., Peng C., Shan Y., Hu Y., Li D., Li S. A tumor suppressor function of the Msr1 gene in leukemia stem cells of chronic myeloid leukemia. Blood. 2011;118:390–400. doi: 10.1182/BLOOD-2010-11-316760. [DOI] [PMC free article] [PubMed] [Google Scholar]
- 55.Lindqvist C.M., Nordlund J., Ekman D., Johansson A., Moghadam B.T., Raine A., Övernäs E., Dahlberg J., Wahlberg P., Henriksson N., et al. The Mutational Landscape in Pediatric Acute Lymphoblastic Leukemia Deciphered by Whole Genome Sequencing. Hum. Mutat. 2015;36:118–128. doi: 10.1002/HUMU.22719. [DOI] [PMC free article] [PubMed] [Google Scholar]
- 56.Huang Z., Zhang H., Xing C., Zhang L., Zhu H., Deng Z., Yin L., Dong E., Wang C., Peng H. Identification and validation of CALCRL-associated prognostic genes in acute myeloid leukemia. Gene. 2022;809:146009. doi: 10.1016/J.GENE.2021.146009. [DOI] [PubMed] [Google Scholar]
- 57.Higuchi T., Nakayama T., Arao T., Nishio K., Yoshie O. SOX4 is a direct target gene of FRA-2 and induces expression of HDAC8 in adult T-cell leukemia/lymphoma. Blood. 2013;121:3640–3649. doi: 10.1182/blood-2012-07-441022. [DOI] [PubMed] [Google Scholar]
- 58.Qin H., Wu Q., Cowell J.K., Ren M. FGFR1OP2-FGFR1 induced myeloid leukemia and T-cell lymphoma in a mouse model. Haematologica. 2016;101:e91–e94. doi: 10.3324/haematol.2015.137695. [DOI] [PMC free article] [PubMed] [Google Scholar]
- 59.Smith S., Tripathi R., Goodings C., Cleveland S., Mathias E., Hardaway J.A., Elliott N., Yi Y., Chen X., Downing J., et al. LIM Domain Only-2 ( LMO2 ) Induces T-Cell Leukemia by Two Distinct Pathways. PLoS One. 2014;9:e85883. doi: 10.1371/journal.pone.0085883. [DOI] [PMC free article] [PubMed] [Google Scholar]
- 60.Staversky R.J., Byun D.K., Georger M.A., Zaffuto B.J., Goodman A., Becker M.W., Calvi L.M., Frisch B.J. The Chemokine CCL3 Regulates Myeloid Differentiation and Hematopoietic Stem Cell Numbers. Sci. Rep. 2018;8:14691. doi: 10.1038/s41598-018-32978-y. [DOI] [PMC free article] [PubMed] [Google Scholar]
- 61.de Jonge H.J.M., Woolthuis C.M., Vos A.Z., Mulder A., van den Berg E., Kluin P.M., van der Weide K., de Bont E.S.J.M., Huls G., Vellenga E., Schuringa J.J. Gene expression profiling in the leukemic stem cell-enriched CD34+ fraction identifies target genes that predict prognosis in normal karyotype AML. Leukemia. 2011;25:1825–1833. doi: 10.1038/leu.2011.172. [DOI] [PubMed] [Google Scholar]
- 62.Zhang C., Bai G., Zhu W., Bai D., Bi G. Identification of miRNA-mRNA Network Associated with Acute Myeloid Leukemia Survival. Med. Sci. Mon. Int. Med. J. Exp. Clin. Res. 2017;23:4705–4714. doi: 10.12659/MSM.903989. [DOI] [PMC free article] [PubMed] [Google Scholar]
- 63.Takahashi S. Molecular functions of metallothionein and its role in hematological malignancies. J. Hematol. Oncol. 2012;5:41. doi: 10.1186/1756-8722-5-41. [DOI] [PMC free article] [PubMed] [Google Scholar]
- 64.Wang S., Wang C., Wang W., Hao Q., Liu Y. High RASD1 transcript levels at diagnosis predicted poor survival in adult B-cell acute lymphoblastic leukemia patients. Leuk. Res. 2019;80:26–32. doi: 10.1016/J.LEUKRES.2019.03.005. [DOI] [PubMed] [Google Scholar]
- 65.Li F., Wang T., Tang S. SOX14 promotes proliferation and invasion of cervical cancer cells through Wnt/β-catenin pathway. Int. J. Clin. Exp. Pathol. 2015;8:1698–1704. [PMC free article] [PubMed] [Google Scholar]
- 66.Nowak M., Köster C., Hammerschmidt M. Perp is required for tissue-specific cell survival during zebrafish development. Cell Death Differ. 2005;12:52–64. doi: 10.1038/sj.cdd.4401519. [DOI] [PubMed] [Google Scholar]
- 67.Passarella D., Ciampi S., Di Liberto V., Zuccarini M., Ronci M., Medoro A., Foderà E., Frinchi M., Mignogna D., Russo C., Porcile C. Low-Density Lipoprotein Receptor-Related Protein 8 at the Crossroad between Cancer and Neurodegeneration. Int. J. Mol. Sci. 2022;23:8921. doi: 10.3390/IJMS23168921. [DOI] [PMC free article] [PubMed] [Google Scholar]
- 68.Baba Y., Nosho K., Shima K., Goessling W., Chan A.T., Ng K., Chan J.A., Giovannucci E.L., Fuchs C.S., Ogino S. PTGER2 overexpression in colorectal cancer is associated with microsatellite instability, independent of CpG island methylator phenotype. Cancer epidemiology, biomarkers & prevention : a publication of the American Association for Cancer Research, cosponsored by the. Cancer Epidemiol. Biomarkers Prev. 2010;19:822–831. doi: 10.1158/1055-9965.EPI-09-1154. [DOI] [PMC free article] [PubMed] [Google Scholar]
- 69.Dho S.H., Lee K.P., Jeong D., Kim C.J., Chung K.S., Kim J.Y., Park B.C., Park S.S., Kim S.Y., Kwon K.S. GPR171 expression enhances proliferation and metastasis of lung cancer cells. Oncotarget. 2016;7:7856–7865. doi: 10.18632/ONCOTARGET.6856. [DOI] [PMC free article] [PubMed] [Google Scholar]
- 70.Brendel C., Rothe M., Santilli G., Charrier S., Stein S., Kunkel H., Abriss D., Müller-Kuller U., Gaspar B., Modlich U., et al. Non-Clinical Efficacy and Safety Studies on G1XCGD, a Lentiviral Vector for Ex Vivo Gene Therapy of X-Linked Chronic Granulomatous Disease. Hum. Gene Ther. Clin. Dev. 2018;29:69–79. doi: 10.1089/humc.2017.245. [DOI] [PubMed] [Google Scholar]
- 71.Kunkiel J., Gödecke N., Ackermann M., Hoffmann D., Schambach A., Lachmann N., Wirth D., Moritz T. The CpG-sites of the CBX3 ubiquitous chromatin opening element are critical structural determinants for the anti-silencing function. Sci. Rep. 2017;7:1–13. doi: 10.1038/s41598-017-04212-8. [DOI] [PMC free article] [PubMed] [Google Scholar]
- 72.Knight S., Zhang F., Mueller-Kuller U., Bokhoven M., Gupta A., Broughton T., Sha S., Antoniou M.N., Brendel C., Grez M., et al. Safer, Silencing-Resistant Lentiviral Vectors: Optimization of the Ubiquitous Chromatin-Opening Element through Elimination of Aberrant Splicing. J. Virol. 2012;86:9088–9095. doi: 10.1128/jvi.00485-12. [DOI] [PMC free article] [PubMed] [Google Scholar]
- 73.Rad S M A.H., Poudel A., Tan G.M.Y., McLellan A.D. Promoter choice: Who should drive the CAR in T cells? PLoS One. 2020;15:e0232915. doi: 10.1371/JOURNAL.PONE.0232915. [DOI] [PMC free article] [PubMed] [Google Scholar]
- 74.Homminga I., Pieters R., Langerak A.W., de Rooi J.J., Stubbs A., Verstegen M., Vuerhard M., Buijs-Gladdines J., Kooi C., Klous P., et al. Integrated transcript and genome analyses reveal NKX2-1 and MEF2C as potential oncogenes in T cell acute lymphoblastic leukemia. Cancer Cell. 2011;19:484–497. doi: 10.1016/J.CCR.2011.02.008. [DOI] [PubMed] [Google Scholar]
- 75.Riemke P., Czeh M., Fischer J., Walter C., Ghani S., Zepper M., Agelopoulos K., Lettermann S., Gebhardt M.L., Mah N., et al. Myeloid leukemia with transdifferentiation plasticity developing from T-cell progenitors. EMBO J. 2016;35:2399–2416. doi: 10.15252/embj.201693927. [DOI] [PMC free article] [PubMed] [Google Scholar]
- 76.Grütz G.G., Bucher K., Lavenir I., Larson T., Larson R., Rabbitts T.H. The oncogenic T cell LIM-protein Lmo2 forms part of a DNA-binding complex specifically in immature T cells. EMBO J. 1998;17:4594–4605. doi: 10.1093/EMBOJ/17.16.4594. [DOI] [PMC free article] [PubMed] [Google Scholar]
- 77.Braams M., Pike-Overzet K., Staal F.J.T. The recombinase activating genes: architects of immune diversity during lymphocyte development. Front. Immunol. 2023;14:1210818. doi: 10.3389/FIMMU.2023.1210818. [DOI] [PMC free article] [PubMed] [Google Scholar]
- 78.Seet C.S., He C., Bethune M.T., Li S., Chick B., Gschweng E.H., Zhu Y., Kim K., Kohn D.B., Baltimore D., et al. Generation of mature T cells from human hematopoietic stem/progenitor cells in artificial thymic organoids. Nat. Methods. 2017;14:521–530. doi: 10.1038/NMETH.4237. [DOI] [PMC free article] [PubMed] [Google Scholar]
- 79.Reimann C., Six E., Dal-Cortivo L., Schiavo A., Appourchaux K., Lagresle-Peyrou C., De Chappedelaine C., Ternaux B., Coulombel L., Beldjord K., et al. Human T-Lymphoid Progenitors Generated in a Feeder-Cell-Free Delta-Like-4 Culture System Promote T-Cell Reconstitution in NOD/SCID/cc 2/2 Mice. Stem Cell. 2012;30:1771–1780. doi: 10.1002/stem.1145. [DOI] [PMC free article] [PubMed] [Google Scholar]
- 80.Trotman-Grant A.C., Mohtashami M., De Sousa Casal J., Martinez E.C., Lee D., Teichman S., Brauer P.M., Han J., Anderson M.K., Zúñiga-Pflücker J.C. DL4-μbeads induce T cell lineage differentiation from stem cells in a stromal cell-free system. Nat. Commun. 2021;12:5023. doi: 10.1038/S41467-021-25245-8. [DOI] [PMC free article] [PubMed] [Google Scholar]
- 81.Schambach A., Wodrich H., Hildinger M., Bohne J., Kräusslich H.G., Baum C. Context dependence of different modules for posttranscriptional enhancement of gene expression from retroviral vectors. Mol. Ther. 2000;2:435–445. doi: 10.1006/mthe.2000.0191. [DOI] [PubMed] [Google Scholar]
- 82.Schambach A., Mueller D., Galla M., Verstegen M.M.A., Wagemaker G., Loew R., Baum C., Bohne J. Overcoming promoter competition in packaging cells improves production of self-inactivating retroviral vectors. Gene Ther. 2006;13:1524–1533. doi: 10.1038/sj.gt.3302807. [DOI] [PubMed] [Google Scholar]
- 83.Schambach A., Bohne J., Baum C., Hermann F.G., Egerer L., von Laer D., Giroglou T. Woodchuck hepatitis virus post-transcriptional regulatory element deleted from X protein and promoter sequences enhances retroviral vector titer and expression. Gene Ther. 2006;13:641–645. doi: 10.1038/sj.gt.3302698. [DOI] [PubMed] [Google Scholar]
- 84.Hoffmann D., Schott J.W., Geis F.K., Lange L., Müller F.J., Lenz D., Zychlinski D., Steinemann D., Morgan M., Moritz T., Schambach A. Detailed comparison of retroviral vectors and promoter configurations for stable and high transgene expression in human induced pluripotent stem cells. Gene Ther. 2017;24:298–307. doi: 10.1038/gt.2017.20. [DOI] [PubMed] [Google Scholar]
- 85.Lieske A., Ha T.C., Schambach A., Maetzig T. An Improved Lentiviral Fluorescent Genetic Barcoding Approach Distinguishes Hematopoietic Stem Cell Properties in Multiplexed in Vivo Experiments. Hum. Gene Ther. 2021;32:1280–1294. doi: 10.1089/HUM.2021.042. [DOI] [PubMed] [Google Scholar]
- 86.Schambach A., Bohne J., Chandra S., Will E., Margison G.P., Williams D.A., Baum C. Equal potency of gammaretroviral and lentiviral SIN vectors for expression of O6-methylguanine–DNA methyltransferase in hematopoietic cells. Mol. Ther. 2006;13:391–400. doi: 10.1016/j.ymthe.2005.08.012. [DOI] [PubMed] [Google Scholar]
- 87.Yang Y., Vanin E.F., Whitt M.A., Fornerod M., Zwart R., Schneiderman R.D., Grosveld G., Nienhuis A.W. Inducible, High-Level Production of Infectious Murine Leukemia Retroviral Vector Particles Pseudotyped with Vesicular Stomatitis Virus G Envelope Protein. Hum. Gene Ther. 1995;6:1203–1213. doi: 10.1089/hum.1995.6.9-1203. [DOI] [PubMed] [Google Scholar]
- 88.Kraunus J., Schaumann D.H.S., Meyer J., Modlich U., Fehse B., Brandenburg G., von Laer D., Klump H., Schambach A., Bohne J., Baum C. Self-inactivating retroviral vectors with improved RNA processing. Gene Ther. 2004;11:1568–1578. doi: 10.1038/sj.gt.3302309. [DOI] [PubMed] [Google Scholar]
- 89.Li P., Wang S., Zhan L., He X., Chi G., Lv S., Xu Z., Xia Y., Teng S., Li L., Li Y. Efficient feeder cells preparation system for large-scale preparation and application of induced pluripotent stem cells. Sci. Rep. 2017;7:12266. doi: 10.1038/s41598-017-10428-5. [DOI] [PMC free article] [PubMed] [Google Scholar]
- 90.Lin H.T., Okumura T., Yatsuda Y., Ito S., Nakauchi H., Otsu M., Nakauchi H., Lin H.-T.T., Okumura T., Yatsuda Y., et al. Application of Droplet Digital PCR for Estimating Vector Copy Number States in Stem Cell Gene Therapy. Hum. Gene Ther. Methods. 2016;27:197–208. doi: 10.1089/hgtb.2016.059. [DOI] [PMC free article] [PubMed] [Google Scholar]
- 91.Dodd D.W., Gagnon K.T., Corey D.R. Digital quantitation of potential therapeutic target RNAs. Nucleic Acid Therapeut. 2013;23:188–194. doi: 10.1089/nat.2013.0427. [DOI] [PMC free article] [PubMed] [Google Scholar]
- 92.Parker H.S., Bravo H.C., Leek J.T. Removing batch effects for prediction problems with frozen surrogate variable analysis. PeerJ. 2014;2:e561. doi: 10.7717/peerj.561. [DOI] [PMC free article] [PubMed] [Google Scholar]
- 93.Hornung R., Boulesteix A.L., Causeur D. Combining location-and-scale batch effect adjustment with data cleaning by latent factor adjustment. BMC Bioinf. 2016;17:27. doi: 10.1186/s12859-015-0870-z. [DOI] [PMC free article] [PubMed] [Google Scholar]
- 94.Kuhn M. Building Predictive Models in R Using the caret Package. J. Stat. Software. 2008;28 doi: 10.18637/jss.v028.i05. [DOI] [Google Scholar]
- 95.Ritchie M.E., Phipson B., Wu D., Hu Y., Law C.W., Shi W., Smyth G.K. Limma powers differential expression analyses for RNA-sequencing and microarray studies. Nucleic Acids Res. 2015;43:e47. doi: 10.1093/nar/gkv007. [DOI] [PMC free article] [PubMed] [Google Scholar]
- 96.Robin X., Turck N., Hainard A., Tiberti N., Lisacek F., Sanchez J.C., Müller M. pROC: An open-source package for R and S+ to analyze and compare ROC curves. BMC Bioinf. 2011;12:77–78. doi: 10.1186/1471-2105-12-77. [DOI] [PMC free article] [PubMed] [Google Scholar]
- 97.Tang Y., Horikoshi M., Li W. ggfortify: Unified Interface to Visualize Statistical Results of Popular R Packages. The R Journal. 2016;8:474. doi: 10.32614/RJ-2016-060. [DOI] [Google Scholar]
- 98.R Core Team . R Foundation for Statistical Computing; 2018. R: A Language and Environment for Statistical Computing.https://www.R-project.org/ [Google Scholar]
- 99.Korotkevich G., Sukhov V., Budin N., Shpak B., Artyomov M.N., Sergushichev A. Fast gene set enrichment analysis. bioRxiv. 2021 doi: 10.1101/060012. Preprint at. [DOI] [Google Scholar]
Associated Data
This section collects any data citations, data availability statements, or supplementary materials included in this article.
Supplementary Materials
Data Availability Statement
All data associated with this paper can be found in the main text. RAW and processed expression data from all experiments have been deposited in gene expression omnibus under the GEO accession GSE241160.