

Abstract
Objective:
To assess marked central canal T2-hyperintensity in patients with myelin-oligodendrocyte glycoprotein antibody-associated disease (MOGAD) myelitis compared to myelitis patients with aquaporin-4-antibody-positive neuromyelitis optica spectrum disorder (AQP4+NMOSD) and multiple sclerosis (MS).
Material/Methods:
Two blinded raters evaluated spinal cord magnetic resonance imaging (MRIs) of myelitis patients with MOGAD (n=63), AQP4+NMOSD (n =37), and MS (n=26), assessing for marked central canal T2-hyperintensity and its evolution. If there were conflicting results, a third neurologist assessed the MRI.
Results:
Marked central canal T2-hyperintensity was more frequent in patients with MOGAD (18/63[29%]) than MS (1/26[4%]; p=0.01) myelitis but did not differ from AQP4+NMOSD (13/37[35%]; p=0.49). Marked central canal T2-hyperintensity was reduced or completely resolved on followup axial MRI for most MOGAD (12/14[86%]) and AQP4+NMOSD (10/10[100%]; p = 0.49) patients.
Conclusions:
Marked central canal T2-hyperintensity is a common transient radiologic accompaniment of MOGAD and AQP4+NMOSD myelitis, but not MS myelitis.
Keywords: MOG, neuromyelitis optica spectrum disorder, multiple sclerosis, central canal, bright spotty
1. Introduction
Myelin oligodendrocyte glycoprotein antibody-associated disease (MOGAD) is a subtype of the central nervous system inflammatory demyelinating diseases, distinct from aquaporin-4 antibody-positive neuromyelitis optica spectrum disorder (AQP4+NMOSD) and multiple sclerosis (MS). The diagnosis of MOGAD requires a core clinical demyelinating event, positive MOG-IgG testing, supportive clinical or MRI features, and reasonable exclusion of alternative diagnoses [1]. A sagittal T2-hyperintense line, accompanied by axial T2-signal restricted to the spinal cord gray matter, forming an H-sign, has been recognized during MOGAD myelitis attacks and occurs at higher frequency than in myelitis from AQP4+NMOSD or MS [2]. Pseudo-dilation of the ependymal canal, causing brighter T2-signal in the region of the central canal, has also been recognized in cases of MOGAD [3], but detailed studies of this are lacking. Herein, we assess the frequency of marked central canal T2-hyperintensity in patients with MOGAD myelitis and compare this to AQP4+NMOSD and MS myelitis.
2. Material and methods
MOGAD patients were retrospectively identified from the Mayo Clinic Neuroimmunology Laboratory from 1/1/1996 to 12/31/2021. Inclusion criteria were: 1) clinical myelitis episode; 2) MOG-IgG seropositivity by live cell-based assay; 3) available magnetic resonance imaging (MRI) of the cervical/thoracic spine with an acute T2-hyperintense lesion within 4 weeks of myelitis symptom onset; 4) absence of a more likely alternative diagnosis. Thirty-seven AQP4+NMOSD myelitis and 26 MS myelitis patients with available imaging of sufficient quality within 4 weeks of myelitis symptom onset from a prior study were included as comparison groups [2]. Marked central canal T2-hyperintensity was defined as T2-hyperintensity with similar consistency to cerebrospinal fluid (CSF) within a myelitis T2-lesion. A neuroradiologist (K.K.) and a neurologist (L.C.) blinded to the diagnosis recorded the presence of marked central canal T2-hyperintensity and evolution of the marked central canal T2-hyperintensity on follow-up MRI. A third, blinded neurologist reviewer (E.P.F) assessed MRIs with conflicting assessments of marked central canal T2-hyperintensity. Clinical data on weakness, numbness/paresthesias, neurogenic bowel/bladder, and ambulation at myelitis nadir were obtained from the medical record for all patients. We compared those patients in all three disease groups with and without marked central canal T2-hyperintensity. The expanded disability status scale (EDSS) score was retrospectively calculated from the medical records to quantify disability at nadir. We also reviewed brain MRIs for brain and/or optic nerve lesions concurrent with myelitis.
The statistical analysis was performed with BlueSky statistics version 7.40 (BlueSky Statistics, LLC, Chicago, IL, USA). Based on the data distribution, between-group comparison of quantitative variables was performed with non-parametric Kruskal-Wallis test, while categorical variables were compared with Pearson’s Chi-squared test or Fisher’s exact test, as appropriate.
2.1. Standard protocol approvals, registrations, and patient consents
The study was approved by Mayo Clinic’s Institutional Review Board. All participants consented to use of their medical records for research.
2.2. Data availability
Anonymized data from this study will be made available upon request.
3. Results
We included 126 patients with acute myelitis (MOGAD n=63, AQP4+NMOSD n=37, and MS n=26). Marked central canal T2-hyperintensity was observed frequently in MOGAD (Figure 1) and AQP4+NMOSD (Figure 2) but was very rare in MS (Table 1). There was no difference in the frequency of marked central canal T2-hyperintensity on axial imaging in MOGAD (18/63[29%]) versus AQP4+NMOSD (13/37[35%]; p=0.49). A corresponding central canal T1-hypointensity was more frequent in patients with AQP4+NMOSD myelitis (6/13[46%]) compared to MOGAD (2/18[11%]; p=0.04). The single MS myelitis patient with marked central canal T2-hyperintensity did not have a corresponding T1-hypointensity. Most cases of marked central canal T2-hyperintensity resolved on follow-up axial MRI for MOGAD patients (12/14[86%]; Figure 1C) and AQP4+NMOSD patients (10/10[100%]; p=0.49).
Figure 1.

MRI examples of marked central canal T2-hyperintensity in MOGAD. Three representative cases of MOGAD patients with linear T2-hyperintensities and surrounding T2-hyperintensities on sagittal imaging (A1, B1, C1, arrows), axial H-sign of T2-hyperintensity restricted to grey matter (A2, B2), and marked central canal T2-hyperintensity on axial views (A2, B2, C2, arrowheads). Resolution of the linear T2-hyperintensity is shown in C3. There was also resolution of the marked central canal T2-hyperintensity and grey matter-restricted T2-signal (C4) on follow-up axial MRI sixteen months later.
Figure 2.
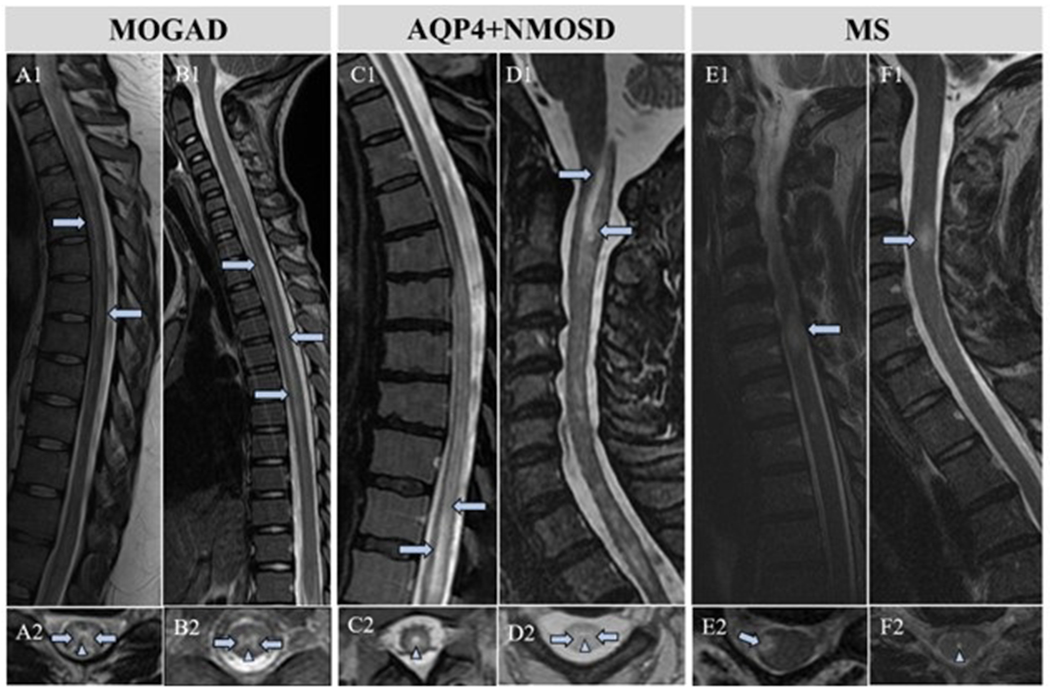
MRI comparison of marked central canal T2-hyperintensity in MOGAD, AQP4+NMOSD, and MS myelitis. MOGAD patients with characteristic linear T2-hyperintensities on sagittal MRI (A1, B1, arrows) with marked central canal T2-hyperintensity (A2, B2, arrowheads). Longitudinally extensive T2-hyperintense signal changes in AQP4+NMOSD patients (C1, D1, arrows) with marked central canal T2-hyperintensities (C2, D2, arrowheads). Classic MS lesion (E1, arrow) without marked central canal T2-hyperintensity (E2, arrow). MS patient in our study with a typical demyelinating spinal cord lesion (F1) and the only MS patient with a marked central canal T2-hyperintensity (F2, arrowhead).
Table 1.
Patient demographics and clinical and radiologic findings. Unless otherwise specified, p values were calculated with Kruskal-Wallis test (quantitative variables) or Pearson’s Chi squared test (qualitative variables).
| MOGAD n = 63 |
AQP4+ NMOSD n = 37 |
MS n = 26 |
P-value | MOGAD vs. MS P-value |
MOGAD vs. AQP4+NMOSD P-value |
|
|---|---|---|---|---|---|---|
| Demographics/Clinical data | ||||||
| Sex, female (%) | 30 (48) | 32 (87) | 20 (77) | < 0.001 | 0.01 | < 0.001 |
| Median age at attack onset, years (range) | 27 (4-74) | 52 (17-77) | 39 (19-59) | < 0.001 | 0.01 | < 0.001 |
| Children, <18 years (%) | 18 (29) | 1 (3) | 0 (0) | <0.001 a | 0.001 a | 0.001 a |
| Ethnicity, Caucasian (%) | 55 (87) | 24 (65) | 26 (100) | < 0.001 | 0.06 | 0.008 |
| Median EDSS at nadir (range) | 6 (0-8) n = 62 |
6 (2-8.5) n = 33 |
2 (2-6) n = 24 |
<0.001 | <0.001 | 0.48 |
| Radiologic findings | ||||||
| Marked central canal T2-hyperintensity | 18/63 (29) | 13/37 (35) | 1/26 (4) | 0.007 a | 0.01 a | 0.493 |
| Median number of days from myelitis symptom onset to spinal cord MRI (range) | 10 (1-24) n =44 |
8 (1-28) n = 25 |
17.5 (3-28) n = 18 |
0.05 | 0.015 | 0.84 |
Fisher’s exact test.
n= denotes the denominator as some patients did not have sufficient documentation to provide all data
Forty-two of the MOGAD myelitis patients (42/63[67%]) had a T2-hyperintense line on sagittal cervical and/or thoracic MRI. Only seventeen of these patients had corresponding axial marked central canal T2-hyperintensity (17/42[41%]). Conversely, seventeen of the 18 patients with axial marked central canal T2-hyperintensity also had a T2-hyperintense line on sagittal MRI (17/18[94%]). Forty-three of 61 MOGAD patients with available brain MRI [71%] had concurrent radiologic brain lesions and 17/61 [28%] had radiologic evidence of optic neuritis.
The most frequent symptoms of MOGAD myelitis patients included weakness (55/63[87%]), urinary retention/incontinence (50/63[79%]), numbness/paresthesias (48/63[76%]), and stool incontinence/constipation (36/63[57%]). At their myelitis nadir, 32/63 [51%] required a urinary catheter and 22/63 [35%] required a wheelchair. The median EDSS score at nadir for 62 MOGAD patients was 6 (range: 0-8).
MOG-IgG titers were available for 43 patients with a median of 1:100 (range, 1:20 – 1:100,000). There was no significant difference in median MOG-IgG titer in patients with (1:100 [range, 1:20-1:10,000]) and (1:100 [range, 1:20-1:100,000]) without marked central canal T2-hyperintensity (p =0.59). There was no significant difference in the proportion of MOGAD myelitis patients who had a high MOG-IgG titer (defined ≥1:100) in MOGAD patients with marked central canal T2-hyperintensity (9/13 [69%]) versus those without the radiologic sign (22/30 [73%], p = 0.78).
Comparisons of the clinical characteristics of MOGAD, AQP4+NMOSD, and MS myelitis patients with and without marked central canal T2-hyperintensity revealed that AQP4+NMOSD myelitis patients with marked central canal T2-hyperintensity were more likely to require a wheelchair at myelitis nadir compared to those without the radiologic finding (p=0.02) (Table 2).
Table 2.
Clinical characteristics of myelitis patients with and without marked central canal T2-hyperintensity. Unless otherwise specified, p values were calculated with Kruskal-Wallis test (quantitative variables) or Pearson’s Chi squared test (qualitative variables).
| MOGAD patients with marked cental canal T2-hyperintensity n = 18 |
MOGAD patients without marked central canal T2-hyperintensity n = 45 |
P-value (MOGAD) | AQP4+NMOSD patients with marked central canal T2-hyperintensity n = 13 |
AQP4+NMOSD patients without marked central canal T2-hyperintensity n = 24 |
P-value (AQP4+NMOSD) | MS patients with marked central canal T2-hyperintensity n =1 |
MS patients without marked central canal T2-hyperintensity n = 25 |
P-value (MS) | |
|---|---|---|---|---|---|---|---|---|---|
| Sex, female (%) | 8 (44) | 22 (49) | 0.75 | 10 (77) | 22 (92) | 0.32a | 0 (0) | 20 (80) | 0.23a |
| Median age at attack onset, years (range) | 31 (4-56) | 25 (6-74) | 0.68 | 52 (34-77) | 52 (17-72) | 0.54 | 27 | 39 (19-59) | 0.35 |
| Children, <18 years (%) | 3 (17) | 14 (31) | 0.35a | 0 (0) | 1 (4) | 1.00a | 0 (0) | 0 (0) | N/A |
| Ethnicity, Caucasian (%) | 15 (83) | 40 (89) | 0.55 | 9 (69) | 15/22 (68) | 1.00a | 1 (100) | 25 (100) | N/A |
| Median EDSS at nadir (range) | 7 (0-8) | 6 (1-8) | 0.13 | 7 (2-8.5) | 5.5 (2-7.5) | 0.16 | 2.5 | 2 (2-5.5) | 0.75 |
| Weakness | 16 (89) | 39 (87) | 0.81 | 12 (92) | 18/23 (78) | 0.39a | 1 (100) | 9/24 (38) | 0.40a |
| Wheelchair needed at nadir | 7 (39) | 15 (33) | 0.68 | 7 (54) | 3/23 (13) | 0.02 a | 0 (0) | 1 (4) | 1.00a |
| Numbness/paresthesias | 14 (78) | 34 (76) | 0.85 | 13 (100) | 21/23 (91) | 0.53a | 1 (100) | 21 (84) | 1.00a |
| Neurogenic bladder | 16 (89) | 34 (76) | 0.24 | 8 (62) | 12/23 (52) | 0.59 | 0 (0) | 7 (28) | 1.00a |
| Urinary catheter needed at nadir | 8 (44) | 24 (53) | 0.52 | 4 (31) | 2/23 (9) | 0.16a | 0 (0) | 1 (4) | 1.00a |
| Neurogenic bowel | 12 (67) | 24 (53) | 0.33 | 8 (62) | 7/23 (30) | 0.07 | 0 (0) | 2 (8) | 1.00a |
| Optic neuritis symptoms | 7 (39) | 23 (51) | 0.38 | 0 (0) | 0 (0) | N/A | 0 (0) | 2 (8) | 1.00a |
| Median number of days after symptom onset to spinal cord MRI after myelitis symptom onset (range) | 12.5 (2-20) | 7.5 (1-24) | 0.14 | 7 (4-28) | 9 (1-28) | 0.49 | 5 | 23 (3-28) | 0.17 |
| Optic nerve involvement on MRI | 6 (33) | 11/43 (26) | 0.54 | 1/9 (11.1) | 0/15 (0) | 0.38a | 0 (0) | 1/24 (4) | 1.00a |
| Brain involvement on MRI | 12 (67) | 31/43 (72) | 0.67 | 5/10 (50) | 6/17 (35.3) | 0.45 | 1 (100) | 18/24 (75) | 1.00a |
Fisher’s exact test.
4. Discussion
We found that marked central canal T2-hyperintensity is a frequent finding in acute myelitis in MOGAD and AQP4+NMOSD but is rare in MS myelitis. The marked central canal T2-hyperintensity resolved on follow-up MRI in most MOGAD and all AQP4+NMOSD patients, suggesting it is a transient finding related to the acute myelitis. The presence of this radiologic finding in our MOGAD and MS myelitis patients was not associated with a higher frequency of the clinical measures we assessed.
The MS myelitis patients had a lower EDSS than the MOGAD and AQP4+NMOSD patients at nadir, similar to prior reports [2]. The presence of marked central canal T2 hyperintensity did not influence EDSS, although a higher proportion of AQP4+NMOSD patients with this finding required a wheelchair at nadir. The milder severity at nadir in MS may also have contributed to the longer time to the MRI in the MS group, as the lower severity would make them less likely to present early. However, the timing did not influence the presence or absence of the marked central canal T2 hyperintensity across any of the groups.
It is unknown whether this radiologic finding represents true central canal dilation, as current MRI technology is not able to differentiate a normal central canal from one that is slightly dilated from the surrounding gray matter. The marked central canal T2-hyperintensity in the central canal region may represent dilation of the central canal secondary to disruption of normal CSF flow dynamics from the myelitis-associated inflammatory injury to the spinal cord. On the other hand, the marked central canal T2-hyperintensity may also represent a “pseudo-dilation,” the appearance of dilation, secondary to local edema in the gray matter commissure, given the higher gray matter signal elsewhere in the spinal cord. It is possible that a potential space exists in some patients in whom the central canal is not completely obliterated and only becomes visible in the setting of inflammation and swelling. While MOGAD patients were overall younger, and obliteration of the central canal can take until the end of the second decade, 15/18 [82%] with this finding were adults. The transient nature makes it less likely to represent gliosis, necrosis, or cavitation.
This finding of marked central canal T2-hyperintensity is not specific for MOGAD or AQP4+NMOSD and can be seen with a variety of other myelopathy etiologies including tumors (e.g., lymphoma), other inflammatory causes (e.g., sarcoidosis) [4], and vascular etiologies (e.g., infarct). While a dilated central canal is recognized to occur in approximately 1.5% of normal individuals [5], the higher frequency in MOGAD and AQP4+NMOSD myelitis and resolution on follow-up argue against it being a normal variant in these diseases. The marked central canal T2-hyperintensity may be difficult to differentiate from brighter spotty T2-lesions, which are defined as extraordinarily hyperintense spotty lesions on axial T2-weighted imaging at least as high as the surrounding CSF. Brighter spotty T2-lesions have been reported to occur in AQP4+NMOSD but not in MOGAD [6]. The brighter spotty T2-lesions in AQP4+NMOSD tend to be more multifocal (spotty) and larger than merely marked central canal T2-hyperintensity and further studies may need criteria to discriminate these features. Brighter spotty lesions may represent areas of increased intralesional edema or CSF trapping, whereas the marked central canal T2-hyperintensity may result from enlargement of a potential space.
In our study, the marked central canal T2-hyperintense lesions were more frequently accompanied by a corresponding T1-hypointensity in AQP4+NMOSD myelitis than in MOGAD, which may suggest a higher frequency of true central canal dilation in AQP4+NMOSD myelitis.
In MOGAD myelitis, we previously reported a T2-hyperintense sagittal line that was brighter than the surrounding T2-lesion [2]. This line did not always correspond to marked central canal T2-hyperintensity in the region of the central canal in this study, corresponding in only 41% of MOGAD cases. However, most MOGAD myelitis patients with marked central canal T2-hyperintensity also had a corresponding sagittal T2-hyperintense line (17/18[94%]). The T2-hyperintense sagittal line may represent Gibbs truncation artifact that can occur at high contrast interfaces by capturing the horizontal part of the H-sign in the sagittal plane which is brighter relative to its anterior and posterior aspects [7,8]. Thus, the T2-hyperintense sagittal line, whether it is artifact, appears to be separate from the marked central canal T2-hyperintensity we observed.
In summary, our findings suggest that marked central canal T2-hyperintensity is a frequent and usually transient MRI finding accompanying acute MOGAD and AQP4+NMOSD myelitis, and may be useful in differentiating these disorders from MS.
Funding:
This work was supported by the Mayo Clinic Center for Multiple Sclerosis and Autoimmune Neurology and the NIH National Institute of Neurological Disorders and Stroke [R01NS113828].
Financial disclosures:
Dr. Lauren M. Webb (Webb.Lauren@mayo.edu) – reports no disclosures.
Dr. Laura Cacciaguerra (Cacciaguerra.Laura@mayo.edu) – Dr. Cacciaguerra received speaker and consultant honoraria from Biomedia, ACCMED, Roche, BMS Celgene, and Sanofi.
Dr. Karl N. Krecke (Kkrecke@mayo.edu) – reports no disclosures.
Dr. John J. Chen (Chen.John@mayo.edu) – Dr. Chen serves as a consultant to Roche, UCB, and Horizon. Dr. Chen is also a member of the medical advisory board of the MOG project.
Dr. Elia Sechi (EliaSechi87@gmail.com) – reports no disclosures.
Dr. Vyanka Redenbaugh (Redenbaugh.Vyanka@mayo.edu) – reports no disclosures.
Dr. Divyanshu Dubey (Dubey.Divyanshu@mayo.edu) – Dr. Dubey has patents pending for KLHL11-IgG, LUZP4-IgG, and cavin-4-IgG as markers of neurological autoimmunity. He has consulted for UCB, Arialys, Immunovant, Argenx, and Astellas. All compensation for consulting activities is paid directly to Mayo Clinic. Dr. Dubey has received funding from the US Department of Defense (DOD) (CA210208).
Dr. Sean J. Pittock (Pittock.Sean@mayo.edu) – Dr. Pittock reports grants, personal fees and non-financial support from Alexion Pharmaceuticals, Inc.; grants, personal fees, non-financial support and other support from MedImmune, Inc/Viela Bio.; personal fees for consulting from Genentech/Roche. He has a patent, Patent# 8,889,102 (Application#12-678350, Neuromyelitis Optica Autoantibodies as a Marker for Neoplasia) – issued; a patent, Patent# 9,891,219B2 (Application#12-573942, Methods for Treating Neuromyelitis Optica [NMO] by Administration of Eculizumab to an individual that is Aquaporin-4 (AQP4)-IgG Autoantibody positive) – issued.
Dr. Eoin P. Flanagan (Flanagan.Eoin@mayo.edu) – Dr. Flanagan has served on advisory boards for Alexion, Genentech and Horizon Therapeutics. He has received speaker honoraria from Pharmacy Times. He received royalties from UpToDate. Dr. Flanagan was a site primary investigator in a randomized clinical trial on Inebilizumab in neuromyelitis optica spectrum disorder run by Medimmune/Viela-Bio/Horizon Therapeutics. Dr. Flanagan has received funding from the NIH (R01NS113828). Dr. Flanagan is a member of the medical advisory board of the MOG project. Dr. Flanagan is an editorial board member of the Journal of the Neurological Sciences and Neuroimmunology Reports. A patent has been submitted on DACH1-IgG as a biomarker of paraneoplastic autoimmunity.
Abbreviations:
- AQP4+NMOSD
aquaporin-4-antibody-positive neuromyelitis optica spectrum disorder
- CSF
cerebrospinal fluid
- EDSS
expanded disability status scale
- MOGAD
myelin-oligodendrocyte glycoprotein antibody-associated disease
- MRI
magnetic resonance imaging
- MS
multiple sclerosis
References
- [1].Banwell B, Bennett JL, Marignier R, Kim HJ, Brilot F, Flanagan EP, Ramanathan S, Waters P, Tenembaum S, Graves JS, Chitnis T, Brandt AU, Hemingway C, Neuteboom R, Pandit L, Reindl M, Saiz A, Sato DK, Rostasy K, Paul F, Pittock SJ, Fujihara K, Palace J. Diagnosis of myelin oligodendrocyte glycoprotein antibody-associated disease: International MOGAD Panel proposed criteria. Lancet Neurol. 2023. Mar;22(3):268–282. doi: 10.1016/S1474-4422(22)00431-8. Epub 2023 Jan 24. [DOI] [PubMed] [Google Scholar]
- [2].Dubey D, Pittock SJ, Krecke KN, Morris PP, Sechi E, Zalewski NL, Weinshenker BG, Shosha E, Lucchinetti CF, Fryer JP, Lopez-Chiriboga AS, Chen JC, Jitprapaikulsan J, McKeon A, Gadoth A, Keegan BM, Tillema JM, Naddaf E, Patterson MC, Messacar K, Tyler KL, Flanagan EP. Clinical, Radiologic, and Prognostic Features of Myelitis Associated With Myelin Oligodendrocyte Glycoprotein Autoantibody. JAMA Neurol. 2019. Mar 1;76(3):301–309. doi: 10.1001/jamaneurol.2018.4053. [DOI] [PMC free article] [PubMed] [Google Scholar]
- [3].Denève M, Biotti D, Patsoura S, Ferrier M, Meluchova Z, Mahieu L, Heran F, Vignal C, Deschamps R, Gout O, Champfleur NM, Ayrignac X, Dallière CC, Labauge P, Dulau C, Tourdias T, Dumas H, Cognard C, Brassat D, Bonneville F. MRI features of demyelinating disease associated with anti-MOG antibodies in adults. J Neuroradiol. 2019. Sep;46(5):312–318. doi: 10.1016/j.neurad.2019.06.001. Epub 2019 Jun 20. [DOI] [PubMed] [Google Scholar]
- [4].Zalewski NL, Krecke KN, Weinshenker BG, Aksamit AJ, Conway BL, McKeon A, Flanagan EP. Central canal enhancement and the trident sign in spinal cord sarcoidosis. Neurology. 2016. Aug 16;87(7):743–4. doi: 10.1212/WNL.0000000000002992. [DOI] [PubMed] [Google Scholar]
- [5].Petit-Lacour MC, Lasjaunias P, Iffenecker C, Benoudiba F, Hadj Rabia M, Hurth M, Doyon D. Visibility of the central canal on MRI. Neuroradiology. 2000. Oct;42(10):756–61. doi: 10.1007/s002340000373. [DOI] [PubMed] [Google Scholar]
- [6].Hyun JW, Lee HL, Park J, Kim J, Min JH, Kim BJ, Kim SW, Shin HY, Huh SY, Kim W, Seo JW, Kim KH, Kim SH, Kim HJ. Brighter spotty lesions on spinal MRI help differentiate AQP4 antibody-positive NMOSD from MOGAD. Mult Scler. 2022. May;28(6):989–992. doi: 10.1177/13524585211060326. Epub 2021 Dec 6. [DOI] [PubMed] [Google Scholar]
- [7].Czervionke LF, Czervionke JM, Daniels DL, Haughton VM. Characteristic features of MR truncation artifacts. AJR. American Journal of Roentgenology. 1988. Dec;151(6):1219–1228. DOI: 10.2214/ajr.151.6.1219. [DOI] [PubMed] [Google Scholar]
- [8].Phillips C, Bagley B, McDonald MA, Schuster NM. Gibbs or Truncation Artifact on MRI Mimicking Degenerative Cervical Myelopathy. Pain Med. 2022. Apr 8;23(4):857–859. doi: 10.1093/pm/pnab346. [DOI] [PubMed] [Google Scholar]
Associated Data
This section collects any data citations, data availability statements, or supplementary materials included in this article.
Data Availability Statement
Anonymized data from this study will be made available upon request.