

Abstract
Objectives: Prominin 2 (PROM2) gene has been reported as a molecular biomarker of human cancers; however, its role is still controversial. This study was therefore arranged to seek the role of PROM2 in different cancers with Bioinformatics and in vitro analyses. Methods: A combination of bioinformatics and molecular experiments. Results: Through the utilization of Bioinformatics analysis, it was observed that in 19 out of the 24 human cancers studied, there was a significant increase in the expression of PROM2 compared to the respective control samples. Additionally, the overexpression of PROM2 was linked specifically to a decrease in overall survival (OS) among breast cancer (BRCA), lung adenocarcinoma (LUAD), and uterine corpus endometrial carcinoma (UCEC) patients. Furthermore, advanced molecular investigations were conducted, encompassing RNA sequencing (RNA-seq) as well as targeted bisulfite sequencing (bisulfite-seq) assessments of PROM2. These analyses were performed across an array of lung cancer cell lines (A549, ABC-1, EBC-1, and LK-2) and a normal control lung cell line (MRC-9). Results of these analysis revealed overexpression and reduced methylation of PROM2 within lung cancer cell lines, relative to the corresponding control cell line. This suggests that PROM2 assumes a substantial function in the advancement and course of BRCA, LUAD, and UCEC cancers. Subsequent pathway analysis revealed that genes enriched by PROM2 are actively engaged in four pivotal pathways. Additionally, intriguing associations were observed between PROM2 expression, tumor purity, infiltration of CD8+ T immune cells, and genetic modifications. Moreover, we also predicted a few MicroRNAs (miRNAs), transcription factors (TFs), and potential drugs that could help to understand and better manage these cancers via designing appropriate therapies targeting PROM2. Conclusion: Via this study, we effectively revealed PROM2 overexpression as a potential diagnostic and prognostic biomarker of survival in BRCA, LUAD, and UCEC.
Keywords: Human cancer, diagnostic biomarker, prognostic biomarker
Introduction
Cancer is a group of lethal diseases. In 2021, the mortality rate due to cancer was ranked 2nd worldwide after cardiovascular diseases [1,2]. In line with the cancer states of Surveillance, Epidemiology, and End Results Program’s (SEER), as well as Cancer Statistics Review (CSR), the number of cancer cases in the United States of America (USA) alone is 442.7 per 100,000 (for both genders) per year [3].
Cancer is continuously introducing new and difficult challenges to researchers and medical practitioners attempting to find sensitive and reliable health solutions [4,5]. Although current treatment methods increased the cancer prognosis, the five-year survival of various cancer patients remains very low [6-8]. The explanation for this poor prognosis might be the limited number of available treatment options and the lack of effective biomarkers, especially for chemotherapy-resistant patients [9-11]. Therefore, it is important to explore the more effective common diagnostic and prognostic molecular biomarkers to diagnose and monitor the prognosis of cancer patients.
The prominin protein 2 (PROM2) belongs to the pentaspan transmembrane family, mainly enriched at plasma membrane protrusions. The PROM2 along with its other binding partner PROM1 has been known to directly bind with cholesterol to mainly associate with microdomains of the membrane in some types of cells [12,13]. The PROM2 is a rarely studied gene and its dysregulation exploration is previously only limited to epithelial cells [14,15]. However, according to an earlier whole-genome expression profiling-based study, PROM2 was also overexpressed in endothelial cells in lung cancer [16]. Moreover, different other expression profiling-based studies have also explored the PROM2 up-regulation in several other cancers including liver cancer and chromophobe renal cell carcinoma [17-19]. Furthermore, to the best of our understanding, the literature currently lacks comprehensive coverage regarding the dysregulation of PROM2 and its potential diagnostic and prognostic implications across various distinct types of human cancer.
Within this investigation, the evaluation of PROM2 expression and its subsequent associations with various other parameters across diverse cancer types has been undertaken utilizing publicly available databases, as well as in silico experiments. The outcomes of this study have provided novel information regarding PROM2 role in the pathogenesis of cancer. These outcomes are expected to facilitate the development of new anti-cancer approaches.
Materials and methods
UALCAN analysis
In the present work, we utilized the University of ALabama at Birmingham CANcer (UALCAN) web portal to conduct the pan-cancer differential mRNA expression analysis and clinicopathological features-specific expression analysis of PROM2 across multiple human cancer subtypes [20]. UALCAN is a valuable online platform for cancer research, enabling easy exploration of gene expression data across different cancer types. Utilizing TCGA datasets, UALCAN offers interactive analysis tools to assess gene expression, survival outcomes, and correlations with clinical parameters [20]. For statistical purposes, a Student’s t-test was utilized within the UALCAN tool.
Kaplan-Meier (KM) plotter and gene expression profiling interactive analysis based survival analysis
In the present study, we utilized the Kaplan-Meier (KM) Plotter tool to determine the PROM2 clinical significance in cancer patients of distinct subtypes [21]. KM Plotter is a powerful web tool that aids cancer research by assessing the impact of gene expression on patient survival. It utilizes large patient datasets to generate Kaplan-Meier survival curves, revealing associations between gene expression levels and prognosis. In addition, we also utilized Gene Expression Profiling Interactive Analysis (GEPIA) database [22] to validate the results of KM plotter. GEPIA stands as a valuable resource for cancer genomics, offering interactive analysis of RNA sequencing data from thousands of tumors and normal samples. This web tool enables researchers to explore gene expression patterns, perform survival analyses, and compare RNA expression between tumors and healthy tissues, aiding comprehensive cancer research.
GENT2 and GEPIA
Gene Expression database of Normal and Tumor tissues 2 (GENT2) and GEPIA are cancer transcriptomics data analysis webservers [23]. In the current study, we used both these resources for the expression validation of PROM2 using independent cohorts of distinct cancer patients. For statistical purposes, a Student’s t-test was utilized by these tools.
Human Protein Atlas
The Human Protein Atlas (HPA) web port (https:/www.proteinatlas.org/) is an online resource the immunohistochemistry (IHC) based proteomic data obtained from the tissues or cells of the different cancer subtypes [24]. HPA provides a comprehensive view of protein distribution in various tissues and cell types, aiding in the exploration of protein functions and their relevance in health and disease, particularly cancer research. This database was utilized in the current study to validate the PROM2 at the protein level in tissue samples of different cancer subtypes paired with normal control.
MEXPRESS
MEXPRESS was developed to visualize The Cancer Genome Atlas (TCGA) expression data and identify the correlation between promoter methylation and expression level [25]. Offering an intuitive interface, it facilitates the exploration of multi-dimensional data across various tumors, aiding researchers in identifying potential biomarkers, unraveling molecular mechanisms, and gaining insights into the complex landscape of cancer biology. In this investigation, the relationship between PROM2 transcriptional expression and the levels of promoter methylation in different cancer subtypes was evaluated using the mentioned tool, employing Pearson correlation analysis. For statistical purposes, a Student’s t-test was utilized by MEXPRESS.
cBioportal analysis
cBioPortal, a repository of cancer multi-omics data [26] was applied in the present study to investigate the PROM2-associated genetic alterations and copy number variations (CNVs) in distinct cancer subtypes. cBioPortal is a pivotal platform that empowers cancer genomics research. It offers a user-friendly interface for exploring complex genomic data from numerous cancer studies. Researchers can analyze genetic alterations, mRNA expression, and clinical data, aiding the identification of potential drivers of cancer and facilitating the discovery of novel therapeutic targets through comprehensive visualization tools and interactive features.
Protein interactions and enrichment analysis
The Search Tool for the Retrieval of Interacting Genes/Proteins (STRING) web port is a universal repository for analyzing and reviewing the protein-protein interactions between the genes of interest [27]. Researchers can explore physical and functional interactions, predict protein partners, and unravel complex cellular processes. STRING aids in understanding biological pathways, protein functions, and disease mechanisms, serving as a cornerstone for advancing molecular research and drug discovery efforts. In this current research, we employed this tool to establish the protein-protein interaction (PPI) network for the gene dataset enriched with PROM2. Additionally, the resultant PPI network was visualized using Cytoscape, and subsequent pathway analysis of the genes within the PPI network was conducted utilizing DAVID [28]. DAVID assists in unraveling the biological significance of gene lists by offering comprehensive annotation, enrichment analysis, and visualization tools. Researchers can gain insights into gene functions, pathways, and cellular processes, aiding in the interpretation of high-throughput data. For statistical purposes, a Student’s t-test was utilized by DAVID.
Tumor purity and immune analysis
In the present study, the Tumor Immune Estimation Resource (TIMER) web port (https://cistrome.shinyapps.io/timer/) [29] was utilized to investigate the Spearman correlation between Tumor purity, CD8+ T immune cells infiltration, and PROM2 expression in different cancers. The TIMER database is a critical tool for understanding the immune contexture of various cancers. It enables the assessment of immune infiltration in tumor tissues through gene expression data. Researchers can explore the abundance of different immune cell types and their potential impact on patient prognosis. For statistical purposes, a Student’s t-test was utilized by TIMER.
Enrichr database analysis
Enrichr [30] is used to explore different enrichment terms such as KEGG (Kyoto Encyclopedia of Genes and Genomes), Gene Ontology (GO), gene-specific TFs, and miRNAs. Enrichr allows researchers to explore gene set enrichment analysis against an extensive collection of databases and resources. Enrichr facilitates the identification of enriched terms, pathways, and functional annotations, aiding in the interpretation of high-throughput data. In the current study, we utilized Enrichr to explore the PROM2-targeted miRNAs and TFs. The top ten significantly (P < 0.05) enriched items were displayed using Enrichr.
Drug analysis
PROM2 is believed to hold potential as a viable therapeutic target. As a result, the Comparative Toxicogenomics Database (CTD) [31] was included in the current investigation to create a gene-drug interaction network for identifying some chemotherapeutic drugs that can change the expression of PROM2. CTD is a pivotal resource for understanding the intricate interactions between chemicals, genes, and diseases. By integrating curated data from various sources, CTD offers insights into the molecular mechanisms of toxicology and disease development. Researchers can explore associations between chemicals and genes, aiding in the identification of potential hazards and understanding the underlying biological pathways.
RNA sequencing and targeted bisulfite sequencing analyses-based in vitro validation of PROM2 expression and methylation status
A total of 4 lung cancer cell lines, including A549, ABC-1, EBC-1, LK-2, and one normal control lung cell line (MRC-9) were purchased from the ATCC (American Type Culture Collection). The purchased cell lines were cultured in DMEM (HyClone), supplemented with 10% fetal bovine serum (FBS; TBD), 1% glutamine, and 1% penicillin-streptomycin in 5% CO2 at 37°C. Total RNA extraction from all these three cell lines was done using TRIzol® reagent method [32], while total DNA was extracted via organic method [33]. Finally, RNA and DNA samples were sent to Beijing Genomics Institute (BGI) Company for RNA sequencing (RNA-seq) and targeted bisulfite sequencing (bisulfite-seq) analyses.
After RNA-seq analysis, the gene expression values of the PROM2 were normalized using reads per kilo base million reads (RPKM) and fragments per kilo base million reads (FPKM). While methylation values were normalized as beta values. The obtained FPKM and beta values against hub genes in lung cancer and normal control cell line were compared to identify differences in the expression and methylation levels.
Results
PROM2 expression profiling
We conducted an analysis of PROM2 gene transcription expression levels across 24 distinct human cancer samples, each paired with its corresponding normal controls, utilizing Pan-cancer analysis. A Pan-cancer view graph in Figure 1 visually depicts the PROM2 median expression in cancers and normal controls. The transcription level of PROM2 was found noticeably higher in 19 major types of human cancer tissues relative to the paired controls including breast cancer (BRCA), lung adenocarcinoma (LUAD), and uterine corpus endometrial carcinoma (UCEC). However, the lower expression of PROM2 was also observed in 5 different other kinds of human cancers (Figure 1).
Figure 1.
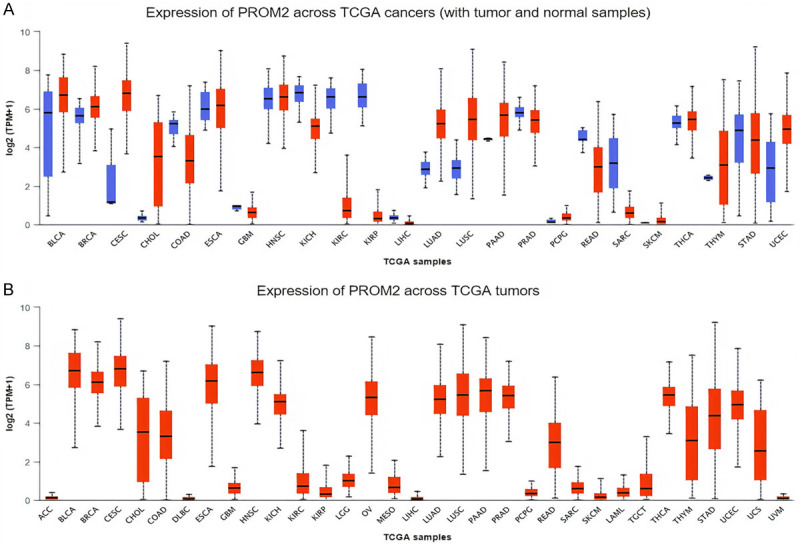
The pattern of PROM2 expression in 24 cancer tissues integrated with normal tissues via UALCAN. (A) Across 24 cancer tissues, and (B) Across 24 cancer tissues relative to controls. P-value < 0.05 = significant. PROM2 = Prominin 2, TCGA = The Cancer Genome Atlas, UALCAN = University of ALabama at Birmingham CANcer.
PROM2 prognostic potential
The KM analysis has helped us to evaluate the association between PROM2 transcription expression and OS in all 24 types of human cancers based on TCGA datasets. Results of the analysis showed that higher PROM2 expression levels predicted significantly (P < 0.05) poor prognosis in BRCA, LUAD, and UCEC patients (Figure 2A). In Addition, we further validated the findings of the KM plotter via GEPIA using new independent cohorts. Results of this cross-validation were consistent with the KM plotter results (Figure 2B). Collectively, these findings indicated a potential substantial involvement of PROM2 in the advancement and evolution of BRCA, LUAD, and UCEC. Consequently, the subsequent phase of our investigation will be primarily centered on delineating the distinct role of PROM2 in these specific cancer types.
Figure 2.

UALCAN and GEPIA based OS analysis of the PROM2 across BRCA, LUAD, and UCEC. (A) UALCAN based OS analysis, and (B) GEPIA based OS analysis. P-value < 0.05 = significant. UALCAN = University of ALabama at Birmingham CANcer, GEPIA = Gene Expression Profiling Interactive Analysis, OS = Overall survival, PROM2 = Prominin 2, BRCA = Breast cancer, LUAD = Lung adenocarcinoma, UCEC = Uterine corpus endometrial carcinoma.
PROM2 correlated with clinical variables
Next, using UALCAN, we evaluated the status of PROM2 expression in BRCA, LUAD, and UCEC patients of different clinicopathological variables i.e. stratified by cancer stage, patient age, patient race, and TP53 mutational status. Our results revealed that PROM2 was also significantly (P < 0.05) overexpressed in BRCA, LUAD, and UCEC patients relative to controls after stratifying by cancer stage, patient age, patient race, and TP53 mutational status (Figure 3). A clinicopathological distribution of the BRCA, LUAD, and UCEC cohort is given in Tables 1, 2 and 3.
Figure 3.

Different clinicopathological features specific expression analysis of the PROM2 in BRCA, LUAD and UCEC. (A) Individual cancer stage, patient’s age, patient’s race, and TP53 mutational status specific expression analysis of PROM2 across BRCA samples, (B) Individual cancer stage, patient’s age, patient’s race, and TP53 mutational status specific expression analysis of PROM2 across LUAD samples, and (C) Individual cancer stage, patient’s age, patient’s race, and TP53 mutational status specific expression analysis of PROM2 across UCEC samples. P-value < 0.05 = significant. PROM2 = Prominin 2, BRCA = Breast cancer, LUAD = Lung adenocarcinoma, UCEC = Uterine corpus endometrial carcinoma.
Table 1.
Clinical variables-wise categorization of the BRCA cohort analyzed via UALCAN
| Sr. No | Clinical variable | Samples count per variable | Total samples count | Sample count having missing details | Final sample count subjected to analysis |
|---|---|---|---|---|---|
| 1 | Cancer stage | ||||
| Stage 1 | n, 183 | n, 32 | n, 1065 | ||
| Stage 2 | n, 615 | ||||
| Stage 3 | n, 247 | ||||
| Stage 4 | n, 20 | ||||
| 2 | Age | ||||
| years = 21-40 | n, 97 | n, 1097 | n, 10 | n, 1087 | |
| years = 41-60 | n, 505 | ||||
| years = 61-80 | n, 431 | ||||
| years = 81-100 | n, 54 | ||||
| 3 | Geographical distribution | ||||
| Caucasian | n, 748 | n, 109 | n, 988 | ||
| African-American | n, 179 | ||||
| Asian | n, 61 | ||||
| 4 | TP53 mutation status | ||||
| TP53-Mutatnt | n, 334 | n, 65 | n, 1032 | ||
| TP53-NonMutant | n, 698 |
BRCA = Breast Cancer, UALCAN = University of ALabama at Birmingham CANcer.
Table 2.
Clinical variables-wise categorization of the LUAD cohort analyzed via UALCAN
| Sr. No | Clinical variable | Samples count per variable | Total samples count | Sample count having missing details | Final sample count subjected to analysis |
|---|---|---|---|---|---|
| 1 | Cancer stage | ||||
| Stage 1 | n, 277 | n, 0 | n, 515 | ||
| Stage 2 | n, 125 | ||||
| Stage 3 | n, 85 | ||||
| Stage 4 | n, 28 | ||||
| 2 | Age | ||||
| years = 21-40 | n, 12 | n, 515 | n, 232 | n, 283 | |
| years = 41-60 | n, 90 | ||||
| years = 61-80 | n, 149 | ||||
| years = 81-100 | n, 32 | ||||
| 3 | Geographical distribution | ||||
| Caucasian | n, 387 | n, 73 | n, 442 | ||
| African-American | n, 51 | ||||
| Asian | n, 8 | ||||
| 4 | TP53 mutation status | ||||
| TP53-Mutatnt | n, 233 | n, 3 | n, 512 | ||
| TP53-NonMutant | n, 279 |
LUAD = Lung adenocarcinoma, UALCAN = University of ALabama at Birmingham CANcer.
Table 3.
Clinical variables-wise categorization of the UCEC cohort analyzed via UALCAN
| Sr. No | Clinical variable | Samples count per variable | Total samples count | Sample count having missing details | Final sample count subjected to analysis |
|---|---|---|---|---|---|
| 1 | Cancer stage | ||||
| Stage 1 | n, 341 | n, 0 | n, 546 | ||
| Stage 2 | n, 52 | ||||
| Stage 3 | n, 124 | ||||
| Stage 4 | n, 29 | ||||
| 2 | Age | ||||
| years = 21-40 | n, 18 | n, 546 | n, 2 | n, 544 | |
| years = 41-60 | n, 189 | ||||
| years = 61-80 | n, 292 | ||||
| years = 81-100 | n, 45 | ||||
| 3 | Geographical distribution | ||||
| Caucasian | n, 374 | n, 45 | n, 501 | ||
| African-American | n, 107 | ||||
| Asian | n, 20 | ||||
| 4 | TP53 mutation status | ||||
| TP53-Mutatnt | n, 196 | n, 4 | n, 541 | ||
| TP53-NonMutant | n, 345 |
UCEC = Uterine corpus endometrial carcinoma, UALCAN = University of ALabama at Birmingham CANcer.
PROM2 overexpression validation
To corroborate the elevated expression of PROM2 in BRCA, LUAD, and UCEC, we conducted an additional analysis using GENT2 and GEPIA on a new independent cohort of samples, including BRCA, LUAD, UCEC, and normal controls. Our findings, consistent with UALCAN, further underscored the noteworthy (P < 0.05) up-regulation of PROM2 in BRCA, LUAD, and UCEC samples when compared to their respective controls (Figure 4).
Figure 4.
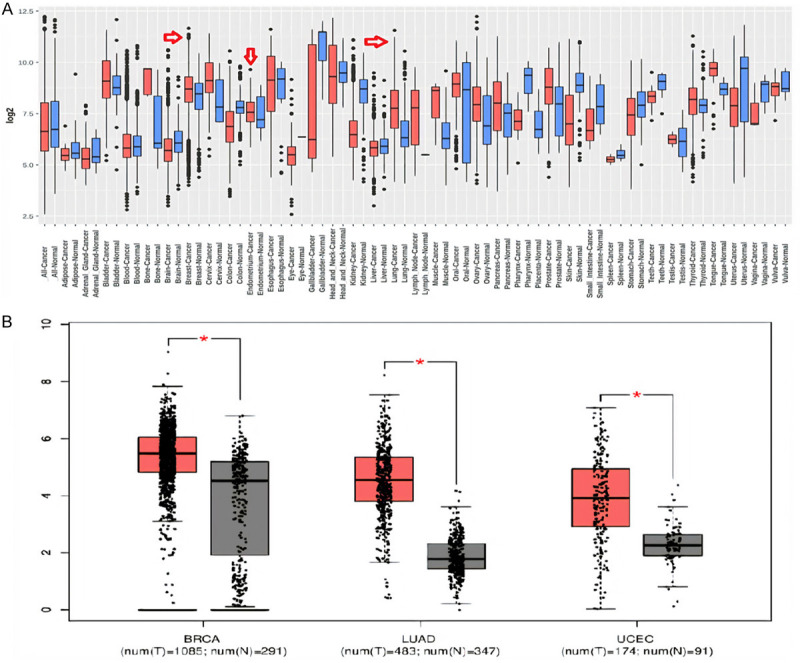
Transcription expression level validation of PROM2 via GENT2 and GEPIA database. (A) Via GENT2, and (B) Via GEPIA. P-value < 0.05 = significant. PROM2 = Prominin 2, GEPIA = Gene Expression Profiling Interactive Analysis, GENT2 = Gene Expression database of Normal and Tumor tissues 2.
Protein expression level validation of PROM2
In addition, we also validated the PROM2 translation expression in breast, lung, and endometrial cancers tissues relative to controls using the HPA database and in view of our results, PROM2 low expression was found in normal breast and endometrial tissues while it is not detected in normal lung tissues. However, relative to normal controls, PROM2 protein was found overexpressed (high) in breast, lung, and endometrial cancerous tissues (Figure 5).
Figure 5.

Translation expression of PROM2 across breast, lung, and endometrial cancers, and normal controls taken from Human Protein Atlas (HPA) database (×200). (A) Across breast cancer, (B) Across lung cancer, and (C) Across endometrial cancer.
Promoter methylation of PROM2
To explore the influence of promoter methylation on PROM2 expression, we conducted an investigation of PROM2 promoter methylation patterns in BRCA, LUAD, and UCEC utilizing the MEXPRESS resource. The findings revealed a notable (P < 0.05) inverse correlation between PROM2 expression levels and the promoter methylation values obtained from various methylation probes in the context of BRCA, LUAD, and UCEC (Figure 6).
Figure 6.

A MRXPRESS based correlation analysis between PROM2 expression and its promoter methylation in BRCA, LUAD, and UCEC. (A) In BRCA, (B) In LUAD, and (C) In UCEC. P-value < 0.05 = significant. A minus sign represents the negative correlation. PROM2 = Prominin 2, BRCA = Breast cancer, LUAD = Lung adenocarcinoma, UCEC = Uterine corpus endometrial carcinoma.
Genetic alteration in PROM2
PROM2 genetic alterations, including amplification, deletion, mutation, and gene fusion across BRCA, LUAD, and UCEC were evaluated via TCGA PanCancer Atlas BRCA, LUAD, and UCEC datasets analysis using cBioPortal. Results revealed that PROM2 harbors genetic alterations in the least proportions (1%, 2.2%, and 4% samples) of the analyzed BRCA, LUAD, and UCEC samples, respectively (Figure 7A).
Figure 7.

Genetic alterations, PPI network, and enrichment analysis of PROM2. (A) Genetic alterations analysis across TCGA BRCA, LUAD, and UCEC TCGA datasets, (B) A PPI network of the PROM2, and (C) Enrichment analysis results. P-value < 0.05 = significant. PPI = Protein-protein interaction, PROM2 = Prominin 2, BRCA = Breast cancer, LUAD = Lung adenocarcinoma, UCEC = Uterine corpus endometrial carcinoma.
PROM2 protein interaction and pathways
A PPI network of 11 PROM2 enriched genes was downloaded using STRING, and later Cytoscape was applied to construct and visualize the complete network (Figure 7B). We further processed this PROM2-enriched set of genes for pathway enrichment analysis. Results are listed in Table 1 and Figure 7C. Few PROM2-associated genes were involved in 4 diverse pathways including “Post-translational modification: synthesis of GPI-anchored proteins”, and “Phase 1 - inactivation of fast Na+ channels” (Figure 7C).
PROM2 has correlations with tumor purity and CD8+ T immune cells infiltration
The establishment of connections between tumor purity, infiltration of CD8+ T immune cells, and gene expression has paved the way for advancements in current cancer immunotherapies (24). Thus, within our investigation, we explored the interrelations among tumor purity, CD8+ T immune cell infiltration, and PROM2 expression in the context of BRCA, LUAD, and UCEC, utilizing TIMER. The outcomes revealed a noteworthy (P > 0.05) adverse correlation between tumor purity, CD8+ T immune cell infiltration, and mRNA expression of PROM2 in BRCA, LUAD, and UCEC (Figure 8).
Figure 8.

TIMER based Spearman correlations between the PROM2 expression, tumor purity, and CD8+ T immune cells levels in BRCA, LUAD, and UCEC. (A) Correlations between tumor purity, and PROM2 expression in BRCA, LUAD, and UCEC, and (B) Correlations between CD8+ T immune cells levels, and PROM2 expression in BRCA, LUAD, and UCEC. A p-value < 0.05 was used to indicate the significant scores. PROM2 = Prominin 2, BRCA = Breast cancer, LUAD = Lung adenocarcinoma, UCEC = Uterine corpus endometrial carcinoma.
Exploring potential MicroRNAs and transcription factors capable to regulate PROM2
Via the Enrichr database, we predicted the PROM2-targeted potential miRNAs and TFs. A total of ten most significant miRNAs (hsa-miR-1236-3p, hsa-miR-6736-5p, hsa-miR-4701-3p, hsa-miR-1267, mmu-miR-409-3p, mmu-miR-3057-5p, hsa-miR-6515-3p, hsa-miR-4293, hsa-miR-1587, and hsa-miR-3620-5p) and ten TFs (ZEB1, SPDEF, IRF1, TRP63, ZEB1 [mouse], TP63, FOXM1, FOXA2, HDAC3, and TWIST2) were explored that actually regulate PROM2 expression (Figure 9). As a whole, these pieces of evidence propose that the expression of PROM2 might be subject to regulation by a diverse array of factors.
Figure 9.

PROM2 targeted miRNAs and TFs predicted via Enrichr. (A) PROM2 targeted miRNAs, (B) PROM2 targeted TFs. P-value < 0.05 = significant. miRNAs = MicroRNAs, TFs = Transcription factors, PROM2 = Prominin 2.
Screening of PROM2-associated drugs
Considering the gene-drug interaction network established using CTD and Cytoscape, it came to our attention that the modulation of PROM2 expression could be achieved through various drugs. For instance, compounds such as calcitriol, tretinoin, and valproic acid were found to potentially enhance PROM2 expression, while substances like pyrene, bisphenol A, and undecane were associated with a potential reduction in PROM2 expression level (Figure 10).
Figure 10.

Gene-drug interaction network of PROM2. Red arrows: chemotherapeutic agents that can increase the expression of PROM2; green arrows: chemotherapeutic agents that can decrease the expression of PROM2. The count of arrows in this network between chemotherapeutic drug and gene represents the number of researches that have supported the interaction. PROM2 = Prominin 2.
Experimental in vitro validation of the PROM2 expression and methylation status
In the current study, by performing RNA-seq and targeted bisulfite-seq analyses of 4 lung cancer cell lines, including A549, ABC-1, EBC-1, LK-2, and one normal control lung cell line (MRC-9), the expression and methylation levels of PROM2 gene were validated. The expression levels of PROM2 were validated using FPKM, while methylation level was validated using beta values. Both FPKM and beta are quantitative values with widespread use in the RNA-seq and bisulfite-seq analysis. As shown in Figure 11A, it was noticed that PROM2 gene express in both normal and lung cancer cell lines and FPKM values of PROM2 were notably higher in lung cancer cell lines (A549, ABC-1, EBC-1, LK-2) as compared to normal cell line (MRC-9) (Figure 11A). Moreover, the beta values of PROM2 were higher in the normal (MRC-9) cell line while lower in lung cancer cell lines (A549, ABC-1, EBC-1, LK-2) (Figure 11B).
Figure 11.

Validating PROM2 expression and methylation status using (MRC-9) and (A549, ABC-1, EBC-1, LK-2) cell lines via RNA-seq and targeted bisulfite-seq analyses. (A) FPKM values based expression plots of PROM2, and (B) Beta values based methylation plots of PROM2. PROM2 = Prominin 2, RNA-seq = RNA sequencing, Bisulfit-seq = Bisulfite sequencing, FPKM = Fragments per kilo base million reads.
Discussion
PROM2 dysregulation is reported to be involved in the development of a few human cancers including liver cancer and chromophobe renal cell carcinoma [17-19]. In addition, some studies have also shown that PROM2 target-based therapies are more beneficial for the treatment and prevention of cancer development [17,34]. However, the role of PROM2 dysregulation in several other human cancers is still not elucidated. Therefore, in the current study, we comprehensively explored the oncogenic role of PROM2 in various cancers using in silico approach.
Our findings have shown that PROM2 was highly expressed in 19 types of human cancers while down-regulated in 5 different other types of human cancers. Further, we observed that PROM2 overexpression was significantly associated with different clinical variables and decreased OS durations of the BRCA, LUAD, and UCEC patients. Altogether, these results supported the idea that PROM2 maybe play a key role in the initiation and development of BRCA, LUAD, and UCEC, therefore, in the present study, our main focus were these 3 cancers.
To identify the potential cause of PROM2 up-regulation, we analyzed its promoter methylation levels and genetic alterations. The results indicated that the minor identified percentages of the genetic alterations (1%, 2.2%, and 4%) across the analyzed BRCA, LUAD, and UCEC samples respectively show no role in the expression regulation of PROM2. Therefore, PROM2 overexpression might be the outcome of significant hypomethylation in BRCA rather than genetic alterations and CNVs. However, we also observed the significant hypermethylation of PROM2 in LUAD and UCEC which challenges the classical view of promoter methylation. Thus, additional work should be conducted on the PROM2 promoter methylation in LUAD and UCEC to verify our hypothesis.
Currently, various BRCA, LUAD, and UCEC-associated molecular biomarkers have been suggested for the diagnosis and predicting the prognosis of BRCA, LUAD, and UCEC patients. These biomarkers include the abnormal expression behavior of the different genes such as ADH1A, IGSF10, BRCA1, BRCA2, APC, TPX2, KIF2C, CDCA8, BUB1B, and CCNA2 in BRCA [35-37], PITX3, MELTF, GJB3, RHOV, BAIAP2L2, GABRA2, KRT18, ARF3, TRIM7, ZNF710, SFTPB, AS1, DKK1, and CRCT1 in LUAD [38-41], and NLRP9, CLEC1B, CTSB, CLEC3A, IRF7, FCN1, NLRP10, RIPK2, and SARM1 in UCEC [42-44]. However, to our current understanding, no such biomarkers, including the mentioned ones, have been universally established across BRCA, LUAD, and UCEC patients encompassing diverse clinicopathological characteristics. In our research, we presented compelling evidence of PROM2’s significant up-regulation across various clinicopathological features among BRCA patients (including cancer stages, patient age, race, and TP53 mutation status) compared to normal controls. Furthermore, the PROM2 promoter methylation levels and survival information have also demonstrated their promising utility as potential novel prognostic biomarkers in BRCA, LUAD, and UCEC patients.
Moreover, in order to assess the potential involvement of miRNAs and TFs in the aberrant regulation of PROM2, we utilized Enrichr to predict the plausible miRNAs and TFs associated with PROM2. Results demonstrated 10 most significant miRNAs and TFs that can potentially regulate the PROM2 expression, including hsa-miR-1236-3p, hsa-miR-6736-5p, hsa-miR-4701-3p, hsa-miR-1267, mmu-miR-409-3p, mmu-miR-3057-5p, hsa-miR-6515-3p, hsa-miR-4293, hsa-miR-1587, and hsa-miR-3620-5p miRNAs and ZEB1, SPDEF, IRF1, TRP63, ZEB1 [mouse], TP63, FOXM1, FOXA2, HDAC3, and TWIST2 TFs. This important information might also help to understand the PROM2 oncogenic role in more detail.
Tumor purity and CD8+ T immune cell infiltration are the two most important aspects of immunotherapy [45]. To further uncover the potential role of up-regulated PROM2 in cancer immunotherapy, we performed the correlation analysis between PROM2 overexpression and CD8+ T cells immune cells infiltrates using TCGA data through TIMER. Impressively, we have observed negative correlations between tumor purity, CD8+ T immune cell infiltration, and PROM2 expression in BRCA, LUAD, and UCEC, suggesting that tumors having overexpression of PROM2 might be considered as CD8+ T immune subtypes. Moreover, these findings also suggested how BRCA, LUAD, and UCEC patients could benefit from CD8+ T immune concerning immunotherapy combined with chemotherapy and other targeted drugs.
Via PPI network analysis, we further observed that PROM2 shows interactions with ten other genes involved in different signaling pathways including “Post-translational modification: synthesis of GPI-anchored proteins”, and “Phase 1 - inactivation of fast Na+ channels”. Moreover, through the CTD database, we have also provided a new insight regarding a few potential drugs that can be used for treating BRCA, LUAD, and UCEC by regulating the PROM2 expression.
Conclusion
In this study, we explored the PROM2 expression level, prognostic values, methylation level, tumor immune infiltration, protein interaction, signaling pathways, targeted miRNAs, TFs, and gene-drug interaction network in different human cancers. In summary, PROM2 was significantly up-regulated and hypomethylated in BRCA, LUAD, and UCEC patients and also decreased the OS durations of these patients. Thus, PROM2 might be used as a potential biomarker and a therapeutic target across BRCA, LUAD, and UCEC patients.
Acknowledgements
The authors extend their appreciation to the Researchers supporting project number (RSP2023R470), King Saud University, Riyadh, Saudi Arabia.
Disclosure of conflict of interest
None.
References
- 1.Weir HK, Anderson RN, Coleman King SM, Soman A, Thompson TD, Hong Y, Moller B, Leadbetter S. Heart disease and cancer deaths - trends and projections in the United States, 1969-2020. Prev Chronic Dis. 2016;13:E157. doi: 10.5888/pcd13.160211. [DOI] [PMC free article] [PubMed] [Google Scholar]
- 2.Usman M, Hameed Y, Ahmad M, Rehman JU, Ahmed H, Hussain MS, Asif R, Murtaza MG, Jawad MT, Iqbal MJ. Breast cancer risk and human papillomavirus infection: a Bradford Hill criteria based evaluation. Infect Disord Drug Targets. 2022;22:e200122200389. doi: 10.2174/1573401318666220120105931. [DOI] [PubMed] [Google Scholar]
- 3.Siegel RL, Miller KD, Jemal A. Cancer statistics, 2020. CA Cancer J Clin. 2020;70:7–30. doi: 10.3322/caac.21590. [DOI] [PubMed] [Google Scholar]
- 4.Sial N, Saeed S, Ahmad M, Hameed Y, Rehman A, Abbas M, Asif R, Ahmed H, Hussain MS, Rehman JU, Atif M, Khan MR. Multi-omics analysis identified TMED2 as a shared potential biomarker in six subtypes of human cancer. Int J Gen Med. 2021;14:7025–7042. doi: 10.2147/IJGM.S327367. [DOI] [PMC free article] [PubMed] [Google Scholar]
- 5.Mao J, Huang X, Okla MK, Abdel-Maksoud MA, Mubarak A, Hameed Z, Noreen R, Chaudhary A, Ghazanfar S, Liao Y, Hameed Y, Li C. Risk factors for TERT promoter mutations with papillary thyroid carcinoma patients: a meta-analysis and systematic review. Comput Math Methods Med. 2022;2022:1721526. doi: 10.1155/2022/1721526. [DOI] [PMC free article] [PubMed] [Google Scholar] [Retracted]
- 6.Li SQ, Pan XF, Kashaf MS, Xue QP, Luo HJ, Wang YY, Wen Y, Yang ChX. Five-year survival is not a useful measure for cancer control in the population: an analysis based on UK data. Asian Pac J Cancer Prev. 2017;18:571–576. doi: 10.22034/APJCP.2017.18.2.571. [DOI] [PMC free article] [PubMed] [Google Scholar]
- 7.Ahmad M, Hameed Y, Khan M, Usman M, Rehman A, Abid U, Asif R, Ahmed H, Hussain MS, Rehman JU, Asif HM, Arshad R, Atif M, Hadi A, Sarfraz U, Khurshid U. Up-regulation of GINS1 highlighted a good diagnostic and prognostic potential of survival in three different subtypes of human cancer. Braz J Biol. 2024;84:e250575. doi: 10.1590/1519-6984.250575. [DOI] [PubMed] [Google Scholar]
- 8.Usman M, Hameed Y, Ahmad M, Iqbal MJ, Maryam A, Mazhar A, Naz S, Tanveer R, Saeed H, Bint-E-Fatima, Ashraf A, Hadi A, Hameed Z, Tariq E, Ashraf AS. SHMT2 is associated with tumor purity, CD8+ T immune cells infiltration, and a novel therapeutic target in four different human cancers. Curr Mol Med. 2023;23:161–176. doi: 10.2174/1566524022666220112142409. [DOI] [PubMed] [Google Scholar]
- 9.Shi WJ, Gao JB. Molecular mechanisms of chemoresistance in gastric cancer. World J Gastrointest Oncol. 2016;8:673–681. doi: 10.4251/wjgo.v8.i9.673. [DOI] [PMC free article] [PubMed] [Google Scholar]
- 10.Usman M, Okla MK, Asif HM, AbdElgayed G, Muccee F, Ghazanfar S, Ahmad M, Iqbal MJ, Sahar AM, Khaliq G, Shoaib R, Zaheer H, Hameed Y. A pan-cancer analysis of GINS complex subunit 4 to identify its potential role as a biomarker in multiple human cancers. Am J Cancer Res. 2022;12:986–1008. [PMC free article] [PubMed] [Google Scholar]
- 11.Hameed Y, Usman M, Liang S, Ejaz S. Novel diagnostic and prognostic biomarkers of colorectal cancer: capable to overcome the heterogeneity-specific barrier and valid for global applications. PLos One. 2021;16:e0256020. doi: 10.1371/journal.pone.0256020. [DOI] [PMC free article] [PubMed] [Google Scholar]
- 12.Weigmann A, Corbeil D, Hellwig A, Huttner WB. Prominin, a novel microvilli-specific polytopic membrane protein of the apical surface of epithelial cells, is targeted to plasmalemmal protrusions of non-epithelial cells. Proc Natl Acad Sci U S A. 1997;94:12425–12430. doi: 10.1073/pnas.94.23.12425. [DOI] [PMC free article] [PubMed] [Google Scholar]
- 13.Corbeil D, Röper K, Fargeas CA, Joester A, Huttner WB. Prominin: a story of cholesterol, plasma membrane protrusions and human pathology. Traffic. 2001;2:82–91. doi: 10.1034/j.1600-0854.2001.020202.x. [DOI] [PubMed] [Google Scholar]
- 14.Jászai J, Fargeas CA, Haase M, Farkas LM, Huttner WB, Corbeil D. Robust expression of Prominin-2 all along the adult male reproductive system and urinary bladder. Histochem Cell Biol. 2008;130:749–59. doi: 10.1007/s00418-008-0445-4. [DOI] [PubMed] [Google Scholar]
- 15.Jászai J, Farkas LM, Fargeas CA, Janich P, Haase M, Huttner WB, Corbeil D. Prominin-2 is a novel marker of distal tubules and collecting ducts of the human and murine kidney. Histochem Cell Biol. 2010;133:527–539. doi: 10.1007/s00418-010-0690-1. [DOI] [PubMed] [Google Scholar]
- 16.Zhuang X, Herbert JM, Lodhia P, Bradford J, Turner AM, Newby PM, Thickett D, Naidu U, Blakey D, Barry S, Cross DA, Bicknell R. Identification of novel vascular targets in lung cancer. Br J Cancer. 2015;112:485–494. doi: 10.1038/bjc.2014.626. [DOI] [PMC free article] [PubMed] [Google Scholar]
- 17.Bao L, Zhang Y, Wang J, Wang H, Dong N, Su X, Xu M, Wang X. Variations of chromosome 2 gene expressions among patients with lung cancer or non-cancer. Cell Biol Toxicol. 2016;32:419–435. doi: 10.1007/s10565-016-9343-z. [DOI] [PubMed] [Google Scholar]
- 18.Rohan S, Tu JJ, Kao J, Mukherjee P, Campagne F, Zhou XK, Hyjek E, Alonso MA, Chen YT. Gene expression profiling separates chromophobe renal cell carcinoma from oncocytoma and identifies vesicular transport and cell junction proteins as differentially expressed genes. Clin Cancer Res. 2006;12:6937–6945. doi: 10.1158/1078-0432.CCR-06-1268. [DOI] [PubMed] [Google Scholar]
- 19.Saha SK, Islam SMR, Kwak KS, Rahman MS, Cho SG. PROM1 and PROM2 expression differentially modulates clinical prognosis of cancer: a multiomics analysis. Cancer Gene Ther. 2020;27:147–167. doi: 10.1038/s41417-019-0109-7. [DOI] [PMC free article] [PubMed] [Google Scholar]
- 20.Chandrashekar DS, Bashel B, Balasubramanya SAH, Creighton CJ, Ponce-Rodriguez I, Chakravarthi BVSK, Varambally S. UALCAN: a portal for facilitating tumor subgroup gene expression and survival analyses. Neoplasia. 2017;19:649–658. doi: 10.1016/j.neo.2017.05.002. [DOI] [PMC free article] [PubMed] [Google Scholar]
- 21.Maciejczyk A, Szelachowska J, Czapiga B, Matkowski R, Hałoń A, Györffy B, Surowiak P. Elevated BUBR1 expression is associated with poor survival in early breast cancer patients: 15-year follow-up analysis. J Histochem Cytochem. 2013;61:330–339. doi: 10.1369/0022155413480148. [DOI] [PMC free article] [PubMed] [Google Scholar]
- 22.Tang Z, Li C, Kang B, Gao G, Li C, Zhang Z. GEPIA: a web server for cancer and normal gene expression profiling and interactive analyses. Nucleic Acids Res. 2017;45:W98–W102. doi: 10.1093/nar/gkx247. [DOI] [PMC free article] [PubMed] [Google Scholar]
- 23.Park SJ, Yoon BH, Kim SK, Kim SY. GENT2: an updated gene expression database for normal and tumor tissues. BMC Med Genomics. 2019;12(Suppl 5):101. doi: 10.1186/s12920-019-0514-7. [DOI] [PMC free article] [PubMed] [Google Scholar]
- 24.Uhlén M, Fagerberg L, Hallström BM, Lindskog C, Oksvold P, Mardinoglu A, Sivertsson Å, Kampf C, Sjöstedt E, Asplund A, Olsson I, Edlund K, Lundberg E, Navani S, Szigyarto CA, Odeberg J, Djureinovic D, Takanen JO, Hober S, Alm T, Edqvist PH, Berling H, Tegel H, Mulder J, Rockberg J, Nilsson P, Schwenk JM, Hamsten M, von Feilitzen K, Forsberg M, Persson L, Johansson F, Zwahlen M, von Heijne G, Nielsen J, Pontén F. Tissue-based map of the human proteome. Science. 2015;347:1260419. doi: 10.1126/science.1260419. [DOI] [PubMed] [Google Scholar]
- 25.Koch A, De Meyer T, Jeschke J, Van Criekinge W. MEXPRESS: visualizing expression, DNA methylation and clinical TCGA data. BMC Genomics. 2015;16:636. doi: 10.1186/s12864-015-1847-z. [DOI] [PMC free article] [PubMed] [Google Scholar]
- 26.Cerami E, Gao J, Dogrusoz U, Gross BE, Sumer SO, Aksoy BA, Jacobsen A, Byrne CJ, Heuer ML, Larsson E, Antipin Y, Reva B, Goldberg AP, Sander C, Schultz N. The cBio cancer genomics portal: an open platform for exploring multidimensional cancer genomics data. Cancer Discov. 2012;2:401–404. doi: 10.1158/2159-8290.CD-12-0095. [DOI] [PMC free article] [PubMed] [Google Scholar]
- 27.von Mering C, Huynen M, Jaeggi D, Schmidt S, Bork P, Snel B. STRING: a database of predicted functional associations between proteins. Nucleic Acids Res. 2003;31:258–261. doi: 10.1093/nar/gkg034. [DOI] [PMC free article] [PubMed] [Google Scholar]
- 28.Huang DW, Sherman BT, Tan Q, Collins JR, Alvord WG, Roayaei J, Stephens R, Baseler MW, Lane HC, Lempicki RA. The DAVID gene functional classification tool: a novel biological module-centric algorithm to functionally analyze large gene lists. Genome Biol. 2007;8:R183. doi: 10.1186/gb-2007-8-9-r183. [DOI] [PMC free article] [PubMed] [Google Scholar]
- 29.Li T, Fu J, Zeng Z, Cohen D, Li J, Chen Q, Li B, Liu XS. TIMER2.0 for analysis of tumor-infiltrating immune cells. Nucleic Acids Res. 2020;48:W509–W514. doi: 10.1093/nar/gkaa407. [DOI] [PMC free article] [PubMed] [Google Scholar]
- 30.Kuleshov MV, Jones MR, Rouillard AD, Fernandez NF, Duan Q, Wang Z, Koplev S, Jenkins SL, Jagodnik KM, Lachmann A, McDermott MG, Monteiro CD, Gundersen GW, Ma’ayan A. Enrichr: a comprehensive gene set enrichment analysis web server 2016 update. Nucleic Acids Res. 2016;44:W90–W97. doi: 10.1093/nar/gkw377. [DOI] [PMC free article] [PubMed] [Google Scholar]
- 31.Mattingly CJ, Colby GT, Forrest JN, Boyer JL. The comparative toxicogenomics database (CTD) Environ Health Perspect. 2003;111:793–795. doi: 10.1289/ehp.6028. [DOI] [PMC free article] [PubMed] [Google Scholar]
- 32.Rio DC, Ares M Jr, Hannon GJ, Nilsen TW. Purification of RNA using TRIzol (TRI reagent) Cold Spring Harb Protoc. 2010;2010:pdb.prot5439. doi: 10.1101/pdb.prot5439. [DOI] [PubMed] [Google Scholar]
- 33.Ghatak S, Muthukumaran RB, Nachimuthu SK. A simple method of genomic DNA extraction from human samples for PCR-RFLP analysis. J Biomol Tech. 2013;24:224–231. doi: 10.7171/jbt.13-2404-001. [DOI] [PMC free article] [PubMed] [Google Scholar]
- 34.Thamm K, Šimaitė D, Karbanová J, Bermúdez V, Reichert D, Morgenstern A, Bornhäuser M, Huttner WB, Wilsch-Bräuninger M, Corbeil D. Prominin-1 (CD133) modulates the architecture and dynamics of microvilli. Traffic. 2019;20:39–60. doi: 10.1111/tra.12618. [DOI] [PubMed] [Google Scholar]
- 35.García-Escudero R, Martínez-Cruz AB, Santos M, Lorz C, Segrelles C, Garaulet G, Saiz-Ladera C, Costa C, Buitrago-Pérez Á, Dueñas M, Paramio JM. Gene expression profiling of mouse p53-deficient epidermal carcinoma defines molecular determinants of human cancer malignancy. Mol Cancer. 2010;9:193. doi: 10.1186/1476-4598-9-193. [DOI] [PMC free article] [PubMed] [Google Scholar]
- 36.Sana M, Malik H. Current and emerging breast cancer biomarkers. J Cancer Res Ther. 2015;11:508–513. doi: 10.4103/0973-1482.163698. [DOI] [PubMed] [Google Scholar]
- 37.Wu M, Li Q, Wang H. Identification of novel biomarkers associated with the prognosis and potential pathogenesis of breast cancer via integrated bioinformatics analysis. Technol Cancer Res Treat. 2021;20:1533033821992081. doi: 10.1177/1533033821992081. [DOI] [PMC free article] [PubMed] [Google Scholar]
- 38.Ma B, Geng Y, Meng F, Yan G, Song F. Identification of a sixteen-gene prognostic biomarker for lung adenocarcinoma using a machine learning method. J Cancer. 2020;11:1288–1298. doi: 10.7150/jca.34585. [DOI] [PMC free article] [PubMed] [Google Scholar]
- 39.Zhang C, Chen X, Chen Y, Cao M, Tang J, Zhong B, He M. The PITX gene family as potential biomarkers and therapeutic targets in lung adenocarcinoma. Medicine (Baltimore) 2021;100:e23936. doi: 10.1097/MD.0000000000023936. [DOI] [PMC free article] [PubMed] [Google Scholar]
- 40.Zhang D, Chen C, Li Y, Fu X, Xie Y, Li Y, Huang Y. Cx31.1 acts as a tumour suppressor in non-small cell lung cancer (NSCLC) cell lines through inhibition of cell proliferation and metastasis. J Cell Mol Med. 2012;16:1047–1059. doi: 10.1111/j.1582-4934.2011.01389.x. [DOI] [PMC free article] [PubMed] [Google Scholar]
- 41.Kim Y, Pierce CM, Robinson LA. Impact of viral presence in tumor on gene expression in non-small cell lung cancer. BMC Cancer. 2018;18:843. doi: 10.1186/s12885-018-4748-0. [DOI] [PMC free article] [PubMed] [Google Scholar]
- 42.Kaur D, Arora C, Raghava GPS. Pattern recognition receptor based prognostic biomarkers for predicting survival of uterine corpus endometrial cancer patients. bioRxiv. 2020 [Google Scholar]
- 43.Alsamman K, El-Masry OS. Interferon regulatory factor 1 inactivation in human cancer. Biosci Rep. 2018;38:BSR20171672. doi: 10.1042/BSR20171672. [DOI] [PMC free article] [PubMed] [Google Scholar]
- 44.Yang Q, Tian S, Liu Z, Dong W. Knockdown of RIPK2 inhibits proliferation and migration, and induces apoptosis via the NF-κB signaling pathway in gastric cancer. Front Genet. 2021;12:627464. doi: 10.3389/fgene.2021.627464. [DOI] [PMC free article] [PubMed] [Google Scholar]
- 45.Ziai J, Gilbert HN, Foreman O, Eastham-Anderson J, Chu F, Huseni M, Kim JM. CD8+ T cell infiltration in breast and colon cancer: a histologic and statistical analysis. PLoS One. 2018;13:e0190158. doi: 10.1371/journal.pone.0190158. [DOI] [PMC free article] [PubMed] [Google Scholar]