

Abstract
Background: Icarin’s mechanism of action in osteoarthritis (OA) was explored using network pharmacology and the GEO database, and then further validated using molecular docking. Methods: GEO database using network pharmacology identified differential genes in OA based on Icariin’s possible targets predicted by pharmmapper database. Combining the differentially expressed genes in OA with the OA-related targets, the overlapping targets were removed. In order to determine what Icariin’s core targets are for treating OA, PPI network analysis was performed using OA-related targets and possible Icariin targets. Furthermore, molecular docking was used to verify the chemical’s binding to the targets. Final steps included Gene Ontology (GO) enrichment analysis and Kyoto Encyclopedia of genes and genomes (KEGG) pathway enrichment analysis. Cytoscape was used to construct a network of compound-target-pathway-disease. Results: Protein-protein interactions between overlapping targets revealed 151 intersection targets based on a network analysis. The top ten targets with the highest enrichment scores were SRC, MAPK1, HSP90AA1, AKT1, PTPN11, ESR1, EGFR, RhoA, JAK2, and MAPK14. KEGG enrichment analysis showed that the pathways at which Icariin intervention occurs include the OA including FOXO signaling pathway, and estrogen signaling pathway. The GO analysis result showed that various biologic processes such as proteolysis, angiogenesis, innate immune response, and positive regulation of inflammatory response were involved in treatment. Molecular docking analysis confirmed that Icariin could bind well to the targets through intermolecular forces. Conclusion: With its multi-targeting and multi-pathway characteristics, Icariin is a promising candidate drug for treating OA.
Keywords: Icariin, osteoarthritis, network pharmacology, molecular docking
Introduction
There are several causes for limited joint function and persistent pain, including osteoarthritis (OA). It affects 140 million people worldwide, and cases are increasing [1]. The main mechanism of OA is abnormal metabolism of joint tissue, resulting in the cartilage degeneration, subchondral bone thickening, synovitis, and loss of normal joint function [2,3]. The most common methods for treating knee osteoarthritis include weight control, physical therapy, medications, and surgery to improve knee function and alleviate pain [4]. It is stated in several relevant guidelines that oral non-steroidal anti-inflammatory drugs (NSAIDs) are still the main drug treatment for OA. Many trials have proven their short-term efficacy, so they are strongly recommended [5-7]. However, in recent years, the widespread oral administration of NSAIDs has been questioned for their many side effects, such as kidney injury, gastrointestinal irritation, and increased risk of cardiovascular disease [8,9]. In 2019, the guidelines jointly formulated by the American College of Rheumatology and the Arthritis Foundation stressed that the dosage of NSAIDs should be as low as possible and the service cycle should be shortened [5]. Therefore, there is an urgent need for an alternative drug that is equally effective but with fewer side effects.
The natural Chinese herbal medicine icaridin is widely used in China to treat OA, having both high safety and definite curative effects. Icariin is the main active natural product isolated from Icariin, which is one of the flavonol glycosides and has a wide range of biologic activities. Icariin has shown a vital of anti-inflammatory, immune regulation, cartilage formation promotion, and analgesic effects in OA [10,11]. In spite of this, its molecular mechanism remains unclear.
Recent years have seen the emergence of a new discipline called network pharmacology, which combines network analysis with drug discovery. This can be used to clarify the synergy of drug active ingredients through compound-target-disease networks and predict the mechanism of disease treatment through multi-target and multi-pathway analysis at the molecular level [12]. It has become increasingly apparent in recent years that network pharmacology has great potential for understanding the interactions between genes, proteins, and disease. Since the advent of network pharmacology methods, new opportunities have opened up for studying the pharmacologic effects of complex herbal medicines. The molecular mechanisms of Icariin were predicted in this study by developing a network pharmacology model. Our next step was to verify the predictions by using molecular docking technology to test Icariin’s pharmacological effects on osteoarthritis.
Materials and methods
Target prediction of icariin
We were able to obtain the molecular structure file for Icariin from PubChem (http://pubchem.ncbi.nlm.nih.gov/) [13]. In order to predict Icariin’s targets, the structure file of Icariin was uploaded to pharmmapper (http://www.lilab-ecust.cn/pharmmapper/) [14]. The research species was set as homo sapiens only (v2010, 2241), other parameters were set as default. The UniProt database was used for converting the protein name (https://www.uniprot.org/) [15] to the official name.
Screening of genes related to OA
The GEO database was used to obtain data related to OA (https://www.ncbi.nlm.nih.gov/geo/) [16]. A molecular sequencing facility affiliated with the Jena University affiliated hospital conducted the sequencing for GSE55457. Ten samples from patients with OA and ten from controls were included in the data set. The analysis was conducted with the Affymetrix Human Genome U133A Array GPL96 [HG-U133A]. We used the limma package to analyze the differential expression in the database. A P-value of 0.05 and a fold-change of 2.0 were used as analysis thresholds. As part of our analysis, we retrieved OA targets from the Genecards database (http://www.genecards.org/) [17], the OMIM database (https://omim.org/) [18], and the TTD database (http://db.idrblab.net/ttd/) [19]. Combining with the OA differentially expressed genes, the OA disease-related gene data set was determined after removing the overlapping genes.
PPI network construction
A possible target for icariin in treating OA would be the intersection of OA-related genes and icariin targets. By intersecting the targets, a string database (http://string-db.org/) was created [20]. Cytoscape v3.7.2 software (http://www.cytoscape.org) was loaded with network data. The PPI network was constructed using the network analyzer, which is a plug-in of Cytoscape v3.7.2 software to analyze the topology of the network. The core target of icariin in the treatment of OA was selected according to the value among centrality (BC), closeness centrality (CC), and degree of intersected targets.
Enrichment analysis and the construction of compound-target-pathway-disease network
Using clusterprofiler, we performed an analysis of the predicted therapeutic targets based on the Gene Ontology (GO) and Kyoto Encyclopedia of genes and genomes (KEGG) enrichment analyses. By using Cytoscape, terms with P<0.05 were selected for construction of a compound-target-pathway-disease network.
Molecular docking verification
The protein structure files of the top ten core targets were downloaded from the PDB database (https://www.rcsb.org/). The molecular docking analysis between the core proteins and active molecule of icariin was performed using CB-dock website and auto dock Vina (version 1.1.2).
Results
Target mining of Icariin
The molecular structure (Figure 1) of Icariin was obtained through Puchem database. The PharmMapper database and UniProt database were used for target prediction and gene name correction. Ultimately, Icariin’s potential targets amounted to 300.
Figure 1.

The molecular structure of Icariin.
OA related gene mining
The gene transcription profile chip GSE55457 was used in this study, and a total of 518 differentially expressed genes, including 304 up-regulated genes and 214 down-regulated genes, were screened according to the criteria of P<0.05 and fold change ≥2 (Figure 2). LogFC and -log10 p values were the abscissa and ordinate, respectively, and the volcanic map was used to visualize genes that are differentially expressed (Figure 3). Three databases were used for gene identification: gene cards, OMIM, and TTD. The gene cards database contained 3099 OA-related genes, while the OMIM database contained 68 OA-related genes, and TTD database contained 23 OA-related genes. After deleting the overlapping targets, 3517 OA-related genes were identified.
Figure 2.

Heatmap of expression value of differentially expressed genes in GSE55457 data set: red cells indicate the genes with up-regulated expression and green cells indicate the genes with down-regulated expression.
Figure 3.

Analysis of genes with differential expression in GSE55457 dataset in volcanic map. Red dots represent the up-regulated genes and the green dots represent the down-regulated genes.
PPI network analysis
From the intersection of icariin targets with OA-related genes, 151 intersected targets were identified. In order to build the PPI network, the intersected targets were imported into the String database and the network data were imported into Cytoscape (Figure 4). Having removed the free targets, there were 107 nodes and 264 edges in the network. In this study, the network was analyzed topologically. According to the median values, the median value for BC was 0.00361191, and the median value for CC was 0.00361191. Degree values higher than twice the median value as well as BC and CC values greater than the median value were used to select core targets (Table 1). Finally, a total of 28 targets, including SRC, MAPK, HSP90AA1, AKT1, PTPN11, ESR1, EGFR, RhoA, JAK2, Mapk14, IL2, AR, MAPK8, IGF1, CASP3, JAK3, F2, KDR, MDM2, PPARγ, NOS3, PDPK1, HSPALA, CSK, NOS2, TGFBR1 and MMP2 met the above requirements and were screened as the core targets.
Figure 4.

Interaction network of the targets with highest confidence of Icariin in the treatment of OA.
Table 1.
PPI network of core targets and their topologic parameters
| Target Gene | Target Protein | BC | CC | Degree |
|---|---|---|---|---|
| SRC | Proto-oncogene tyrosine-protein kinase Src | 0.20762006 | 0.48484848 | 28 |
| MAPK1 | Mitogen-activated protein kinase 1 | 0.17673147 | 0.47058824 | 24 |
| HSP90AA1 | Heat shock protein HSP 90-alpha | 0.16977015 | 0.4549763 | 23 |
| AKT1 | RAC-alpha serine/threonine-protein kinase | 0.11534838 | 0.42477876 | 20 |
| PTPN11 | Tyrosine-protein phosphatase non-receptor type 11 | 0.03679226 | 0.4137931 | 19 |
| ESR1 | Estrogen receptor | 0.15340146 | 0.42290749 | 18 |
| EGFR | Epidermal growth factor receptor | 0.05024366 | 0.41201717 | 17 |
| RHOA | Transforming protein RhoA | 0.06401316 | 0.4137931 | 16 |
| JAK2 | Tyrosine-protein kinase JAK2 | 0.03546004 | 0.384 | 13 |
| MAPK14 | Mitogen-activated protein kinase 14 | 0.02429386 | 0.39669421 | 12 |
| IL2 | Interleukin-2 | 0.02505976 | 0.39669421 | 10 |
| AR | Androgen receptor | 0.04274218 | 0.40336134 | 10 |
| MAPK8 | Mitogen-activated protein kinase 8 | 0.04652714 | 0.37209302 | 10 |
| IGF1 | Insulin-like growth factor I | 0.04262397 | 0.40336134 | 10 |
| CASP3 | Caspase-3 | 0.04499786 | 0.37065637 | 9 |
| JAK3 | Tyrosine-protein kinase JAK3 | 0.00369136 | 0.36781609 | 9 |
| F2 | Prothrombin | 0.19405893 | 0.39834025 | 9 |
| KDR | Vascular endothelial growth factor receptor 2 | 0.02863362 | 0.37795276 | 9 |
| MDM2 | E3 ubiquitin-protein ligase Mdm2 | 0.01775826 | 0.37065637 | 8 |
| MET | Hepatocyte growth factor receptor | 0.00948654 | 0.37065637 | 8 |
| PPARA | Peroxisome proliferator-activated receptor alpha | 0.10941735 | 0.38866397 | 8 |
| NOS3 | Nitric oxide synthase, endothelial | 0.00361191 | 0.35820896 | 7 |
| PDPK1 | 3-phosphoinositide-dependent protein kinase 1 | 0.02824207 | 0.37795276 | 7 |
| HSPA1A | Heat shock 70 kDa protein 1A | 0.0122306 | 0.37209302 | 7 |
| CSK | Tyrosine-protein kinase CSK | 0.01007009 | 0.36641221 | 7 |
| NOS2 | Nitric oxide synthase, inducible | 0.0100451 | 0.37944664 | 6 |
| TGFBR1 | TGF-beta receptor type-1 | 0.03064952 | 0.32876712 | 6 |
| MMP2 | 72 kDa type IV collagenase | 0.05836368 | 0.36226415 | 6 |
Analyzing compound-target-pathways and constructing compound-target-pathway networks
The enrichment analysis for intersected targets using the DAVID database showed that 356 GO entries with a significance of P<0.05 were involved in the mechanism of the OA treatment using Icariin, including 294 biological processes (BP) entries, 41 cellular component (CC) entries and 85 molecular function (MF) entries, mainly involving proteolysis, angiogenesis, innate immune response Positive regulation of inflammatory response, extracellular space, cytosol, steroid receptor activity and protein tyrosine kinase activity (Figure 5).
Figure 5.

Histogram of GO biological process analysis.
A total of 41 related pathways were obtained after the KEGG pathway analysis (Table 2; Figure 6), mainly including FOXO signaling pathway, estrogen signaling pathway, Ras signaling pathway, PI3K Akt signaling pathway, prolactin signaling pathway, Rap1 signaling pathway Insulin resistance, neurotrophin signaling pathway, TNF signaling pathway, osteoclast differentiation, complement and coagulation cascades, VEGF signaling pathway, Fc epsilon RI signaling pathway, and MAPK signaling pathway.
Table 2.
KEGG pathway analysis
| KEGG ID | Term | Gene Number | P value | Gene ID |
|---|---|---|---|---|
| hsa04068 | FoxO signaling pathway | 17 | 3.23E-09 | TGFB2, PDPK1, PLK1, IGF1, MAPK14, SOD2, EGFR, TGFBR1, PIK3CG, TGFBR2, IGF1R, MAPK10, MAPK8, CDK2, MDM2, AKT1, MAPK1 |
| hsa04915 | Estrogen signaling pathway | 14 | 3.34E-08 | HSPA8, HSP90AA1, NOS3, SRC, MMP2, ESR1, MMP9, EGFR, PIK3CG, ESR2, AKT1, MAPK1, CALM1, HSPA1A |
| hsa04014 | Ras signaling pathway | 20 | 3.64E-08 | PLA2G2A, PTPN11, IGF1, RHOA, EGFR, PGF, PIK3CG, IGF1R, MAPK10, ZAP70, MAPK8, KIT, PLA2G10, KDR, AKT1, MAPK1, CALM1, MET, FGFR2, FGFR1 |
| hsa04151 | PI3K-Akt signaling pathway | 23 | 3.94E-07 | GSK3B, HSP90AA1, SYK, NOS3, PDPK1, IGF1, EGFR, IL2, PGF, PIK3CG, IGF1R, RHEB, KIT, CDK2, MDM2, KDR, AKT1, MAPK1, JAK2, JAK3, MET, FGFR2, FGFR1 |
| hsa04917 | Prolactin signaling pathway | 11 | 7.13E-07 | MAPK10, GSK3B, MAPK8, SRC, MAPK1, AKT1, JAK2, MAPK14, ESR1, ESR2, PIK3CG |
| hsa04015 | Rap1 signaling pathway | 17 | 1.80E-06 | SRC, IGF1, ITGAL, MAPK14, RHOA, EGFR, PGF, PIK3CG, IGF1R, KIT, KDR, AKT1, MAPK1, CALM1, MET, FGFR2, FGFR1 |
| hsa04931 | Insulin resistance | 12 | 5.23E-06 | MAPK10, GSK3B, PTPN1, MAPK8, PDPK1, NOS3, NR1H2, NR1H3, AKT1, PTPN11, PPARA, PIK3CG |
| hsa04722 | Neurotrophin signaling pathway | 12 | 1.45E-05 | MAPK10, GSK3B, MAPK8, PDPK1, MAPKAPK2, MAPK1, AKT1, PTPN11, CALM1, MAPK14, RHOA, PIK3CG |
| hsa04668 | TNF signaling pathway | 11 | 3.05E-05 | MAPK10, CASP7, MAPK8, CCL5, CASP3, MMP3, MAPK1, AKT1, MAPK14, MMP9, PIK3CG |
| hsa04380 | Osteoclast differentiation | 12 | 3.32E-05 | MAPK10, TGFB2, MAPK8, SYK, CTSK, MAPK1, AKT1, PPARG, MAPK14, TGFBR1, PIK3CG, TGFBR2 |
| hsa04610 | Complement and coagulation cascades | 9 | 4.16E-05 | F7, SERPINA1, C1S, F10, PLAU, C1R, PLAT, F2, F3 |
| hsa04370 | VEGF signaling pathway | 8 | 1.37E-04 | SRC, NOS3, MAPKAPK2, KDR, MAPK1, AKT1, MAPK14, PIK3CG |
| hsa04664 | Fc epsilon RI signaling pathway | 8 | 2.72E-04 | MAPK10, MAPK8, SYK, PDPK1, MAPK1, AKT1, MAPK14, PIK3CG |
| hsa04010 | MAPK signaling pathway | 15 | 2.78E-04 | HSPA8, TGFB2, MAPK14, EGFR, TGFBR1, TGFBR2, MAPK10, MAPK8, CASP3, MAPKAPK2, AKT1, MAPK1, FGFR2, HSPA1A, FGFR1 |
| hsa04550 | Signaling pathways regulating pluripotency of stem cells | 11 | 2.94E-04 | GSK3B, MAPK1, AKT1, IGF1, JAK2, MAPK14, JAK3, FGFR2, PIK3CG, FGFR1, IGF1R |
| hsa04919 | Thyroid hormone signaling pathway | 10 | 3.02E-04 | GSK3B, THRA, PDPK1, RHEB, SRC, MDM2, MAPK1, AKT1, ESR1, PIK3CG |
| hsa04071 | Sphingolipid signaling pathway | 10 | 4.15E-04 | MAPK10, MAPK8, PDPK1, NOS3, MAPK1, AKT1, MAPK14, CTSD, RHOA, PIK3CG |
| hsa04660 | T cell receptor signaling pathway | 9 | 5.68E-04 | GSK3B, ZAP70, PDPK1, MAPK1, AKT1, MAPK14, RHOA, IL2, PIK3CG |
| hsa04910 | Insulin signaling pathway | 10 | 0.001143915 | MAPK10, GSK3B, PTPN1, MAPK8, PDPK1, RHEB, MAPK1, AKT1, CALM1, PIK3CG |
| hsa04012 | ErbB signaling pathway | 8 | 0.001219899 | MAPK10, GSK3B, MAPK8, SRC, MAPK1, AKT1, EGFR, PIK3CG |
| hsa04912 | GnRH signaling pathway | 8 | 0.001587681 | MAPK10, MAPK8, SRC, MMP2, MAPK1, CALM1, MAPK14, EGFR |
| hsa04066 | HIF-1 signaling pathway | 8 | 0.002162982 | NOS2, NOS3, MAPK1, AKT1, IGF1, EGFR, PIK3CG, IGF1R |
| hsa04152 | AMPK signaling pathway | 9 | 0.002189371 | CCNA2, PDPK1, RHEB, AKT1, PPARG, HMGCR, IGF1, PIK3CG, IGF1R |
| hsa04620 | Toll-like receptor signaling pathway | 8 | 0.003786019 | MAPK10, MAPK8, CCL5, CTSK, MAPK1, AKT1, MAPK14, PIK3CG |
| hsa04621 | NOD-like receptor signaling pathway | 6 | 0.003941611 | MAPK10, HSP90AA1, MAPK8, CCL5, MAPK1, MAPK14 |
| hsa04150 | mTOR signaling pathway | 6 | 0.004588605 | PDPK1, RHEB, MAPK1, AKT1, IGF1, PIK3CG |
| hsa04350 | TGF-beta signaling pathway | 7 | 0.004948262 | TGFB2, NOG, MAPK1, BMP7, RHOA, TGFBR1, TGFBR2 |
| hsa04650 | Natural killer cell mediated cytotoxicity | 8 | 0.008121692 | ZAP70, SYK, CASP3, ICAM2, MAPK1, PTPN11, ITGAL, PIK3CG |
| hsa04920 | Adipocytokine signaling pathway | 6 | 0.010130688 | MAPK10, MAPK8, AKT1, PTPN11, JAK2, PPARA |
| hsa04750 | Inflammatory mediator regulation of TRP channels | 7 | 0.010350527 | MAPK10, MAPK8, SRC, IGF1, CALM1, MAPK14, PIK3CG |
| hsa04611 | Platelet activation | 8 | 0.011319533 | SYK, SRC, NOS3, MAPK1, AKT1, MAPK14, RHOA, PIK3CG |
| hsa04024 | cAMP signaling pathway | 10 | 0.012409541 | MAPK10, MAPK8, PDE4D, PDE4B, MAPK1, AKT1, CALM1, PPARA, RHOA, PIK3CG |
| hsa04612 | Antigen processing and presentation | 6 | 0.014143102 | HSPA8, HSP90AA1, B2M, CTSS, CTSB, HSPA1A |
| hsa04670 | Leukocyte transendothelial migration | 7 | 0.021377856 | MMP2, PTPN11, ITGAL, MAPK14, MMP9, RHOA, PIK3CG |
| hsa04064 | NF-kappa B signaling pathway | 6 | 0.02403003 | ZAP70, CSNK2A1, SYK, PLAU, CSNK2B, XIAP |
| hsa04062 | Chemokine signaling pathway | 9 | 0.024240122 | GSK3B, SRC, CCL5, MAPK1, AKT1, JAK2, JAK3, RHOA, PIK3CG |
| hsa04210 | Apoptosis | 5 | 0.029248074 | CASP7, CASP3, XIAP, AKT1, PIK3CG |
| hsa03320 | PPAR signaling pathway | 5 | 0.03742122 | FABP4, PDPK1, NR1H3, PPARG, PPARA |
| hsa04662 | B cell receptor signaling pathway | 5 | 0.04102281 | GSK3B, SYK, MAPK1, AKT1, PIK3CG |
| hsa04810 | Regulation of actin cytoskeleton | 9 | 0.044933097 | SRC, MAPK1, ITGAL, F2, RHOA, EGFR, FGFR2, PIK3CG, FGFR1 |
| hsa04310 | Wnt signaling pathway | 7 | 0.046167362 | MAPK10, GSK3B, MAPK8, MMP7, CSNK2A1, CSNK2B, RHOA |
Figure 6.
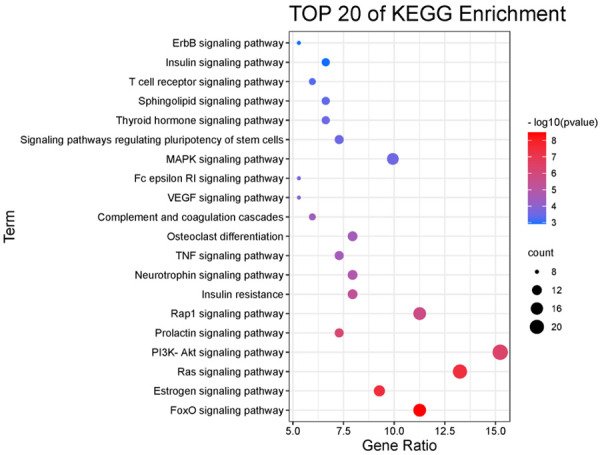
Bubble diagram of KEGG pathway analysis.
With the help of the Cytoscape software, a network representing compounds, pathways, and diseases was constructed (Figure 7). The yellow nodes represent targets, while the green nodes represent pathways. In this network, 41 pathways and 83 targets are represented by 126 nodes and 563 edges, which reflect the characteristics of the multi-target and multi-pathway treatment of OA with icariin.
Figure 7.

Compound-target-pathway-disease network of Icariin in the treatment of OA. Molecular docking verification.
The molecular docking verification between Icariin molecule and the core targets which were arranged in the top ten degrees (Table 3) shows that the minimum Vina docking score between all targets and Icariin is less than -7.0, indicating that the ligand (Icariin) can bind to the receptors spontaneously [21], and the binding activity between the compound and the targets is high. The results of molecular docking verification are visualized in Figure 8. It can be seen that Icariin can bind well with the receptors by hydrogen bonds, hydrophobic forces, aromatic ring accumulation, and other intermolecular forces.
Table 3.
The molecular docking verification analysis
| Target Gene | Target Protein | PDB ID | The Lowest Vina Score |
|---|---|---|---|
| SRC | Proto-oncogene tyrosine-protein kinase Src | 3D7T | -9.7 |
| MAPK1 | Mitogen-activated protein kinase 1 | 6G54 | -10.0 |
| HSP90AA1 | Heat shock protein HSP 90-alpha | 5NJX | -7.4 |
| AKT1 | RAC-alpha serine/threonine-protein kinase | 2UZR | -7.9 |
| PTPN11 | Tyrosine-protein phosphatase non-receptor type 11 | 7JVN | -9.1 |
| ESR1 | Estrogen receptor | 4XI3 | -8.3 |
| EGFR | Epidermal growth factor receptor | 3IKA | -8.7 |
| RHOA | Transforming protein RhoA | 1TXD | -7.3 |
| JAK2 | Tyrosine-protein kinase JAK2 | 6E2Q | -9.5 |
| MAPK14 | Mitogen-activated protein kinase 14 | 5ETI | -8.1 |
Figure 8.

The molecular docking mode. (A) Icariin-MAPK1, (B) Icariin-SRC, (C) Icariin-JAK2, (D) Icariin-PTPN11.
Discussion
Network pharmacology is a subject that combines bioinformatics with a systematic method for analyzing illness, targets, and drug interactions based on a network. It has effectively contributed to the research of herbal compounds and monomers [22,23]. For this reason, herbal medicines have been used extensively to treat related diseases by anticipating their mechanisms of action. In this study, a biologic network analysis was used to investigate Icariin’s basic mechanism of action for treating osteoarthritis (OA) and a molecular docking study was done to confirm this mechanism.
To further research the primary targets of Icariin acting on OA, these findings revealed an Icariin-OA protein interaction network, and the top ten core targets were SRC, MAPK1, HSP90AA1, PTPN11, ESR1, EGFR, RhoA, JAK2, and MAPK14. Src kinases should serve an important physiological role in controlling cartilage survival, as accumulating data reveals. It has been suggested that inhibiting SRC activity may be an effective strategy for maintaining or inducing chondrocyte phenotypes, such as in vitro cartilage formation in tissue engineering approaches or preventing cartilage loss in OA patients, suggesting that they may be targets for chondrogenesis in OA therapeutic applications and tissue engineering [24]. In the pathogenesis of OA, Tao et al. [25] demonstrated that protein tyrosine phosphatases with the SRC homology 2 structural domain (SHP2) can bind directly to β-catenin, promoting the Wnt/β-catenin signaling pathway. MAPK1 (extracellular signal-regulated kinase 2) belongs to the MAP kinase family. Under the combined action of inflammatory responses, phosphorylation of MAPK1 can increase chondrocyte hypertrophy and differentiation and induce death in chondrocytes. MAPK1 has been identified as a miR-186-5p target gene that is controlled by miR-186-5p. By enhancing MAPK1 expression, miR-186-5p can attenuate IL1B-induced inflammatory damage in chondrocytes [26]. In addition, serine/threonine protein kinase 1 (AKT1) contributes significantly to the protein interaction network. In a mouse model of OA, active AKT1 dramatically suppressed the nucleotide expression of pyrophosphatase/phosphodiesterase 1, a critical inhibitor of calcification, resulting in the production of calcified bone [27].
By analyzing functional enrichment, we can uncover how gene products interact with each other and further investigate Icariin’s mechanism of action for OA treatment. GO and KEGG enrichment analyses revealed that a large number of GO functions and KEGG pathways linked to OA were substantially enriched, with the FOXO signaling pathway, estrogen signaling pathway, RAS signaling pathway, and PI3K/Akt signaling pathway being the most enriched KEGG pathways. As we age, we are more likely to develop OA. FOXO transcription factors protect against aging on a cellular and systemic level. In cartilage, FoxO expression decreases with age and osteoarthritis [28,29]. A study by Tokio et al. [30] showed that overexpression of FoxO1 reduced inflammatory mediator production in OA chondrocytes and cartilage degradation. Additionally, FoxO1 inhibits the production of interleukin-1 and elevated protective genes. FOXO is essential for the formation, maturation, and homeostasis of postnatal cartilage and protects against OA-related cartilage damage, suggesting that FOXO factor may be a target for the treatment of OA. Estrogen deprivation is a risk factor for OA. Estrogen suppresses the expression of NGF mRNA in rat cartilage via ER, hence reducing the production of NGF mRNA. Renin, ACE, Ang II, AT1R, and AT2RR are key components of the Ras signaling system, which are implicated in OA-related inflammation and chondrocyte hypertrophy. NF-B, JNK, VEGFR/Tie-2, and AXNA2/AXNA2R axis signaling pathways are engaged in the Ras signaling pathway and may be targets for the therapy of osteoarthritis (OA) [31]. Tang et al. [32] demonstrated that Icariin decreased the death rate of OA chondrocytes and increased autophagy-related genes, therefore inhibiting the PI3K/Akt/mTOR signaling pathway. With the activation of autophagy and the suppression of the PI3K signaling pathway in cartilage tissue [33], Icariin considerably ameliorated the severe degenerative condition of OA cartilage tissue. It is possible that icariin inhibits chondrocyte autophagy by changing PI3K/Akt/mTOR signaling pathways, which could lower the incidence of osteoarthritis.
Using a network pharmacology method, we demonstrated that Icariin treats osteoarthritis by targeting multiple components, multiple targets, and multiple pathways (OA). Icariin’s compound-target-pathway-disease network along with its protein interaction network were then created for the treatment of osteoarthritis. Icariin exerts its effects primarily via relevant targets and pathways, such as apoptosis, cell differentiation, cell proliferation, and the inflammatory response, as delineated by the results. In addition to identifying many possible therapeutic targets for osteoarthritis, this study may also aid in the development of novel treatments for the disease. The validation of relevant signaling pathways through animal experiments is the direction of future research by the group team, and more in-depth animal and cellular experiments will be conducted to validate the mechanism of action of Icariin for the treatment of OA and provide a more solid theoretical basis for the rational design of clinical trials.
Acknowledgements
This work was supported by the Science and Technology Innovation Project of China Academy of Chinese Medical Sciences [CI2021A02003].
Disclosure of conflict of interest
None.
References
- 1.Lawson TB, Mäkelä JTA, Klein T, Snyder BD, Grinstaff MW. Nanotechnology and osteoarthritis; part 1: clinical landscape and opportunities for advanced diagnostics. J Orthop Res. 2021;39:465–472. doi: 10.1002/jor.24817. [DOI] [PubMed] [Google Scholar]
- 2.Loeser RF, Goldring SR, Scanzello CR, Goldring MB. Osteoarthritis: a disease of the joint as an organ. Arthritis Rheum. 2012;64:1697–707. doi: 10.1002/art.34453. [DOI] [PMC free article] [PubMed] [Google Scholar]
- 3.Robinson WH, Lepus CM, Wang Q, Raghu H, Mao R, Lindstrom TM, Sokolove J. Low-grade inflammation as a key mediator of the pathogenesis of osteoarthritis. Nat Rev Rheumatol. 2016;12:580–92. doi: 10.1038/nrrheum.2016.136. [DOI] [PMC free article] [PubMed] [Google Scholar]
- 4.Ishijima M, Nakamura T, Shimizu K, Hayashi K, Kikuchi H, Soen S, Omori G, Yamashita T, Uchio Y, Chiba J, Ideno Y, Kubota M, Kurosawa H, Kaneko K Research Group of Cartilage Metabolism. Intra-articular hyaluronic acid injection versus oral non-steroidal anti-inflammatory drug for the treatment of knee osteoarthritis: a multi-center, randomized, open-label, non-inferiority trial. Arthritis Res Ther. 2014;16:R18. doi: 10.1186/ar4446. [DOI] [PMC free article] [PubMed] [Google Scholar]
- 5.Kolasinski SL, Neogi T, Hochberg MC, Oatis C, Guyatt G, Block J, Callahan L, Copenhaver C, Dodge C, Felson D, Gellar K, Harvey WF, Hawker G, Herzig E, Kwoh CK, Nelson AE, Samuels J, Scanzello C, White D, Wise B, Altman RD, DiRenzo D, Fontanarosa J, Giradi G, Ishimori M, Misra D, Shah AA, Shmagel AK, Thoma LM, Turgunbaev M, Turner AS, Reston J. 2019 American College of Rheumatology/Arthritis foundation guideline for the management of osteoarthritis of the hand, hip, and knee. Arthritis Care Res (Hoboken) 2020;72:149–162. doi: 10.1002/acr.24131. [DOI] [PMC free article] [PubMed] [Google Scholar]
- 6.Pradelli L, Sinigaglia T, Migliore A, Checchia GA, Franceschi F, Frediani B, Iannone F, Romanini E. Non-surgical treatment of knee osteoarthritis: multidisciplinary Italian consensus on best practice. Ther Clin Risk Manag. 2021;17:507–530. doi: 10.2147/TCRM.S288196. [DOI] [PMC free article] [PubMed] [Google Scholar]
- 7.Kielly J, Davis EM, Marra C. Practice guidelines for pharmacists: the management of osteoarthritis. Can Pharm J (Ott) 2017;150:156–168. doi: 10.1177/1715163517702168. [DOI] [PMC free article] [PubMed] [Google Scholar]
- 8.Barcella CA, Lamberts M, McGettigan P, Fosbøl EL, Lindhardsen J, Torp-Pedersen C, Gislason GH, Olsen AS. Differences in cardiovascular safety with non-steroidal anti-inflammatory drug therapy-a nationwide study in patients with osteoarthritis. Basic Clin Pharmacol Toxicol. 2019;124:629–641. doi: 10.1111/bcpt.13182. [DOI] [PubMed] [Google Scholar]
- 9.Pelletier JP, Martel-Pelletier J, Rannou F, Cooper C. Efficacy and safety of oral NSAIDs and analgesics in the management of osteoarthritis: evidence from real-life setting trials and surveys. Semin Arthritis Rheum. 2016;45(Suppl):S22–7. doi: 10.1016/j.semarthrit.2015.11.009. [DOI] [PubMed] [Google Scholar]
- 10.Li X, Xu Y, Li H, Jia L, Wang J, Liang S, Cai A, Tan X, Wang L, Wang X, Huang Y, Tao E, Ye H, Asakawa T. Verification of pain-related neuromodulation mechanisms of icariin in knee osteoarthritis. Biomed Pharmacother. 2021;144:112259. doi: 10.1016/j.biopha.2021.112259. [DOI] [PubMed] [Google Scholar]
- 11.Wang P, Xiong X, Zhang J, Qin S, Wang W, Liu Z. Icariin increases chondrocyte vitality by promoting hypoxia-inducible factor-1α expression and anaerobic glycolysis. Knee. 2020;27:18–25. doi: 10.1016/j.knee.2019.09.012. [DOI] [PubMed] [Google Scholar]
- 12.Liu CX, Liu R, Fan HR, Xiao XF, Chen XP, Xu HY, Lin YP. Network pharmacology bridges traditional application and modern development of traditional Chinese medicine. Chin Herbal Med. 2015;7:3–17. [Google Scholar]
- 13.Kim S, Thiessen PA, Bolton EE, Chen J, Fu G, Gindulyte A, Han L, He J, He S, Shoemaker BA, Wang J, Yu B, Zhang J, Bryant SH. PubChem substance and compound databases. Nucleic Acids Res. 2016;44:D1202–13. doi: 10.1093/nar/gkv951. [DOI] [PMC free article] [PubMed] [Google Scholar]
- 14.Wang X, Shen Y, Wang S, Li S, Zhang W, Liu X, Lai L, Pei J, Li H. PharmMapper 2017 update: a web server for potential drug target identification with a comprehensive target pharmacophore database. Nucleic Acids Res. 2017;45:W356–W360. doi: 10.1093/nar/gkx374. [DOI] [PMC free article] [PubMed] [Google Scholar]
- 15.UniProt Consortium. UniProt: a worldwide hub of protein knowledge. Nucleic Acids Res. 2019;47:D506–D515. doi: 10.1093/nar/gky1049. [DOI] [PMC free article] [PubMed] [Google Scholar]
- 16.Barrett T, Wilhite SE, Ledoux P, Evangelista C, Kim IF, Tomashevsky M, Marshall KA, Phillippy KH, Sherman PM, Holko M, Yefanov A, Lee H, Zhang N, Robertson CL, Serova N, Davis S, Soboleva A. NCBI GEO: archive for functional genomics data sets--update. Nucleic Acids Res. 2013;41:D991–5. doi: 10.1093/nar/gks1193. [DOI] [PMC free article] [PubMed] [Google Scholar]
- 17.Stelzer G, Rosen N, Plaschkes I, Zimmerman S, Twik M, Fishilevich S, Stein TI, Nudel R, Lieder I, Mazor Y, Kaplan S, Dahary D, Warshawsky D, Guan-Golan Y, Kohn A, Rappaport N, Safran M, Lancet D. The genecards suite: from gene data mining to disease genome sequence analyses. Curr Protoc Bioinformatics. 2016;54:1.30.1–1.30.33. doi: 10.1002/cpbi.5. [DOI] [PubMed] [Google Scholar]
- 18.Amberger JS, Hamosh A. Searching online mendelian inheritance in man (OMIM): a knowledgebase of human genes and genetic phenotypes. Curr Protoc Bioinformatics. 2017;58:1.2.1–1.2.12. doi: 10.1002/cpbi.27. [DOI] [PMC free article] [PubMed] [Google Scholar]
- 19.Zhu F, Han B, Kumar P, Liu X, Ma X, Wei X, Huang L, Guo Y, Han L, Zheng C, Chen Y. Update of TTD: therapeutic target database. Nucleic Acids Res. 2010;38:D787–91. doi: 10.1093/nar/gkp1014. [DOI] [PMC free article] [PubMed] [Google Scholar]
- 20.Szklarczyk D, Gable AL, Lyon D, Junge A, Wyder S, Huerta-Cepas J, Simonovic M, Doncheva NT, Morris JH, Bork P, Jensen LJ, Mering CV. STRING v11: protein-protein association networks with increased coverage, supporting functional discovery in genome-wide experimental datasets. Nucleic Acids Res. 2019;47:D607–D613. doi: 10.1093/nar/gky1131. [DOI] [PMC free article] [PubMed] [Google Scholar]
- 21.Pagadala NS, Syed K, Tuszynski J. Software for molecular docking: a review. Biophys Rev. 2017;9:91–102. doi: 10.1007/s12551-016-0247-1. [DOI] [PMC free article] [PubMed] [Google Scholar]
- 22.Wang S, Ma J, Zeng Y, Zhou G, Wang Y, Zhou W, Sun X, Wu M. Icariin, an up-and-coming bioactive compound against neurological diseases: network pharmacology-based study and literature review. Drug Des Devel Ther. 2021;15:3619–3641. doi: 10.2147/DDDT.S310686. [DOI] [PMC free article] [PubMed] [Google Scholar]
- 23.Zhu W, Li Y, Zhao J, Wang Y, Li Y, Wang Y. The mechanism of triptolide in the treatment of connective tissue disease-related interstitial lung disease based on network pharmacology and molecular docking. Ann Med. 2022;54:541–552. doi: 10.1080/07853890.2022.2034931. [DOI] [PMC free article] [PubMed] [Google Scholar]
- 24.Bursell L, Woods A, James CG, Pala D, Leask A, Beier F. Src kinase inhibition promotes the chondrocyte phenotype. Arthritis Res Ther. 2007;9:R105. doi: 10.1186/ar2308. [DOI] [PMC free article] [PubMed] [Google Scholar]
- 25.Tao T, Luo D, Gao C, Liu H, Lei Z, Liu W, Zhou C, Qi D, Deng Z, Sun X, Xiao J. Src homology 2 domain-containing protein tyrosine phosphatase promotes inflammation and accelerates osteoarthritis by activating β-catenin. Front Cell Dev Biol. 2021;9:646386. doi: 10.3389/fcell.2021.646386. [DOI] [PMC free article] [PubMed] [Google Scholar]
- 26.Li Q, Wu M, Fang G, Li K, Cui W, Li L, Li X, Wang J, Cang Y. MicroRNA-186-5p downregulation inhibits osteoarthritis development by targeting MAPK1. Mol Med Rep. 2021;23:253. doi: 10.3892/mmr.2021.11892. [DOI] [PMC free article] [PubMed] [Google Scholar]
- 27.Fukai A, Kawamura N, Saito T, Oshima Y, Ikeda T, Kugimiya F, Higashikawa A, Yano F, Ogata N, Nakamura K, Chung UI, Kawaguchi H. Akt1 in murine chondrocytes controls cartilage calcification during endochondral ossification under physiologic and pathologic conditions. Arthritis Rheum. 2010;62:826–36. doi: 10.1002/art.27296. [DOI] [PubMed] [Google Scholar]
- 28.Caramés B, Taniguchi N, Otsuki S, Blanco FJ, Lotz M. Autophagy is a protective mechanism in normal cartilage, and its aging-related loss is linked with cell death and osteoarthritis. Arthritis Rheum. 2010;62:791–801. doi: 10.1002/art.27305. [DOI] [PMC free article] [PubMed] [Google Scholar]
- 29.Lee KI, Choi S, Matsuzaki T, Alvarez-Garcia O, Olmer M, Grogan SP, D’Lima DD, Lotz MK. FOXO1 and FOXO3 transcription factors have unique functions in meniscus development and homeostasis during aging and osteoarthritis. Proc Natl Acad Sci U S A. 2020;117:3135–3143. doi: 10.1073/pnas.1918673117. [DOI] [PMC free article] [PubMed] [Google Scholar]
- 30.Matsuzaki T, Alvarez-Garcia O, Mokuda S, Nagira K, Olmer M, Gamini R, Miyata K, Akasaki Y, Su AI, Asahara H, Lotz MK. FoxO transcription factors modulate autophagy and proteoglycan 4 in cartilage homeostasis and osteoarthritis. Sci Transl Med. 2018;10:eaan0746. doi: 10.1126/scitranslmed.aan0746. [DOI] [PMC free article] [PubMed] [Google Scholar]
- 31.Shang X, Zhang L, Jin R, Yang H, Tao H. Estrogen regulation of the expression of pain factor NGF in rat chondrocytes. J Pain Res. 2021;14:931–940. doi: 10.2147/JPR.S297442. [DOI] [PMC free article] [PubMed] [Google Scholar]
- 32.Wu Y, Lu X, Li M, Zeng J, Zeng J, Shen B, Zeng Y. Renin-angiotensin system in osteoarthritis: a new potential therapy. Int Immunopharmacol. 2019;75:105796. doi: 10.1016/j.intimp.2019.105796. [DOI] [PubMed] [Google Scholar]
- 33.Tang Y, Li Y, Xin D, Chen L, Xiong Z, Yu X. Icariin alleviates osteoarthritis by regulating autophagy of chondrocytes by mediating PI3K/AKT/mTOR signaling. Bioengineered. 2021;12:2984–2999. doi: 10.1080/21655979.2021.1943602. [DOI] [PMC free article] [PubMed] [Google Scholar]