Abstract
Background
Identifying response markers is highly needed to guide the treatment strategy in patients with metastatic melanoma.
Methods
A retrospective study was carried out in patients with unresectable/metastatic melanoma (stage IIIb–IV), treated with anti-PD-1 in the first line setting, to better explore the role and the timing of neutrophil/lymphocyte ratio (NLR) as potential biomarker of response. The relationship of NLR with inflammation-immune mediators and the underlying negative effect of raising NLR during immunotherapy, have been investigated with transcriptomic gene analysis.
Results
The results confirmed previous findings that a high baseline NLR is associated with a poorer prognosis and with higher serum level of lactate dehydrogenase (LDH), regardless of the presence of brain metastases. The transcriptomic analysis showed that high baseline NLR is associated with a characteristic gene signature CCNA1, LDHA and IL18R1, which correlates with inflammation and tumorigenesis. Conversely, low baseline NLR is associated with the signature CD3, SH2D1A, ZAP70 and CD45RA, linked to the immune-activation. The genes positively associated with NLR (CD39 (ENTPD1), PTEN, MYD88, MMP9 and LDH) are involved in processes of immunosuppression, inflammation and tumor-promoting activity. Increased expression of CD39 correlated with TGFβ2, a marker of the N2 neutrophils with immunosuppressive activity.
Conclusions
These results suggest that increasing NLR is associated with an increased neutrophil population, with polarization to the N2 phenotype, and this process may be the basis for the negatively prognostic role of NLR.
Supplementary Information
The online version contains supplementary material available at 10.1186/s12967-023-04419-6.
Keywords: Melanoma, NLR, CD39, HDLA, TGFβ, Biomarker, Gene signature, Transcriptomic analysis, Brain metastases
Background
The improvement of survival outcomes in patients with advanced melanoma due to the introduction of immune checkpoint inhibitors (ICIs) and targeted therapy (TT) for BRAF mutated melanoma, is undoubtedly very remarkable; nevertheless a proportion of patients still have poor prognosis [1–3]. Therefore, a growing line of research is focusing on the identification of potential biomarkers that may guide the treatment strategy [4–6].
Immunosuppression in the tumor microenvironment, induced by systemic and chronic inflammation and mediated by several types of circulating cells, is a known factor that favors tumor growth and cancer cell migration [7]. Several parameters of immune activity and inflammation have been investigated as candidate markers for prognosis or treatment effect; in this context, some studies have demonstrated that an elevated neutrophil-to-lymphocyte ratio (NLR) predicts poor outcomes in patients with solid cancers [8]. More recently, elevated NLR, as well as elevated derived NLR that is calculated from absolute neutrophil count (ANC) and white cell count, were found to be independent predictors of reduced survival and increased risk of progression in melanoma patients receiving ipilimumab or nivolumab [9, 10]. Conversely, patients with metastatic melanoma, who developed immune-related adverse events while treated with ICIs, had an increased response rate if the NLR was elevated [11]. Overall, current evidences suggest that NLR may be used to predict response to immunotherapy in melanoma patients, although its timing may be further investigated. Additionally, in patients with advanced BRAF wild-type melanoma, the concomitance of basal elevated lactate dehydrogenase (LDH) and NLR increasing on treatment with ICIs has been associated with reduced progression-free survival (PFS) [12]. This result confirmed previous reports of LDH as a negative prognostic marker in immunotherapy for melanoma [13, 14].
With the aim to better explore the relationship of NLR with inflammation-immune mediators and the underlying negative effect of raising NLR during immunotherapy, we carried on a transcriptomic gene analysis of peripheral blood mononuclear cells (PBMC) from patients with metastatic melanoma treated with anti-PD1 agent.
Patients and methods
Patients
A retrospective study was carried out at Istituto Nazionale Tumori—IRCCS—Fondazione “G. Pascale,” Naples, Italy. The study was approved by the Ethics Committee of Istituto Nazionale Tumori—IRCCS—Fondazione “G. Pascale”, Naples, Italy, protocol number 17/17 oss. The study was performed in accordance with the revised version of the declaration of Helsinki (52nd WMA General Assembly, Edinburgh, Scotland, October 2000).
Consecutive adult patients with histologically confirmed unresectable/metastatic melanoma (stage IIIb–IV according to American Joint Committee on Cancer AJCC 7th Edition), treated with anti-PD-1 agent in the first line setting between April 2016 and June 2018, were included in the analysis. All patients provided their written informed consent.
Methods
Survival outcomes measures
RECIST 1.1 criteria were used to radiologically evaluate the tumor response as complete response (CR), partial response (PR), stable disease (SD), or progressive disease (PD). The following parameters were recorded: response rate (RR) at first assessment; progression free survival (PFS)—calculated from the time of the first dose of anti-PD-1 agent to radiological progression, death or lost to follow-up, whichever occurred first; overall survival (OS) calculated from the time of the first dose of anti-PD1 agent to death or lost-to-follow-up, whichever occurred first; disease control rate (DCR) defined as the sum of CR, PR, and SD > 1 year); objective response rate (ORR) defined as the sum of CR and PR). Response was evaluated based on DCR: patients with SD < 1 year were classified as non-responders, patients with SD ≥ 1 year were classified as responders.
Bio-umoral analysis
LDH serum level and NLR were assessed at baseline; NLR was recorded after 3 months of treatment with anti-PD-1 ICI. Blood samples from enrolled patients were collected at baseline to conduct a gene profile analysis. RNA from PBMCs was extracted using RNA blood mini-Kit (Qiagen). Purified RNA was used for hybridization and underwent to gene profiling analysis on NanoString nCounter through PanCancer IO 360™ panel, characterized by human genes associated with immune activation, inflammation and control of the cell cycle. Gene data were normalized using nSolver Version 4.0 Software; NanoString. Counts were normalized to External RNA Controls Consortium (ERCC) technical controls and 30 housekeeping genes.
Statistical analysis
Continuous variables were reported as either the means and standard deviation or median and interquartile ranges (IQRs) according to their distribution, as assessed by the Shapiro–Wilk normality test. Categorical variables were reported as percentages. Differences in characteristics of patients between the groups of low and high NLR were tested by t-test or Wilcoxon test (according to their distribution) and Pearson chi-squared test for continuous and categorical variables, respectively. To measure the linear association between continuous variables, the Pearson correlation coefficient was used if variables had a normal distribution; otherwise, the Spearman’s correlation coefficient was calculated.
PFS and OS were outcome survival measures to assess differences in prognosis according to groups of low and high NLR. The optimal cut-point to define the low and high NLR subgroups was selected through the log-rank test maximization performed by a cross-validation approach. The differences in prognosis between the low NLR group and high NLR group were tested by log-rank test and represented by Kaplan–Meier curves. The inverse Kaplan–Meier approach estimated median follow-up.
The discriminant analysis for sparse data performed via partial least squares procedure (sPLS-DA) was applied to identify gene signatures associated with the NLR groups. The sparse variant of PLS-DA enables the selection of the most predictive or discriminative features in the data to classify the samples [15]. sPLS-DA performs variable selection and classification in a one-step procedure, where the lasso penalization applies only to the loading vector associated with the X data set. In particular, sPLS-DA is a versatile algorithm that can be used for predictive and descriptive modeling and discriminative variable selection when the matrix of predictors has more variables than observations and when there is multicollinearity among variables. The principal outputs of this statistical model consist in (i) a set of latent scores (i.e., components or signature score) that are defined as a linear combination of the original variables projected in a new subspace and in (ii) a loadings matrix to define the relationships among the variables and the components.
To select the optimal number of sPLS-components, a cross-validation approach was performed to maximize the area under curve (AUC) of the Receiver Operating Characteristic (ROC). Finally, to validate the selection of the genes identified through the maximum relationship with the sPLS-components, a Principal Component Analysis (PCA) on this gene set was performed. In particular, the genes with the lowest explained variance on the first PCA component were discarded.
Results
Overall, 78 patients were included in the analysis. Demographic and baseline clinical data are reported in Table 1. Briefly, 37 patients (53%) were males, the median age was 61 years (range, 27–91 years), 19 (24%) patients had brain metastases, 59 (76%) had BRAF wild-type melanoma and 16 (21%) had BRAF mutations, while BRAF status was not known for 3 patients. Fifty-two patients (67%) received nivolumab, while the remaining 26 (33%) received Pembrolizumab.
Table 1.
Patient characteristics
| Characteristics | n = 78, n (%) |
|---|---|
| Age (years), median (range) | 61 (27–91) |
| Gender: | |
| • Female | 41 (53) |
| • Male | 37 (47) |
| Melanoma AJCC VII stage: | |
| • Stage IV | 74 (94) |
| • Stage IIIC | 4 (5) |
| • Stage IIIB | 1 (1) |
| Brain metastases at baseline | 18 (23) |
| BRAF status: | |
| • Wild-type | 59 (76) |
| • Mutation | 16 (21) |
| • NA | 3 (3) |
| M category: | |
| • M0 | 3 (4) |
| • M1a | 11 (14) |
| • M1b | 10 (13) |
| • M1c | 54 (69) |
| LDH: | |
| • High | 26 (33) |
| • Normal | 34 (44) |
| • NA | 18 (23) |
The optimal cut-point to define the low and high NLR subgroups was 5.57 (Additional file 1: Figure S1). At baseline, the NLR was < 5.57 (low) in 66 (84.6%) patients and ≥ 5.57 (high) in 12 (15.4%), while the serum LDH level was normal in 34 (44%) patients and high in 26 (33%). There were no differences in age, gender, body mass index (BMI), BRAF mutation, M category, LDH level, and glycemia between patients with high and low NLR. Serum level of LDH was positively associated with NLR value at baseline (rho 0.268, 95% CI 0.0148–0.488, p = 0.0386).
Brain metastases were present at baseline in a higher proportion of patients with high NLR compared to those with low NLR [7 (58.3%) patients vs 12 (18.2%); p = 0.01].
Response disease and survival outcomes
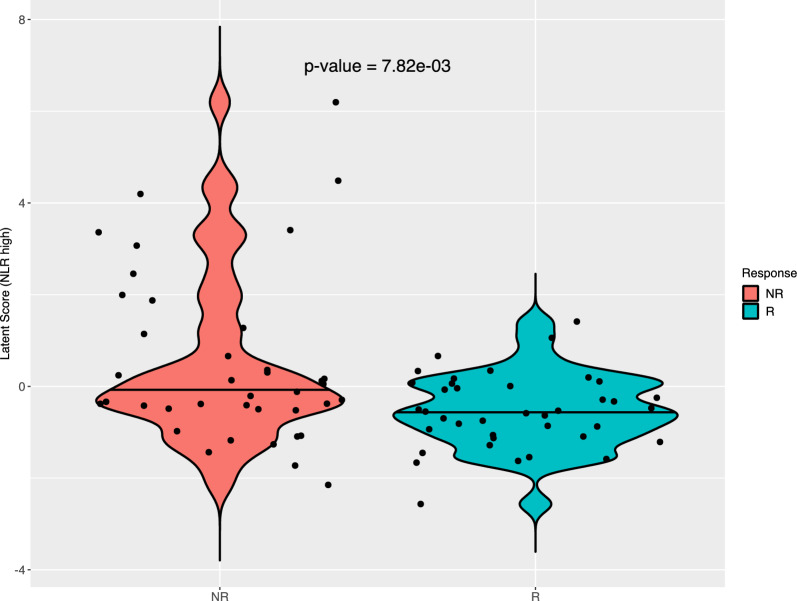
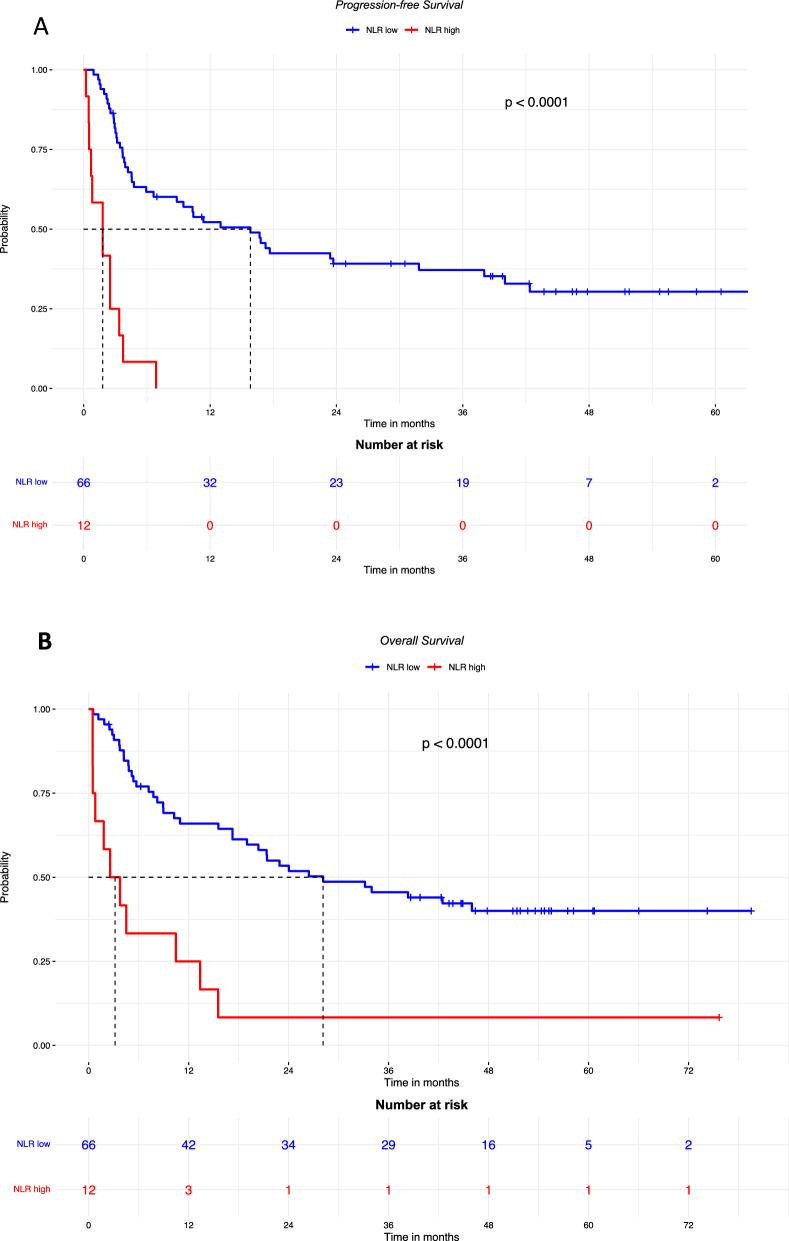
At the first assessment after 3 months of treatment, 9 (11%) patients achieved CR, 16 (21%) PR with an ORR of 32%, 17 (23%) SD with a DCR of 50% and 36 (46%) PD [Table 2]. Skin toxicity was recorded in 29 patients with low NLR (49.9%) and 1 with high NLR (8.3%) (p = 0.04), we did not observe any significant differences in other toxicities (Additional file 1: Table S1). High NLR was significantly more frequent in patients who had not responded to treatment (p = 0.00782) (Fig. 1). Patients with high basal NLR had shorter PFS and OS than those with low basal NLR with HR = 7.27 (95% CI 3.57–14.81; p < 0.0001) (Fig. 2A) and HR = 3.98 (95% CI 2.00–7.91) (Fig. 2B), respectively.
Table 2.
Response to treatment at 3 months
| Response to treatment | n = 78, n (%) |
|---|---|
| Response at first assessment: | |
| • Complete response | 9 (11) |
| • Partial response | 16 (21) |
| • Stable disease | 17 (22) |
| • Progression disease | 36 (46) |
| ORR | 25 (32) |
| DCR | 39 (50) |
Fig. 1.
NLR according to response to treatment, at 3 months
Fig. 2.
PFS (A) and OS (B) in patients with high or low baseline NLR. PFS: median follow-up was 54.7 months in patients with low NLR, and was not available for those with high NLR. OS: median follow-up was 51.8 months in patients with low NLR, and 75.7 months for those with high NLR
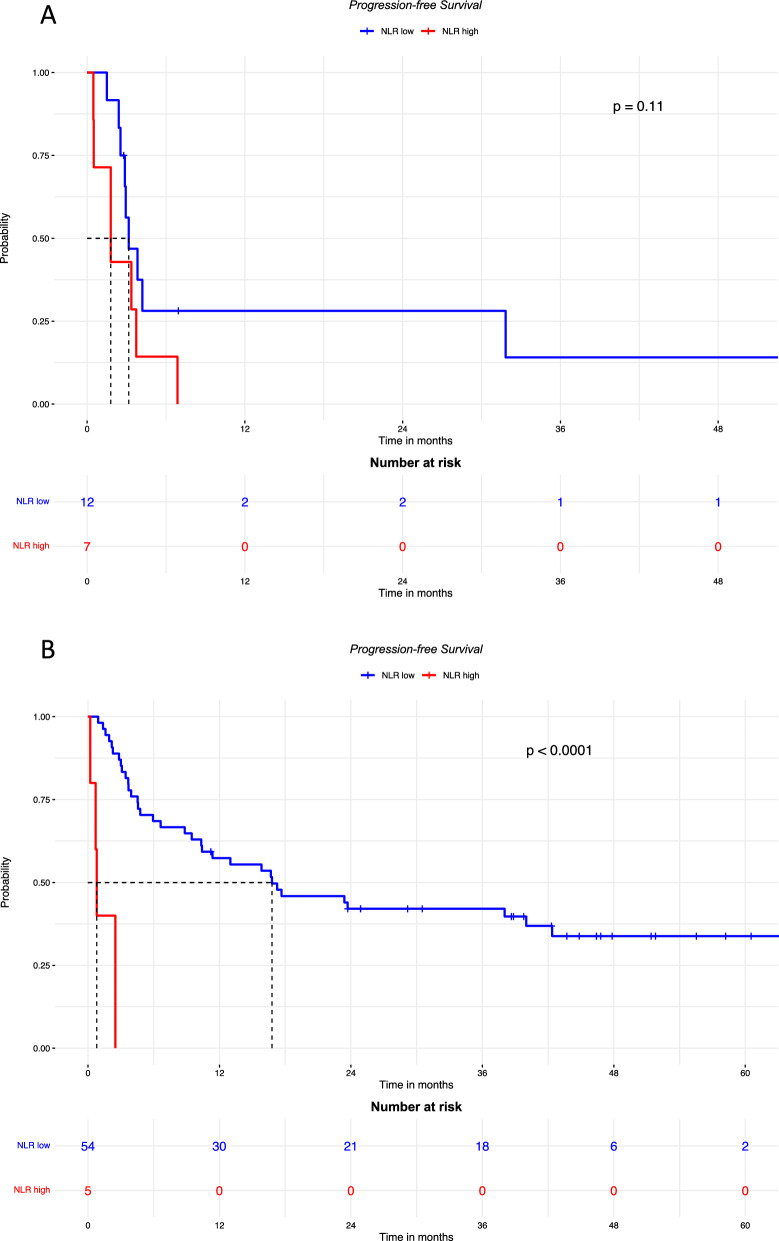
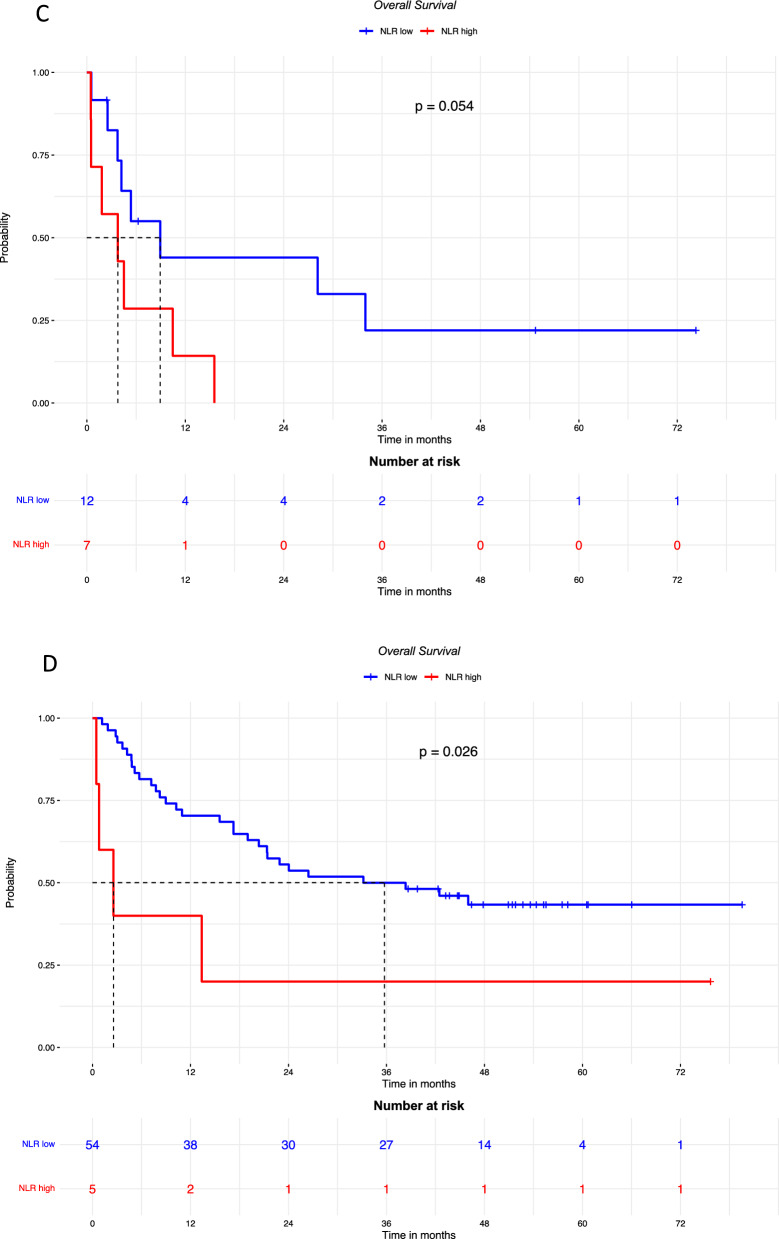
As high NLR is known to be associated with brain metastases present at baseline or subsequently [16, 17], we decided to rule out a possible role of brain metastases in the negative correlation of NLR with prognostic parameters, and the subgroups of patients with and without brain metastases were analyzed. As shown in Fig. 3, the PFS in patients with brain metastases was not significantly different according to NLR level and the HR for high NLR was 2.28 [95% CI 0.82–6.37 (p = 0.11)]. On the contrary, PFS was significantly poorer in patients without brain metastases if NLR was high compared to low NLR (HR 18.93 [95% CI 5.66–63.27] p < 0.0001).
Fig. 3.
PFS in patients with brain metastases (A; median follow-up was 54.7 months in patients with low NLR, and was not available for those with high NLR) and without brain metastases (B; median follow-up was 44.8 months in patients with low NLR, and was not available for those with high NLR); OS in patients with brain metastases (C; median follow-up was 54.7 months in patients with low NLR, and was not available for those with high NLR) and without brain metastases (D; median follow-up was 51.8 months in patients with low NLR, and 75.7 months in those with high NLR), according to high or low baseline NLR
The OS was poorer in the groups with high NLR both in patients with brain metastases (HR: 2.81 [95% CI 0.94–8.40] p = 0.054), and in those without brain metastases (HR 3.09 [95% CI 1.08–8.81] p = 0.026).
To evaluate the effect of an increased NLR after 3 months of treatment compared to baseline, the NLRpost/NLRbaseline ratio was calculated and the optimal cut-point (i.e. 0.76) to define the subgroups of increased NLR vs no increase was identified (Additional file 1: Figure S2).
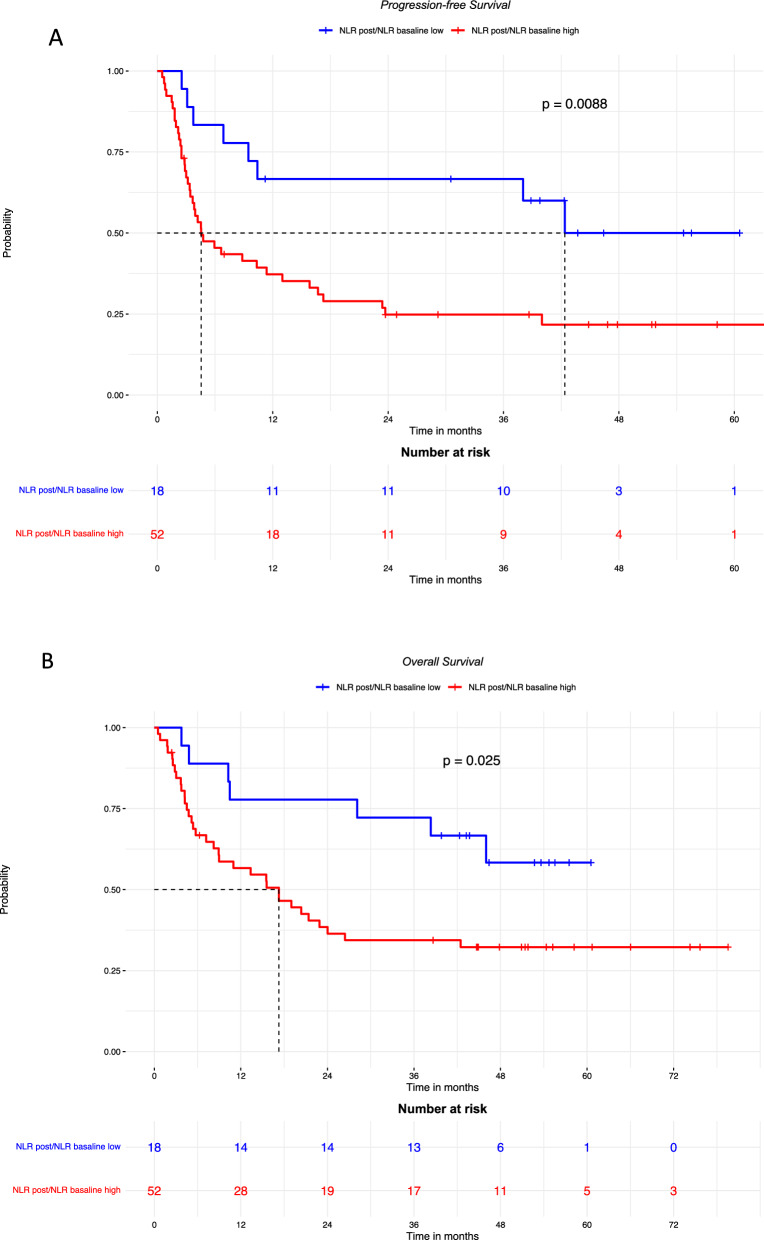
The patients who had a high NLRpost/NLRbaseline (≥ 0.76) had poorer PFS and OS compared to those whose NLR did not increase after treatment (Fig. 4A, B).
Fig. 4.
PFS (A; median follow-up was 43.7 months in patients with low NLR, and 46.8 months those with high NLR.) and OS (B; median follow-up was 52.7 months in patients with low NLR, and 51.8 months in those with high NLR.) according to rising or consistent LNR after 3 months of treatment
Transcriptomic analysis
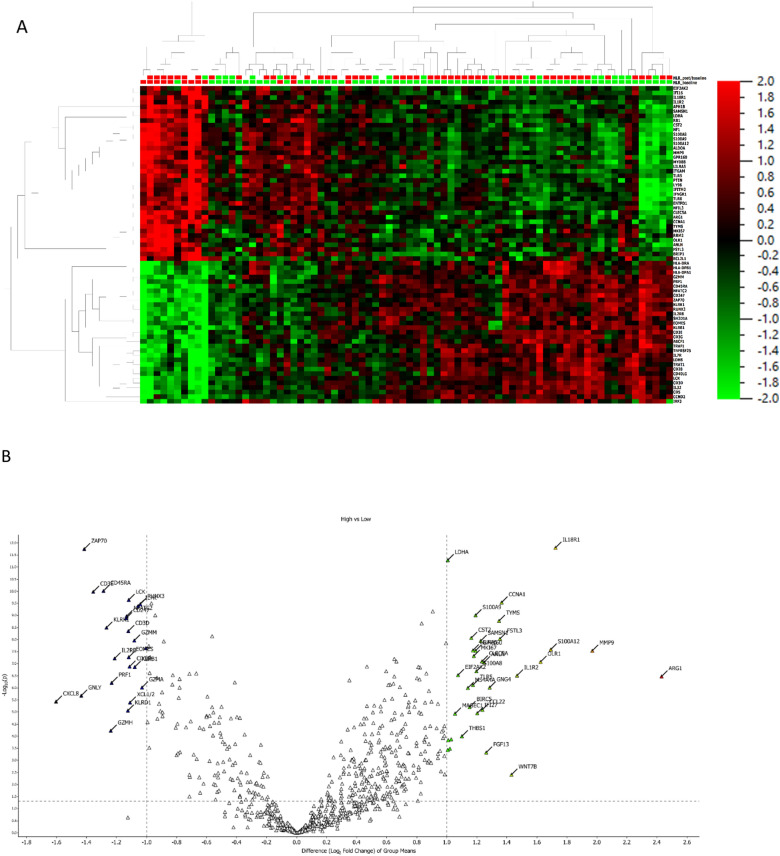
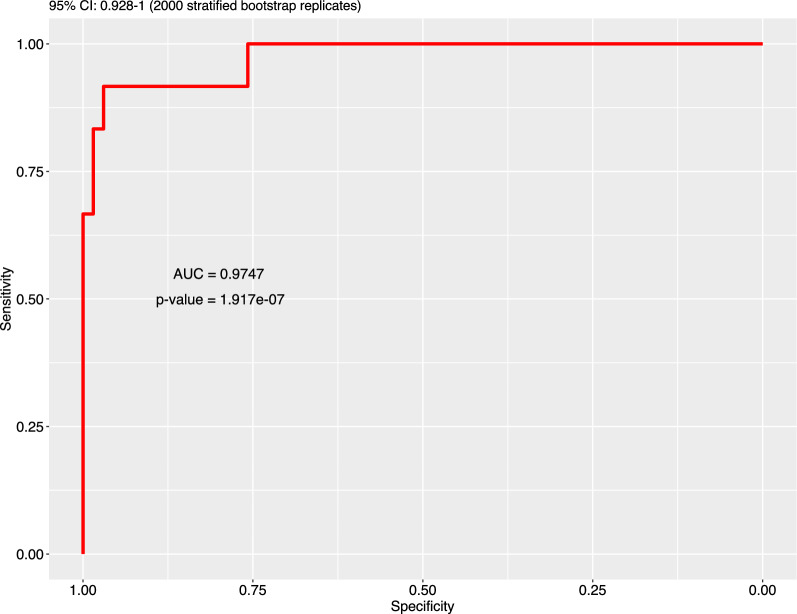
The transcriptomic analysis of PBMCs obtained at baseline identified a set of an optimized number of genes positively or negatively associated with NLR at baseline (Fig. 5 A, B; Additional file 1: Figures S3, S4, S5 and S6, Table S2) (Table 3). A gene signature was validated through a ROC curve (Fig. 6).
Fig. 5.
Transcriptomic analysis of PBMC obtained at baseline, according to NLR. A heat map representation. B Volcan plot; p values are reported on the Y axis; values reported over the orizontal dotted line are significant
Table 3.
Association of gene expression with NLR, at baseline
| Gene | n | Rho | p-value |
|---|---|---|---|
| Positively associated with NLR | |||
| CD39 (ENTPD1) | 78 | 0.663 | < 0.0001 |
| PTEN | 78 | 0.034 | < 0.0001 |
| MYD88 | 78 | 0.662 | < 0.0001 |
| MMP9 | 78 | 0.749 | < 0.0001 |
| Negatively associated with NLR | |||
| HLA-DRA | 78 | −0.473 | < 0.0001 |
| HLA-DPB1 | 78 | −0.547 | < 0.0001 |
| HLA-DPA1 | 78 | −0.558 | < 0.0001 |
| CD5 | 78 | −0.557 | < 0.0001 |
| CD28 | 78 | −0.578 | < 0.0001 |
| NFATC2 | 78 | −0.660 | < 0.0001 |
| CD247 | 78 | −0.610 | < 0.0001 |
| ZAP70 | 78 | −0.723 | < 0.0001 |
| IL2RB | 78 | −0.499 | < 0.0001 |
| CD3E | 78 | −0.532 | < 0.0001 |
| CD3G | 78 | −0.558 | < 0.0001 |
| IL7R | 78 | −0.620 | < 0.0001 |
| TRAT1 | 78 | −0.515 | < 0.0001 |
| CD40LG | 78 | −0.537 | < 0.0001 |
| CD3D | 78 | −0.525 | < 0.0001 |
| IL32 | 78 | −0.511 | < 0.0001 |
Fig. 6.
Accuracy of gene selection, through latent score, for baseline NLR
The gene signature CD3, SH2D1A, ZAP70 and CD45RA was associated with a low baseline NLR, while a high baseline NLR was associated with CCNA1, LDHA and IL18R1.
CD3E, SH2D1A, ZAP70, and CD45RA were more represented at baseline in patients who responded to treatment at 3 months than in non-responders, while CCNA1, LDHA and IL18R1 were more expressed by no-responders (Additional file 1: Figure S7).
In addition, NLR was positively associated with genes related to immunosuppression, inflammation and tumorigenesis: CD39 (ENTPD1), PTEN, MYD88, MMP9 and LDH. NLR was negatively associated with genes involved in the priming of immune activation: HLA genes, CD28, CD5, CD247, NFATC2, ZAP70, IL2RB, CD3E, CD3G, CD3D, IL7R, TRAT1, CD40LG, IL32 (Table 3, Additional file 1: Table S3).
Increased expression of CD39 was associated with the markers of N2 polarization of neutrophils TGFβ2 (rho = 0.42; 95% CI 0.218–0.587; p = 0.0001) and TGFβR1 (rho = 0.541, 95% CI 0.362–0.681; p < 0.0001). It was inversely associated with expression of CD8A (rho -0.341, 95% CI −0.524 to −0.128; p = 0.0023), CD8B (rho −0.468, 95% CI −0.625 to -−0.274; p < 0.0001), CD4 (rho −0.356, 95% CI −0.536 to −0.145; p = 0.001), CD45RA (rho −0.619, 95% CI −0.739 to −0.459; p < 0.0001), and CD45RB (rho −0.247, 95% CI −0.445 to −0.0259; p = 0.0292).
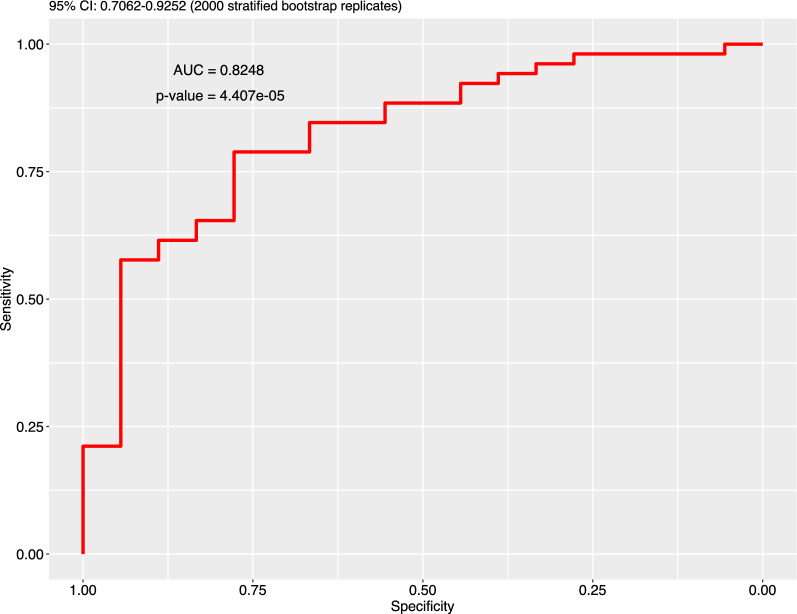
A gene signature including IRF5 and PPARGC1B was associated with a high NLRpost/NLRbaseline (Fig. 7, Additional file 1: Figures S8, S9).
Fig. 7.
Accuracy of gene selection, through latent score, for high NLRpost/NLRbaseline
While no clinical variable (age, gender, BMI, BRAF mutation, M category, LDH, brain metastases, glycemia) was associated with the NLRpost/NLRbaseline, the expression of WNT5A was positively associated (rho 0.298, 95% CI 0.067–0.498; p = 0.012, Spearman’s test) and the expression of APNLR was negatively associated (rho −0.313, 95% CI −0.511 to −0.084; p = 0.0083, Spearman’s test) with NLRpost/NLRbaseline.
Discussion
This study investigated the relationship of NLR with the gene profiling of PBMC obtained from patients with metastatic melanoma who underwent immunotherapy with Anti-PD1 agent. The results confirmed previous findings that a high baseline NLR is associated with a poorer prognosis and correlates with high LDH serum level [9, 10, 12]. Although NLR has been associated with the presence of brain metastases [16, 17], we were not able to find a correlation between high NLR and the presence of brain metastases, conversely our results detected a NLR even higher in patients without brain metastases. Indeed, NLR impacts the PFS and OS of patients without brain metastases with a higher effect than those with such metastases. On the other hand, we did not observe any correlation between NLR and BMI, as previously observed in patients with Hodgkin lymphoma treated with an immune checkpoint inhibitor [18].
The transcriptomic analysis showed that patients with high NLR have the gene signature CCNA1, LDHA and IL18R1, which correlates with inflammation and tumorigenesis. The strong association with LDHA suggests that this enzyme isoform may be involved in a key mechanism for cancer progression. A low NLR at baseline was associated with the signature CD3, SH2D1A, ZAP70 and CD45RA. These genes are correlated with the activation of immunity. Indeed, we have previously found that CD3 + CD45 + T-memory cells are positively correlated with the oncological outcomes of patients with stage IV melanoma treated with ipilimumab [19].
The genes positively associated with NLR [CD39 (ENTPD1), PTEN, MYD88, MMP9 and LDH] have immunosuppression, inflammation and tumor-promoting activity. On the contrary, the genes negatively associated with NLR (HLA genes, CD28, CD5, CD247, NFATC2, ZAP70, IL2RB, CD3E, CD3G, CD3D, IL7R, TRAT1, CD40LG, IL32) are involved in the priming of immune activation. We found that the increased expression of CD39 was associated with TGFβ2 and TGFβR1. TGFβ is a marker of the N2 neutrophils with immunosuppressive activity [20]. CD39 was also inversely associated with genes involved with memory cells and adaptive T cells, such as di CD8A, CD8B, CD4, CD45RA and CD45RB.
Based on these results, the role of CD39/ ENTPD1 in the negative effect of a high NLR on the oncologic outcomes of patients with advanced melanoma can be speculated. CD39 (ENTPD1) functions as the rate-limiting step in converting ATP to ADP [21]. Adenosine inhibits anti-tumor functions mediated by T cells and NK cells [22]. ENTPD1/CD39 is expressed in the tumor microenvironment, in vessels, B cells, NK cells, dendritic cells, monocytes, macrophages, regulatory T cells and monocyte-derived suppressor cells [23]. Upregulation of CD39 in the tumor microenvironment is associated with CD8 + T cell exhaustion signatures [24]. Additionally, T regulatory (Treg) cells may upregulate ENTPD1/CD39 in the tumor microenvironment resulting in immunosuppression and promotion of tumor growth [25].
These data suggest that a high NLR is shaped by an increased expression of CD39, resulting in activation of the adenosine pathway and an increased component of N2 neutrophils with reduced presence of lymphocytes in the tumor microenvironment. CD39 (ectonucleoside triphosphate diphosphohydrolase 1; encoded by ENTPD1) binds extracellular ATP (eATP) and converts it to extracellular adenosine mostly via a cascade involving the ecto-enzyme CD73 (also known as ecto-5′-nucleotidase) [26]. Extracellular adenosine exerts broad immunosuppressive effects. CD39 is expressed by various immune cells and non-immune cells such as endothelial cells and fibroblasts, and by some tumor cells and intra-tumoral immune cells. In the tumor microenvironment, while ATP released by stressed or dying cells provides inflammatory signals promoting effective innate and adaptive immune responses, the hydrolysis of eATP into extracellular adenosine limits immune responses [27].
We also observed that patients whose NLR increases during ICIs treatment have poor survival compared to patients whose NLR is unchanged, and we found that a high NLRpost/NLRbaseline is correlated with APNLR and WNT5A. The Apelin/APLNR system is increased in some cancers, is involved in tumor microenvironment reshaping and modulates tumor immune response [28].
Conclusion
In conclusion, our results suggest a rationale for a negative prognostic significance of NLR in metastatic melanoma. It may be speculated that a high NLR results from an imbalance of circulating cells, with an increased proportion of neutrophils versus lymphocytes, but also of N2 neutrophils versus N1. The adenosine pathway seems to have a pivotal role in this altered modulation of an immune response.
Supplementary Information
Additional file 1: Table S1. Toxicities other than skin type, in patients with low and high NLR. Table S2. Classification accuracy through the selected latent score. Table S3. Activity of genes in the signature. Figure S1. Identification of the optimal cut-point to define the subgroups of low and high NLR. Figure S2. Selection of best cut-point for NLRpost/NLRbaseline. Figure S3. Optimal number of components of the gene signature for baseline NLR. Figure S4. Variable selection by cut-off. Figure S5. Latent score estimation by principal component analysis, for low NLR. Figure S6. Latent score estimation by principal component analysis, for high NLR. Figure S7. Association of gene expression at baseline with response to treatment. Figure S8. Optimal number of components for NLRpost/NLRbaseline gene signature. Figure S9. Latent score estimation by principal component analysis, for NLRpost/NLRbaseline.
Acknowledgements
Editorial assistance has been provided by Laura Brogelli, PhD, Aashni Shah, and Valentina Attanasio (Polistudium srl, Milan, Italy).
Abbreviations
- AJCC
American Joint Committee on Cancer
- ANC
Absolute neutrophil count
- AUC
Area under curve
- CR
Complete response
- DCR
Disease control rate
- ERCC
External RNA Controls Consortium
- ICI
Immune checkpoint inhibitor
- IQR
Interquartile ranges
- LDH
Lactate dehydrogenase
- NLR
Neutrophil-to-lymphocyte ratio
- ORR
Objective response rate
- OS
Overall survival
- PBMC
Peripheral blood mononuclear cells
- PCA
Principal component analysis
- PD
Progressive disease
- PFS
Progression-free survival
- PR
Partial response
- ROC
Receiver operating characteristic
- SD
Stable disease
Author contributions
Study conception and design: DM, PAA; collection and interpretation of data: DM, PAA, MF, PC; AW, MB, SO, SC, SW, AC statistical analysis: DM, MF, PC; manuscript drafting: DM, PAA, MF, PC; manuscript editing DM, MF, AW, MO, FS, MB, ABF, SO, PM, CC, SC, EC, SW, AB, AC, ES, PC, PAA:; approval to submit: DM, MF, AW, MO, FS, MB, ABF, SO, PM, CC, SC, EC, SW, AB, AC, ES, PC, PAA.
Funding
This study received a grant from the Italian Ministry of Health (IT-MOH).
Availability of data and materials
Declarations
Ethics approval and consent to participate
All subjects provided informed written consent prior to enrollment in the study. All procedures performed were in accordance with the 1964 Helsinki declaration and its later amendments. This study was approved by the Ethics Committee of Istituto Nazionale Tumori—IRCCS—Fondazione “G. Pascale”, Naples, Italy, protocol number 17/17 oss. All patients released informed consent to participate.
Consent for publication
All participants released consent to the publication of anonymous data.
Competing interests
PAA has/had a consultant/advisory role for Bristol Myers Squibb, Roche-Genentech, Merck Sharp & Dohme, Novartis, Merck Serono, Pierre-Fabre, AstraZeneca, Sun Pharma, Sanofi, Idera, Sandoz, Immunocore, 4SC, Italfarmaco, Nektar, Boehringer-Ingelheim, Eisai, Regeneron, Daiichi Sankyo, Pfizer, Oncosec, Nouscom, Lunaphore, Seagen, iTeos, Medicenna, Bio-Al Health. He also received research funding from Bristol Myers Squibb, Roche-Genentech, Pfizer, Sanofi. AC received grant consultancies from BMS, Astrazeneca, Roche and MSD. He also received speaker’s fee from Astrazeneca, Novartis and Eisai.
Footnotes
Publisher's Note
Springer Nature remains neutral with regard to jurisdictional claims in published maps and institutional affiliations.
References
- 1.Robert C, Grob JJ, Stroyakovskiy D, Karaszewska B, Hauschild A, Levchenko E, et al. Five-Year outcomes with dabrafenib plus trametinib in metastatic melanoma. N Engl J Med. 2019;381(7):626–636. doi: 10.1056/NEJMoa1904059. [DOI] [PubMed] [Google Scholar]
- 2.Hodi FS, O'Day SJ, McDermott DF, Weber RW, Sosman JA, Haanen JB, et al. Improved survival with ipilimumab in patients with metastatic melanoma. N Engl J Med. 2010;363(8):711–723. doi: 10.1056/NEJMoa1003466. [DOI] [PMC free article] [PubMed] [Google Scholar]
- 3.Larkin J, Chiarion-Sileni V, Gonzalez R, Grob JJ, Rutkowski P, Lao CD, et al. Five-year survival with combined nivolumab and ipilimumab in advanced melanoma. N Engl J Med. 2019;381(16):1535–1546. doi: 10.1056/NEJMoa1910836. [DOI] [PubMed] [Google Scholar]
- 4.Hoefsmit EP, Völlmy F, Rozeman EA, Reijers ILM, Versluis JM, Hoekman L, et al. Systemic LRG1 expression in melanoma is associated with disease progression and recurrence. Cancer Res Commun. 2023;3(4):672–683. doi: 10.1158/2767-9764.CRC-23-0015. [DOI] [PMC free article] [PubMed] [Google Scholar]
- 5.Moya-Plana A, Ngo C, Lanoy E, Vagner S, Robert C. eIF4F translation initiation complex, a predictive marker of response to immunotherapy in mucosal melanoma. Eur J Cancer. 2023;184:120–123. doi: 10.1016/j.ejca.2023.01.032. [DOI] [PubMed] [Google Scholar]
- 6.Iravani A, Wallace R, Lo SN, Galligan A, Weppler AM, Hicks RJ, et al. FDG PET/CT prognostic markers in patients with advanced melanoma treated with ipilimumab and nivolumab. Radiology. 2023;307(3):e221180. doi: 10.1148/radiol.221180. [DOI] [PubMed] [Google Scholar]
- 7.Chew V, Toh HC, Abastado JP. Immune microenvironment in tumor progression: characteristics and challenges for therapy. J Oncol. 2012;2012:608406. doi: 10.1155/2012/608406. [DOI] [PMC free article] [PubMed] [Google Scholar]
- 8.Kumagai S, Marumo S, Shoji T, Sakuramoto M, Hirai T, Nishimura T, et al. Prognostic impact of preoperative monocyte counts in patients with resected lung adenocarcinoma. Lung Cancer. 2014;85:457–464. doi: 10.1016/j.lungcan.2014.06.015. [DOI] [PubMed] [Google Scholar]
- 9.Ferrucci PF, Ascierto PA, Pigozzo J, Del Vecchio M, Maio M, Antonini Cappellini GC, et al. Baseline neutrophils and derived neutrophil-tolymphocyte ratio: prognostic relevance in metastatic melanoma patients receiving ipilimumab. Ann Oncol. 2017;27:732–738. doi: 10.1093/annonc/mdw016. [DOI] [PubMed] [Google Scholar]
- 10.Capone M, Giannarelli D, Mallardo D, Madonna G, Festino L, Grimaldi AM, et al. Baseline neutrophil-to-lymphocyte ratio (NLR) and derived NLR could predict overall survival in patients with advanced melanoma treated with nivolumab. J Immunother Cancer. 2018;6(1):74. doi: 10.1186/s40425-018-0383-1. [DOI] [PMC free article] [PubMed] [Google Scholar]
- 11.Mesti T, Grašič Kuhar C, Ocvirk J. Biomarkers for outcome in metastatic melanoma in first line treatment with immune checkpoint inhibitors. Biomedicines. 2023;11(3):749. doi: 10.3390/biomedicines11030749. [DOI] [PMC free article] [PubMed] [Google Scholar]
- 12.Guida M, Bartolomeo N, Quaresmini D, Quaglino P, Madonna G, Pigozzo J, et al. Basal and one-month differed neutrophil, lymphocyte and platelet values and their ratios strongly predict the efficacy of checkpoint inhibitors immunotherapy in patients with advanced BRAF wild-type melanoma. J Transl Med. 2022;20(1):159. doi: 10.1186/s12967-022-03359-x. [DOI] [PMC free article] [PubMed] [Google Scholar]
- 13.Weide B, Elsässer M, Büttner P, Pflugfelder A, Leiter U, Eigentler TK, et al. Serum markers lactate dehydrogenase and S100B predict independently disease outcome in melanoma patients with distant metastasis. Br J Cancer. 2012;107(3):422–428. doi: 10.1038/bjc.2012.306. [DOI] [PMC free article] [PubMed] [Google Scholar]
- 14.Rosner S, Kwong E, Shoushtari AN, Friedman CF, Betof AS, Brady MS, et al. Peripheral blood clinical laboratory variables associated with outcomes following combination nivolumab and ipilimumab immunotherapy in melanoma. Cancer Med. 2018;7(3):690–697. doi: 10.1002/cam4.1356. [DOI] [PMC free article] [PubMed] [Google Scholar]
- 15.Lê Cao KA, Boitard S, Besse P. Sparse PLS discriminant analysis: biologically relevant feature selection and graphical displays for multiclass problems. BMC Bioinformatics. 2011;22(12):253. doi: 10.1186/1471-2105-12-253. [DOI] [PMC free article] [PubMed] [Google Scholar]
- 16.Koh YW, Choi JH, Ahn MS, Choi YW, Lee HW. Baseline neutrophil-lymphocyte ratio is associated with baseline and subsequent presence of brain metastases in advanced non-small-cell lung cancer. Sci Rep. 2016;6:38585. doi: 10.1038/srep38585. [DOI] [PMC free article] [PubMed] [Google Scholar]
- 17.Abuelbeh I, Abu-Shawer O, Abu-Shawer M, Alkderat M, Safi M, Alwazani A, et al. The predictive value of peripheral immune cell counts for the presence of brain metastases in stage IV non-small-cell lung cancer (NSCLC) Avicenna J Med. 2022;12(2):67–72. doi: 10.1055/s-0042-1749613. [DOI] [PMC free article] [PubMed] [Google Scholar]
- 18.De Filippi R, Morabito F, Santoro A, Tripepi G, D'Alò F, Rigacci L, Ricci F, Morelli E, Zinzani PL, Pinto A. Body mass index is not associated with survival outcomes and immune-related adverse events in patients with Hodgkin lymphoma treated with the immune checkpoint inhibitor nivolumab. J Transl Med. 2021;19(1):489. doi: 10.1186/s12967-021-03134-4.PMID:34852840;PMCID:PMC8638339. [DOI] [PMC free article] [PubMed] [Google Scholar]
- 19.Wistuba-Hamprecht K, Martens A, Heubach F, Romano E, Geukes Foppen M, Yuan J, et al. Peripheral CD8 effector-memory type 1 T-cells correlate with outcome in ipilimumab-treated stage IV melanoma patients. Eur J Cancer. 2017;73:61–70. doi: 10.1016/j.ejca.2016.12.011. [DOI] [PMC free article] [PubMed] [Google Scholar]
- 20.Fridlender ZG, Sun J, Kim S, Kapoor V, Cheng G, Ling L, et al. Polarization of tumor-associated neutrophil phenotype by TGF-beta: “N1” versus “N2” TAN. Cancer Cell. 2009;16(3):183–194. doi: 10.1016/j.ccr.2009.06.017. [DOI] [PMC free article] [PubMed] [Google Scholar]
- 21.Rocconi RP, Stanbery L, Tang M, Walter A, Monk BJ, Herzog TJ, et al. ENTPD1/CD39 as a predictive marker of treatment response to gemogenovatucel-T as maintenance therapy in newly diagnosed ovarian cancer. Commun Med (Lond) 2022;2:106. doi: 10.1038/s43856-022-00163-y. [DOI] [PMC free article] [PubMed] [Google Scholar]
- 22.Clayton A, Al-Taei S, Webber J, Mason MD, Tabi Z. Cancer exosomes express CD39 and CD73, which suppress T cells through adenosine production. J Immunol. 2011;187(2):676–683. doi: 10.4049/jimmunol.1003884. [DOI] [PubMed] [Google Scholar]
- 23.Antonioli L, Pacher P, Vizi ES, Haskó G. CD39 and CD73 in immunity and inflammation. Trends Mol Med. 2013;19(6):355–367. doi: 10.1016/j.molmed.2013.03.005. [DOI] [PMC free article] [PubMed] [Google Scholar]
- 24.Thelen M, Lechner A, Wennhold K, von Bergwelt-Baildon M, Schlößer HA. CD39 Expression defines cell exhaustion in tumor-infiltrating CD8+ T cells-letter. Cancer Res. 2018;78(17):5173–5174. doi: 10.1158/0008-5472.CAN-18-0873. [DOI] [PubMed] [Google Scholar]
- 25.Gu J, Ni X, Pan X, Lu H, Lu Y, Zhao J, et al. Human CD39hi regulatory T cells present stronger stability and function under inflammatory conditions. Cell Mol Immunol. 2017;14(6):521–528. doi: 10.1038/cmi.2016.30. [DOI] [PMC free article] [PubMed] [Google Scholar]
- 26.Morello S, Capone M, Sorrentino C, Giannarelli D, Madonna G, Mallardo D, Grimaldi AM, Pinto A, Ascierto PA. Soluble CD73 as biomarker in patients with metastatic melanoma patients treated with nivolumab. J Transl Med. 2017;15(1):244. doi: 10.1186/s12967-017-1348-8. [DOI] [PMC free article] [PubMed] [Google Scholar]
- 27.Moesta AK, Li XY, Smyth MJ. Targeting CD39 in cancer. Nat Rev Immunol. 2020;20(12):739–755. doi: 10.1038/s41577-020-0376-4. [DOI] [PubMed] [Google Scholar]
- 28.Yang Y, Chen M, Qiu Y, Li X, Huang Y, Zhang W. The Apelin/APLNR system modulates tumor immune response by reshaping the tumor microenvironment. Gene. 2022;834:146564. doi: 10.1016/j.gene.2022.146564. [DOI] [PubMed] [Google Scholar]
Associated Data
This section collects any data citations, data availability statements, or supplementary materials included in this article.
Supplementary Materials
Additional file 1: Table S1. Toxicities other than skin type, in patients with low and high NLR. Table S2. Classification accuracy through the selected latent score. Table S3. Activity of genes in the signature. Figure S1. Identification of the optimal cut-point to define the subgroups of low and high NLR. Figure S2. Selection of best cut-point for NLRpost/NLRbaseline. Figure S3. Optimal number of components of the gene signature for baseline NLR. Figure S4. Variable selection by cut-off. Figure S5. Latent score estimation by principal component analysis, for low NLR. Figure S6. Latent score estimation by principal component analysis, for high NLR. Figure S7. Association of gene expression at baseline with response to treatment. Figure S8. Optimal number of components for NLRpost/NLRbaseline gene signature. Figure S9. Latent score estimation by principal component analysis, for NLRpost/NLRbaseline.


