

Abstract
Objective:
Continuous EEG monitoring (CEEG) is increasingly used to identify electrographic seizures (ES) in critically ill children, but it is resource intense. We aimed to assess how patient stratification by known ES risk factors would impact CEEG utilization.
Methods:
This was a prospective observational study of critically ill children with encephalopathy who underwent CEEG. We calculated the average CEEG duration required to identify a patient with ES for the full cohort and subgroups stratified by known ES risk factors.
Results:
ES occurred in 345/1399 (25%) patients. For the full cohort, an average of 90 hours of CEEG would be required to identify 90% of patients with ES. If subgroups of patients were stratified by age, clinically evident seizures prior to CEEG initiation, and early EEG risk factors, then 20–1046 hours of CEEG would be required to identify a patient with ES. Patients with clinically evident seizures prior to CEEG initiation and EEG risk factors present in the initial hour of CEEG required only 20 (<1 year) or 22 (≥ 1 year) hours of CEEG to identify a patient with ES. Conversely, patients with no clinically evident seizures prior to CEEG initiation and no EEG risk factors in the initial hour of CEEG required 405 (<1 year) or 1046 (≥ 1 year) hours of CEEG to identify a patient with ES. Patients with clinically evident seizures prior to CEEG initiation or EEG risk factors in the initial hour of CEEG required 29–120 hours of CEEG to identify a patient with ES.
Conclusion:
Stratifying patients by clinical and EEG risk factors could identify high and low yield subgroups for CEEG by considering ES incidence, the duration of CEEG required to identify ES, and subgroup size. This approach may be critical for optimizing CEEG resource allocation.
Keywords: Seizure, Status Epilepticus, Pediatric, Electroencephalogram, EEG Monitoring
Introduction
Electroencephalographic seizures (ES) occur in 10–40% of critically ill children with acute encephalopathy who undergo continuous EEG monitoring (CEEG) in the pediatric intensive care unit (PICU). Since most ES lack a clinical correlate CEEG is required for ES detection.1–26 Given increasing evidence that high ES exposure is associated with unfavorable neurobehavioral outcomes7, 10, 14, 20, 21 and that ES can often be safely managed with existing ASM,27, 28 CEEG is increasingly used for ES identification.29, 30 Current guidelines and consensus statements recommend that children with acute encephalopathy undergo CEEG for 24–48 hours31–33 which may be challenging given CEEG is resource intense.34, 35 Prior studies have identified children at high risk for ES based on their clinical and EEG risk factors.1, 4–6, 8–11, 14, 15, 17–19, 36, 37 However, studies have not explored how basic stratification of patients by ES risk could improve the yield of CEEG. In this study, we assessed how patient stratification by clinical and EEG risk factors for ES impacts CEEG value.
Methods
The Institutional Review Board approved the study with a waiver of consent. The study was registered with clincialtrials.gov (NCT03419260). We applied standards from the Strengthening the Reporting of Observational Studies in Epidemiology (STROBE)38 and Reporting of Studies Conducted Using Observational Routinely-Collected Health Data (RECORD)39 statements.
The study methods and key variable definitions have been reported.36, 37, 40–43 This was a single-center prospective observational cohort study of consecutive children with acute encephalopathy in the PICU of a quaternary care hospital who underwent clinically-indicated CEEG based on an institutional pathway41 that is aligned with recent consensus statements and guidelines.31–33 We excluded neonates (<30 days old), patients who received brief post-operative epilepsy surgery care in the PICU, and patients admitted after >2 days of care for refractory status epilepticus at a different institution. CEEG was performed using Natus Neuroworks (Middleton, WI), electrodes were placed according to the International 10–20 system, the Critical Care EEG Service interpreted the CEEG studies, and patients were managed by Critical Care Medicine and the Neurology Consultation Services.
An electroencephalographer (FWF) scored the EEG tracings and templated clinical reports44 using standardized critical care EEG terminology.45, 46 We prospectively collected data using Research Electronic Data Capture, including data needed for the current analyses: (1) patient age, (2) occurrence of clinically evident seizures or status epilepticus prior to CEEG initiation, and (3) occurrence of early EEG risk factors for ES. As in prior studies, ES were defined as abnormal paroxysmal events that were different from the background, lasted longer than 10 seconds, had a plausible electrographic field, and had a temporal-spatial evolution in morphology, frequency, and amplitude.47 Early EEG risk factors for ES were based on prior studies of critically ill children and included sporadic epileptiform discharges, brief rhythmic discharges, periodic discharges (generalized, lateralized, or bilateral independent), lateralized rhythmic delta activity, and lateralized rhythmic spike-wave discharges.1, 4, 5, 11, 16, 42 Early EEG risk factors were defined as present or absent in the initial 1-hour of CEEG. EEG risk factors were also assessed in the initial 6-hours of CEEG for comparison.
We used Stata 15.1 (College Station, TX) for descriptive analyses and Wilcoxon rank-sum tests to compare CEEG duration across groups. For the full cohort and each subgroup, we calculated the number of patients identified with ES if CEEG were performed long enough to identify 90% of patients with ES, the number of CEEG hours required to perform that duration of CEEG, and the average CEEG hours required to identify each patient with ES. We compared the ES incidence (chi-squared test) and duration from CEEG initiation to ES onset (Wilcoxon rank-sum test) among subjects divided by pre-EEG clinical risk factors (age category and clinically evident seizures prior to CEEG initiation) and early EEG risk factors (in the initial 1-hour or 6-hours of CEEG).
Results
We enrolled 1399 consecutive critically ill children who underwent CEEG. Clinical and EEG data are summarized in Table 1 and have been reported previously.36, 37, 40–43 For the full cohort, 25% (345/1,399) of patients experienced ES, and the median duration from CEEG initiation to ES onset was 1.4 hours (IQR 0.2, 6.3). Performing CEEG for 1, 6, 20, 28, or 40 hours would identify 50%, 75%, 90%, 95%, and 98% of patients with ES, respectively (Figure 1). Table 2 provides data regarding ES incidence, hours of CEEG required to identify 90% of patients with ES, and the hours of CEEG required to identify a single patient with ES for the full cohort and subgroups. Twenty hours of CEEG would have identified 90% of patients with ES (311 patients). Thus, 1,399 patients would have required 27,980 hours of CEEG if all patients each underwent 20 hours of CEEG. This yielded an average of 90 hours of CEEG to identify a single patient with ES (27,980 CEEG hours / 311 patients with ES).
Table 1.
Summary of clinical and EEG data.
| Variable | Full Cohort (N=1399) |
|---|---|
| Age (Median [IQR], Years) | 5.7 [1.4, 13.5] |
| Age ≥1 Year | 1133 (81%) |
| Sex Male | 780 (56%) |
| Other | 4 (0.4%) |
| Ethnicity Hispanic or Latino | 207 (15%) |
| Past Medical History of Epilepsy | 515 (37%) |
| Past Medical History of Epileptic Encephalopathy | 220 (16%) |
| Prior Medical History of Developmental Delay or Intellectual Disability | 720 (51%) |
| Epilepsy | 426 (30%) |
| Prior to CEEG Initiation: Clinically Evident Seizure(s) or Status Epilepticus | 858 (61%) |
| Prior to CEEG Initiation: Administration of Antiseizure Medication | 841 (60%) |
| Prior to CEEG Initiation: Administration of Sedatives | 686 (49%) |
| Prior to CEEG Initiation: Administration of Paralytics | 290 (21%) |
| Comatose Mental Status at CEEG Initiation | 222 (16%) |
| Mental Status Worse than Baseline at CEEG Initiation | 1230 (88%) |
| CEEG Duration (Median, hours) | 25 [15, 44] |
| Attenuated-Featureless | 89 (6%) |
| Epileptiform Discharges Present | 537 (38%) |
| Initial 60 Minutes | 354 (25%) |
| Ictal-Interictal Continuum Present | 92 (7%) |
| At Any Time | 582 (42%) |
| Duration CEEG Initiation to EEG Risk State (Median [IQR], hours) | 0.4 [0.1, 3.5] |
| Electrographic Seizures or Status Epilepticus | 345 (25%) |
| Electrographic Status Epilepticus | 79 (6%) |
| 107 (31%) | |
| All EEG-Only | 139 (40%) |
| Duration CEEG Initiation to Electrographic Seizure (Median [IQR], hours) | 1.4 [0.2, 6.3] |
| Mortality | 158 (11%) |
CEEG, continuous EEG monitoring.
EEG Risk State = Interictal Epileptiform Discharges and/or Periodic/Rhythmic Patterns.
Other Race = Alaska Native, Native Hawaiian or Pacific Islander, and American Indian.
Race Unknown for 332 full cohort (24%), 157 generation cohort (22%), and 175 validation cohort (26%).
Ethnicity Unknown for 29 full cohort (2%), 15 generation cohort (2%), and 14 validation cohort (2%)
Figure 1.
Duration of continuous EEG monitoring (CEEG) to identify 50th, 75th, 90th, 95th, and 98th percentile of patients who eventually experienced electrographic seizures. Overall, electrographic seizures occurred in 25% (345/1399). Performing CEEG for 20 hours would identify 90% of patients with electrographic seizures.
Table 2.
Summary of electrographic seizure (ES) incidence, continuous EEG (CEEG) duration, and hours of CEEG per patient with ES identified if aim to identify 90% of patients with ES with EEG risk assessed in the initial 1 hour of CEEG.
| Cohort or Subgroup | ES (N) | Total (N) | Percentage of Cohort in Subgroup | Percentage with ES | Hours CEEG to Identify 90% of Patients with ES* | Patients with ES Identified | Hours CEEG to First ES | Average Hours CEEG to Identify a Patient with ES |
|---|---|---|---|---|---|---|---|---|
| Full Cohort | 345 | 1,399 | 100% | 25% | 20 | 311 | 27,980 | 90 |
| Age <1Year | 86 | 266 | 19% | 32% | 25 | 77 | 6,650 | 86 |
| Age ≥1 Year | 259 | 1,133 | 81% | 23% | 19 | 233 | 21,527 | 92 |
| Seizure Prior to CEEG | 274 | 862 | 62% | 32% | 17 | 247 | 14,654 | 59 |
| No Seizure Prior to CEEG | 71 | 537 | 38% | 13% | 36 | 64 | 19,332 | 303 |
| EEG Risk in 1 Hour | 194 | 362 | 26% | 54% | 12 | 175 | 4,344 | 25 |
| No EEG Risk in 1 Hour | 151 | 1,037 | 74% | 15% | 25 | 136 | 25,925 | 191 |
| EEG Risk, No Seizure, <1 Year | 10 | 18 | 1% | 56% | 22 | 9 | 396 | 44 |
| EEG Risk, No Seizure, ≥1 Year | 32 | 75 | 5% | 43% | 11 | 29 | 825 | 29 |
| EEG Risk, Seizure, <1 Year | 33 | 50 | 4% | 66% | 12 | 30 | 600 | 20 |
| EEG Risk, Seizure. ≥1 Year | 119 | 219 | 16% | 54% | 11 | 107 | 2,409 | 22 |
| No EEG Risk, No Seizure, <1 Year | 9 | 82 | 6% | 11% | 40 | 8 | 3,280 | 405 |
| No EEG Risk, No Seizure, ≥1 Year^ | 20 | 362 | 26% | 6% | 52 | 18 | 18,824 | 1,046 |
| No EEG Risk, Seizure, <1 Year | 34 | 116 | 8% | 29% | 22 | 31 | 2,552 | 83 |
| No EEG Risk, Seizure, ≥1 Year | 88 | 447 | 34% | 18% | 20 | 79 | 9,540 | 120 |
Data in Figures 1 and 2 from the bar displaying CEEG duration to identify 90% of patients with electrographic seizures.
Subgroup comprising large proportion of patients (26%; 362/1399) with low electrographic seizure incidence (6%; 20/362) with electrographic seizures identified after a long duration of CEEG (52 hours to seizure onset in 90% of patients), and therefore substantial CEEG hours required to identify each patient with electrographic seizures (1046 hours of CEEG to identify each patient with electrographic seizures).
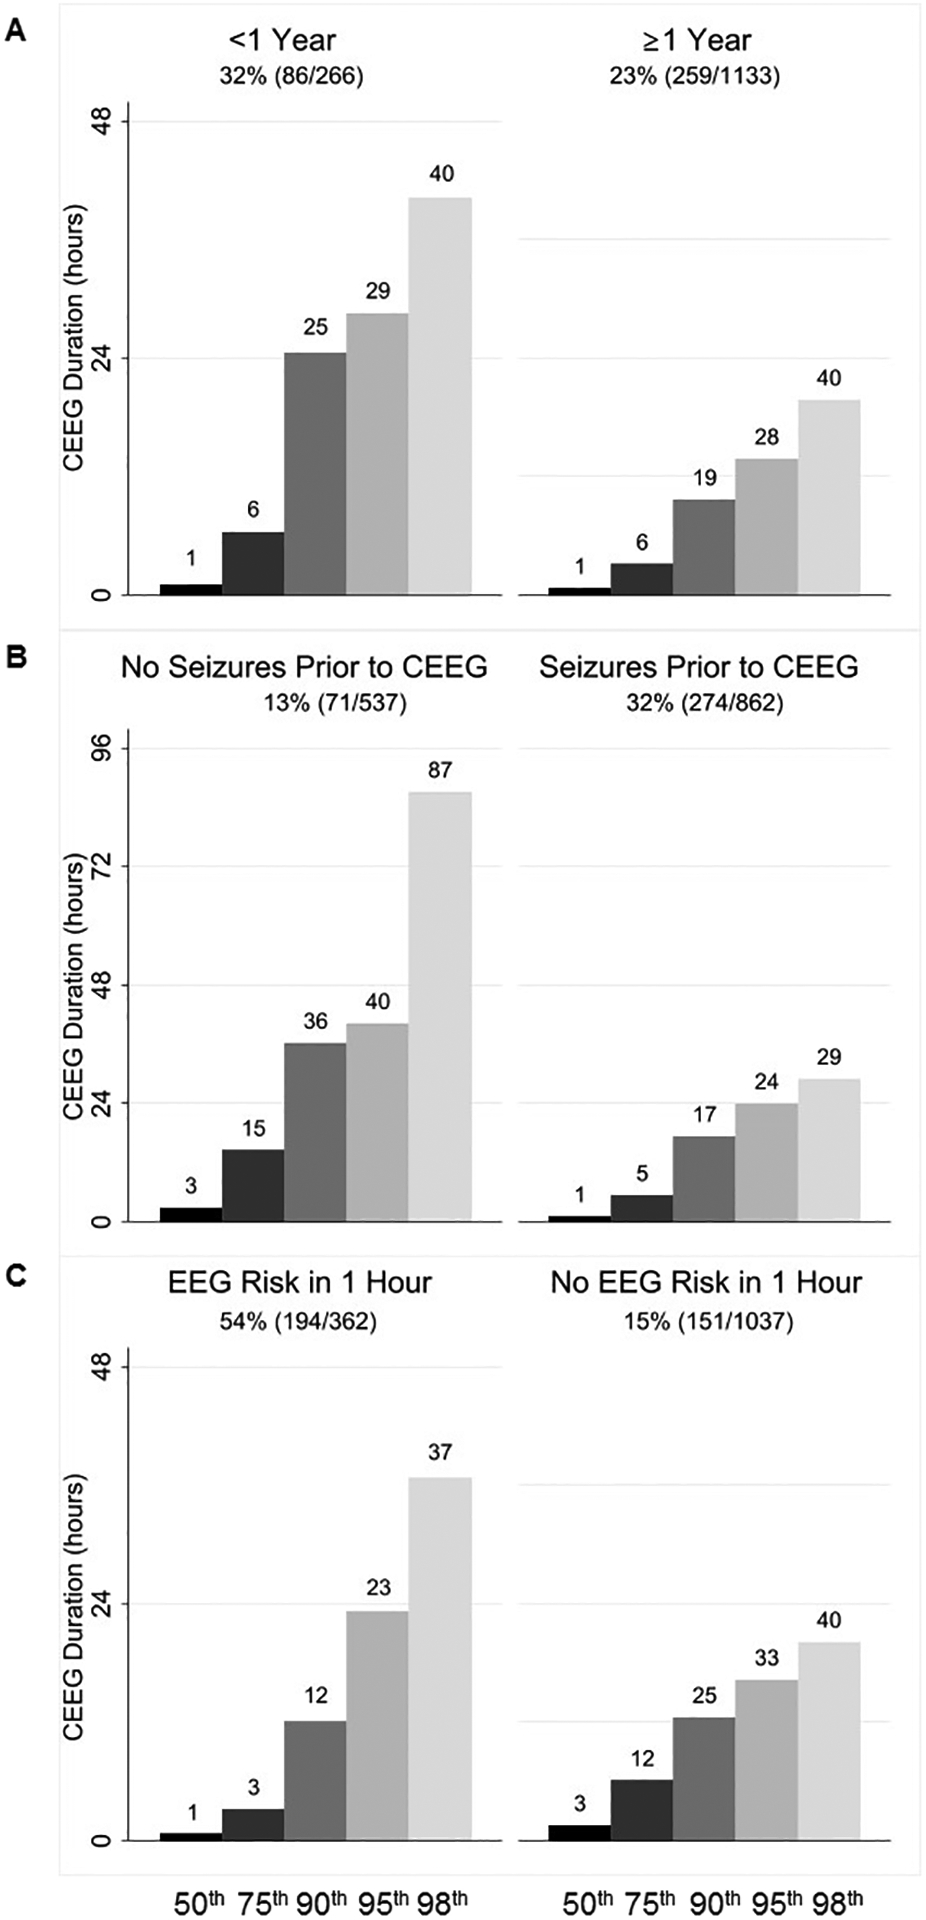
ES were more common in patients younger than 1 year (32% vs. 23%; p=0.001), with clinically evident seizures prior to CEEG initiation (32% vs. 13%; p<0.001), and with EEG risk factors in the initial 1-hour of CEEG (54% vs. 15%; p<0.001) or 6-hours of CEEG (50% vs. 11%, p<0.001) (Table 3). Importantly, ES occurred earlier in patients with clinically evident seizures prior to CEEG initiation (median 1.12 hours vs. 2.90 hours; p<0.001) and if EEG risk factors were present in the initial 1-hour of CEEG (median 0.79 hours vs. 3.13 hours; p<0.001) or 6-hours of CEEG (median 1.07 hours vs. 2.92 hours; p=0.002) (Table 3). Thus, we stratified subjects into subgroups based on age category, clinically evident seizures prior to CEEG initiation, and the presence of EEG risk factors (in the initial 1-hour or 6-hours of CEEG) to determine how subgroup size, ES incidence, and time to ES occurrence would impact the average number of hours of CEEG needed to identify a single patient with ES (Table 2). Performing CEEG for 17–36 hours would identify 90% of patients with ES irrespective of age category, presence of clinically evident seizures prior to CEEG initiation, or the presence of early EEG risk factors in the initial 1-hour of CEEG (Figure 2). However, for subgroups, the average hours of CEEG required to identify a single patient with ES ranged from 25–303 hours (Table 2).
Table 3.
Electrographic seizure (ES) risk factors and duration from continuous EEG (CEEG) initiation to the first seizure.
| ES Occurrence | Duration CEEG Initiation to ES | ||||
|---|---|---|---|---|---|
| No ES N (%) | ES N (%) | p-value | Median (IQR) Duration hours | p-value | |
| ≥1 Year | 874 (77%) | 259 (23%) | 1.43 (0.22–6.28) | ||
| Absent | 466 (87%) | 71 (13%) | 2.90 (0.43–14.53) | ||
| Absent | 886 (85%) | 151 (15%) | 3.13 (0.37–12.23) | ||
| Absent | 816 (89%) | 105 (11%) | 2.92 (0.35–14.28) | ||
Figure 2.

Duration of continuous EEG monitoring (CEEG) to identify 50th, 75th, 90th, 95th, and 98th percentile of patients who eventually experienced electrographic seizures in subgroups stratified by (A) age, (B) clinically evident seizures prior to CEEG initiation, and (C) EEG risk factors in the initial 1 hour of CEEG.
Based on the three binary main variables (age, clinically evident seizures prior to CEEG initiation, and early EEG risk factors in the initial 1-hour of CEEG), we stratified subjects into eight subgroups. The average number of hours of CEEG required to identify a patient with ES ranged from 20–1046 hours (Table 2). Patients younger than 1 year with clinically evident seizures prior to CEEG initiation and with early EEG risk factors were at high risk for ES (66%; 33/50), required only 12 hours of CEEG to identify 90% of patients experiencing ES, and comprised a small subgroup (4%; 50/1399). In this subgroup, an average of 20 hours of CEEG would be required to identify a single patient with ES. Conversely, patients older than 1 year without clinically evident seizures prior to CEEG initiation and without early EEG risk factors were at low risk for ES (6%; 20/362), required 52 hours of CEEG to identify 90% of patients experiencing ES, and comprised a large subgroup (26%; 362/1399). In this subgroup, an average of 1,046 hours of CEEG would be required to identify a single patient with ES. Other subgroups required an average of 22–405 hours of CEEG to identify a single patient with ES (Table 2). Assessing EEG risk in the initial 6-hours of CEEG, rather than the initial 1-hour of CEEG in the main analyses, yielded similar findings.
Discussion
This prospective observational study of 1,399 consecutive critically ill children with encephalopathy who underwent clinically indicated CEEG yielded two main conclusions. First, performing 20, 28, and 40 hours of CEEG would identify 90%, 95%, and 98% of patients with ES, respectively. Thus, current guidelines and consensus statements recommending 24–48 hours of CEEG are appropriate for identifying most patients with ES.31–33 Second, patients with ES risk factors (younger age, clinically evident seizures prior to CEEG initiation, and early EEG risk factors) had a higher incidence of ES, tended to seize earlier during CEEG, and comprised a smaller proportion of the cohort. Therefore, monitoring those patients might be of higher value because seizures would be detected frequently and early in these small subgroups. Conversely, patients without ES risk factors (older age, no clinically evident seizures prior to CEEG initiation, and no early EEG risk factors) had a low incidence of seizures, tended to seizure later during CEEG, and comprised a larger proportion of the cohort. Therefore, monitoring those patients might be of lower value since extensive CEEG resources would need to be deployed to monitor many patients for a longer duration to capture only a small number of patients experiencing ES. Assessing EEG risk factors over 6-hours rather than 1-hour yielded similar results, so a longer screening EEG would extend EEG resource requirements without providing more precise risk stratification.
Increased efforts to monitor patients with CEEG29–33 are driven by the high incidence of ES among critically ill children with encephalopathy,1–26 data indicating ES can often be safely managed with existing ASM,27, 28 and data indicating high ES exposure is associated with unfavorable neurobehavioral outcomes.7, 10, 14, 20, 21 However, the substantial personnel and equipment requirements needed for CEEG may limit widespread implementation.34, 35 The value of resource intense CEEG may be maximized by incorporating risk factors for ES1, 4–6, 8–11, 14, 15, 17–19, 48 into clinical prediction models that target CEEG to patients at highest risk for ES36, 37 and continuing CEEG for the appropriate duration.40, 43 The current data indicate that evidence-based patient stratification may enable development of high yield CEEG approaches.
Patients of any age with clinically evident seizures prior to CEEG initiation and early EEG risk factors required only 20 hours (<1 year) or 22 hours (≥1 year) of CEEG to identify a patient with ES, and these patients may represent a higher value subgroup. Patients of any age with no clinically evident seizures prior to CEEG initiation and no early EEG risk factors required 405 hours (<1 year) or 1,046 hours (≥1 year) of CEEG to identify a patient with ES, and these patients may represent lower value subgroups. Patients with either clinically evident seizures prior to CEEG initiation or early EEG risk factors required 29–120 hours of CEEG to identify a patient with ES, and these patients may represent moderate value subgroups.
This was a prospective and contemporary observational study using a well-established clinical pathway41 with enrollment of consecutive patients and CEEG assessment by an electroencephalographer reviewing reports and EEG tracings using standardized terminology.45 However, there are several limitations to this study. First, this was a single-center study with EEG scoring performed by one electroencephalographer. Generalizability would be enhanced by multi-center studies with multi-rater review of EEG data. Second, CEEG duration was determined clinically, but some patients may have experienced ES after CEEG discontinuation. Future studies extending CEEG longer than clinically indicated would help assess whether patients experience late onset ES. Third, this study focused on CEEG near the onset of illness and near admission, but some patients may have long PICU stays with disease progression or fluctuation impacting ES risk over time. Finally, determining how widely to implement CEEG, particularly whether it is warranted in low value subgroups, depends on the degree of secondary brain injury and improvement in neurobehavioral outcomes which might be mitigated through ES identification and management. Cost effectiveness analyses indicate that even small (3–6%) improvements in quality-adjusted life-years in children could make CEEG cost effective despite the extensive CEEG resources required during acute care.49 However, further research is needed to determine whether efforts to identify and manage ES improve neurobehavioral outcomes.
There is increasing focus on providing high value healthcare, with value defined as health outcomes achieved per dollar spent. Increasing healthcare value benefits patients, payers, providers, and enhances the overall effectiveness and sustainability of the healthcare system.50 Achieving high value healthcare requires rigorous assessment of current practice and thoughtful improvement initiatives. Our data indicate that identifying subgroups that are high value for CEEG may be critical to optimizing CEEG resource utilization and allocation.
Financial Disclosures:
France W. Fung – Reports no disclosures.
Darshana Parikh – Reports no disclosures.
Maureen Donnelly – Reports no disclosures.
Marin Jacobwitz – Reports no disclosures.
Alexis A. Topjian – Reports no disclosures.
Rui Xiao – Reports no disclosures.
Nicholas S. Abend – Funding from NIH (NINDS) K02NS096058 and Wolfson Foundation for this study. Other funding from PCORI (to institution), UCB Pharma (to institution), Epilepsy Foundation (consulting), and Demos Publishing (royalties).
Study Funding:
Dr. Abend is funded by the Wolfson Family Foundation.
Footnotes
Statistical Analysis: Nicholas Abend, MD MSCE, Rui Xiao, PhD.
References
- 1.Jette N, Claassen J, Emerson RG, Hirsch LJ. Frequency and predictors of nonconvulsive seizures during continuous electroencephalographic monitoring in critically ill children. Arch Neurol. 2006. Dec;63:1750–1755. [DOI] [PubMed] [Google Scholar]
- 2.Tay SK, Hirsch LJ, Leary L, Jette N, Wittman J, Akman CI. Nonconvulsive status epilepticus in children: clinical and EEG characteristics. Epilepsia. 2006. Sep;47:1504–1509. [DOI] [PubMed] [Google Scholar]
- 3.Shahwan A, Bailey C, Shekerdemian L, Harvey AS. The prevalence of seizures in comatose children in the pediatric intensive care unit: a prospective video-EEG study. Epilepsia. 2010. Jul;51:1198–1204. [DOI] [PubMed] [Google Scholar]
- 4.Abend NS, Topjian A, Ichord R, et al. Electroencephalographic monitoring during hypothermia after pediatric cardiac arrest. Neurology. 2009. Jun 2;72:1931–1940. [DOI] [PMC free article] [PubMed] [Google Scholar]
- 5.Williams K, Jarrar R, Buchhalter J. Continuous video-EEG monitoring in pediatric intensive care units. Epilepsia. 2011. Jun;52:1130–1136. [DOI] [PubMed] [Google Scholar]
- 6.Greiner HM, Holland K, Leach JL, Horn PS, Hershey AD, Rose DF. Nonconvulsive status epilepticus: the encephalopathic pediatric patient. Pediatrics. 2012. Mar;129:e748–755. [DOI] [PMC free article] [PubMed] [Google Scholar]
- 7.Kirkham FJ, Wade AM, McElduff F, et al. Seizures in 204 comatose children: incidence and outcome. Intensive Care Med. 2012. May;38:853–862. [DOI] [PMC free article] [PubMed] [Google Scholar]
- 8.Arango JI, Deibert CP, Brown D, Bell M, Dvorchik I, Adelson PD. Posttraumatic seizures in children with severe traumatic brain injury. Childs Nerv Syst. 2012. Nov;28:1925–1929. [DOI] [PubMed] [Google Scholar]
- 9.Piantino JA, Wainwright MS, Grimason M, et al. Nonconvulsive seizures are common in children treated with extracorporeal cardiac life support. Pediatr Crit Care Med. 2013. Jul;14:601–609. [DOI] [PubMed] [Google Scholar]
- 10.Abend NS, Arndt DH, Carpenter JL, et al. Electrographic seizures in pediatric ICU patients: cohort study of risk factors and mortality. Neurology. 2013. Jul 23;81:383–391. [DOI] [PMC free article] [PubMed] [Google Scholar]
- 11.McCoy B, Sharma R, Ochi A, et al. Predictors of nonconvulsive seizures among critically ill children. Epilepsia. 2011. Nov;52:1973–1978. [DOI] [PubMed] [Google Scholar]
- 12.Schreiber JM, Zelleke T, Gaillard WD, Kaulas H, Dean N, Carpenter JL. Continuous video EEG for patients with acute encephalopathy in a pediatric intensive care unit. Neurocrit Care. 2012. Aug;17:31–38. [DOI] [PubMed] [Google Scholar]
- 13.Arndt DH, Lerner JT, Matsumoto JH, et al. Subclinical early posttraumatic seizures detected by continuous EEG monitoring in a consecutive pediatric cohort. Epilepsia. 2013. Oct;54:1780–1788. [DOI] [PMC free article] [PubMed] [Google Scholar]
- 14.Payne ET, Zhao XY, Frndova H, et al. Seizure burden is independently associated with short term outcome in critically ill children. Brain. 2014. May;137:1429–1438. [DOI] [PMC free article] [PubMed] [Google Scholar]
- 15.Abend NS, Gutierrez-Colina AM, Topjian AA, et al. Nonconvulsive seizures are common in critically ill children. Neurology. 2011. Mar 22;76:1071–1077. [DOI] [PMC free article] [PubMed] [Google Scholar]
- 16.Gold JJ, Crawford JR, Glaser C, Sheriff H, Wang S, Nespeca M. The role of continuous electroencephalography in childhood encephalitis. Pediatr Neurol. 2014. Apr;50:318–323. [DOI] [PubMed] [Google Scholar]
- 17.Vlachy J, Jo M, Li Q, et al. Risk Factors for Seizures Among Young Children Monitored With Continuous Electroencephalography in Intensive Care Unit: A Retrospective Study. Front Pediatr. 2018;6:303. [DOI] [PMC free article] [PubMed] [Google Scholar]
- 18.Sansevere AJ, Duncan ED, Libenson MH, Loddenkemper T, Pearl PL, Tasker RC. Continuous EEG in Pediatric Critical Care: Yield and Efficiency of Seizure Detection. J Clin Neurophysiol. 2017. Sep;34:421–426. [DOI] [PubMed] [Google Scholar]
- 19.Sanchez SM, Arndt DH, Carpenter JL, et al. Electroencephalography monitoring in critically ill children: current practice and implications for future study design. Epilepsia. 2013. Aug;54:1419–1427. [DOI] [PMC free article] [PubMed] [Google Scholar]
- 20.Topjian AA, Gutierrez-Colina AM, Sanchez SM, et al. Electrographic Status Epilepticus is Associated with Mortality and Worse Short-Term Outcome in Critically Ill Children. Crit Care Med. 2013;41:215–223. [DOI] [PMC free article] [PubMed] [Google Scholar]
- 21.Wagenman KL, Blake TP, Sanchez SM, et al. Electrographic status epilepticus and long-term outcome in critically ill children. Neurology. 2014. Feb 4;82:396–404. [DOI] [PMC free article] [PubMed] [Google Scholar]
- 22.O’Neill BR, Handler MH, Tong S, Chapman KE. Incidence of seizures on continuous EEG monitoring following traumatic brain injury in children. J Neurosurg Pediatr. 2015. Aug;16:167–176. [DOI] [PubMed] [Google Scholar]
- 23.Vaewpanich J, Reuter-Rice K. Continuous electroencephalography in pediatric traumatic brain injury: Seizure characteristics and outcomes. Epilepsy Behav. 2016. Sep;62:225–230. [DOI] [PMC free article] [PubMed] [Google Scholar]
- 24.Gwer S, Idro R, Fegan G, et al. Continuous EEG monitoring in Kenyan children with non-traumatic coma. Arch Dis Child. 2012. Apr;97:343–349. [DOI] [PMC free article] [PubMed] [Google Scholar]
- 25.Ostendorf AP, Hartman ME, Friess SH. Early Electroencephalographic Findings Correlate With Neurologic Outcome in Children Following Cardiac Arrest. Pediatr Crit Care Med. 2016. Jul;17:667–676. [DOI] [PMC free article] [PubMed] [Google Scholar]
- 26.Sanchez Fernandez I, Sansevere AJ, Guerriero RM, et al. Time to electroencephalography is independently associated with outcome in critically ill neonates and children. Epilepsia. 2017. Mar;58:420–428. [DOI] [PMC free article] [PubMed] [Google Scholar]
- 27.Fung FW, Jacobwitz M, Vala L, et al. Electroencephalographic seizures in critically ill children: Management and adverse events. Epilepsia. 2019. Oct;60:2095–2104. [DOI] [PMC free article] [PubMed] [Google Scholar]
- 28.Abend NS, Sanchez SM, Berg RA, Dlugos DJ, Topjian AA. Treatment of electrographic seizures and status epilepticus in critically ill children: a single center experience. Seizure. 2013. Jul;22:467–471. [DOI] [PMC free article] [PubMed] [Google Scholar]
- 29.Kirschen MP, LaRovere K, Balakrishnan B, et al. A Survey of Neuromonitoring Practices in North American Pediatric Intensive Care Units. Pediatr Neurol. 2022. Jan;126:125–130. [DOI] [PMC free article] [PubMed] [Google Scholar]
- 30.Sanchez SM, Carpenter J, Chapman KE, et al. Pediatric ICU EEG monitoring: current resources and practice in the United States and Canada. J Clin Neurophysiol. 2013. Apr;30:156–160. [DOI] [PMC free article] [PubMed] [Google Scholar]
- 31.Brophy GM, Bell R, Claassen J, et al. Guidelines for the evaluation and management of status epilepticus. Neurocrit Care. 2012. Aug;17:3–23. [DOI] [PubMed] [Google Scholar]
- 32.Herman ST, Abend NS, Bleck TP, et al. Consensus statement on continuous EEG in critically ill adults and children, part I: indications. J Clin Neurophysiol. 2015. Apr;32:87–95. [DOI] [PMC free article] [PubMed] [Google Scholar]
- 33.Herman ST, Abend NS, Bleck TP, et al. Consensus statement on continuous EEG in critically ill adults and children, part II: personnel, technical specifications, and clinical practice. J Clin Neurophysiol. 2015. Apr;32:96–108. [DOI] [PMC free article] [PubMed] [Google Scholar]
- 34.Gutierrez-Colina AM, Topjian AA, Dlugos DJ, Abend NS. EEG Monitoring in Critically Ill Children: Indications and Strategies. Pediatric Neurology. 2012;46:158–161. [DOI] [PMC free article] [PubMed] [Google Scholar]
- 35.Abend NS, Topjian AA, Williams S. How much does it cost to identify a critically ill child experiencing electrographic seizures? J Clin Neurophysiol. 2015. Jun;32:257–264. [DOI] [PMC free article] [PubMed] [Google Scholar]
- 36.Fung FW, Jacobwitz M, Parikh DS, et al. Development of a model to predict electroencephalographic seizures in critically ill children. Epilepsia. 2020. Mar;61:498–508. [DOI] [PubMed] [Google Scholar]
- 37.Fung FW, Parikh DS, Jacobwitz M, et al. Validation of a model to predict electroencephalographic seizures in critically ill children. Epilepsia. 2020. Dec;61:2754–2762. [DOI] [PubMed] [Google Scholar]
- 38.von Elm E, Altman DG, Egger M, et al. The Strengthening the Reporting of Observational Studies in Epidemiology (STROBE) statement: guidelines for reporting observational studies. Journal of clinical epidemiology. 2008. Apr;61:344–349. [DOI] [PubMed] [Google Scholar]
- 39.Benchimol EI, Smeeth L, Guttmann A, et al. The REporting of studies Conducted using Observational Routinely-collected health Data (RECORD) statement. PLoS Med. 2015. Oct;12:e1001885. [DOI] [PMC free article] [PubMed] [Google Scholar]
- 40.Fung FW, Fan J, Vala L, et al. EEG monitoring duration to identify electroencephalographic seizures in critically ill children. Neurology. 2020. Sep 15;95:e1599–e1608. [DOI] [PMC free article] [PubMed] [Google Scholar]
- 41.Fung FW, Wang Z, Parikh DS, et al. Electrographic Seizures and Outcome in Critically Ill Children. Neurology. 2021. Apr 23;96:e2749–e2760. [DOI] [PMC free article] [PubMed] [Google Scholar]
- 42.Fung FW, Parikh DS, Massey SL, et al. Periodic and rhythmic patterns in critically ill children: Incidence, interrater agreement, and seizures. Epilepsia. 2021. Dec;62:2955–2967. [DOI] [PubMed] [Google Scholar]
- 43.Fung FW, Fan J, Parikh DS, et al. Validation of a Model for Targeted EEG Monitoring Duration in Critically Ill Children. J Clin Neurophysiol. 2022. Apr 20. [DOI] [PMC free article] [PubMed] [Google Scholar]
- 44.Witzman S, Massey SL, Kessler S, et al. Acceptability of Standardized EEG Reporting in an Electronic Health Record. J Clin Neurophysiol. 2020. Sep;37:455–461. [DOI] [PMC free article] [PubMed] [Google Scholar]
- 45.Hirsch LJ, LaRoche SM, Gaspard N, et al. American Clinical Neurophysiology Society’s Standardized Critical Care EEG Terminology: 2012 version. J Clin Neurophysiol. 2013. Feb;30:1–27. [DOI] [PubMed] [Google Scholar]
- 46.Hirsch LJ, Fong MWK, Leitinger M, et al. American Clinical Neurophysiology Society’s Standardized Critical Care EEG Terminology: 2021 Version. J Clin Neurophysiol. 2021. Jan 1;38:1–29. [DOI] [PMC free article] [PubMed] [Google Scholar]
- 47.Beniczky S, Hirsch LJ, Kaplan PW, et al. Unified EEG terminology and criteria for nonconvulsive status epilepticus. Epilepsia. 2013. Sep;54 Suppl 6:28–29. [DOI] [PubMed] [Google Scholar]
- 48.Hu J, Fung FW, Jacobwitz M, et al. Machine learning models to predict electroencephalographic seizures in critically ill children. Seizure. 2021. Apr;87:61–68. [DOI] [PMC free article] [PubMed] [Google Scholar]
- 49.Abend NS, Topjian AA, Williams S. Could EEG Monitoring in Critically Ill Children Be a Cost-effective Neuroprotective Strategy? J Clin Neurophysiol. 2015. Dec;32:486–494. [DOI] [PMC free article] [PubMed] [Google Scholar]
- 50.Porter ME. What is value in health care? N Engl J Med. 2010. Dec 23;363:2477–2481. [DOI] [PubMed] [Google Scholar]