

Abstract
A rapid analytical method for per- and polyfluoroalkyl substances (PFASs) combining nano-electrospray ionization and high-resolution mass spectrometry (Nano-ESI-HRMS) was developed and applied to aqueous film-forming foams (AFFFs) and wastewater samples collected from three local wastewater treatment plants (WWTPs). This method exhibited high sensitivity with lower limits of detection (LODs) of 3.2~36.2 ng/L for 22 target PFAS analytes. In AFFF formulations, Nano-ESI-HRMS enabled the first-time detection of trifluoromethanesulfonic acid (TFMS), perfluoroethyl cyclohexanesulfonate (PFECHS), 6:2 fluorotelomer sulfonyl amido sulfonic acid (6:2 FTSAS-SO2), N-ammoniopropyl perfluoroalkanesulfonamidopropylsulfonate (N-AmP-FASAPS, n=3-6), ketone-perfluorooctanesulfonic acid (Keto-PFOS), fluorotelomer unsaturated amide sulfonic acid (FTUAmS, n=7), and 6:2 fluorotelomer amide (6:2 FTAm). Their structures were verified by the tandem MS analysis using collision-induced dissociation. Further, the combination of absolute and semi-quantification results revealed 16 PFASs from 9 PFAS classes as dominant AFFF constituents, accounting for 88.2~96.5% of the total detected anionic and zwitterionic PFASs, including perfluorinated sulfonic acids (PFSAs, n=1,4~8), 6:2 fluorotelomer sulfonates (6:2 FTS), fluorotelomer thioether amido sulfonic acid (FTSAS, n=6,8), fluorotelomer sulfinyl amido sulfonic acid (FTSAS-SO, n=6,8), N-AmP-FASAPS (n=6), 6:2 fluorotelomer sulfonamide alkylbetaine (6:2 FTAB), perfluoroalkylsulfonamido amino carboxylate (PFASAC, n=6), 2-((perfluorooctyl)thio)acetatic acid (Thio-8:2 FTCA), and 6:2 FTAm. At WWTPs, aerobic and anaerobic biotransformation of PFAS precursors at the aeration tanks and secondary clarifiers were evident by the generation of mid/short-chain perfluoroalkyl acids, such as perfluoroheptanoic acid (PFHpA), perfluorohexanoic acid (PFHxA), perfluoropentanoic acid (PFPeA), as well as the emergence of ultrashort trifluoroacetic acid (TFA) and TFMS and several novel fluorotelomer carboxylic acids (FTCAs). Overall, Nano-ESI-HRMS enabled comprehensive PFAS quantitative analysis and suspect screening, applicable for rapid investigation and assessment of PFAS-related exposure and treatment in environmental matrixes. Our results also revealed that AFFFs and municipal wastewaters are two key sources contributing to the prevalent detection of ultrashort-chain PFASs (e.g., TFMS and TFA) in water.
Keywords: PFASs, Nano-ESI, HRMS, AFFFs, wastewater, TFMS
1. INTRODUCTION
Per- and polyfluorinated alkyl substances (PFASs) refer to a class of anthropogenic chemicals that have been widely used in aqueous film-forming foams (AFFFs) and other commercial applications for over 60 years (Buck et al. 2011, Chiu and Lo 2000, Schaider et al. 2017). To date, over 5,000 PFASs have been reported (Liu et al. 2019), and a majority are concerned with potential risks to human and animal health (Gaballah et al. 2020, Lindstrom et al. 2011, Patlewicz et al. 2019, Shi et al. 2017). In 2016, Environmental Protection Agency (EPA) established a strict health advisory level at 70 ng/L for perfluorooctanoic acid (PFOA) and perfluorooctanesulfonic acid (PFOS) in drinking water (USEPA 2016). Accordingly, several states, such as New York, New Jersey, and New Hampshire, have legislated comparable or more rigid regulations on PFASs at 10~13 ng/L (Kucharzyk et al. 2017).
Several standard methods (e.g., Method 537.1 and 533) using liquid chromatography coupled with tandem mass spectrometry (LC/MS/MS) were released by EPA for the environmental analysis of an array of target PFASs, including perfluorinated sulfonic acids (PFSAs), perfluorinated carboxylic acids (PFCAs), fluorotelomer sulfonic acids (FTSs), hexafluoropropylene oxide dimer acid (HFPO-DA, also known as GenX), chlorinated perfluoroalkyl sulfonic acids (Cl-PFSAs), and N-alkyl perfluorooctanesulfonamidoacetic acid (N-FOSAAs) (USEPA 2018, 2019). Target PFAS analysis using these standardized methods has been widely adopted in research and commercial labs, since it can monitor regulated compounds (e.g., PFOS and PFOA), enables the screening for the occurrence of a core collection of PFASs that could be indicators for the presence of other “unknown” PFASs (Hamid et al. 2018), and is readily available and relatively affordable. Despite these advantages, LC/MS/MS-based PFAS analysis can be relatively time- and labor-consuming. First, these methods involve many operational parameters (e.g., the ingredient and gradient of mobile phases) that demand adaptation and optimization to achieve satisfactory separation and sensitivity of individual target PFASs, and such process can become challenging with the increasing number of target analytes (Coggan et al. 2019a, Gremmel et al. 2017). Further, LC separation typically takes 10~30 min for each run (Boiteux et al. 2016, Coggan et al. 2019a, Luo et al. 2020, Mulabagal et al. 2018, Ruyle et al. 2021). Considering the large sampling size for field investigation (e.g., 100~200 samples for profiling the distribution of PFASs at WWTPs (Coggan et al. 2019b, Semerád et al. 2020) and AFFF-impacted aquifers (Favreau et al. 2017, Luo et al. 2020)), it is of significant value to develop PFAS analytical approaches that can be easily adapted and allow rapid analysis.
To expedite and advance PFAS analysis, nano-electrospray ionization (Nano-ESI) represents a promising alternative for sample injection as it is reputed for high sensitivity, short run time, and low injection volume demand (Karas et al. 2000, Wilm and Mann 1994). Nano-ESI refers to ESI that is equipped with an ultrathin emitter (usually 10~100 micrometer in diameter). The ultrathin emitter can be charged at high voltage (~kV) to produce nanodroplets from samples or extracts (Figure S1), promoting efficient ionization and diminishing salt interference (Enaksha et al. 2006, Gremmel et al. 2017, Karas et al. 2000). Injection by Nano-ESI can also reduce matrix effects since it creates high surface tensions and facilitates more stable and uniform spraying of sample droplets as compared to conventional ESI (Juraschek et al. 1999, Karas et al. 2000). Notably, even with a small injection volume (e.g., 1 μL), Nano-ESI can generate a signal intensity 2 to 3 times higher than that detected by the conventional ESI, conducive to substantial improvement in sensitivity (Wilm and Mann 1996). Furthermore, the emitter can be easily replaced for each sample to avoid cross-contamination carried over from prior injections (Gremmel et al. 2017, Karas et al. 2000). As there is no chromatographic separation, the running time for Nano-ESI can be as short as 1~2 min.
Given the increasing number of newly identified PFASs, interest in screening and quantitative analysis of these non-target PFASs by high-resolution mass spectrometry (HRMS) has escalated over the past decade (Barzen-Hanson et al. 2017b, Gago-Ferrero et al. 2015, Liu et al. 2015, Place and Field 2012, Strynar et al. 2015, Wang et al. 2020, Wang et al. 2018). HRMS enables accurate screening (i.e., mass error ≤5 ppm) of mass features due to its high spectral resolving power (e.g., 140,000 for Orbitrap) without a prior need for standards that are either expensive or inaccessible (D’Agostino and Mabury 2013, Place and Field 2012, Trier et al. 2011). Collision-induced dissociation (CID) can be further employed for identifying the fragmentation pattern and determining the relative position of moieties within a molecule of interest (Johnson and Carlson 2015), allowing structural prediction and validation (Cooks 1995, Fornal 2014, Pérez-Ortega et al. 2016).
This study combined the Nano-ESI injection with the HRMS detection, namely Nano-ESI-HRMS, for the rapid, sensitive, and robust PFAS analysis and suspect screening. Detection sensitivity and accuracy of 22 target PFASs (Table S1), including PFCAs, PFSAs, fluorotelomer carboxylic acids (FTCAs), FTSs, and HFPO-DA, were compared between Nano-ESI-HRMS and LC/MS/MS. PFAS suspect screening was conducted to profile dominant anionic and zwitterionic PFAS constituents in three AFFF formulations and unveil the dynamics of possible PFAS features along with the conventional wastewater treatment processes. We also designed a streamlined 2-level classification scheme to synergize absolute quantification of target analytes and semi-quantitation of suspect features for the comprehensive analysis of PFASs compatible with limited availability of reference and calibration standards. The development of this novel analytical approach with Nano-ESI-HRMS has prominent potential to assist and promote the imminent investigation of fate, behavior, and exposure of PFASs in water and other matrices.
2. MATERIALS AND METHODS
2.1. Chemicals, Reagents, and Terminology.
Reagents, solvents, and standards used in this study are described and listed in the Supporting Information (SI). As suggested by EPA method 537.1, a mixed internal standard (IS) solution consisting of 4 mass-labeled PFASs (M8-PFOA, M8-PFOS, M2-6:2 FTCA, and M2-6:2 FTS in Table S1) was prepared at the concentration of 500 μg/L, targeting the quantification for the four main groups of PFASs (i.e., PFCAs, PFSAs, FTCAs, and FTSs). This mixed IS solution was added to calibration solutions and samples to achieve a concentration of 10 μg/L prior to the analysis by Nano-ESI-HRMS or LC/MS/MS. M4-perfluorohexanesulfonic acid (M4-PFHxS) was used as a surrogate to track the efficiency of PFAS extraction in wastewater samples (Zhang et al. 2019, Zhang et al. 2021). The surrogate stock solution was prepared by diluting its commercial standard solution with methanol (with 4% DI water) to achieve the concentration of 200 μg/L for M4-PFHxS (USEPA 2018).
In this study, target PFASs refer to the 22 PFASs available with non-mass labeled analytical standards (Table S1), used to compare the detection sensitivity and accuracy between Nano-ESI-HRMS and LC/MS/MS. The total concentration of 22 target PFASs was noted as Σ22PFASs. Suspect PFASs refer to the non-target positive hits that match the local PFAS database (see details in SI) with the mass error threshold of 5 ppm. The total anionic/zwitterionic PFASs detected under the ESI− condition were represented as ΣPFASs− for simplicity. Analytical standards were not available for suspect PFASs, except trifluoromethanesulfonic acid (TFMS). All the acronyms of this study are summarized in Table S2.
2.2. Sample Collection.
AFFF formulations.
Three AFFF formulations (Table S3) were subsampled from three air force bases (AFBs) and kept in 15-mL conical polypropylene centrifuge tubes prior to the analysis at New Jersey Institute of Technology (NJIT). The first AFFF sample was manufactured by National Foam in 1983 and collected directly from its original product container at the Eglin AFB. The second sample was a 3M AFFF product dated in 1989 and collected from the original container at the Galena AFB. The third AFFF from the Massachusetts Military Reservation (Cape Cod, MA) was a 1999 version of alcohol resistant-AFFF (AR-AFFF) from 3M. The material safety data sheet (MSDS) of this AR-AFFF indicates a mixture of the standard electrochemical fluorination (ECF)-based 3M AFFF and fluorinated additives with unknown manufacturer to maintain a film in the presence of alcohols. In this study, three formulations are designated as AFFF-1983, AFFF-1989, and AFFF-1999, respectively, representing a diversity of AFFF formulations with different manufacturing sources.
Wastewater samples.
Water samples were collected from three domestic WWTPs (Plant R, P, and L) in northern New Jersey between July and August 2020. Their operation parameters are outlined in Table S4. At each WWTP, wastewater samples were collected in sequence from the primary influent tank (after coarse filtration), the aeration tank (with activated sludge), the secondary clarifier tank, and the final effluent (after disinfection), designated as INF, ARE, CLA, and EFF, respectively. All high-density polyethylene (HDPE) sampling bottles were rinsed with methanol and reagent water in the lab (Backe et al. 2013) and with wastewater samples three times at the sampling site. Wastewater samples were then filled into 500-mL HDPE bottles leaving no air in the headspace. Samples were kept in a cooler with ice during the delivery to NJIT and filtered through 0.22-μM polyethersulfone (PES) membrane to remove the biomass and other suspended particles prior to the storage at 4 °C. To discern the amount of 22 target analytes or other interferences introduced by sampling and analytical activities, field reagent blanks (FRBs) were taken and handled along with each sample set in triplicate following the description in EPA Method 537.1 (USEPA 2018). More details about the wastewater sampling are provided in the SI.
2.3. Sample Preparation.
AFFF formulations.
All AFFFs were diluted with methanol by a factor of 100,000 and filtered by 0.22-μm PES membrane.
Wastewater samples.
Within 48 h after the sample collection, all wastewater samples were repeatedly sonicated and gently mixed in their original sampling bottles as previously described (Backe et al. 2013). Subsequently, solid-phase extraction (SPE) was carried out for PFAS extraction from WWTP water samples following the standard EPA Method 537.1 with slight modification (see details in SI). The extract (4 mL) was evaporated to dryness with the constant nitrogen flow in a water bath heated at 62 °C and then dissolved in 1 mL methanol (containing 4% water).
All AFFF and wastewater samples were spiked with the addition of 10 μL of the mixed IS solution and vigorously mixed before the quantitative analysis and suspect screening by Nano-ESI-HRMS or LC/MS/MS.
2.4. PFAS Analytical Apparatus by LC/MS/MS and Nano-ESI-HRMS.
For LC/MS/MS analysis, following the EPA Method 537.1 and previous studies (Coggan et al. 2019a, Gremmel et al. 2017), 22 target PFASs were analyzed using a 1290 Infinity II HPLC system in tandem with 6470A triple quadrupole mass spectrometer (Agilent, Santa Clara, CA)(Liu et al. 2021). Operation information of LC/MS/MS is detailed in SI. PFAS analysis by Nano-ESI-HRMS was operated by a high-resolution Q Exactive hybrid quadrupole–Orbitrap mass spectrometer (Thermo Fisher Scientific, San Jose, CA) equipped with a Nano-ESI injector. The emitter tip was pulled using a laser puller (Model P-2000, Sutter Internet, Novato, CA). The capillary temperature was set at 350 °C. The sample injection flow rate was 2 μL/min with −3.0 kV potential applied to the Nano-ESI emitter. The resolution of 140,000 was selected for the HRMS with the spectra obtained based on a scan time of 2.0 min (80 scans). MS spectra results were not collected until the automatic gain control (AGC) target achieved 100% with the total ion current (TIC) variation below 10%. MS1 data were collected under the full scan mode in the range of 50~750 m/z with no collision energy applied. Based on the suspect screening result of MS1 data, potential m/z species were manually selected for CID to collect MS2 data. For select mass species of interest, MS2 data were collected under the data-dependent acquisition (DDA) mode when CID was manually applied. The quadrupole filter was set to distinguish the mass difference of ±0.2 Da at m/z 200, resulting in a full width half maximum (FWHM) resolution of 500 (=m/dm). When two or more molecules were captured by MS1, parent ions and their daughter ions were determined based on their co-occurrence in the MS2 spectrum and the intensity shifting pattern in response to the applied collision energy (CE). Details about laboratory calibration, instrument lower limits of detection (LODs), and method detection limits (MDLs) are provided in the SI.
2.5. Suspect Screening and Analyte Identification.
Following Barzen-Hanson’s work (Barzen-Hanson et al. 2017b), the suspect screening method was developed to process Nano-ESI-HRMS data, consisting of four steps: local database construction, background noise removal, positive hit screening, and molecular structure validation.
A local PFAS database, consisting of the chemical formulae, SMILES structures, monoisotopic molecular weights, and putative monoisotopic anionic weight of ~7,300 PFASs, was constructed based on the Master List of PFAS Substances (USEPA 2020) and timely updates from recent publications (Allred et al. 2014, Backe et al. 2013, Barzen-Hanson et al. 2017a, Barzen-Hanson and Field 2015, Barzen-Hanson et al. 2017b, Chen et al. 2020, Field et al. 2017, Kang et al. 2020, Li et al. 2020, Liu and Mejia Avendano 2013, Liu et al. 2019, Luo et al. 2020, Wang et al. 2020, Washington et al. 2020). For each sample, the Nano-ESI-HRMS analysis generated a list of mass species (m/z) and their intensities as MS1 data exported by Xcalibur (ThermoFisher Scientific, USA) from the raw HRMS data file. Background mass species were subtracted from the samples’ peak list by traversal comparison between laboratory reagent blanks (LRBs), methanol solvent controls, and samples, according to the criteria listed in SI. After removing background noises, mass spectra were matched with those in our local database based on a mass error threshold of 5 ppm. Additional criteria for screening the positive hits are listed in the SI. All positive hits were gathered as a suspect screening list and ranked by the intensity with a cutoff at 105 (a.u.). Ions’ structures were further examined based on the fragmentation patterns in MS2 data obtained by CID. The confidence levels of suspect PFASs were then determined following the rules indicated by Schymanski et al. (Schymanski et al. 2014).
2.6. Semi-quantification of Suspect PFASs.
To estimate the concentration of the suspect PFASs in AFFF formulations, a streamlined semi-quantifiable (SQ) approach was developed following previous reports (Allred et al. 2014, Backe et al. 2013, Jacob et al. 2021). After structural examination by CID, PFAS analytes of interest (AOIs, see in Table 2) were divided into five groups following a two-level classification scheme as depicted in Figure S2. In Level 1 classification, each PFAS AOI was primarily assigned into one of the three major groups based on its terminal functional group, including the sulfonate group −SO3−, the carboxylate group −COO−, and the amide group −CONH2, since terminal groups govern the ionization efficiencies in ESI. Level 2 classification is further based on the presence of alkyl carbons, particularly those adjacent to the terminal functional groups, as they interfere with the polarity distinctively from a perfluorinated chain. Four isotopic labeled ISs were assigned as the quantify marker (QM) for each group. Accordingly, appropriate calibration curves were used for semi-quantification by choosing the standards with similar functional moieties and chain lengths. More details for the selection of QM and referred calibration curves are introduced in SI.
Table 2.
Profiling of dominant PFAS constituents (highlighted in red) in three AFFF formulations. (achieved by Nano-ESI-HRMS, under ESI− mode)
| PFAS Group | PFAS Class | PFAS | Confidence Levela | Quantification Type | QM | Calibration Reference | (Semi-) Quantified Conc. (μg/mL) | Referencesb | |||||
|---|---|---|---|---|---|---|---|---|---|---|---|---|---|
| 1983 | 1989 | 1999 | Freq in ECF-based AFFFsc | Freq in FT-based AFFFsd | Conc. in AFFFse (μg/mL) | ||||||||
| PFSg | PFSA | A | TFMS * | 1 | Ab | M8-PFOS | TFMS | 106.7 | 29.5 | 383.6 | N/A | N/A | N/A |
| PFPrS | 2a | SQ | M8-PFOS | PFBS | - | 52.1 | 16.7 | 5/5 | N/A | 120~270 | |||
| PFBS | 1 | Ab | M8-PFOS | PFBS | 1.1 | 120.2 | 38.4 | 10/10 | N/A | 160~380 | |||
| PFPeS | 2a | SQ | M8-PFOS | PFHxS | - | 178.2 | 56.8 | 5/5 | N/A | 80~210 | |||
| PFHxS | 1 | Ab | M8-PFOS | PFHxS | 9 | 549.4 | 23.5 | 16/16 | N/A | 760~1,700 | |||
| PFHpS | 1 | Ab | M8-PFOS | PFHpS | 3.2 | 185.6 | 53.8 | 11/11 | N/A | 93~410 | |||
| PFOS | 1 | Ab | M8-PFOS | PFOS | 135.3 | 10949.6 | 3405.7 | 16/16 | N/A | 6,700,~15,000 | |||
| PFNS | 1 | Ab | M8-PFOS | PFOS | - | 55.4 | 19.3 | 5/5 | N/A | 9~160 | |||
| PFDS | 1 | Ab | M8-PFOS | PFDS | - | 24.6 | 9.1 | 5/5 | N/A | 11~102 | |||
| H-PFAS | B | H-PFOS | 3 | SQ | M8-PFOS | PFOS | - | 25.7 | 10.3 | 9/10 | 1/7 | N/A | |
| H-UPFAS | C | H-UPFOS | 3 | SQ | M8-PFOS | PFOS | - | 19.8 | 6.7 | 7/10 | 7/14 | N/A | |
| Cl-PFSA | D | Cl-PFOS | 2b | SQ | M8-PFOS | PFOS | - | 34.4 | 17 | 3/10 | 1/7 | N/A | |
| Cyclic-PFSA | E | PFECHS* | 2b | SQ | M8-PFOS | PFOS | - | 87.7 | - | N/A | N/A | N/A | |
| n-F5S-PFSA | F | n-F5S-PFOS | 2a | SQ | M8-PFOS | PFOS | - | 56.7 | 15.9 | 7/10 | 1/7 | N/A | |
| n-F5S-PFNS | 2a | SQ | M8-PFOS | PFOS | - | 24.7 | 5.8 | 7/10 | 1/7 | N/A | |||
| Keto-PFSA | G | Keto-PFOS* | 3 | SQ | M8-PFOS | PFOS | - | 14.3 | 5.5 | 8/10 | 1/7 | N/A | |
| FTSg | n:2 FTS | H | 6:2 FTS | 1 | Ab | M2-6:2 FTS | 6:2 FTS | 166 | - | 29.6 | N/A | 8/13 | 42~53 |
| 8:2 FTS | 1 | Ab | M2-6:2 FTS | 8:2 FTS | 54.4 | - | - | N/A | 4/13 | 19~56 | |||
| 10:2 FTS | 2a | SQ | M2-6:2 FTS | 8:2 FTS | 17 | - | - | N/A | 2/7 | N/A | |||
| FTSAS | I | 6:2 FTSAS | 2a | SQ | M2-6:2 FTS | 6:2 FTS | 821.7 | - | 1049.1 | N/A | 32/56 | 0.3~11,000 | |
| 8:2 FTSAS | 2a | SQ | M2-6:2 FTS | 8:2 FTS | - | - | 996.3 | N/A | 15/56 | 24~1,100 | |||
| FTSAS-SO | J | 6:2 FTSAS-SO | 2a | SQ | M2-6:2 FTS | 6:2 FTS | 142.4 | - | 279.2 | N/A | 19/36 | N/A | |
| 8:2 FTSAS-SO | 2a | SQ | M2-6:2 FTS | 8:2 FTS | - | - | 271.3 | N/A | 6/12 | N/A | |||
| N-AmP-FASAPS | K | N-AmP-FPrSAPS (n=3)* | 2b | SQ | M2-6:2 FTS | 6:2 FTS | - | 15.2 | 10.2 | N/A | N/A | N/A | |
| N-AmP-FBSAPS(n=4)* | 2b | SQ | M2-6:2 FTS | 6:2 FTS | - | 30.9 | 16.7 | N/A | N/A | N/A | |||
| N-AmP-FPeSAPS(n=5)* | 2b | SQ | M2-6:2 FTS | 6:2 FTS | - | 27 | 12.3 | N/A | N/A | N/A | |||
| N-AmP-FHxSAPS (n=6) * | 2b | SQ | M2-6:2 FTS | 6:2 FTS | - | 174.2 | 80.1 | N/A | N/A | N/A | |||
| FTUAmS | L | FTUAmS(n=7)* | 3 | SQ | M2-6:2 FTS | 6:2 FTS | 57.1 | N/A | N/A | N/A | |||
| PFCg | PFCA | M | PFPeA | 1 | Ab | M8-PFOA | PFPeA | - | 8.7 | 3.2 | 5/5 | N/A | 36~52 |
| PFHxA | 1 | Ab | M8-PFOA | PFHxA | - | 50.4 | 17.4 | 5/5 | N/A | 99 ~170 | |||
| PFHpA | 1 | Ab | M8-PFOA | PFHpA | - | 17.2 | 9.7 | 5/5 | 3/7 | 22~54 | |||
| PFOA | 1 | Ab | M8-PFOA | PFOA | - | 88.1 | 19.6 | 5/5 | 2/7 | 83~170 | |||
| FTCg | FTAB | N | 6:2 FTAB | 2a | SQ | M2-6:2 FTCA | 6:2 FTCA | 450.1 | - | - | N/A | 21/56 | 0.1~4,800 |
| 8:2 FTAB | 2a | SQ | M2-6:2 FTCA | 6:2 FTCA | 83.1 | - | - | N/A | 14/56 | 540~1,800 | |||
| n:2 FTCA | O | 8:2 FTCA | 2a | SQ | M2-6:2 FTCA | 6:2 FTCA | 3.4 | - | 26.6 | N/A | N/A | N/A | |
| PFASAC | P | PFASAC (n=4) | 2a | SQ | M2-6:2 FTCA | 6:2 FTCA | - | - | 56.3 | 9/13 | 1/12 | 110~150 | |
| PFASAC (n=6) | 2a | SQ | M2-6:2 FTCA | 6:2 FTCA | - | - | 211.1 | 9/13 | 1/12 | 850~960 | |||
| Thio-FTCA | Q | Thio-8:2 FTCA * | 4 | SQ | M2-6:2 FTCA | 6:2 FTCA | 299.5 | 214.1 | 246.2 | N/A | N/A | N/A | |
| FT-POCHC | R | 8:2 FT-POCHC* | 4 | SQ | M2-6:2 FTCA | 6:2FTCA | 72.5 | - | - | N/A | N/A | N/A | |
| FTAmg | n:2 FTAm | S | 6:2 FTAm * | 3 | SQ | M2-6:2 FTCA | 6:2FTCA | - | 332.4 | 412.5 | N/A | N/A | N/A |
Defined by Schymanski et al.(Schymanski et al. 2014)
Comparison of PFAS detection frequencies and concentrations in AFFF formulations in previously reported references (Backe et al. 2013, Barzen-Hanson and Field 2015, Barzen-Hanson et al. 2017b, D’Agostino and Mabury 2013, Field et al. 2017, Luo et al. 2020, Place and Field 2012).
The frequency that has been reported in electrochemical fluorination (ECF)-based AFFF formulations.
The frequency that has been reported in fluorotelomerization (FT)-based AFFF formulations.
The concentration range that has been reported in selected references.
: PFAS structures that are reported for the first time in AFFF formulations
-: not detected or < LOQ.
N/A: not analyzed or not reported in all 7 references.
2.7. Quality Assurance, Quality Control, Precision, and Accuracy.
For quality assurance and quality control, LRBs and FRBs were prepared as described in EPA Method 537.1 (USEPA 2018) (see SI). The precision and accuracy were determined by taking the percent relative standard deviation (as %RSD) and average percent recovery of 7 laboratory fortified blank (LFB) replicates (USEPA 2018), respectively. In addition, continuing calibration check (CCC) (USEPA 2018) was performed at the beginning of each analysis batch, after every ten field samples, and at the end of the analysis batch, to verify the instrument sensitivity and method calibration.
3. RESULTS AND DISCUSSION
3.1. Sensitive and Accurate PFAS Analysis by Nano-ESI-HRMS
Detection by Nano-ESI-HRMS exhibited high sensitivity for the analysis of 22 target PFASs, achieving low LODs in the range from 3.2 to 36.2 ng/L (Table 1). For LC/MS/MS, good separation was achieved of all 22 target analytes (Figure S3 and Table S5), though their LODs exhibited a two-order-of-magnitude span from 1.1 to 135.6 ng/L (Table 1). Our LC/MS/MS method was optimized for detecting C4-C8 PFSAs and C6-C8 PFCAs that are of primary concern by regulatory agencies with LODs in the range of 1.1 to 15.2 ng/L. However, this method was less sensitive in detecting precursor compounds, particularly FTSs and GenX, with LODs greater than 60 ng/L. In contrast, Nano-ESI-HRMS exhibited sensitive detection of both C4-C8 perfluoroalkyl acids (PFAAs) and precursor compounds (e.g., FTCAs, fluorotelomer unsaturated carboxylic acids [FTUCAs], FTSs, and HFPO-DA). For these precursor compounds, LODs of Nano-ESI-HRMS were 1.2 to 15.6 folds lower than those of LC/MS/MS. Compared to LC/MS/MS, Nano-ESI-HRMS showed similar or higher sensitivity towards all target PFASs of different chain lengths and functional moieties, likely due to the uniformly formed nanodroplets (Figure S1) precluding bias derived from the chromatographic separation and solvent elution.
Table 1.
Instrument LODs and R2 of calibration curves for 22 target PFAS analytes by Nano-ESI-HRMS and LC/MS/MS.
| Category | Analyte | Nano-ESI-HRMS | LC/MS/MS | ||
|---|---|---|---|---|---|
| LOD (ng/L) | R2 | LOD (ng/L) | R2 | ||
| PFSAs | PFBS | 20.4 | 0.9997 | 2.3 | 0.9970 |
| PFHxS | 25.1 | 0.9999 | 1.3 | 1.0000 | |
| PFHpS | 6.6 | 0.9996 | 1.1 | 0.9983 | |
| PFOS | 14.0 | 0.9999 | 4.0 | 0.9999 | |
| PFDS | 4.2 | 0.9999 | 4.6 | 0.9997 | |
| PFCAs | PFBA | 24.3 | 0.9998 | 58.5 | 0.9996 |
| PFPeA | 14.5 | 0.9997 | 15.2 | 0.9995 | |
| PFHxA | 14.2 | 0.9999 | 8.0 | 0.9999 | |
| PFHpA | 26.4 | 1.0000 | 13.9 | 0.9968 | |
| PFOA | 36.2 | 0.9999 | 9.5 | 0.9981 | |
| PFNA | 3.3 | 0.9999 | 14.2 | 0.9905 | |
| PFDA | 4.3 | 0.9996 | 87.8 | 0.9987 | |
| PFUdA | 6.8 | 0.9998 | 51.8 | 0.9997 | |
| PFDoA | 10.7 | 0.9991 | 31.7 | 0.9999 | |
| PFTrDA | 7.0 | 0.9998 | 42.7 | 0.9996 | |
| PFTeDA | 9.3 | 0.9999 | 50.2 | 0.9999 | |
| FT(U)CAs | 5:3 FTCA | 22.7 | 0.9996 | 28.1 | 0.9937 |
| 6:2 FTUCA | 12.4 | 0.9999 | 20.1 | 0.9972 | |
| 6:2 FTCA | 3.2 | 0.9998 | 6.7 | 0.9991 | |
| FTSs | 6:2 FTS | 7.5 | 1.0000 | 66.3 | 0.9991 |
| 8:2 FTS | 8.7 | 0.9999 | 135.6 | 0.9996 | |
| HFPO-DA | GenX | 6.4 | 0.9999 | 96.6 | 0.9997 |
The precision (% RSD) and accuracy (% recovery) for the Nano-ESI-HRMS analysis were further assessed by a surrogate-corrected recovery experiment with 7 LFB replicates spiked with 5 ng of 22 target PFASs. As shown in Figure S4a, the precision (2~11%) reflected the high repeatability and reliability of PFAS analysis by Nano-ESI-HRMS. Figure S4b showed mean surrogate-corrected recovery rates between 87% and 120% for 16 PFASs. Five PFASs (i.e., perfluorododecanoic acid [PFDoA], PFHxS, 5:3 FTCA, 8:2 FTS, and HFPO-DA) had recoveries between 120% and 130%, and perfluoroundecanoic acid (PFUdA) had a mean recovery of 133%. The recoveries in the range of 87~133% met the requirement of EPA Method 537.1 (50~150%). They presented a comparable performance to previous records for the analyses of PFCAs, PFSAs, and FTSs (87~99% (Backe et al. 2013), 70~149% (Gremmel et al. 2017), and 80~134% (Coggan et al. 2019a)), validating the effectiveness and robustness of Nano-ESI-HRMS for the analysis of mixed PFASs at environment-relevant concentrations.
Furthermore, we quantitatively analyzed 22 target PFASs in 3 AFFF formations and 12 wastewater samples using Nano-ESI-HRMS and LC/MS/MS, respectively. As shown in Figure S5, results obtained from both detection methods reached good agreement with each other, as evident by the significant correlation (Pearson’s τ > 0.95) with linear slopes closing to 1 and R2 values greater than 0.91. This supports reliable quantitative analysis of PFASs by Nano-ESI-HRMS in diverse environmental samples, which was validated by the EPA standardized method using LC/MS/MS. Chromatographic separation is renowned for its ability to alleviate matrix effects from coexisting ions, which thus boosts the MS response. The consensus results between Nano-ESI-HRMS and LC/MS/MS analyses revealed no distinguishable matrix effects for the Nano-ESI-HRMS analysis even with no chromatographic separation employed. Detailed discussion on comparing results by both methods are provided in the SI. The following sections focus on novel quantitative and qualitative results in AFFF formulations and wastewater samples obtained by Nano-ESI-HRMS.
3.2. Discovery of Novel AFFF Constituents
Suspect screening by Nano-ESI-HRMS enabled the discovery of 12 chemicals from 9 novel PFAS classes, to the best of our knowledge, which have yet been reported in AFFF formulations, namely TFMS, perfluoroethyl cyclohexanesulfonate (PFECHS), ketone-perfluorooctanesulfonic acid (Keto-PFOS), fluorotelomer sulfonyl amido sulfonic acid (FTSAS-SO2), N-AmmonioPropyl perFluoroAlkaneSulfonAmidoPropylSulfonate (N-AmP-FASAPS), fluorotelomer unsaturated amide sulfonic acid (FTUAmS), fluorotelomer amide (FTAm), 2-((perfluoroalkyl)thio)acetatic acid (Thio-n:2 FTCA), and 2-(((perfluoroalkyl-3-yl)oxy)carbonyl)hydrazine-1-carboxylate (n:2 FT-POCHC) (Table 2). Among them, 7 PFAS classes had the detection confidence level 3 and above, as their structures can be validated by CID MS/MS spectra (Figures S9, S11–S33), while no CID spectra were available for Thio-8:2 FTCA and 8:2 FT-POCHC (level 4). Note that masses (m/z) of N-AmP-FASAPS, FTUAmS, and FTAm anions showed positive matches with the formula records in the local database. However, during the structure validation, their CID spectra revealed that these mass features were novel isomers because their fragmentation patterns were incompatible with the recorded structures for the corresponding masses. IUPAC-like names, ion formula, exact masses, mass error (Table S6), and chemical structure (Figure 1) are provided for all newly identified PFASs to complement the discussion below for TFMS, PFECHS, and N-AmP-FASAPS, as well as in the SI for the other 6 PFAS classes.
Figure 1.

Structures and chain lengths of major PFAS constituents detected in three 3M AFFF formulations. Five PFAS groups include (1) perfluorinated sulfonate group (PFSg), (2) fluorotelomer sulfonate group (FTSg), (3) perfluorinated carboxylate group (PFCg), (4) fluorotelomer carboxylate group (FTCg), and (5) fluorotelomer amide group (FTAmg).
TFMS.
The MS/MS CID spectrum of TFMS (Figure 2a and S9) revealed the detection of m/z 148.9517 matched with the theoretical monoisotopic mass of the CF3SO3− anion (m/z 148.9520) by a mass error of 1.9 ppm. The daughter m/z 80 was identified as the sulfite radical anion (•SO3−). This CID spectrum was further verified by a commercial standard of TFMS (>99%, Sigma-Aldrich, USA). A calibration curve was constructed with this standard in the concentration range from 0.39 ng/L to 12.5 μg/L (Figure S10). TFMS concentrations were thus quantified as 106.7±2.6 μg/mL in AFFF-1983, 29.5±0.6 μg/mL in AFFF-1989, and 383.6±32.8 μg/mL in AFFF-1999 (Table 2). A recent site survey reported the widespread presence of TFMS at concentrations up to 940 ng/L near the source and downstream of five firefighting training sites with the historical use of AFFFs (Björnsdotter et al. 2019). Furthermore, TFMS has also been detected at high frequencies in leachates, storm water, and surface water in the proximity of municipal and industrial landfills and hazardous waste management facilities (Björnsdotter et al. 2019), as well as groundwater and surface water that serve as drinking water sources (Schulze et al. 2019). Though TFMS is known as a superacid widely used in organic synthesis (Björnsdotter et al. 2020, Kazakova and Vasilyev 2017), no documents are available to explain the prevalence of TFMS in AFFF formulations (Björnsdotter et al. 2020).
Figure 2.

MS/MS CID spectra of (a) TFMS anion (m/z 149), (b) PFECHS anion (n=8, m/z 461) and (c) N-AmP-FASAPS (n=6, m/z 605). Details about mass detection and errors of all three compounds are tabulated in Figure S10–S12.
In addition to TFMS, PFPrS, another representative ultrashort-chain PFAA, was also detected in AFFF-1989 and AFFF-1999 (Table 2) as an abundant AFFF ingredient. PFPrS (Figure S11) was confirmed by the CID observation of the deprotonated parent anion [M-H]− as well as two PFSA signature fragments (i.e., •SO3− and CnF2n+1−) (Barzen-Hanson et al. 2017b). PFPrS has been reported in 5 other AFFF formulations manufactured by 3M at the concentration from 120 to 270 μg/mL (Barzen-Hanson and Field 2015), as a potential residual derived from AFFF manufacture. Similarly, our semi-quantification results showed the detection of PFPrS at 52.1 and 16.7 μg/mL in AFFF-1989 and AFFF-1999, respectively, both of which were manufactured by 3M.
Ultrashort-chain PFAAs are highly persistent, mobile, and difficult to remove once entering the aquatic environment (Ateia et al. 2019, Björnsdotter et al. 2019). They can also be generated through the biotransformation of precursor compounds and lurked from treatment facilities (e.g., filtration) via desorption (Ateia et al. 2019, Yeung et al. 2017). Recent toxicology research revealed that even low TFMS exposure at 10 μg/kg could cause liver lipid metabolism disorders in mice (Zhou et al. 2020). The combination of their persistency, prevalence, and toxicity underscores the need to survey the distribution of ultrashort-chain PFAAs in the aquatic environment, which have been overlooked particularly at sites with historical AFFF applications. To date, TFMS and other ultrashort-chain PFAAs have been scarcely investigated, primarily due to the analytical challenges (e.g., low retention efficiency of C-18 column) of using LC separation (Barzen-Hanson and Field 2015, Björnsdotter et al. 2020). Therefore, our discovery of TFMS as a major constituent in AFFF formulations reconciles its prevalence at AFFFs-impacted sites (Björnsdotter et al. 2019) and thus calls for more attention to TFMS and other ultrashort-chain PFAAs.
PFECHS.
PFECHS (Figure 1E) was detected in AFFF-1989 at the concentration of 87.7 μg/mL using M8-PFOS as the internal standard and PFOS as the calibration reference, respectively. The CID spectrum (Figure 2b and S12) matched the MS/MS record of PFECHS reported by De Silva, et al.(De Silva et al. 2011), featured by its fragmentation into a C8 perfluoroalkyl carbanion with one degree of unsaturation (C8F15−, m/z 381) and the sulfonate group (-SO3, m/z 80) as the primary collision pathway. We postulated a cyclic structure between 1st and 6th carbon from the sulfonate head because the detected fragments cannot be explained by one single double bond. Assuming the existence of a double bond in this molecule, the concurrence of the saturated m/z 119 (C2F5−) and unsaturated m/z 131 (C3F5−), 181 (C4F7−), 231 (C5F9−), 281 (C6F11−), 331 (C7F13−), and 381(C8F15−) corroborated its location at 6th carbon. Contradictorily, m/z 241 (C4F6SO3−) and 292 (C5F8SO3−) suggested a location of the double bond between 1st and 4th carbon. Therefore, this PFAS feature was of great chance to contain a cyclic structure rather than a double bond and thus categorized as PFECHS in AFFF-1989. PFECHS is used as an erosion inhibitor for aircraft hydraulic fluids and was synthesized by 3M as commercial fluorochemical surfactant product FC-98 until the cessation of its production in 2002 (De Silva et al. 2011). PFECHS was widely detected at 0.16~5.65 ng/L in the Great Lakes (De Silva et al. 2011), 1.04~195 ng/L in the surface water downstream of airports (de Solla et al. 2012, Wang et al. 2016), and up to 77 ng/L in rivers (Marchiandi et al. 2021, Zhao et al. 2020). Despite the lack of direct evidence confirming the addition of PFECHS in this specific AFFF formulation, the detection of PFECHS in this study implies that certain AFFFs can be contributors to cyclic PFASs that may persist in the environment.
Note that unsaturated PFOS, an isomer of PFECHS but with a double bond, can also be an issue given its previous reports in AFFF formulations (Barzen-Hanson et al. 2017b), commercial products (Barzen-Hanson and Field 2015, Barzen-Hanson et al. 2017b), and human serum (McDonough et al. 2021). Thus, extra attention is needed to differentiate these isomers (PFECHS and unsaturated PFOS) when their physiochemical properties and environmental behaviors are further characterized.
N-AmP-FASAPS.
In AFFF-1989 and AFFF-1999, four homologues (n=3~6) belonging to the class of N-AmP-FASAPS (Figure 1K, Table 2) were identified at relatively high concentrations (10.2~174.2 μg/mL). As depicted in Figure 2c and S13, m/z 483 and 319 were detected as signatures of N-AmP-FASAPS (n=6), representing the mass fragments of this compound without the -C3H6SO3 side chain and the perfluorinated alkane tail -C6F13, respectively. The structure of N-AmP-FASAPS was further validated by its dissociation patterns, such as [CnF2n+1]− and [M-C3H6SO3]−, which were identical to N-SPAmP-FASAPS reported as the “class 5” PFASs by Barzen-Hanson et al. (Barzen-Hanson et al. 2017b), since these two PFAS classes shared the main chain of perfluoroalkane sulfon-amido-propyl-sulfonate (CnF2n+1NC3H6SO3) (Barzen-Hanson et al. 2017b). When n=3 and 5, the parent ions of N-AmP-FASAPS (Cn)/perfluoroalkylsulfonamido amino carboxylate (PFASAC, Cn+1) cannot completely separate in the CID spectra (Figures S14 and S15), because the m/z differences between these paired compounds were below ±0.2 Da in the MS1 data. Fortunately, both N-AmP-FASAPS (Cn) and PFASAC (Cn+1) were well collided, resulting in specific fragments that can be distinctively identified (Figure S14 and S15). This is the first report of N-AmP-FASAPS (n=3~6) in AFFF formulations (or any samples), and their relatively high concentrations and frequent detections underlined the need of further investigation.
3.3. Semi-Quantitative Profiling of Dominant PFASs in AFFF Formulations (under ESI−)
Based on the combination of our absolute and semi-quantification results, 40 PFASs in three AFFF formulations were outlined in Table 2, which met the intensity threshold of 0.1% of 20 μg/L M8-PFOS as the internal standard (equivalent to approximately 0.2 μg/mL before dilution). 40 PFASs were classified into 5 groups, including the perfluorinated sulfonate group (PFSg), fluorotelomer sulfonate group (FTSg), perfluorinated carboxylate group (PFCg), fluorotelomer carboxylate group (FTCg), and fluorotelomer amide group (FTAmg) (see details in the SI). Among them, we highlighted 16 PFASs (from 9 PFAS classes) necessitating priority attention (marked in red, Table 2) since (1) they were present at a concerning level (> 100 μg/mL) in one or more AFFF formulations, (2) they together accounted for the majority of ΣPFASs− in three AFFFs (88.2% for AFFF-1983, 95.2% for AFFF-1989, and 96.5% for AFFF-1999, Table S7), and (3) they, if not newly identified in this study, were reported frequently in previous investigations and surveys of PFASs in AFFF formulations that were typically manufactured via two processes: ECF-based and fluorotelomerization-based (FT-based) (Barzen-Hanson et al. 2017b, Place and Field 2012).
PFOS was the most detected PFSA at concentrations of 135.3±5.7, 10,949.6±459.9, and 3,405.7±143.0 μg/mL in AFFF-1983, 1989, and 1999, respectively, accounting for 5.6%, 81.9%, and 43.6% of ΣPFASs− in these AFFF formulations. Meanwhile, other PFSAs (n=2~7 and 9~10, Table 2) were also commonly found in these AFFFs at concentrations approximately one to two orders of magnitude lower than PFOS. Similarly, PFSA derivatives with substitutes (e.g., H-PFOS and Cl-PFOS) and functional moieties (e.g., Keto-PFOS) were detected below 100 μg/mL and only in AFFF-1989 and 1999, showing the relatively low contribution to the ΣPFASs− (⩽0.7%).
For PFAA precursors, FTSASs (6:2 and 8:2) followed by FTSAS-SO (6:2 and 8:2), 6:2 FTAB, PFASAC (n=6), and 6:2 FTS were most concerned in AFFF formulations. Particularly, 6:2 FTSAS presented at the concentration of 821.7±81.4 and 1,049.1±103.9 μg/mL in AFFF-1983 and 1999, accounting for 33.9% and 13.4% of the ΣPFASs−, respectively. 8:2 FTSAS was detected at 996.3±89.7 μg/mL in AFFF-1999, equivalent to 12.7% of the ΣPFASs−. In AFFF-1983, 6:2 FTSAS was the most abundant anionic constituent, with a concentration >5 times greater than PFOS. 6:2 FTSAS and 8:2 FTSAS were the second and third most abundant components in AFFF-1999, only lower than PFOS. Among 56 FT-based AFFF formulations, 32 and 15 were detected with 6:2 and 8:2 FTSAS at concentrations up to 11,000 and 1,100 μg/mL, respectively (Table 2), indicating their dominance in a variety of AFFF formulations.
6:2 FTSAS-SO showed concentrations of 142.4±19.1 and 279.2±25.1 μg/mL in AFFF-1983 and 1999, respectively; 8:2 FTSAS-SO was only detected in AFFF-1999 at 271.3±18.4 μg/mL, which contributed to 12.7% to the ΣPFASs−. Despite no quantitative data, 6:2 and 8:2 FTSAS-SOs were also detected at notable frequencies (19/36 and 6/12) in previous AFFF analyses (Table 2). Further, 6:2 and 8:2 FTABs were detected in AFFF-1983 at the concentrations of 450.1±49.1 and 83.1±6.4 μg/mL, respectively. PFASACs (n=4, 6) were detected in AFFF-1999 at the concentrations of 56.3±4.9 and 211.1±16.2 μg/mL, respectively. FTSs (n=6, 8, and 10) were detected in AFFF-1983 and 1999 in the concentration range between 17 and 166 μg/mL.
According to previous studies, FTSASs, FTSAS-SOs, FTABs, and FTSs were reported dominantly in the FT-based AFFF formulations, while predominant PFSAs with minor PFCAs were featuring constituents for ECF-based formulations (Barzen-Hanson et al. 2017b, D’Agostino and Mabury 2013, Place and Field 2012). As summarized in Table 2, AFFF-1983 was found as a typical FT-based formulation, which agrees with previous investigations on National Foam products (Barzen-Hanson et al. 2017a, Place and Field 2012). 3M AFFF products are reputed for the ECF-based manufacture process, which was proved in our study by the dominant presence of PFSAs (90.9% and 51.3%), especially PFOS (81.9% and 43.6%), and minor detection of PFCAs (1.2% and 0.6%) in AFFF-1989 and AFFF-1999. Uniquely, a noticeable proportion of fluorotelomers, including FTSASs (26.1%) and FTSAS-SOs (7.1%), were detected in AFFF-1999, which were rarely associated with 3M formulations. However, the presence of fluorotelomers (e.g., 6:2 FTSAS, 6:2 FTAB, and 6:2 FTS) have been reported in two AR-AFFF formations (Dauchy et al. 2017). Fluorotelomers were added as foam stabilizers in AR-AFFFs to improve the fire knockdown efficiency (Jho 2009). It is possible that 3M may have acquired fluorinated additives from other manufacturers, though the MSDS for AFFF-1999 did not explicitly indicate the supplier information or composition. Along with other reports, our results revealed the mixture of ECF-and FT-based PFAS constituents in AR-AFFF formulations, warranting further attention.
Note that target 22 PFASs (Σ22PFASs) only contributed partially to the ΣPFASs− (16.1%, 91.1%, and 47.3% for AFFF-1983, 1989, and 1999, Table S7). The profiling of PFASs revealed that 27 out of the top 40 dominant constituents in AFFF samples were non-target PFASs that are typically not covered by standardized methods using LC/MS/MS. The total concentrations of PFASs in FTCg and FTSg were 461.4 to 3285.0 μg/mL in three AFFF formulations (Table S7). Collectively, the contribution of ultrashort-chain PFAAs (e.g., TFMS) and polyfluorinated (fluorotelomer) compounds (e.g., FTSASs and FTSAS-SOs) was remarkable in AFFF formulations, necessitating future monitoring and remediation efforts at impacted sites.
3.4. Dynamics of Target PFASs over Conventional Wastewater Treatment
We further validated the environmental analysis by Nano-ESI-HRMS using wastewater samples collected from local WWTPs. As shown in Figure 3, the Σ22PFASs was 272.6±97.0 ng/L in the influents, 352.1±223.4 ng/L in aeration tanks, 382.5±304.1 ng/L in clarifier tanks, and 327.0±21.3 in the effluents, respectively. Individual target PFAS concentration data were pooled among three WWTPs to statistically discern the contribution of major wastewater treatment processes using the two-way Mann-Whitney U-test. Significant elevation of PFPeA, PFHxA, and PFHpA concentrations was evident across three WWTPs in the effluents compared to the influents (Figure 3).
Figure 3.

Boxplots of pooled concentration data of selected PFASs in wastewater samples from three WWTPs (n=9). Significant differences were determined by the two-way Mann-Whitney U-test (**, p <0.01, *, p <0.05).
The generation of several PFCAs was observed at aeration tanks. At Plant P, concentrations of PFPeA, PFHxA, PFHpA, and PFOA increased significantly in the aeration tank compared to those in the influent (8→98 ng/L, 19→205 ng/L, 2→47 ng/L, and 61→106 ng/L, respectively), implying activated sludge can degrade precursors into PFCAs in the influent (Figure S34a). At Plant R, an increase of PFPeA (31→78 ng/L) was also observed. However, none of the target PFASs showed significant change over the activated sludge treatment at Plant L (Figure S34b), probably due to the variations in influent compositions and microbial communities of the activated sludge. Unlike the other two plants that serve small populations, Plant P is a large-size WWTP that handles an average inflow of 226~330 MGD and serves ~1.5 million people (Table S4), which potentially leads to a more intricate input matrix of PFAS precursors.
Clarifier tanks were another hot spots where PFAS biotransformation might occur, presumably through anaerobic processes, as evident by the generation of PFHxA (P: 205→447 ng/L, L: 35→94 ng/L) and PFPeA (L: 42→79 ng/L) (Figure S34) (Bertanza et al. 2013). On the other hand, the decrease of PFBA (4.9 ng/L → not detectable), PFPeA (72→26 ng/L), and PFHxA (105→22 ng/L) at Plant R might be resulted from either the adsorption to the biosolids and/or biotransformation (Huang and Jaffé 2019). Nevertheless, the roles of biotic and abiotic processes in PFAS removal at clarifiers remain elusive and can be influenced by operation parameters, such as tank configuration, inflow composition, and sludge retention time (SRT).
As depicted in Figure 3, PFPeA, PFHxA, PFHpA, PFOA, and PFBS remained at concerning concentrations (40~200 ng/L) in the effluent samples at all three WWTPs, indicating the inefficiency of the current wastewater treatment process for PFAS removal. For instance, PFOA in the effluent sample of Plant P was as high as 90.0±6.6 ng/L, exceeding its EPA’s drinking water health advisory level (70 ng/L). Overall, effluents of WWTPs can be potential point sources pertinently discharging PFASs to the receiving waters (Coggan et al. 2019b, Eriksson et al. 2017, Gallen et al. 2018, Nguyen et al. 2019).
Recent investigation on target PFASs in WWTPs revealed that their fate and behaviors can be affected by manifold factors, including (i) the type and size of WWTPs, (ii) influent compositions (domestic, industrial, urban runoff, versus agricultural) (Chen et al. 2018), (iii) operating factors, such as mixed liquor suspended solids, temperature, hydraulic retention time, and sludge retention time (Kibambe et al. 2020). However, greater sampling size and frequency at a collection of various WWTPs are required to sort out the influence of individual factors on PFAS generation and removal over conventional wastewater treatment processes.
3.5. Possible PFAS Features Newly Detected in WWTP Matrices
Using suspect screening, we identified 16 possible PFAS features in WWTP matrices (Figure 4), following four stringent criteria: (1) they were not found in the solvents, LRBs, or FRBs; (2) they were positively detected in at least two replicates of each sample; (3) they were detected in more than two wastewater samples; and (4) their highest intensities exceeded 1‰ of that of M8-PFOS as the internal standard (equivalent to 10 ng/L). Formula and structures of these PFAS features were predicted based on molecular weights and their matches in the local database, though CID spectra were not available due to the complex media matrix in WWTP samples and/or low MS response. Further details about their putative structures and mass errors are present in Table S8.
Figure 4.
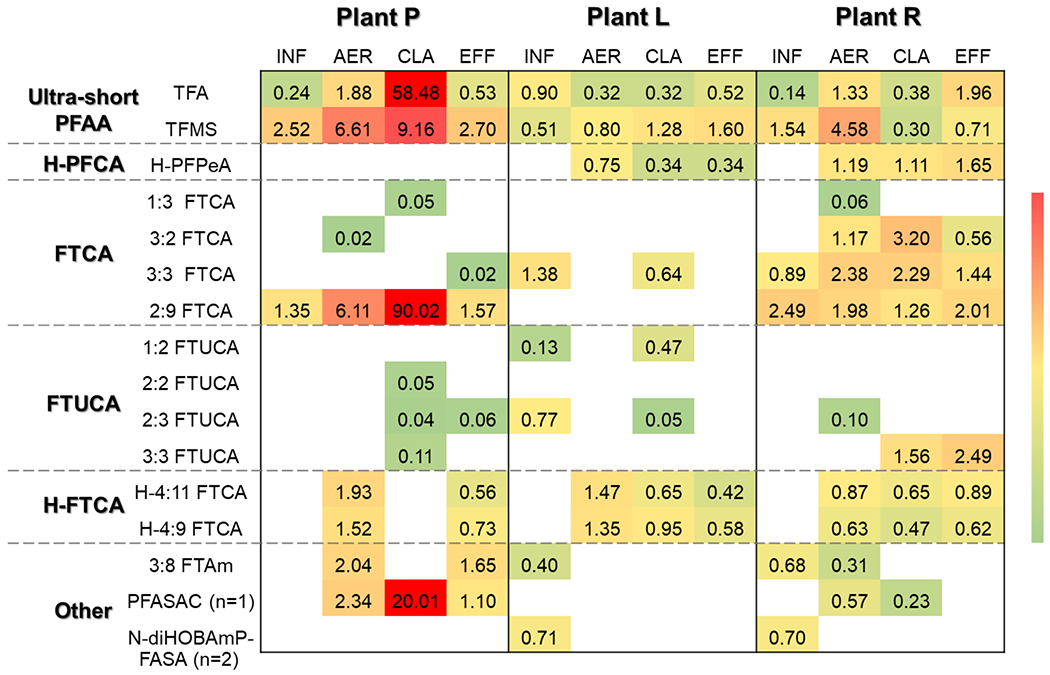
Occurrence and relative intensity of suspect PFAS features in wastewater samples collected from three WWTPs. M8-PFOA was used as the internal reference for the estimation of relative intensity.
Notably, two representative ultrashort-chain PFAAs, trifluoroacetate (TFA) and TFMS, were found in all WWTP samples, with 9.4- and 3.0-fold increments from the influent to the effluent at Plant R, as well as 7.9- and 2.6-fold increments at Plant P (Figure 4). As recommended by EPA Method 537.1 (USEPA 2018), the polystyrene divinylbenzene (SDVB) cartridge was used to extract most PFASs that are relatively hydrophobic, though not optimal for retaining these two ultrashort-chain PFAAs. To validate the detection of ultrashort-chain PFAAs, we conducted a recovery experiment for TFMS and found its extraction efficiency was low as 16.5% (Figure S35), according to which the estimated occurrence level of TFMS in WWTP samples was up to 86.2 ng/L. Though such low extraction efficiency for TFMS didn’t satisfy the requirement for quantitative analysis, our results remained valid to demonstrate the ubiquity and emergence of ultrashort-chain PFAAs along the wastewater treatment chain. In addition, ultrashort-chain PFAAs have been reported in groundwater (Barzen-Hanson and Field 2015), surface water (Ateia et al. 2019, Björnsdotter et al. 2019, Guardian et al. 2020), rain precipitation (Yeung et al. 2017), and even bottled water for drinking (Chow et al. 2021), representing an imminent threat to the water cycle.
Further, hydrido-perfluoropetanoic acid (H-PFPeA), 3:8 FTAm, PFASAC (n=1), and N-dihydroxybutyl (diHOB) dimethyl ammoniopropylperfluoroalkanesulfonamide (N-diHOBAmP-FASA, n=2) were detected in multiple samples. H-PFPeA, 6:2 FTAm, and PFASACs (n=3~8) were reported in AFFFs aforementioned in this work (Table 2) and elsewhere (Barzen-Hanson et al. 2017b, D’Agostino and Mabury 2013). The class of N-diHOBAmP-FASAs (n=4~6) was found in AFFFs-impacted groundwater (Barzen-Hanson et al. 2017b) and the class of H-PFCAs (n=4~10) was also recently reported in wastewater samples at WWTPs in China (Wang et al. 2020).
In addition, several highly defluorinated FTCAs (e.g., 3:3 FTCA and 2:9 FTCA) and associated features with unsaturation (e.g., 3:3 FTUCA) and hydrogen substitution (e.g., H-4:9 FTCA) tended to emerge in the aeration tanks or clarifiers and decline over the subsequent treatment(s) (Figure 4). FTCAs, FTUCAs, and H-FTCAs were reported as common biotransformation intermediates of PFAS precursors, such as fluorotelomer alcohols (FTOHs) (Kim et al. 2014, Kim et al. 2012) and FTSs (D’Agostino and Mabury 2017, Shaw et al. 2019). Observation of these PFAS features corroborated their essential roles in the biotransformation of unknown long-chain precursors in the wastewater. Some of these PFAS features can also be precursors for short and ultrashort-chain PFAAs. However, no significant correlation was observed between the signal intensity of these PFAS features (Figure 4) and the PFAA concentrations (Figure 3) in this study.
4. CONCLUSIONS
This study developed and validated a rapid and sensitive analytical method for screening and (semi-)quantifying both target and suspect PFASs by Nano-ESI-HRMS. Uniquely, Nano-ESI-HRMS enables a timesaving PFAS analysis (<2 min per sample) without scarifying detection sensitivity and accuracy. This rapid PFAS analysis is highly desirable for environmental investigations with a large sample size. Nano-ESI-HRMS exhibits a comprehensive detection of diverse PFAS features with the inclusion of ultrashort-chain and other highly polar molecules that are often overlooked when LC is employed. Results generated from Nano-ESI-HRMS are reliable and reproducible without the need for extensive optimization for individual analytes. With the assistance of the high-resolution detection and efficient screening algorithm, Nano-ESI-HRMS results can support the identification of novel PFAS structures and their transformation metabolites produced naturally or over physiochemical and biological treatments.
Here, we also reported ultrashort-chain PFAAs (e.g., TFMS, PFPrS, and TFA) in AFFF formulations and WWTP samples for the first time. This discovery demonstrated the potential of AFFF-impacted sites and municipal WWTPs as point sources of ultrashort-chain PFAAs, pertinently discharging to the receiving water bodies. Given their extreme hydrophilicity and recalcitrance, these ultrashort-chain PFAAs can spread in the environment and transport through the water cycles, affecting regions that are even distant and rural. For instance, TFMS and other ultrashort-chain PFAAs in surface snow at remote Arctic locations (Björnsdotter et al. 2021). Considering its ubiquitous existence and environmental persistency (Ateia et al. 2019, Chow et al. 2021, Guardian et al. 2020, Yeung et al. 2017), the contamination of ultrashort-chain PFAAs has emerged as a global issue, urging immediate attention and action. Nano-ESI-HRMS offers an effective alternative to analyze ultrashort-chain PFAAs, though the extraction approach needs to be tailored for these weak anions using WAX and other cartridges (Björnsdotter et al. 2021).
To date, PFAS analysis has greatly been hindered by the limited and expensive commercial standards required for absolute quantification. To cope with this major obstacle, we designed a streamlined 2-level classification scheme to categorize anionic and zwitterionic PFAS features into five major groups and assign them with appropriate QMs and calibration references for semi-quantification when their standards are inaccessible. Albeit with non-negligible quantitative errors, concentration data derived from semi-quantification render a tangible profile of the complex PFAS contamination in the environment and assist environmental engineers and scientists to pinpoint the dominant and other concerned species that could be addressed with priority.
Our analysis primarily focused on anionic PFASs, given the availability of commercial standards and regulatory significance. With the increasing availability of isotopic labeled PFASs, we recommend improving our experimental design and applying diverse surrogates to track the extraction efficiencies of PFASs of different properties in the future. With appropriate cationic references and internal standards, Nano-ESI-HRMS is compatible with cationic PFAS analysis under the ESI+ mode without significantly modifying this reported method. Non-dissociable neutral PFASs (e.g., fluorotelomer alcohols) are more suited for the analysis by GC/MS when they are sufficiently volatile. Without chromatographic separation, analysis by Nano-ESI-HRMS can be affected by in-source fragmentation and matrix effects. However, no collision energy was applied to generate the MS1 data, which minimizes the potential for in-source fragmentation. Though TFMS and ultrashort-chain PFAAs have been frequently detected in our samples, they are unlikely in-source fragments, due to their unique structures (e.g., shorter chain lengths than known PFAS precursors) and terminal moieties (e.g., sulfonate and carboxylic acid groups). Furthermore, it should be noted that sensitivity of PFAS analysis can be affected by complex matrixes due to ion competition, which can be alleviated by appropriate pretreatment procedures (e.g., SPE, liquid-liquid phase extraction) to reduce interfering matters. Analysis of PFAS isomers can be also challenging using Nano-ESI-HRMS, especially when they share similar fragmentation patterns. Therefore, results from Nano-ESI-HRMS can be synergized with other chromatography-integrated mass spectrometry approaches (e.g., LC/MS/MS and GC/MS) to gain a comprehensive view of PFASs when necessary for site characterization and remediation.
Supplementary Material
ACKNOWLEDGEMENTS
This work was funded by National Science Foundation (NSF, CBET-1903597), Environmental Protection Agency (EPA), New Jersey Department of Environmental Protection (NJDEP, SR21-019), US Geological Survey Water Resources Research Act Program (2019NJ183B), New Jersey Water Resources Research Institute (NJWRRI) - Private Well Supplement, and New Jersey Department of Health (NJDOH) - Fostering the Growth of Private Well Researchers at New Jersey’s Universities. Chen Wu was sponsored by the Mark B. Bain Graduate Fellowship from the Hudson River Foundation. Qi Wang and Hao Chen thank the National Institutes of Health (1R15GM137311-01) for financial support. We thank James Hatton, Bill DiGuiseppi, and Dusty Rose Berggren (Jacobs) for providing AFFF formulations collected at three AFBs. Funders had no role in study design, data collection, and interpretation, or the decision to submit the work for publication.
Footnotes
Supporting Information
The Supporting Information is available.
We declare no competing financial interest.
REFERENCES
- Allred BM, Lang JR, Barlaz MA and Field JA (2014) Orthogonal zirconium diol/C18 liquid chromatography-tandem mass spectrometry analysis of poly and perfluoroalkyl substances in landfill leachate. J Chromatogr A 1359, 202–211. [DOI] [PubMed] [Google Scholar]
- Ateia M, Maroli A, Tharayil N and Karanfil T (2019) The overlooked short- and ultrashort-chain poly- and perfluorinated substances: A review. Chemosphere 220, 866–882. [DOI] [PubMed] [Google Scholar]
- Backe WJ, Day TC and Field JA (2013) Zwitterionic, Cationic, and Anionic Fluorinated Chemicals in Aqueous Film Forming Foam Formulations and Groundwater from U.S. Military Bases by Nonaqueous Large-Volume Injection HPLC-MS/MS. Environmental Science & Technology 47(10), 5226–5234. [DOI] [PubMed] [Google Scholar]
- Barzen-Hanson KA, Davis SE, Kleber M and Field JA (2017a) Sorption of Fluorotelomer Sulfonates, Fluorotelomer Sulfonamido Betaines, and a Fluorotelomer Sulfonamido Amine in National Foam Aqueous Film-Forming Foam to Soil. Environmental Science & Technology 51(21), 12394–12404. [DOI] [PubMed] [Google Scholar]
- Barzen-Hanson KA and Field JA (2015) Discovery and implications of C2 and C3 perfluoroalkyl sulfonates in aqueous film-forming foams and groundwater. Environmental Science & Technology Letters 2(4), 95–99. [Google Scholar]
- Barzen-Hanson KA, Roberts SC, Choyke S, Oetjen K, McAlees A, Riddell N, McCrindle R, Ferguson PL, Higgins CP and Field JA (2017b) Discovery of 40 classes of per-and polyfluoroalkyl substances in historical aqueous film-forming foams (AFFFs) and AFFF-impacted groundwater. Environmental Science & Technology 51(4), 2047–2057. [DOI] [PubMed] [Google Scholar]
- Bertanza G, Pedrazzani R, Manili L and Menoni L (2013) Bio-P release in the final clarifiers of a large WWTP with co-precipitation: Key factors and troubleshooting. Chemical Engineering Journal 230, 195–201. [Google Scholar]
- Björnsdotter MK, Hartz WF, Kallenborn R, Ericson Jogsten I, Humby JD, Kärrman A and Yeung LWY (2021) Levels and Seasonal Trends of C1–C4 Perfluoroalkyl Acids and the Discovery of Trifluoromethane Sulfonic Acid in Surface Snow in the Arctic. Environmental Science & Technology. [DOI] [PMC free article] [PubMed] [Google Scholar]
- Björnsdotter MK, Yeung LWY, Kärrman A and Ericson Jogsten I (2020) Challenges in the analytical determination of ultra-short-chain perfluoroalkyl acids and implications for environmental and human health. Analytical and bioanalytical chemistry 412(20), 4785–4796. [DOI] [PMC free article] [PubMed] [Google Scholar]
- Björnsdotter MK, Yeung LWY, Kärrman A and Jogsten IE (2019) Ultra-Short-Chain Perfluoroalkyl Acids Including Trifluoromethane Sulfonic Acid in Water Connected to Known and Suspected Point Sources in Sweden. Environmental Science & Technology 53(19), 11093–11101. [DOI] [PubMed] [Google Scholar]
- Boiteux V, Bach C, Sagres V, Hemard J, Colin A, Rosin C, Munoz J-F and Dauchy X (2016) Analysis of 29 per- and polyfluorinated compounds in water, sediment, soil and sludge by liquid chromatography–tandem mass spectrometry. International Journal of Environmental Analytical Chemistry 96(8), 705–728. [Google Scholar]
- Buck RC, Franklin J, Berger U, Conder JM, Cousins IT, De Voogt P, Jensen AA, Kannan K, Mabury SA and van Leeuwen SP (2011) Perfluoroalkyl and polyfluoroalkyl substances in the environment: terminology, classification, and origins. Integrated environmental assessment and management 7(4), 513–541. [DOI] [PMC free article] [PubMed] [Google Scholar]
- Chen H, Munoz G, Duy SV, Zhang L, Yao Y, Zhao Z, Yi L, Liu M, Sun H, Liu J and Sauvé S (2020) Occurrence and Distribution of Per- and Polyfluoroalkyl Substances in Tianjin, China: The Contribution of Emerging and Unknown Analogues. Environmental Science & Technology 54(22), 14254–14264. [DOI] [PubMed] [Google Scholar]
- Chen S, Zhou Y, Meng J and Wang T (2018) Seasonal and annual variations in removal efficiency of perfluoroalkyl substances by different wastewater treatment processes. Environmental Pollution 242, 2059–2067. [DOI] [PubMed] [Google Scholar]
- Chiu FCK and Lo CMY (2000) Observation of amide anions in solution by electrospray ionization mass spectrometry. Journal of The American Society for Mass Spectrometry 11(12), 1061–1064. [DOI] [PubMed] [Google Scholar]
- Chow SJ, Ojeda N, Jacangelo JG and Schwab KJ (2021) Detection of ultrashort-chain and other per- and polyfluoroalkyl substances (PFAS) in U.S. bottled water. Water research 201, 117292. [DOI] [PubMed] [Google Scholar]
- Coggan TL, Anumol T, Pyke J, Shimeta J and Clarke BO (2019a) A single analytical method for the determination of 53 legacy and emerging per- and polyfluoroalkyl substances (PFAS) in aqueous matrices. Analytical and bioanalytical chemistry 411(16), 3507–3520. [DOI] [PubMed] [Google Scholar]
- Coggan TL, Moodie D, Kolobaric A, Szabo D, Shimeta J, Crosbie ND, Lee E, Fernandes M and Clarke BO (2019b) An investigation into per- and polyfluoroalkyl substances (PFAS) in nineteen Australian wastewater treatment plants (WWTPs). Heliyon 5(8), e02316. [DOI] [PMC free article] [PubMed] [Google Scholar]
- Cooks RG (1995) Special feature: Historical. Collision-induced dissociation: Readings and commentary. Journal of Mass spectrometry 30(9), 1215–1221. [Google Scholar]
- D’Agostino LA and Mabury SA (2017) Aerobic biodegradation of 2 fluorotelomer sulfonamide-based aqueous film-forming foam components produces perfluoroalkyl carboxylates. Environ Toxicol Chem 36(8), 2012–2021. [DOI] [PubMed] [Google Scholar]
- D’Agostino LA and Mabury SA (2013) Identification of Novel Fluorinated Surfactants in Aqueous Film Forming Foams and Commercial Surfactant Concentrates. Environmental Science & Technology 48(1), 121–129. [DOI] [PubMed] [Google Scholar]
- Dauchy X, Boiteux V, Bach C, Rosin C and Munoz J-F (2017) Per- and polyfluoroalkyl substances in firefighting foam concentrates and water samples collected near sites impacted by the use of these foams. Chemosphere 183, 53–61. [DOI] [PubMed] [Google Scholar]
- De Silva AO, Spencer C, Scott BF, Backus S and Muir DCG (2011) Detection of a Cyclic Perfluorinated Acid, Perfluoroethylcyclohexane Sulfonate, in the Great Lakes of North America. Environmental Science & Technology 45(19), 8060–8066. [DOI] [PubMed] [Google Scholar]
- de Solla SR, De Silva AO and Letcher RJ (2012) Highly elevated levels of perfluorooctane sulfonate and other perfluorinated acids found in biota and surface water downstream of an international airport, Hamilton, Ontario, Canada. Environment International 39(1), 19–26. [DOI] [PubMed] [Google Scholar]
- Enaksha RW, Gurkeerat S, Bradley LA, Todd AG and Ajai KC (2006) A Review of Nanoelectrospray Ionization Applications for Drug Metabolism and Pharmacokinetics. Current Drug Metabolism 7(8), 913–928. [DOI] [PubMed] [Google Scholar]
- Eriksson U, Haglund P and Kärrman A (2017) Contribution of precursor compounds to the release of per- and polyfluoroalkyl substances (PFASs) from waste water treatment plants (WWTPs). Journal of Environmental Sciences 61, 80–90. [DOI] [PubMed] [Google Scholar]
- Favreau P, Poncioni-Rothlisberger C, Place BJ, Bouchex-Bellomie H, Weber A, Tremp J, Field JA and Kohler M (2017) Multianalyte profiling of per- and polyfluoroalkyl substances (PFASs) in liquid commercial products. Chemosphere 171, 491–501. [DOI] [PubMed] [Google Scholar]
- Field J, Sedlak D and Alvarez-Cohen L (2017) Characterization of the Fate and Biotransformation of Fluorochemicals in AFFF-Contaminated Groundwater at Fire/Crash Testing Military Sites, Oregon State University Corvallis United States. [Google Scholar]
- Fornal E (2014) Study of collision-induced dissociation of electrospray-generated protonated cathinones. Drug Testing and Analysis 6(7-8), 705–715. [DOI] [PubMed] [Google Scholar]
- Gaballah S, Swank A, Sobus JR, Howey XM, Schmid J, Catron T, McCord J, Hines E, Strynar M and Tal T (2020) Evaluation of Developmental Toxicity, Developmental Neurotoxicity, and Tissue Dose in Zebrafish Exposed to GenX and Other PFAS. Environmental health perspectives 128(4), 047005. [DOI] [PMC free article] [PubMed] [Google Scholar]
- Gago-Ferrero P, Schymanski EL, Bletsou AA, Aalizadeh R, Hollender J and Thomaidis NS (2015) Extended Suspect and Non-Target Strategies to Characterize Emerging Polar Organic Contaminants in Raw Wastewater with LC-HRMS/MS. Environmental Science & Technology 49(20), 12333–12341. [DOI] [PubMed] [Google Scholar]
- Gallen C, Eaglesham G, Drage D, Nguyen TH and Mueller JF (2018) A mass estimate of perfluoroalkyl substance (PFAS) release from Australian wastewater treatment plants. Chemosphere 208, 975–983. [DOI] [PubMed] [Google Scholar]
- Gremmel C, Fromel T and Knepper TP (2017) HPLC-MS/MS methods for the determination of 52 perfluoroalkyl and polyfluoroalkyl substances in aqueous samples. Anal Bioanal Chem 409(6), 1643–1655. [DOI] [PubMed] [Google Scholar]
- Guardian MGE, Boongaling EG, Bernardo-Boongaling VRR, Gamonchuang J, Boontongto T, Burakham R, Arnnok P and Aga DS (2020) Prevalence of per- and polyfluoroalkyl substances (PFASs) in drinking and source water from two Asian countries. Chemosphere 256, 127115. [DOI] [PubMed] [Google Scholar]
- Hamid H, Li LY and Grace JR (2018) Review of the fate and transformation of per- and polyfluoroalkyl substances (PFASs) in landfills. Environmental pollution (Barking, Essex : 1987) 235, 74–84. [DOI] [PubMed] [Google Scholar]
- Huang S and Jaffé PR (2019) Defluorination of Perfluorooctanoic Acid (PFOA) and Perfluorooctane Sulfonate (PFOS) by Acidimicrobium sp. Strain A6. Environmental Science & Technology 53(19), 11410–11419. [DOI] [PubMed] [Google Scholar]
- Jacob P, Barzen-Hanson KA and Helbling DE (2021) Target and Nontarget Analysis of Per- and Polyfluoralkyl Substances in Wastewater from Electronics Fabrication Facilities. Environmental Science & Technology 55(4), 2346–2356. [DOI] [PubMed] [Google Scholar]
- Jho E.k.a.C. (2009) Recent Developments in 6:2 Fluorotelomer Surfactants and Foam Stabilizers.
- Johnson AR and Carlson EE (2015) Collision-Induced Dissociation Mass Spectrometry: A Powerful Tool for Natural Product Structure Elucidation. Analytical chemistry 87(21), 10668–10678. [DOI] [PubMed] [Google Scholar]
- Juraschek R, Dülcks T and Karas M (1999) Nanoelectrospray—more than just a minimized-flow electrospray ionization source. Journal of The American Society for Mass Spectrometry 10(4), 300–308. [DOI] [PubMed] [Google Scholar]
- Kang Q, Gao F, Zhang X, Wang L, Liu J, Fu M, Zhang S, Wan Y, Shen H and Hu J (2020) Nontargeted identification of per- and polyfluoroalkyl substances in human follicular fluid and their blood-follicle transfer. Environment International 139, 105686. [DOI] [PubMed] [Google Scholar]
- Karas M, Bahr U and Dülcks T (2000) Nano-electrospray ionization mass spectrometry: addressing analytical problems beyond routine. Fresenius’ Journal of Analytical Chemistry 366(6), 669–676. [DOI] [PubMed] [Google Scholar]
- Kazakova AN and Vasilyev AV (2017) Trifluoromethanesulfonic acid in organic synthesis. Russian Journal of Organic Chemistry 53(4), 485–509. [Google Scholar]
- Kibambe MG, Momba MNB, Daso AP and Coetzee MAA (2020) Evaluation of the efficiency of selected wastewater treatment processes in removing selected perfluoroalkyl substances (PFASs). Journal of Environmental Management 255, 109945. [DOI] [PubMed] [Google Scholar]
- Kim MH, Wang N and Chu KH (2014) 6:2 Fluorotelomer alcohol (6:2 FTOH) biodegradation by multiple microbial species under different physiological conditions. Appl Microbiol Biotechnol 98(4), 1831–1840. [DOI] [PubMed] [Google Scholar]
- Kim MH, Wang N, McDonald T and Chu KH (2012) Biodefluorination and biotransformation of fluorotelomer alcohols by two alkane-degrading Pseudomonas strains. Biotechnol Bioeng 109(12), 3041–3048. [DOI] [PubMed] [Google Scholar]
- Kucharzyk KH, Darlington R, Benotti M, Deeb R and Hawley E (2017) Novel treatment technologies for PFAS compounds: A critical review. J Environ Manage 204(Pt 2), 757–764. [DOI] [PubMed] [Google Scholar]
- Li Y, Yu N, Du L, Shi W, Yu H, Song M and Wei S (2020) Transplacental Transfer of Per- and Polyfluoroalkyl Substances Identified in Paired Maternal and Cord Sera Using Suspect and Nontarget Screening. Environmental Science & Technology 54(6), 3407–3416. [DOI] [PubMed] [Google Scholar]
- Lindstrom AB, Strynar MJ and Libelo EL (2011) Polyfluorinated Compounds: Past, Present, and Future. Environmental Science & Technology 45(19), 7954–7961. [DOI] [PubMed] [Google Scholar]
- Liu J and Mejia Avendano S (2013) Microbial degradation of polyfluoroalkyl chemicals in the environment: a review. Environ Int 61, 98–114. [DOI] [PubMed] [Google Scholar]
- Liu N, Wu C, Lyu G and Li M (2021) Efficient adsorptive removal of short-chain perfluoroalkyl acids using reed straw-derived biochar (RESCA). Science of The Total Environment 798, 149191. [DOI] [PubMed] [Google Scholar]
- Liu Y, D’Agostino LA, Qu G, Jiang G and Martin JW (2019) High-resolution mass spectrometry (HRMS) methods for nontarget discovery and characterization of poly-and per-fluoroalkyl substances (PFASs) in environmental and human samples. TrAC Trends in Analytical Chemistry. [Google Scholar]
- Liu Y, Pereira ADS and Martin JW (2015) Discovery of C5–C17 poly-and perfluoroalkyl substances in water by in-line SPE-HPLC-Orbitrap with in-source fragmentation flagging. Analytical chemistry 87(8), 4260–4268. [DOI] [PubMed] [Google Scholar]
- Luo Y-S, Aly NA, McCord J, Strynar MJ, Chiu WA, Dodds JN, Baker ES and Rusyn I (2020) Rapid Characterization of Emerging Per- and Polyfluoroalkyl Substances in Aqueous Film-Forming Foams Using Ion Mobility Spectrometry–Mass Spectrometry. Environmental Science & Technology 54(23), 15024–15034. [DOI] [PMC free article] [PubMed] [Google Scholar]
- Marchiandi J, Szabo D, Dagnino S, Green MP and Clarke BO (2021) Occurrence and fate of legacy and novel per- and polyfluoroalkyl substances (PFASs) in freshwater after an industrial fire of unknown chemical stockpiles. Environmental Pollution 278, 116839. [DOI] [PubMed] [Google Scholar]
- McDonough CA, Choyke S, Barton KE, Mass S, Starling AP, Adgate JL and Higgins CP (2021) Unsaturated PFOS and Other PFASs in Human Serum and Drinking Water from an AFFF-Impacted Community. Environmental Science & Technology 55(12), 8139–8148. [DOI] [PubMed] [Google Scholar]
- Mulabagal V, Liu L, Qi J, Wilson C and Hayworth JS (2018) A rapid UHPLC-MS/MS method for simultaneous quantitation of 23 perfluoroalkyl substances (PFAS) in estuarine water. Talanta 190, 95–102. [DOI] [PubMed] [Google Scholar]
- Nguyen HT, Kaserzon SL, Thai PK, Vijayasarathy S, Bräunig J, Crosbie ND, Bignert A and Mueller JF (2019) Temporal trends of per- and polyfluoroalkyl substances (PFAS) in the influent of two of the largest wastewater treatment plants in Australia. Emerging Contaminants 5, 211–218. [Google Scholar]
- Patlewicz G, Richard AM, Williams AJ, Grulke CM, Sams R, Lambert J, Noyes PD, DeVito MJ, Hines RN, Strynar M, Guiseppi-Elie A and Thomas RS (2019) A Chemical Category-Based Prioritization Approach for Selecting 75 Per- and Polyfluoroalkyl Substances (PFAS) for Tiered Toxicity and Toxicokinetic Testing. Environmental health perspectives 127(1), 014501. [DOI] [PMC free article] [PubMed] [Google Scholar]
- Pérez-Ortega P, Lara-Ortega FJ, García-Reyes JF, Gilbert-López B, Trojanowicz M and Molina-Díaz A (2016) A feasibility study of UHPLC-HRMS accurate-mass screening methods for multiclass testing of organic contaminants in food. Talanta 160, 704–712. [DOI] [PubMed] [Google Scholar]
- Place BJ and Field JA (2012) Identification of novel fluorochemicals in aqueous film-forming foams used by the US military. Environmental Science & Technology 46(13), 7120–7127. [DOI] [PMC free article] [PubMed] [Google Scholar]
- Ruyle BJ, Pickard HM, LeBlanc DR, Tokranov AK, Thackray CP, Hu XC, Vecitis CD and Sunderland EM (2021) Isolating the AFFF Signature in Coastal Watersheds Using Oxidizable PFAS Precursors and Unexplained Organofluorine. Environmental Science & Technology 55(6), 3686–3695. [DOI] [PMC free article] [PubMed] [Google Scholar]
- Schaider LA, Balan SA, Blum A, Andrews DQ, Strynar MJ, Dickinson ME, Lunderberg DM, Lang JR and Peaslee GF (2017) Fluorinated Compounds in U.S. Fast Food Packaging. Environmental Science & Technology Letters 4(3), 105–111. [DOI] [PMC free article] [PubMed] [Google Scholar]
- Schulze S, Zahn D, Montes R, Rodil R, Quintana JB, Knepper TP, Reemtsma T and Berger U (2019) Occurrence of emerging persistent and mobile organic contaminants in European water samples. Water research 153, 80–90. [DOI] [PubMed] [Google Scholar]
- Schymanski EL, Jeon J, Gulde R, Fenner K, Ruff M, Singer HP and Hollender J (2014) Identifying Small Molecules via High Resolution Mass Spectrometry: Communicating Confidence. Environmental Science & Technology 48(4), 2097–2098. [DOI] [PubMed] [Google Scholar]
- Semerád J, Hatasová N, Grasserová A, Černá T, Filipová A, Hanč A, Innemanová P, Pivokonský M and Cajthaml T (2020) Screening for 32 per- and polyfluoroalkyl substances (PFAS) including GenX in sludges from 43 WWTPs located in the Czech Republic - Evaluation of potential accumulation in vegetables after application of biosolids. Chemosphere 261, 128018. [DOI] [PubMed] [Google Scholar]
- Shaw DMJ, Munoz G, Bottos EM, Duy SV, Sauve S, Liu J and Van Hamme JD (2019) Degradation and defluorination of 6:2 fluorotelomer sulfonamidoalkyl betaine and 6:2 fluorotelomer sulfonate by Gordonia sp. strain NB4-1Y under sulfur-limiting conditions. Sci Total Environ 647, 690–698. [DOI] [PubMed] [Google Scholar]
- Shi G, Cui Q, Pan Y, Sheng N, Guo Y and Dai J (2017) 6:2 fluorotelomer carboxylic acid (6:2 FTCA) exposure induces developmental toxicity and inhibits the formation of erythrocytes during zebrafish embryogenesis. Aquat Toxicol 190, 53–61. [DOI] [PubMed] [Google Scholar]
- Strynar M, Dagnino S, McMahen R, Liang S, Lindstrom A, Andersen E, McMillan L, Thurman M, Ferrer I and Ball C (2015) Identification of novel perfluoroalkyl ether carboxylic acids (PFECAs) and sulfonic acids (PFESAs) in natural waters using accurate mass time-of-flight mass spectrometry (TOFMS). Environmental Science & Technology 49(19), 11622–11630. [DOI] [PubMed] [Google Scholar]
- Trier X, Granby K and Christensen JH (2011) Polyfluorinated surfactants (PFS) in paper and board coatings for food packaging. Environmental Science and Pollution Research 18(7), 1108–1120. [DOI] [PubMed] [Google Scholar]
- USEPA (2016) PFOA & PFOS Drinking Water HealthAdvisories [Fact Sheet].
- USEPA (2018) Method 537.1: Determination of Selected Per- and Polyfluorinated Alkyl Substances in Drinking Water by Solid Phase Extraction and Liquid Chromatography/Tandem Mass Spectrometry (LC/MS/MS). U.S. Environmental Protection Agency, O.o.R.a.D., National Center for Environmental Assessment; (ed). [Google Scholar]
- USEPA (2019) Method 533: Determination of Per- and Polyfluoroalkyl Substances in Drinking Water by Isotope Dilution Anion Exchange Solid Phase Extraction and Liquid Chromatography/Tandem Mass Spectrometry. U.S. Environmental Protection Agency, O.o.R.a.D., National Center for Environmental Assessment; (ed). [Google Scholar]
- USEPA (2020) PFAS Master List of PFAS Substances.
- Wang X, Yu N, Qian Y, Shi W, Zhang X, Geng J, Yu H and Wei S (2020) Non-target and suspect screening of per- and polyfluoroalkyl substances in Chinese municipal wastewater treatment plants. Water research 183, 115989. [DOI] [PubMed] [Google Scholar]
- Wang Y, Vestergren R, Shi Y, Cao D, Xu L, Cai Y, Zhao X and Wu F (2016) Identification, Tissue Distribution, and Bioaccumulation Potential of Cyclic Perfluorinated Sulfonic Acids Isomers in an Airport Impacted Ecosystem. Environmental Science & Technology 50(20), 10923–10932. [DOI] [PubMed] [Google Scholar]
- Wang Y, Yu N, Zhu X, Guo H, Jiang J, Wang X, Shi W, Wu J, Yu H and Wei S (2018) Suspect and nontarget screening of per-and polyfluoroalkyl substances in wastewater from a fluorochemical manufacturing park. Environmental Science & Technology 52(19), 11007–11016. [DOI] [PubMed] [Google Scholar]
- Washington JW, Rosal CG, McCord JP, Strynar MJ, Lindstrom AB, Bergman EL, Goodrow SM, Tadesse HK, Pilant AN, Washington BJ, Davis MJ, Stuart BG and Jenkins TM (2020) Nontargeted mass-spectral detection of chloroperfluoropolyether carboxylates in New Jersey soils. Science 368(6495), 1103–1107. [DOI] [PMC free article] [PubMed] [Google Scholar]
- Wilm M and Mann M (1996) Analytical properties of the nano-electrospray ion source. Analytical chemistry 68(1), 1–8. [DOI] [PubMed] [Google Scholar]
- Wilm MS and Mann M (1994) Electrospray and Taylor-Cone theory, Dole’s beam of macromolecules at last? International Journal of Mass Spectrometry and Ion Processes 136(2), 167–180. [Google Scholar]
- Yeung LWY, Stadey C and Mabury SA (2017) Simultaneous analysis of perfluoroalkyl and polyfluoroalkyl substances including ultrashort-chain C2 and C3 compounds in rain and river water samples by ultra performance convergence chromatography. Journal of Chromatography A 1522, 78–85. [DOI] [PubMed] [Google Scholar]
- Zhang G, Pan Z, Wu Y, Shang R, Zhou X and Fan Y (2019) Distribution of Perfluorinated Compounds in Surface Water and Soil in Partial Areas of Shandong Province, China. Soil and Sediment Contamination: An International Journal 28(5), 502–512. [Google Scholar]
- Zhang W, Cao H and Liang Y (2021) Plant uptake and soil fractionation of five ether-PFAS in plant-soil systems. Science of The Total Environment 771, 144805. [DOI] [PubMed] [Google Scholar]
- Zhao Z, Cheng X, Hua X, Jiang B, Tian C, Tang J, Li Q, Sun H, Lin T, Liao Y and Zhang G (2020) Emerging and legacy per- and polyfluoroalkyl substances in water, sediment, and air of the Bohai Sea and its surrounding rivers. Environmental Pollution 263, 114391. [DOI] [PubMed] [Google Scholar]
- Zhou J, Shu R, Yu C, Xiong Z, Xiao Q, Li Z, Xie X and Fu Z (2020) Exposure to low concentration of trifluoromethanesulfonic acid induces the disorders of liver lipid metabolism and gut microbiota in mice. Chemosphere 258, 127255. [DOI] [PubMed] [Google Scholar]
Associated Data
This section collects any data citations, data availability statements, or supplementary materials included in this article.