Abstract
Task-free functional connectivity in animal models provides an experimental framework to examine connectivity phenomena under controlled conditions and allows for comparisons with data modalities collected under invasive or terminal procedures. Currently, animal acquisitions are performed with varying protocols and analyses that hamper result comparison and integration. Here we introduce StandardRat, a consensus rat functional magnetic resonance imaging acquisition protocol tested across 20 centers. To develop this protocol with optimized acquisition and processing parameters, we initially aggregated 65 functional imaging datasets acquired from rats across 46 centers. We developed a reproducible pipeline for analyzing rat data acquired with diverse protocols and determined experimental and processing parameters associated with the robust detection of functional connectivity across centers. We show that the standardized protocol enhances biologically plausible functional connectivity patterns relative to previous acquisitions. The protocol and processing pipeline described here is openly shared with the neuroimaging community to promote interoperability and cooperation toward tackling the most important challenges in neuroscience.
Understanding the brain requires a multi-level approach across spatial and temporal scales. Distinct brain network features, as revealed by task-free functional magnetic resonance imaging (fMRI), play a central role in the comprehension of healthy brain function and disorder mechanisms. This hemodynamic readout method relies on spontaneous fluctuations in the blood oxygenation level-dependent contrast signal to infer functional connectivity (FC) across the brain. Human neuroimaging has made great strides in understanding of the brain through open data-sharing initiatives focused on task-free fMRI data1–5. Nonetheless, animal models, particularly small rodents, continue to play an important role in neuroscience discovery, partly owing to the feasibility of performing invasive and terminal manipulations on genetically controlled animals6. For example, rats are commonly used in pharmacological studies, owing to similarities in drug metabolism, as well as in behavioral neuroscience, owing to their high proficiency in learning complex tasks. By leveraging the same neuroimaging methods and metrics obtained in humans, task-free neuroimaging in rodents may provide a translational bridge from the invasive methods possible only in animal models.
Human neuroimaging sharing initiatives have led to a standardization of fMRI acquisition protocols that aid in the dissemination, aggregation and reuse of data4,7,8. In contrast, preclinical neuroimaging essentially remains without harmonizing guidelines9. Animal data acquisitions are performed under diverse protocols that span different strains, restraint and anesthesia conditions, radiofrequency coil designs and magnetic field strengths. These impact the generalization of the results and conclusions. Efforts to propose acquisition and/or pre-processing protocols rarely extend beyond the confines of single laboratories, thus limiting interoperability and widespread adoption9,10. Because of the potential of fMRI in rodents to study the biological basis for connectivity phenomena across the whole brain longitudinally11, an optimized consensus protocol could potentiate future scientific discoveries.
In this pre-registered study, we set out to aggregate and make publicly available representative datasets with various fMRI acquisition protocols in the rat and identify experimental parameters associated with robust and reliable FC detection. We curated the MultiRat_rest collection (646 rats from 65 datasets) representing protocols used at 46 institutions. Based on the analysis of the MultiRat_rest collection, we devised a new consensus protocol and used it to aggregate the StandardRat collection (209 rats from 21 datasets). Pre-processing and confound correction were tailored to rodent data of different characteristics using a rodent-adapted fMRI pre-processing and analysis tool. Our primary outcome was the detection of plausible FC patterns corresponding to the biologically expected models. Collating data from 50 centers and 855 rats, we show that standardized acquisition and the associated pre-processing pipeline optimize the detection of distributed fMRI networks in rats. In line with large-scale studies from other species12,13, we have freely released all data and the generated code.
Results
We aggregated the MultiRat_rest collection of unstandardized fMRI datasets representative of local site acquisition procedures (n = 65 datasets and n = 646 rats). As expected, we found high heterogeneity in all experimental factors recorded, including rat characteristics (sex and strain, Fig. 1a,b, and age and weight, Extended Data Fig. 1), in-scan physiology (anesthesia/awake and breathing rates; Fig. 1c,e) and image acquisitions (magnetic field strength, sequence and sequence parameters; Fig. 1d,f,g). Notably, there was a large sex bias in favor of males (Fig. 1a). Similarly, the distribution of anesthesia protocols was also in line with current trends in the field (Fig. 1c)9. Despite the heterogeneous distribution of the acquisition parameters and ensuing image quality (Fig. 1g,h,i), 638 of 646 of the scans passed pre-processing quality control (one scan with excessive motion, one empty scan and six scans with failed image registrations; Fig. 1j,k and Extended Data Fig. 2). As further quality controls, we described temporal signal-to-noise (Extended Data Fig. 3) and motion parameters (Extended Data Fig. 4). Overall, we found that the aggregated datasets represent current rodent fMRI acquisition trends9. Moreover, given the low exclusion rate due to mis-registration, we concluded that the RABIES toolbox can be effectively employed to pre-process rat datasets despite widely varying acquisition parameters14. This paves the way for reproducible and interoperable data processing across sites.
Fig. 1 |. MultiRat_rest dataset description.
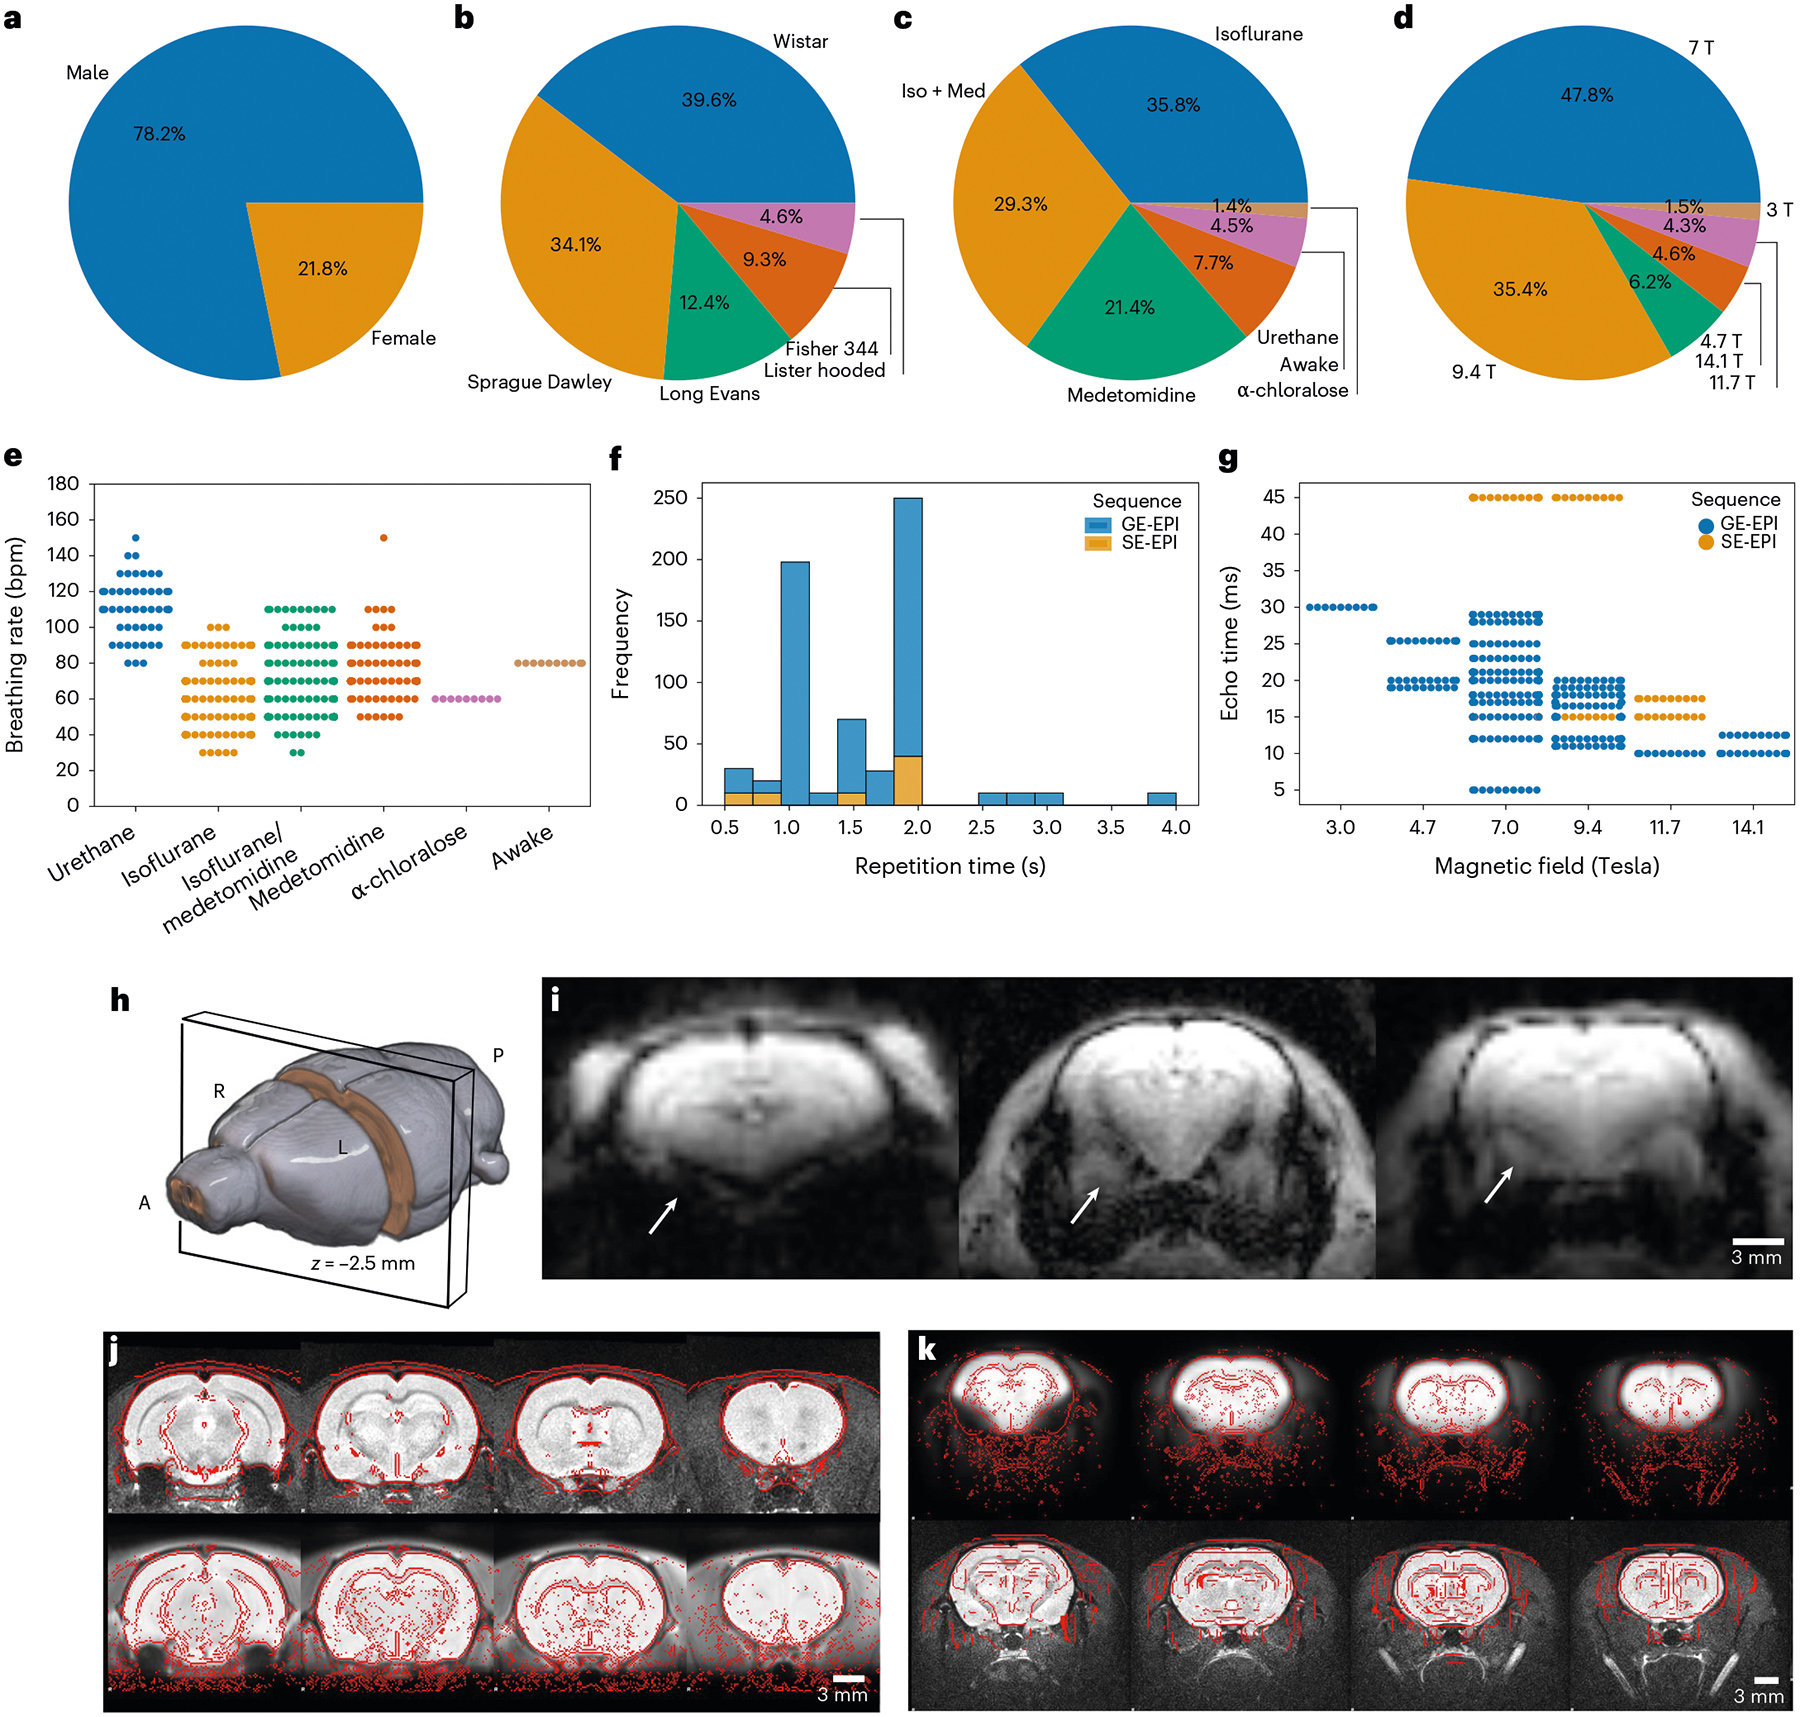
a, Sex. b, Strain. c, Anesthesia. d, Magnetic field strength. e, Breathing rate as a function of anesthesia. f, Repetition time. g, Echo time as a function of magnetic field strength. h, Slice position for the examples. i, Example of representative raw functional images. Arrows indicate different susceptibility artifact-related geometric distortions in the amygdala. j, Successful anatomical (top) to standard (bottom) space registration. Red lines indicate the outlines of the standard image (top) and the anatomical (bottom). k, Successful functional (top) to anatomical (bottom) registration. Red lines indicate the outlines of the anatomical image (top) and the functional (bottom).
We focused on examining FC in the sensory cortex, as sensory networks are robust to assess anesthesia effects in the anesthesia depth range typically used in fMRI15. More specifically, we evaluated the specificity of the connectivity of the S1 barrel field area (S1bf) using two complementary criteria as indexes of accurate FC identification (Fig. 2a,b)12. The first criterion was the strong connectivity between inter-hemispheric sensory cortices (barrel field, S1bf). Indeed, in both humans and animals, dating back to the original description of FC16, most networks, including sensory–motor networks, have a bilateral homotopic organization. The second criterion was a weak or anti-correlation between S1bf and the anterior cingulate area (ACA). The ACA is a major node in the task-negative rodent default mode network. Task-positive (as the S1bf-associated sensory network17,18) and task-negative networks are generally non-correlated or anti-correlated19.
Fig. 2 |. FC specificity.
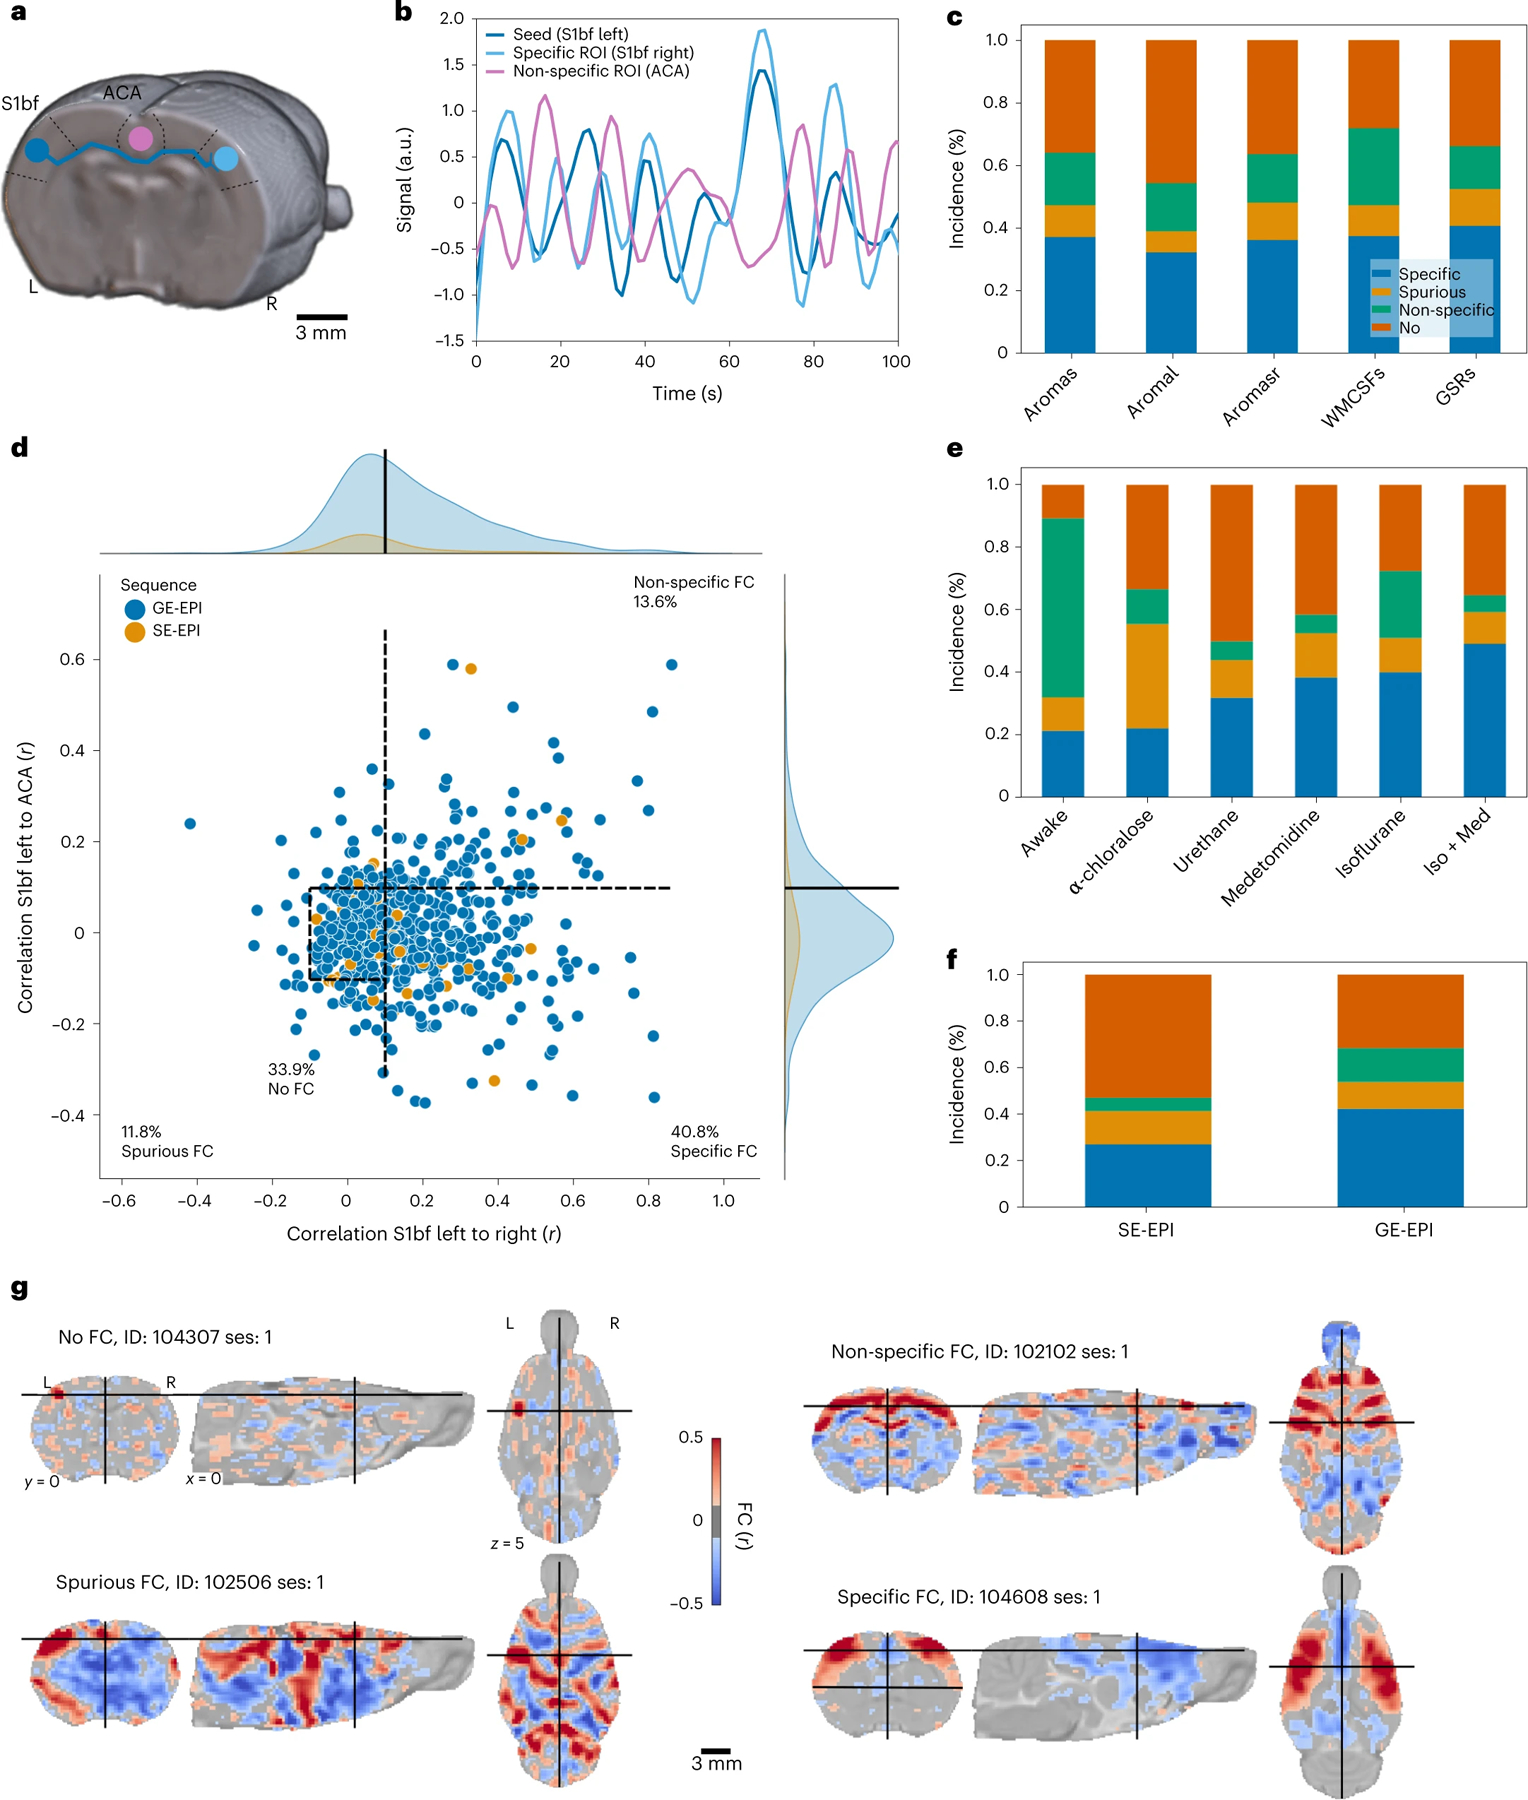
a, Diagram illustrating the logic behind FC specificity. The sensory (barrel field, S1bf) area (blue) chiefly projects to the contralateral homotopic area (light blue) but not to the ACA area (purple). b, Example of temporal dynamics in the resting-state signal. Correlated signal between the ipsilateral and contralateral S1bf and anti-correlated signal from the ACA. c, Distribution of FC categories as a function of confound correction models. d, FC in left S1bf relative to specific (right S1bf) and non-specific (ACA) regions of interest using the global regression correction model. Dots represent scans (n = 638 rats); dotted lines indicate the thresholds used to delineate the categories. e, Distribution of connectivity categories as a function of anesthesia. Example of individual seed-based analysis maps for each connectivity category. f, Distribution of connectivity categories as a function of imaging sequence (EPI, echo-planar imaging; GE, gradient echo; SE, spin echo). Group-level FC incidence map (n = 65 datasets). g, Example of individual seed-based analysis maps for each connectivity category. a.u., arbitrary units; ROI, region of interest, WMCSFs, white-matter + cerebrospinal fluid.
FC was evaluated for each animal and divided into four categories based on these two criteria referred above: specific, non-specific, spurious and no connectivity. Five confound correction models were tested (Supplementary Table 2 and Fig. 2c). The global signal regression (GSR) nuisance model was the one that performed the best for specific connectivity detection (40.8% of the animals with specific connectivity, 11.8% as non-specific, 13.6% as spurious and 33.9% as containing no detectable FC; Fig. 2c,d,g). To test the generalizability of the specificity metric to other networks, we implemented the same quality control metric to the cingulate cortex, a node of the rodent default mode network, which uncovered lower connectivity specificity (22.1%; Extended Data Fig. 5). Because network inference is often assessed at the group level rather than at the individual level, we performed a one-sample t-test per dataset to estimate the incidence of contralateral connectivity detected within groups, relative to the S1bf seed as well as three other seeds (Fig. 3). Up to 70% of the 65 datasets presented limited evidence of contralateral connectivity relative to the seeds, and 50% of the datasets captured the features of a larger sensory network at the group level. We conclude that rat datasets do not capture FC equally, similar to what we reported in the mouse12. We also found that GSR enhances the incidence of specific connectivity of S1bf seeds, so we decided to use this confound model for the remainder of our analysis.
Fig. 3 |. Incidence of FC at the group level (n = 65 datasets of n ~ 10 subjects per dataset) for four seeds.
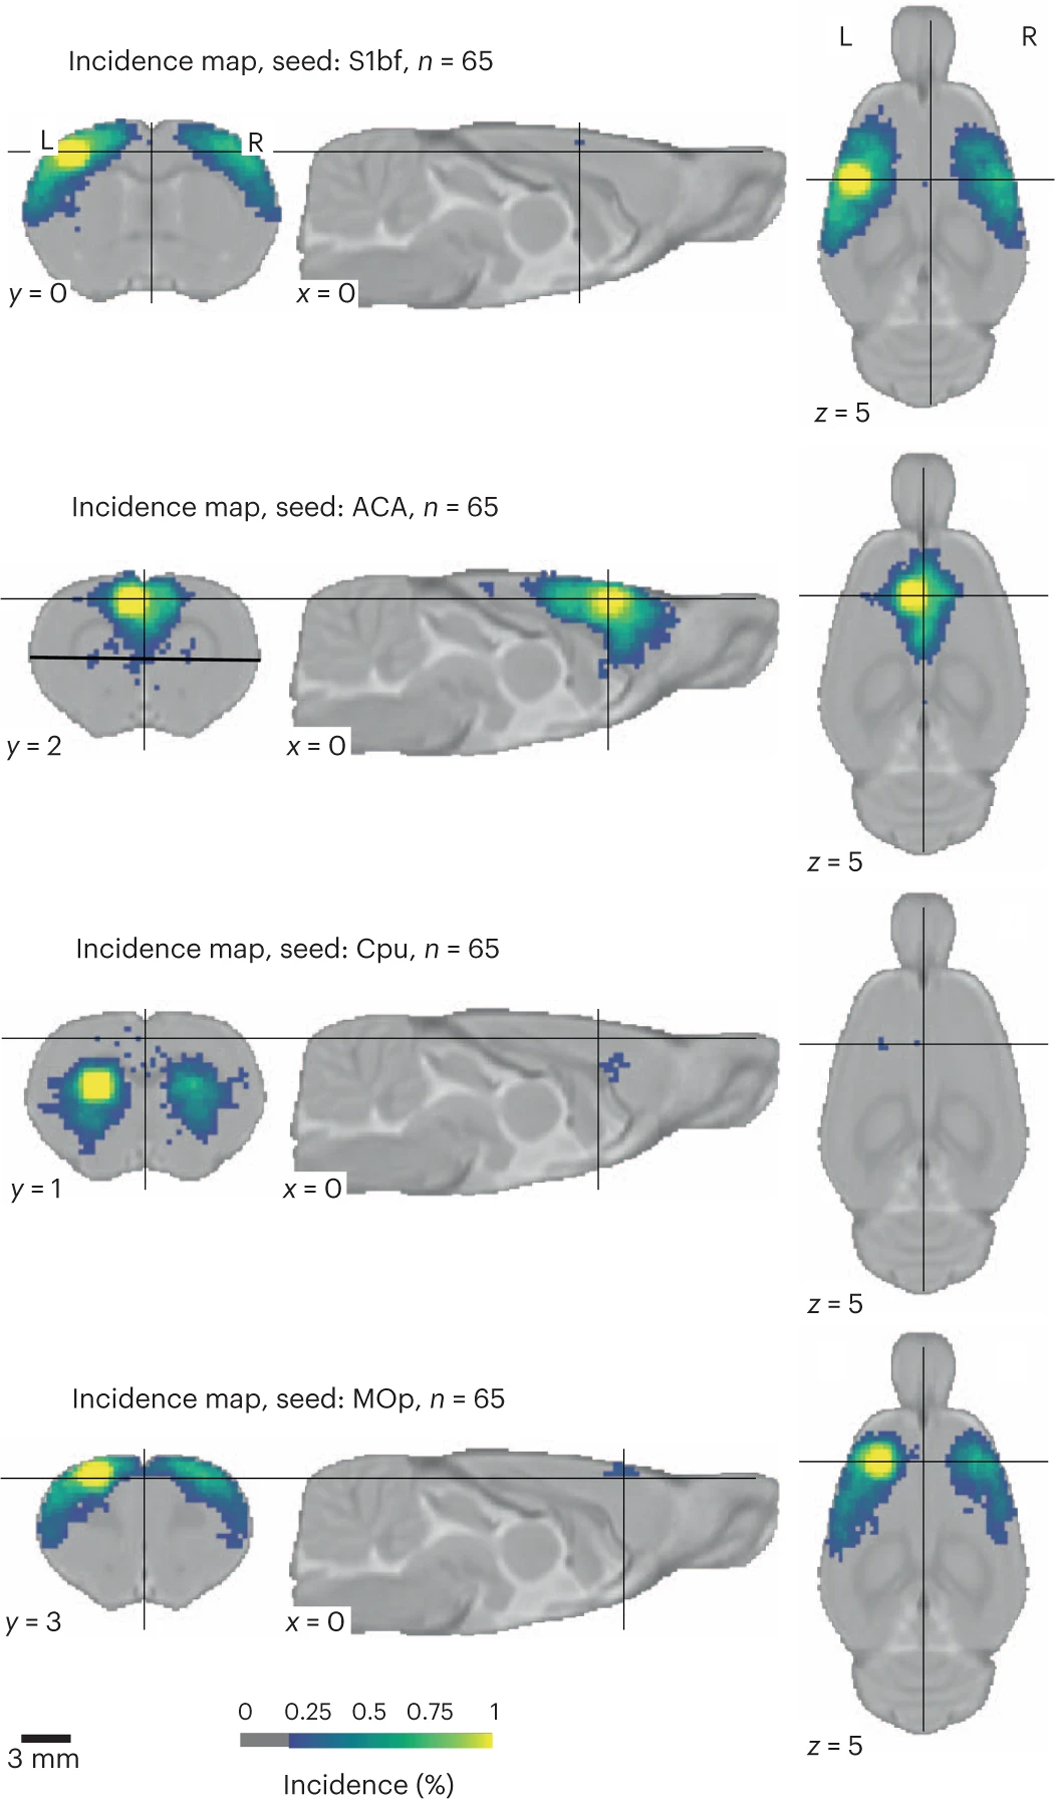
Cpu, caudate-putamen; MOp, primary motor area. MOp and CPu seeds were generally observed in 50–75% of the datasets.
Our observations underline the need for an improved acquisition protocol to maximize individual-level inferences to potentiate discovery in experimental network neuroscience. To address this, we evaluated parameters associated with increased specificity incidence in the MultiRat_rest collection. Because our analysis relied on categorical data, we tested for differences against the expected frequency distribution of the four connectivity categories as a function of anesthesia and sequence categories using the χ2 test. Medetomidine/isoflurane anesthesia combination condition was enriched in scans categorized as specific (Fig. 2e; 92/187 scans, X2 test connectivity category ~ anesthesia: φ = 0.27, degrees of freedom (dof) = 15, g = 92.38, P = 3.5 × = 10−13). The use of gradient echo imaging sequence was also associated with higher specificity incidence (Fig. 2f; 241/568 scans, X2 test connectivity category ~ sequence: φ = 0.11, dof = 3, g = 16.00, P = 0.001). Based on these observations, we devised an anesthesia protocol derived from dataset ds01031 (9/10 specific scans) and an imaging sequence based on ds01028 (8/10 specific scans), acquired on a 4.7T mid-field system. The sequence selection is justified as it allows for the detection of specific connectivity on one of the lower-field systems used in this collection and should also perform well for higher-field systems. We optimized relevant sequence parameters (echo time, flip angle and bandwidth) as a function of field strength (Supplementary Table 1). We hypothesized that this protocol would enhance functional specificity while being compatible with lower-field systems that continue to represent a relevant share of the systems used (Fig. 1d)9.
Using this consensus protocol, we curated the StandardRat collection of 21 datasets obtained across 20 centers. This consisted of n = 209 rats (93/116 female/male), mainly Wistar (189/209), aged ~2 months (Extended Data Fig. 6). Dataset acquisitions were performed at magnetic field strengths ranging from 4.7T to 17.2T. Pre-processing was performed similarly to the unstandardized dataset. In total, 207 of 209 scans passed quality assurance (two discards due to image mis-registration). Interestingly, despite the same anesthesia protocol being used, the respiratory rates reported at the start of fMRI acquisition differed as a function of rat strain (Fig. 4a,b; analysis of variance breathing rate ~ rat strain, η2 = 0.24, F195,2 = 31.17, P = 1.8 × 10⁻¹²). Finally, there was only a negligible effect on the temporal signal-to-noise ratio as a function of magnetic field strength (Fig. 4c; linear regression temporal signal-to-noise ratio ~ field strength, coefficient = 0.53 [−0.23, 1.30], r2 = 0.01, dof = 201, T = 1.37, P = 0.17).
Fig. 4 |. StandardRat dataset description.
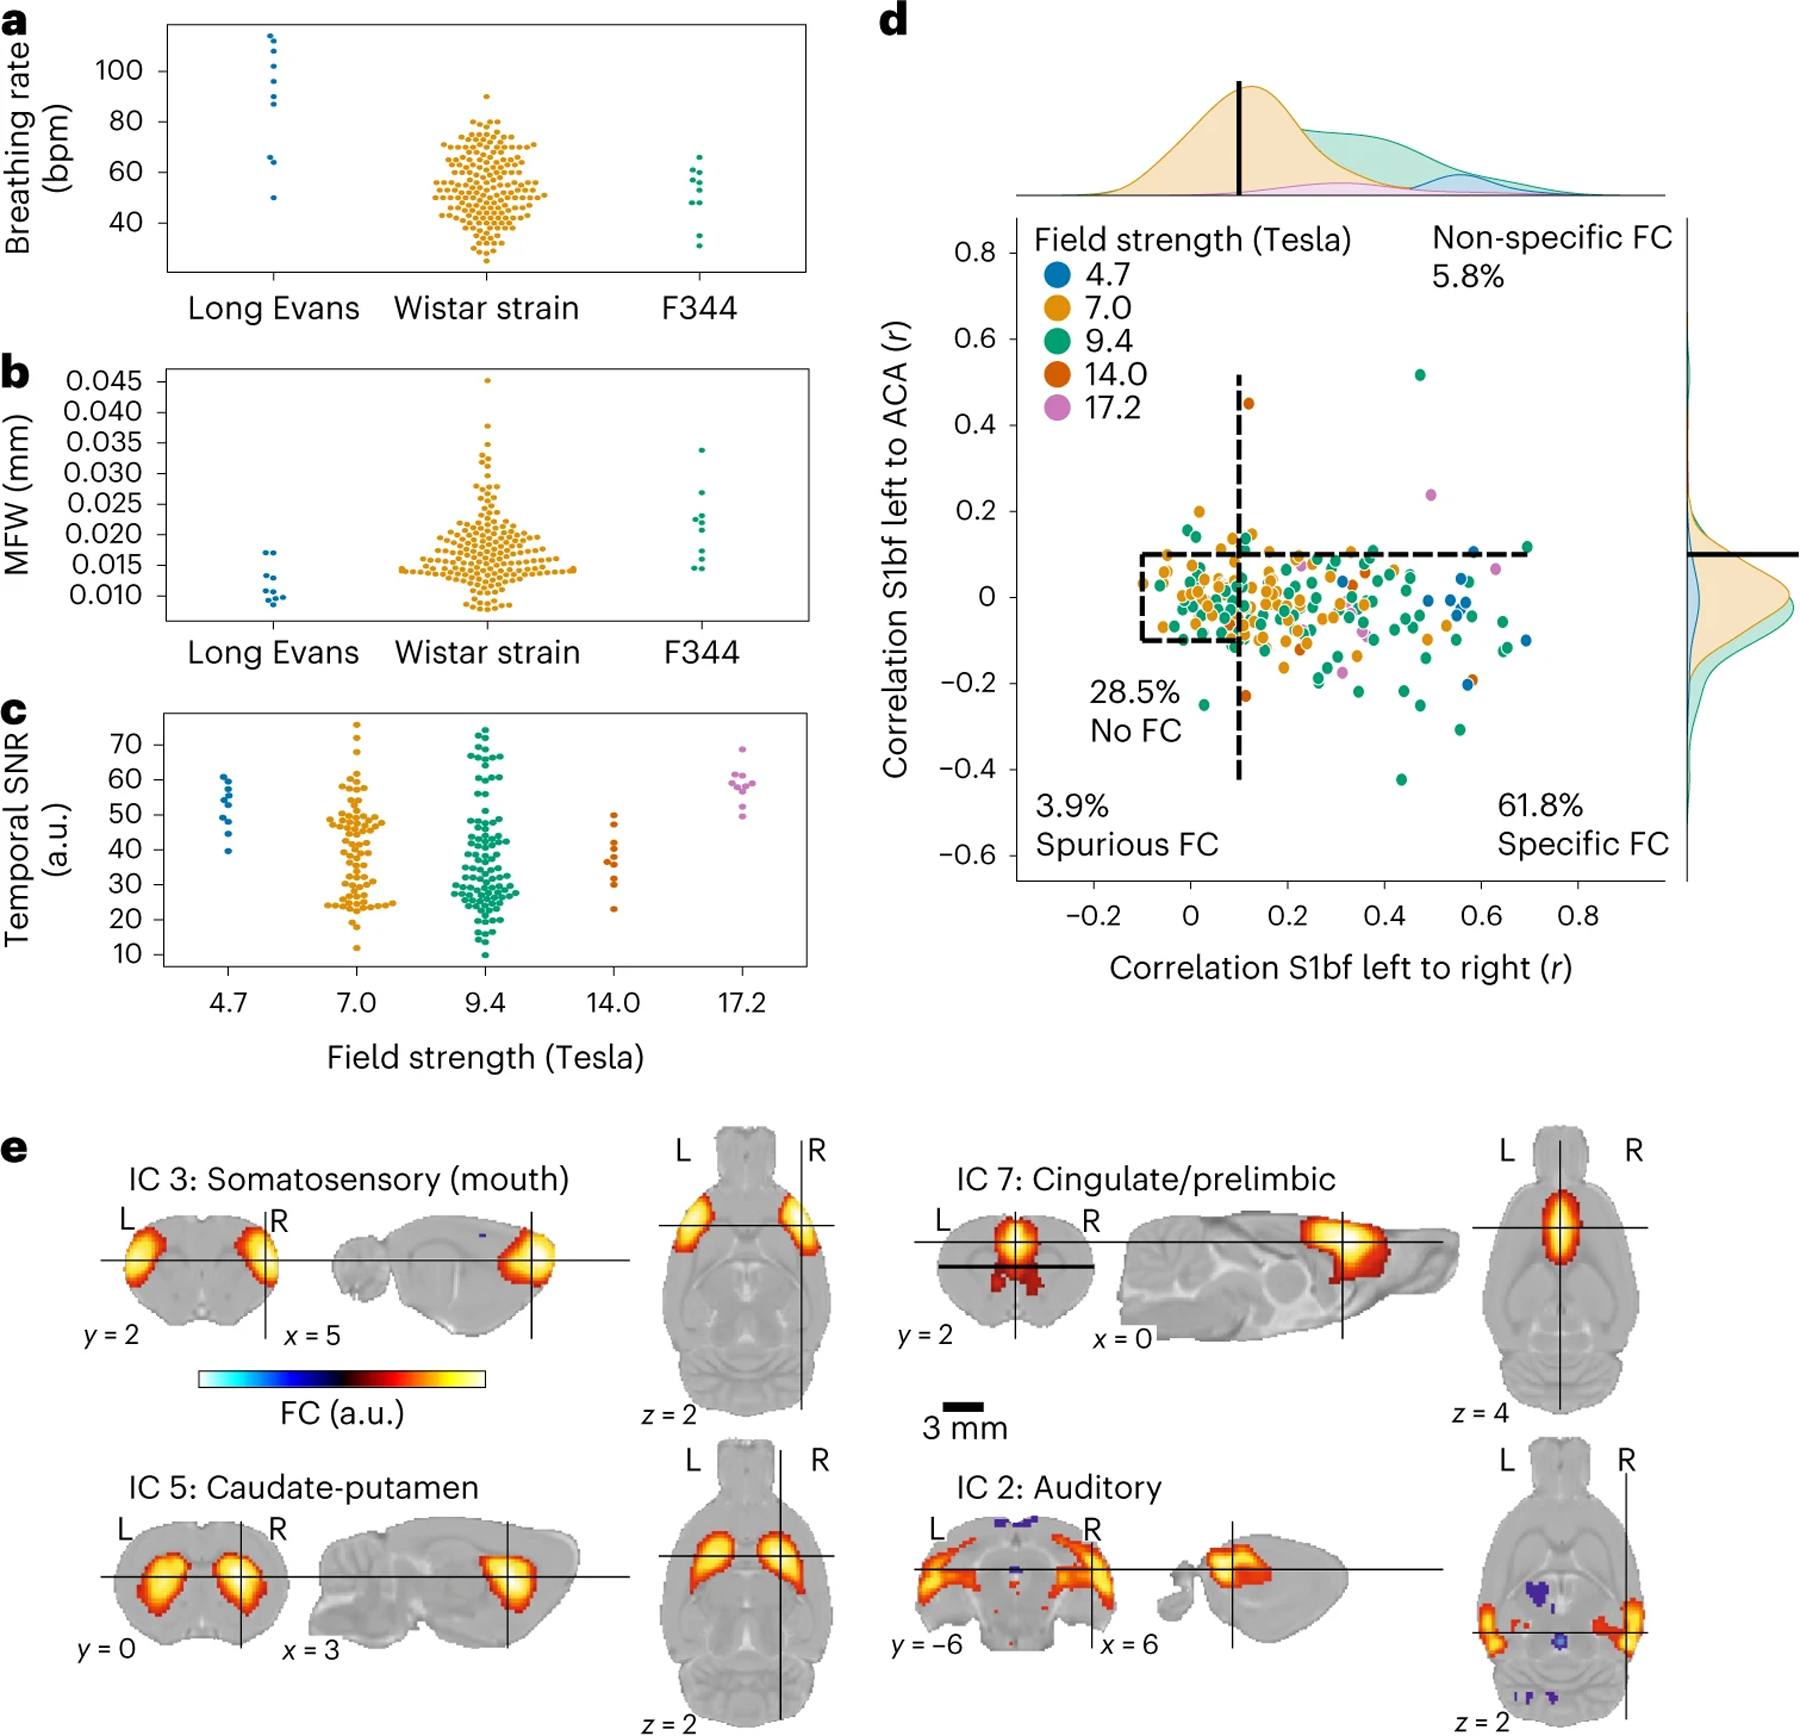
a, Breathing rate (bpm) as a function of strain. b, MFW as a function of strain. c, Temporal signal-to-noise ratio in the sensory cortex as a function of field strength. d, FC in left S1bf relative to specific (right S1bf) and non-specific (ACA) regions of interest using the global regression correction model. Dots represent scans (n = 207 rats); dotted lines indicate the thresholds used to delineate the categories. e, Representative independent components. a.u., arbitrary units.
The objective of the StandardRat study was to improve the detection of specific connectivity in the individual datasets. We found that 61.8% of the scans were categorized as exhibiting specific connectivity (Fig. 4d) against 40.8% in the MultiRat_rest dataset with unstandardized acquisitions (Extended Data Fig. 8a) when using GSR (χ2 test connectivity category ~ dataset collection: φ = 0.13, dof = 3, g = 33.01, P = 3.2 × 10⁻⁷). The difference remained when we compared datasets from centers that contributed to both collections exclusively (χ2 test connectivity category ~ dataset collection: φ = 0.17, dof = 3, g = 28.37, P = 3.0 × 10⁻⁶). This is going against the notion that the StandardRat collection outperforms due to characteristics of the contributing laboratories (for example, magnet type or strength and greater experience in data collection). Intriguingly, we could not establish a field strength effect on connectivity specificity (χ2 test connectivity category ~ field strength: φ = 0.19, dof = 12, g = 14.89, P = 0.25), suggesting that acquisition systems are not the limiting factor in this protocol. We conclude that the newly standardized protocol outperforms, on average, previously used protocols within the community for the detection of biologically plausible connectivity patterns. Finally, to explore whole-brain connectivity patterns, we examined connectivity incidence at the dataset level for four selected seeds (Extended Data Fig. 7) and group independent component analysis (Fig. 4e and Extended Data Fig. 10). We found improvement in distal connectivity detection at the dataset level compared to the MultiRat_rest dataset as well as evidence for previously described rodent networks spanning across the whole brain20.
Intriguingly, there remained differences in the connectivity patterns between datasets from the StandardRat collection. Indeed, five of 21 datasets achieved 90% specificity or higher. This underlines the potential of our protocol but also the need to understand what factors hamper other datasets. We next sought to identify the variables associated with greater incidences of specific connectivity patterns. Notably, we could not establish strain, sex or magnetic field strength effects, suggesting that the protocol is applicable for a large range of conditions (Supplementary Table 3). Next, we examined breathing rate and temporal signal-to-noise ratio as indicators of acquisition variability (Extended Data Fig. 9). Overall, scans with breathing rates ranging from 84 to 114 breaths per minute (bpm) and cortical temporal signal-to-noise ratio >53 achieved higher incidences of connectivity specificity among the StandardRat collection. These provide the first line of evidence to refine the StandardRat protocol by identifying practices that can further enhance connectivity outcomes. The importance of these observations will require confirmations in new datasets, preferably across multiple centers, before the StandardRat protocol can be updated with new guidelines.
Discussion
In summary, we curated two dataset collections (MultiRat_rest and StandardRat), analyzed them and made them an open-access resource. To our knowledge, these are the largest rodent fMRI datasets currently available. We developed and deployed a pre-processing and confound correction strategy generalizable to most scans and every dataset. Using information from the MultiRat_rest collection, we provide useful population parameter estimates to enhance the comparison of rat fMRI datasets. We proposed and evaluated a new standardized protocol and found that this consensus acquisition and pre-processing pipeline outperformed the previous acquisitions for connectivity specificity. To allow replication and to inspire new analyses, we release all raw and processed data to the broader community.
On average, the standardized protocol yielded improvements over previous acquisitions gathered in the MultiRat_rest collection. However, individual-level inferences remain limited to 61.8% of the scans acquired. For comparison, we estimated 55% specificity in the 7T Human Connectome Project dataset (based on 184 scans) using the same quality assurance metrics5. This underlines the importance of implementing sound quality assurance metrics based on assumptions of biologically plausible FC. Improving output quality, through understanding the factors leading to successful acquisitions, enhanced protocols, pre-processing or nuisance regression models, would lead to tangible outcomes capable of further potentiating future data acquisitions and reducing animal use by reducing discards.
Notably, our new protocol relies on light sedation to restrain the animals. Although optimized for fMRI, this protocol may not generalize to other procedures, such as electrophysiology. We also found that existing awake restraining protocols, on average, lead to a lower incidence of specific connectivity patterns (Extended Data Fig. 8b). A previous report indicated similar values in a dataset in awake rats21, which we confirmed with pre-processing using the RABIES pipeline (Extended Data Fig. 8b). Due to the impact of anesthesia on networks9,10, it remains central to develop awake imaging as an alternative. However, these protocols should be examined through the lens of quality control metrics to ensure that plausible connectivity patterns are achieved consistently. Furthermore, physiological factors, such as heart rate, were scarcely reported. This limited our ability to examine the possible contribution of these factors on connectivity outcomes. We take this opportunity to encourage the community to acquire these data and report them in ensuing publications. Finally, the acquisition sequence in StandardRat is designed to run on many systems. The effectiveness of new sequences should be examined against the current protocol—for example, isotropic resolution22 or multiband acquisition23.
Our project’s methodological and conceptual advancements are the first step toward large multi-site rat neuroimaging acquisitions. Coordinated open-science projects in neuroimaging and other disciplines are transforming the scientific landscape24. Through the concerted efforts of our centers and potentiated by a substantially improved protocol, rat functional brain imaging is set to tackle urgent questions in neuroscience and mental health research.
Online content
Any methods, additional references, Nature Portfolio reporting summaries, source data, extended data, supplementary information, acknowledgements, peer review information; details of author contributions and competing interests; and statements of data and code availability are available at https://doi.org/10.1038/s41593-023-01286-8.
Methods
Pre-registration
This study was pre-registered (https://doi.org/10.17605/OSF.IO/EMQ4B). The following are notable deviations. We used the SIGMA rat template25 instead of the Papp et al. template26, owing to fewer artifacts, additional relevant assets and improved in vivo contrast. Some datasets had field of view cropped to ease image registration. Some datasets had time series cropped to ease the computational load. We used temporal signal-to-noise instead of signal-to-noise ratio, as these were shown to be correlated12. Detailed deviations are listed here: https://github.com/grandjeanlab/MultiRat.
Animals
All acquisitions were performed after approval from the respective local and national ethical authorities. Participating laboratories were instructed to provide n = 10 rat imaging acquisitions consisting of one anatomical and one resting-state functional run. Exclusion criteria were unsuitability for RABIES pre-processing (for example, dedicated image reconstruction needs and restricted field of view). The MultiRat_rest collection consists of n = 65 datasets from 46 research centers and n = 646 rats (141/505 female/male). StandardRat consists of n = 21 datasets and n = 209 rats (93/116 female/male) from 20 research centers. For comparison, 224 scans (n = 39 rats) from a single-center awake rat dataset were included21. Exclusions were based on the following criteria: image misregistration (Extended Data Fig. 2), excessive motion and missing or corrupted data.
Standardized fMRI acquisition protocol
The standardized protocol was determined based on the outcomes of the analysis of MultiRat_rest and used to acquire the StandardRat dataset. Acquisitions were performed chiefly in ~2-month-old free-breathing Wistar rats, mixed sex, and anesthetized using 4% isoflurane and 0.05 mg kg−1 medetomidine subcutaneous (s.c.) bolus for induction and 0.4% isoflurane and 0.1 mg/kg/h medetomidine s.c. for maintenance. Imaging with a gradient-echo echo-planar imaging technique was conducted 40 minutes after anesthesia induction, with repetition time = 1,000 ms, echo time/flip angle/bandwidth defined as a function of field strength (Supplementary Table 1), repetitions = 1,000, matrix size [64 × 64], field of view 25.6 × 25.6 mm2 and 18 interleaved axial slices of 1 mm with 0.1-mm gap. The full protocol is available here: https://github.com/grandjeanlab/StandardRat.
Data pre-processing and confound correction
Scans were organized according to the BIDS format27. Pre-processing was performed on each scan session separately using a reproducible containerized software environment for RABIES 0.3.5 (Singularity 3.7.3–1.el7, Sylabs)14. The pre-processing was performed using autobox28, N4 inhomogeneity correction29, motion correction29, a rigid registration between functional and anatomical scans29, non-linear registration between anatomical scan and template and a common space resampling to 0.3 × 0.3 × 0.3 mm3. A volumetric image registration and brain masking workflow was developed to address discrepancies in brain size, image contrast and susceptibility distortions that are found in rodent images. Visual inspection was performed on pre-processing outputs for all scans for quality control. Five confound correction models were tested, using three approaches based on ICA-AROMA30, white matter and ventricle signal or GSR (Supplementary Table 2). These were done together with motion regression, spatial smoothing to 0.5 mm3, a high-pass filter of 0.01 Hz and a low-pass filter of either 0.1 Hz or 0.2 Hz. The ICA-AROMA method was adapted from humans to rats by using dedicated rat cerebrospinal fluid and brain edge masks and by training the classifier parameters based on a set of rodent images. A visual inspection of the components and their classifications indicated that less than 5% of the plausible signal components were erroneously labeled as noise.
Data analysis
To determine FC in individual rats, seed-based analysis was performed with RABIES in template space using spherical seeds of 0.9-mm diameter located on the S1bf and the ACA, caudate-putamen and primary motor area. Functional connectivity was calculated as the Pearson’s correlation coefficient between regional time courses. Functional connectivity specificity was defined relative to the left S1bf seed, using the contralateral right S1bf region of interest as the specific region of interest and the ACA as the non-specific region of interest12. FC was evaluated for each animal and divided into four categories: specific (rS1bf left to right > 0.1 AND rS1bf left to ACA < 0.1); non-specific (rS1bf left to right > 0.1 AND rS1bf left to ACA > 0.1); no (rS1bf left to right [−0.1, 0.1] AND rS1bf left to ACA [−0.1, 0.1]); and spurious connectivity (remaining cases). To assess connectivity specificity in the default mode network, the same approach was implemented with a seed in the ACA. The specific region of interest was located in the ACA (3.3 mm posterior to the seed), and the non-specific region of interest was located in the S1bf. To assess whole-brain connectivity, group independent component analysis was performed with n = 20 components using Nilearn (https://github.com/grandjeanlab/MultiRat/blob/master/assets/nifti/canica_resting_state_clean.nii.gz). Components’ biological plausibility was assessed using criteria defined in Zerbi et al.20. For comparison against humans, the same quality control metric was implemented on the 7T Human Connectome Project dataset5. The FIX-denoised scans (n = 184 participants) were bandpass corrected (0.01–0.1 Hz) and smoothed (2.5 mm2) using 3dTproject. Regions of interest were positioned in the sensory cortex and ACA.
Statistics and reproducibility
Sample size was determined on the basis of the available datasets forming this collection. No randomization was applied. Data collection and analysis were not performed blinded to the conditions of the experiments. One-sample t-test voxel-wise maps and group independent component analysis were estimated using Nilearn 0.7.1 (ref.31). Comparisons between FC specificity and categorical variables (for example, magnetic field strength, strain and sex) were determined using χ2 tests, as implemented in SciPy 1.6.2 (ref.32). Continuous variables (for example, mean framewise displacement (MFW)) were transformed into six categorical bins to allow comparison with χ2 tests. Linear regression and analysis of variance were performed using Pingouin 0.5 (ref.33). Individual seed-based maps are represented as color-coded overlays thresholded at r > 0.1. Given the emphasis on detection of FC and the factors that affect it, we mitigated against false negatives by applying a liberal threshold of Puncorrected < 0.05 to the one-sample t-test maps, following pre-registration specifications. This thresholding is justified because we did not want to exclude any datasets with weak potential traces of FC. Slice positions are indicated in millimeters relative to the anterior commissure.
Extended Data
Extended Data Fig. 1 |. Age and weight distributions.
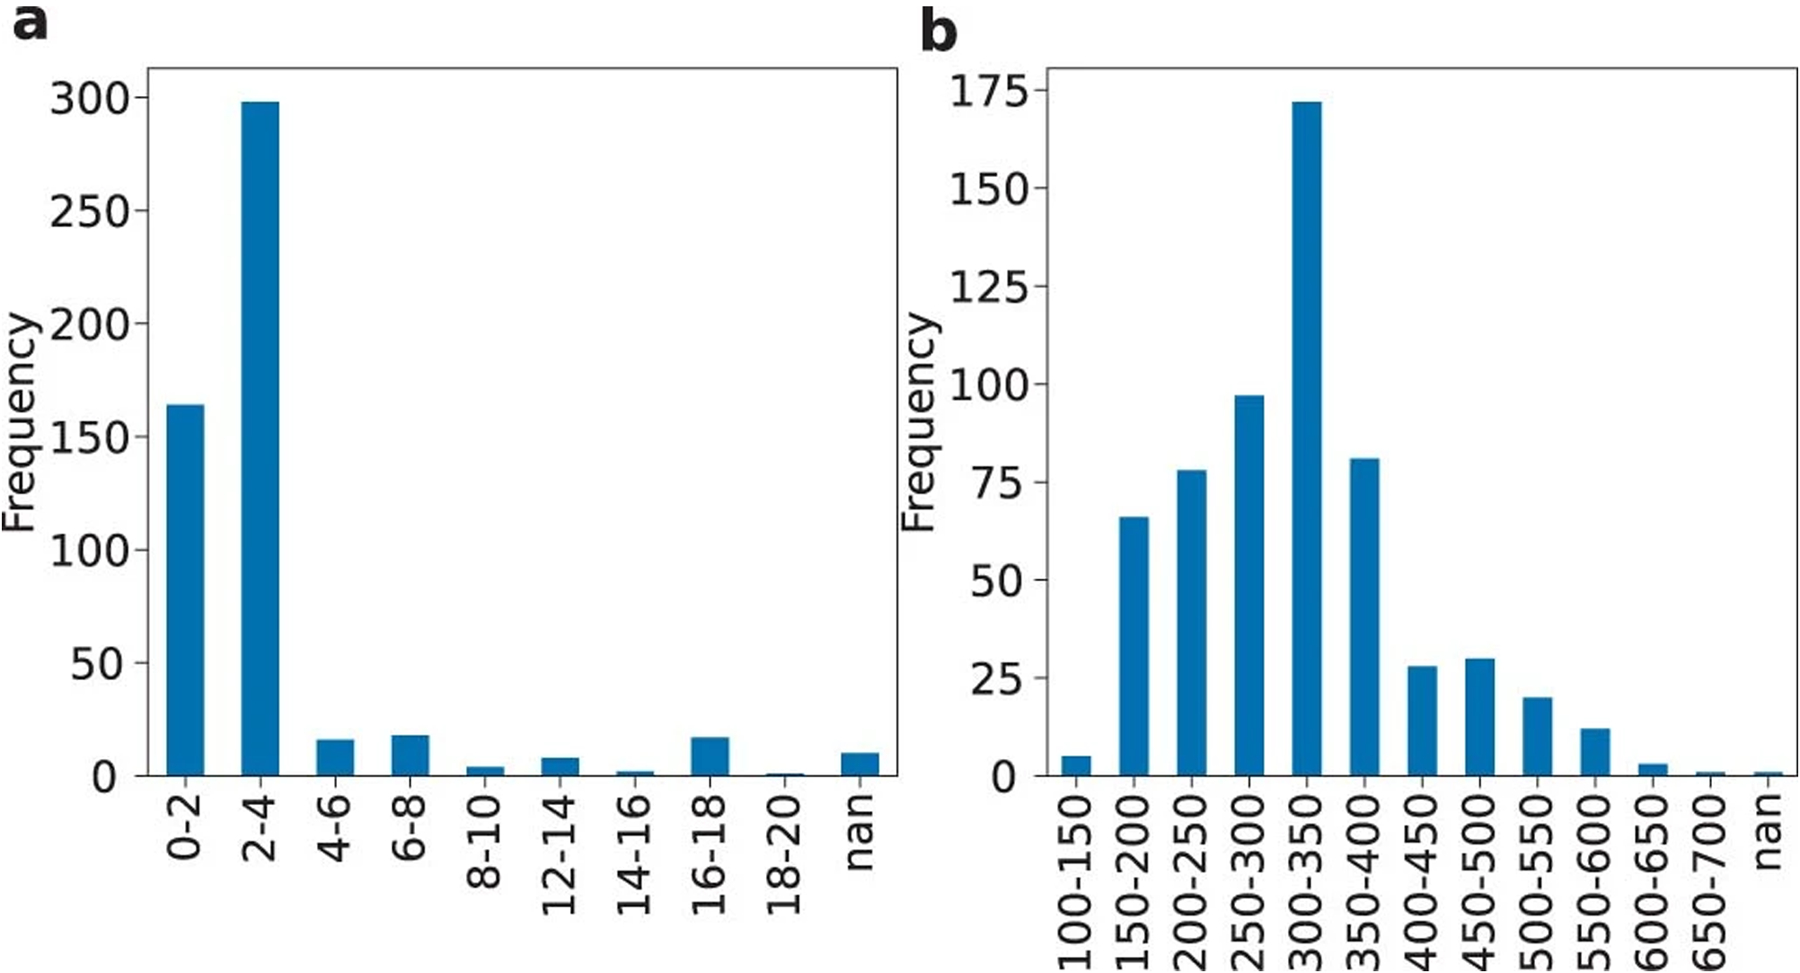
Age (a) and weight (b) distribution for the rats in the MultiRat_rest collection.
Extended Data Fig. 2 |. Quality control examples.
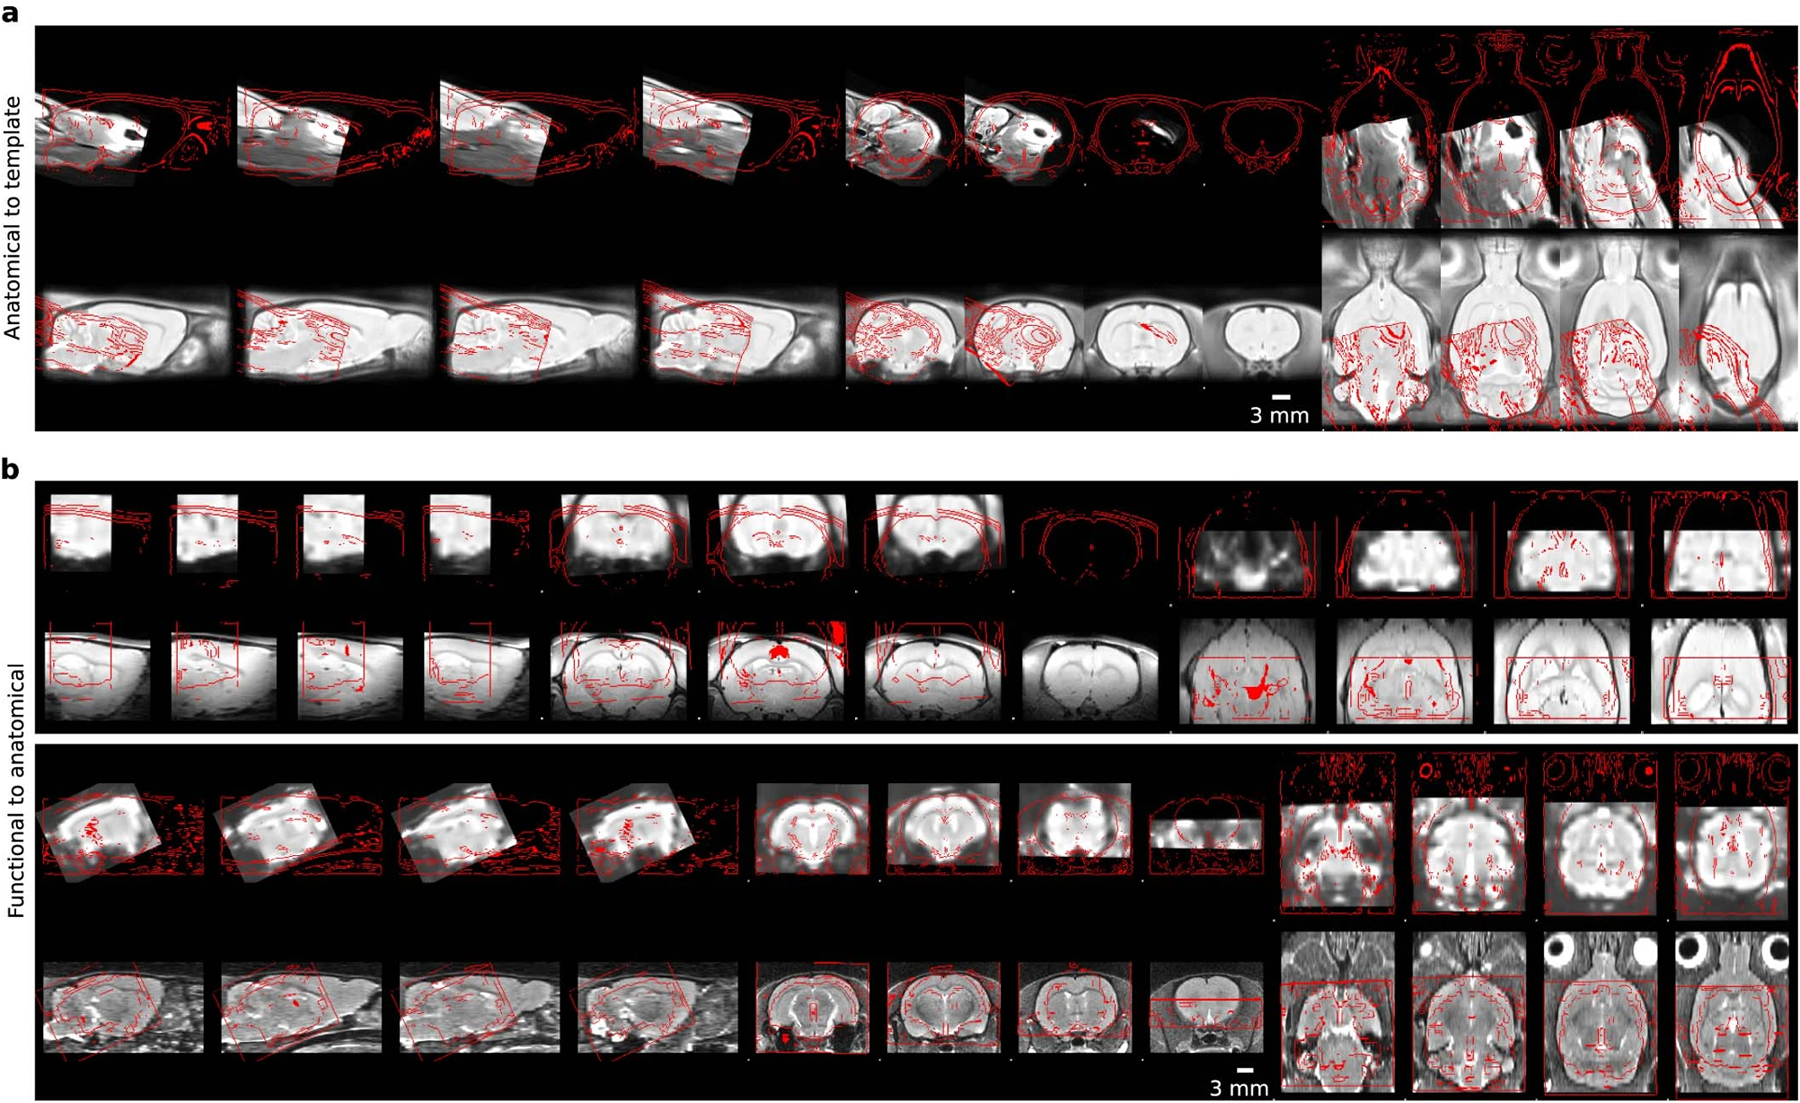
Failed quality controls for anatomical to template registrations (a) and functional to anatomical registrations (b). The top rows are the moving objects, bottom rows are the reference objects. The red lines indicate the outlines of the other object. Four slices along the sagittal, axial, and coronal axis are shown for each case.
Extended Data Fig. 3 |. Temporal signal-to-noise ratio.
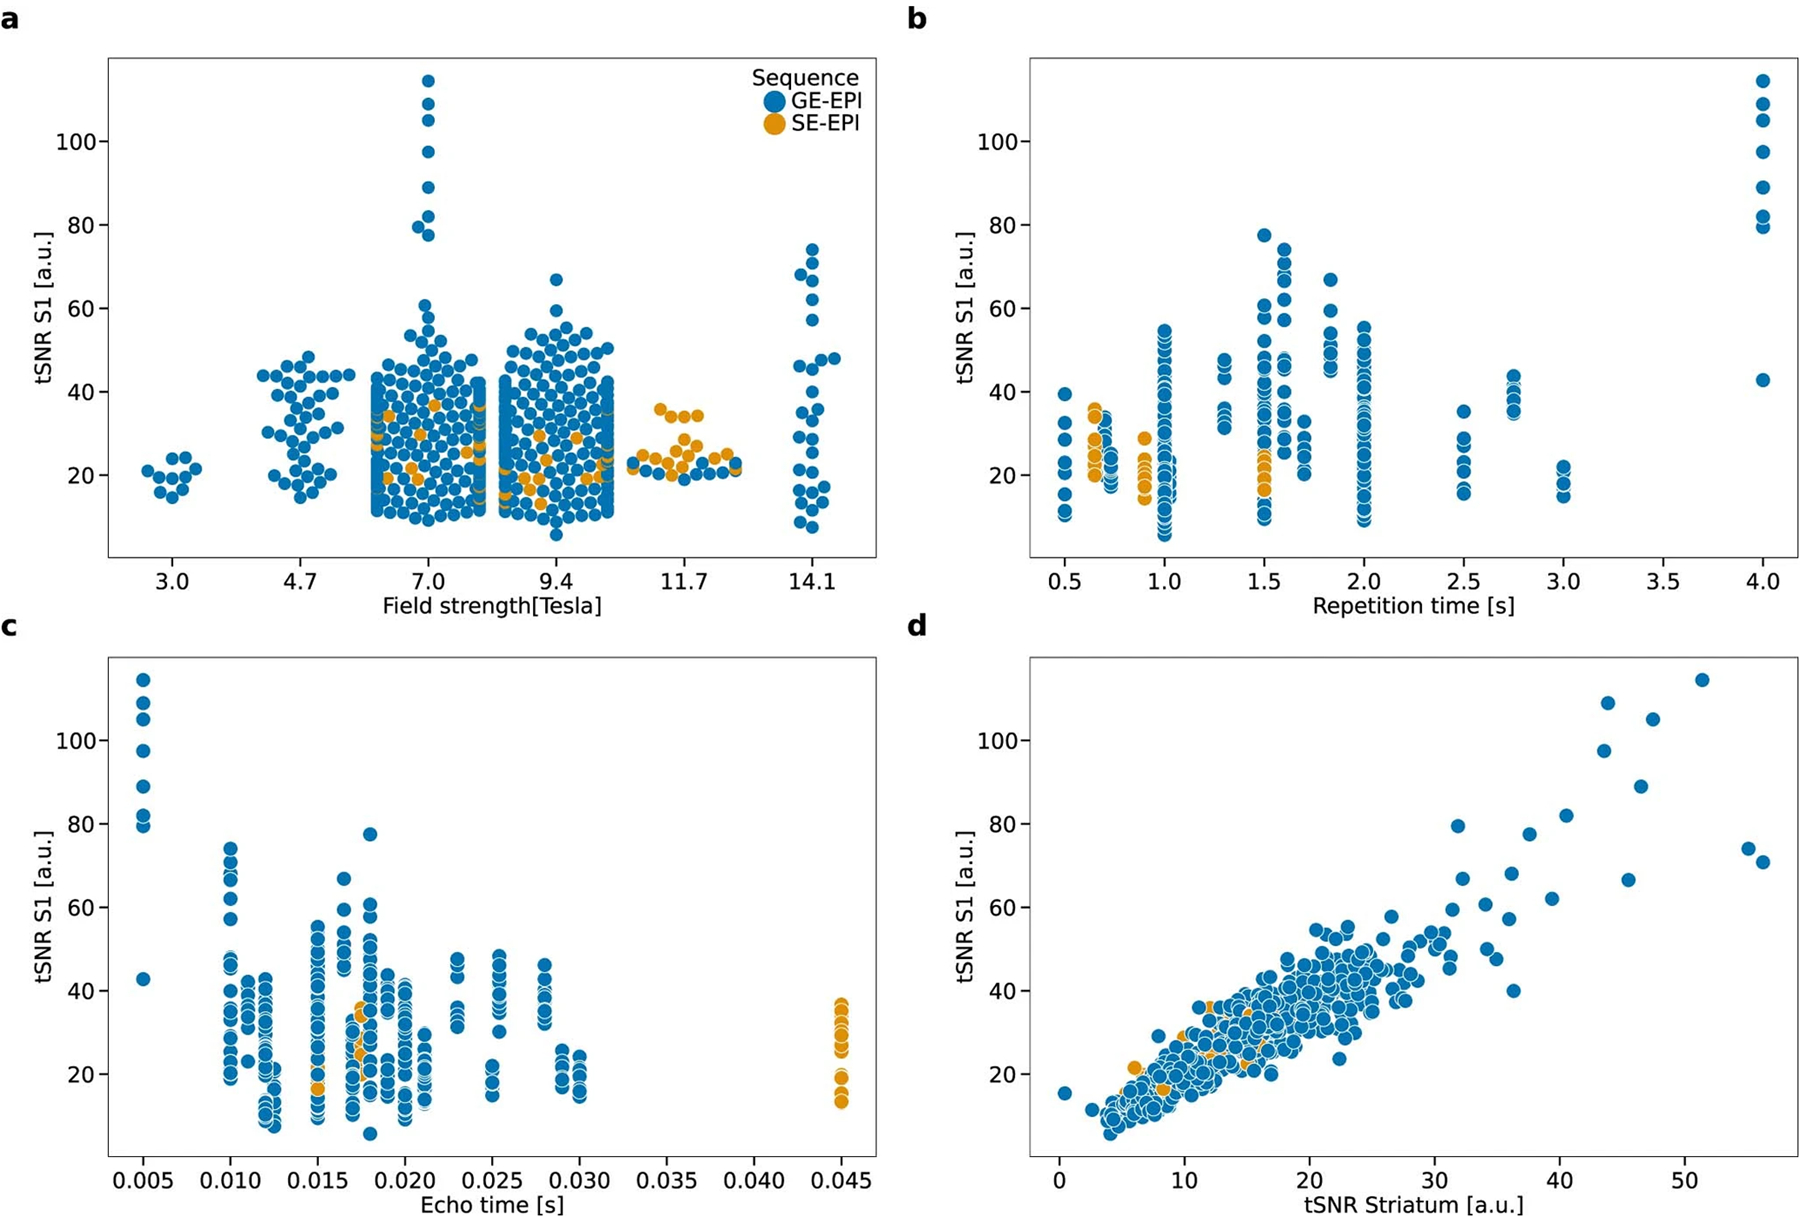
Temporal signal-to-noise ratio in the sensory cortex (tSNR S1) in the MultiRat_rest dataset collection as a function of (a) magnetic field strength, (b) repetition time, (c) echo time, (d) temporal signal-to-noise ratio in the striatum.
Extended Data Fig. 4 |. Framewise displacement.
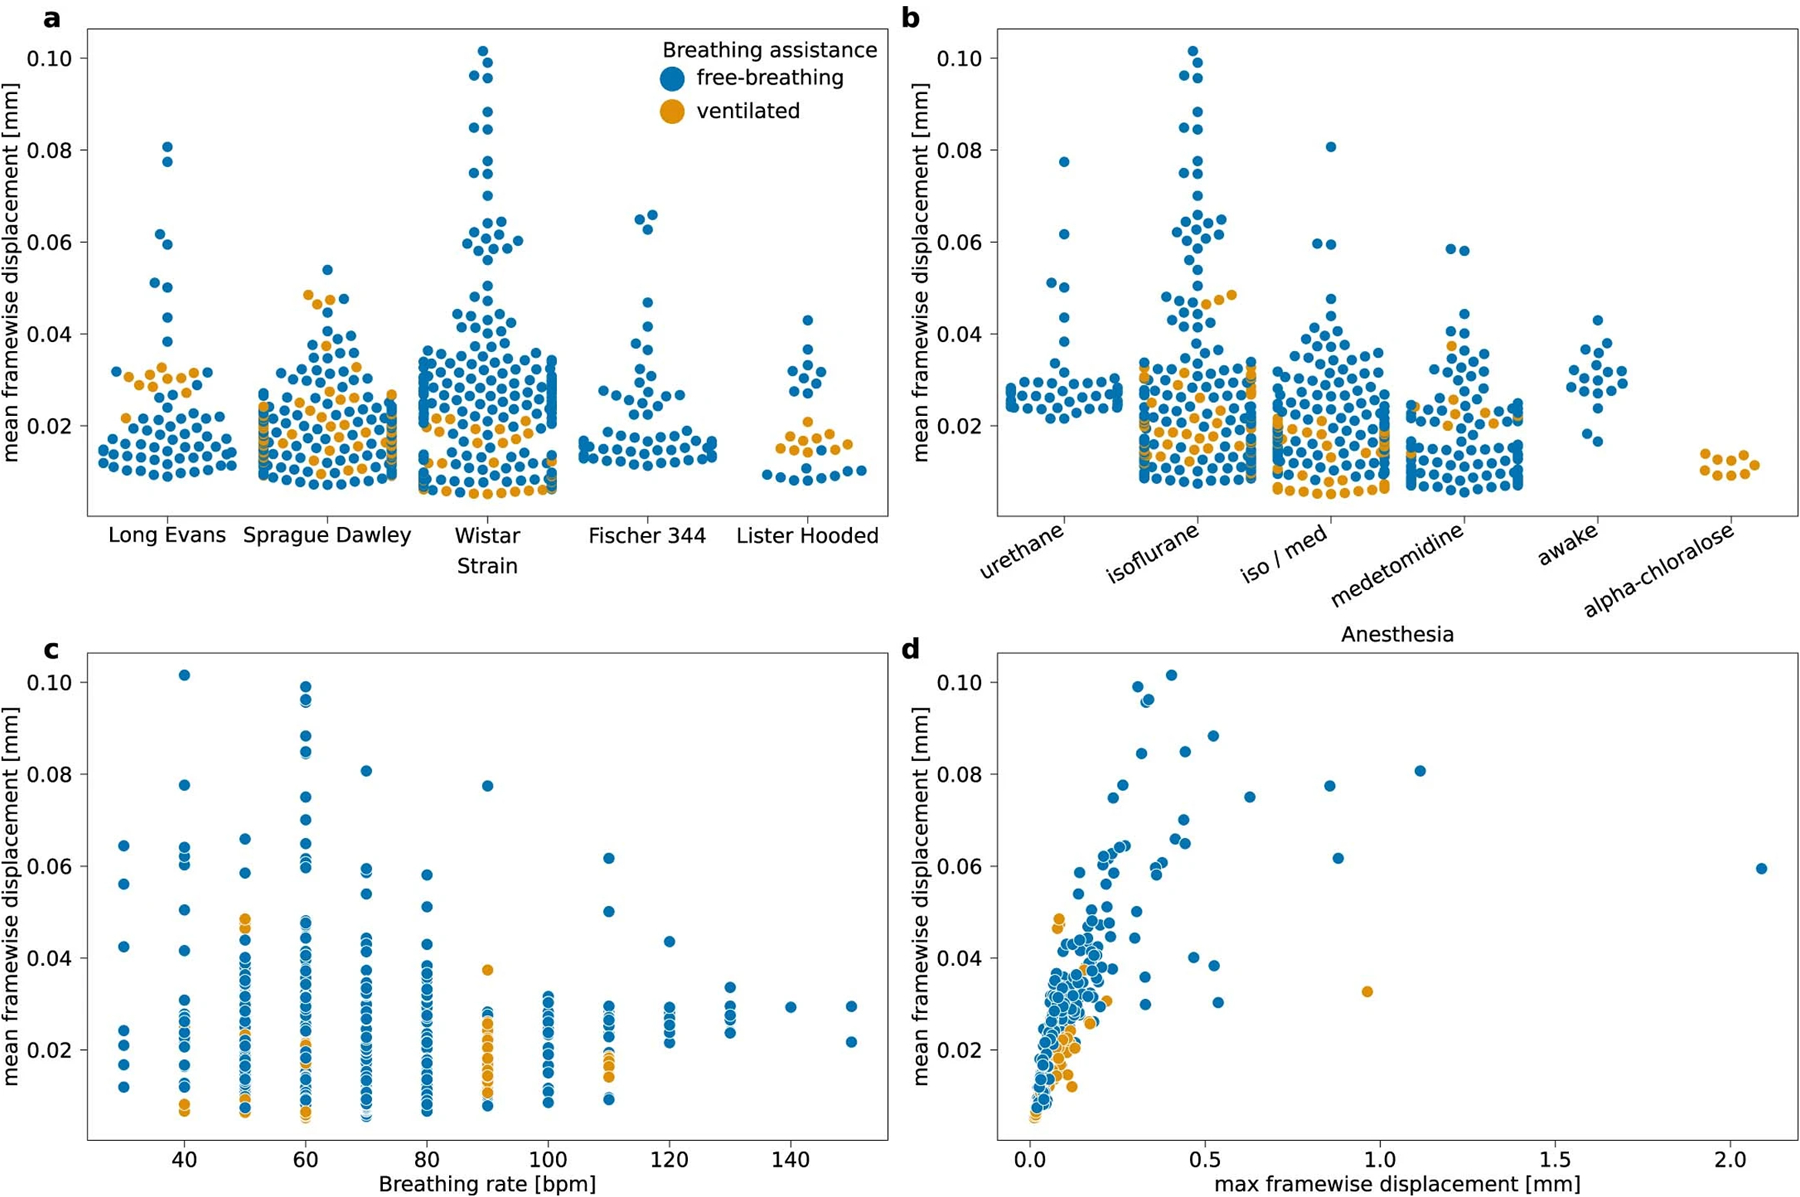
MFW in the MultiRat_rest dataset collection as a function of (a) strain, (b) anesthesia, (c) breathing rate, (d) maximal framewise displacement.
Extended Data Fig. 5 |. FC in the default-mode network.
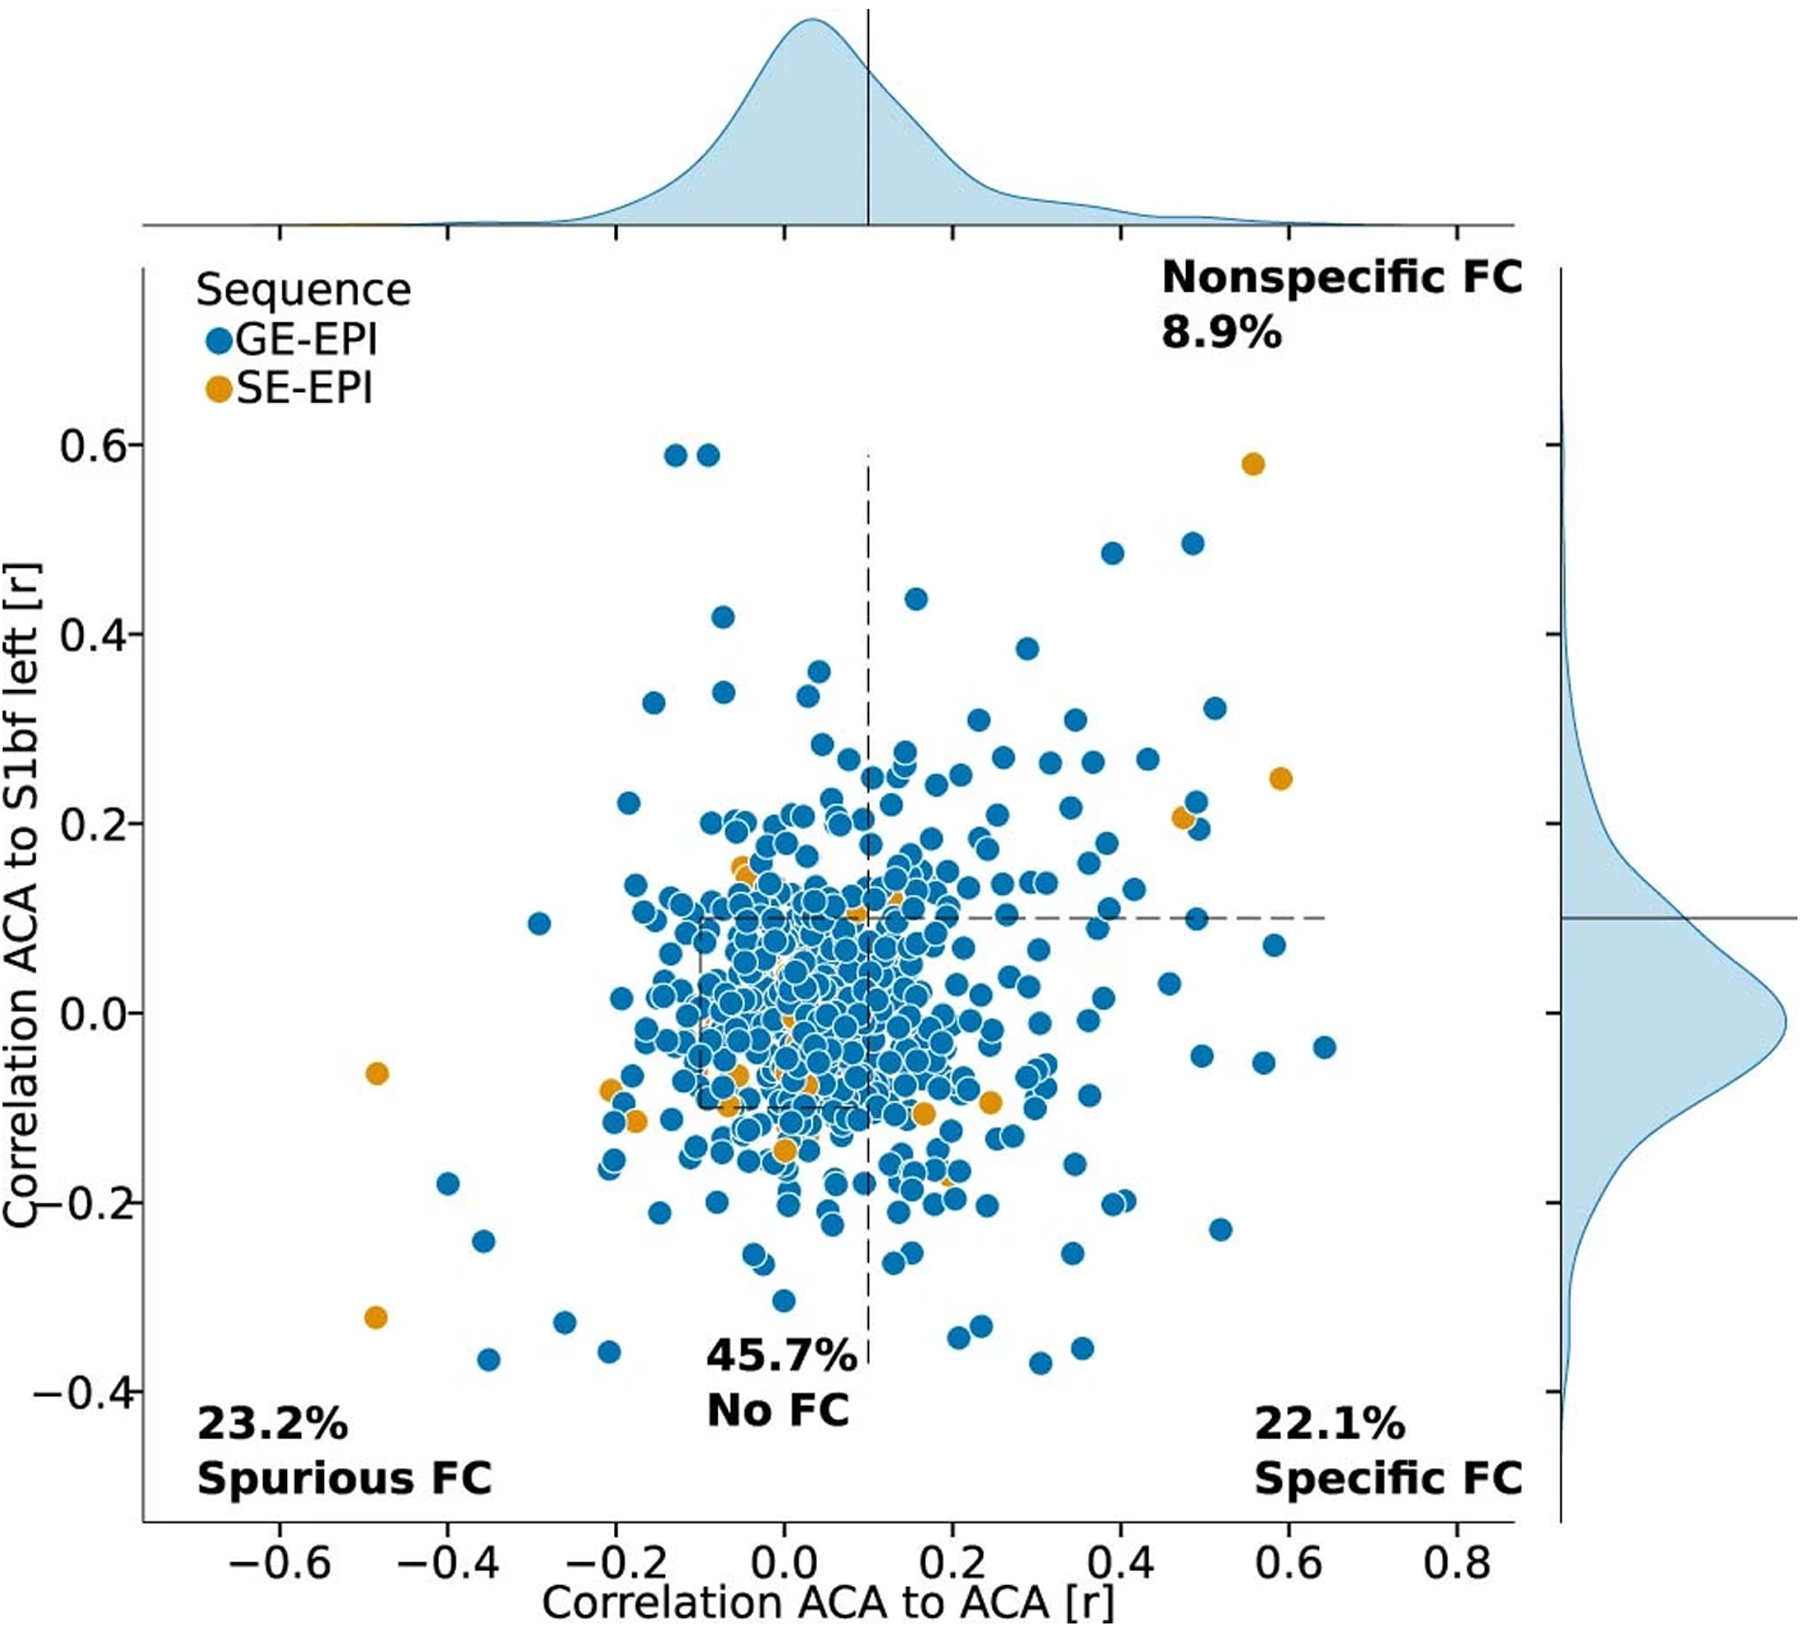
The reference seed is positioned in the anterior cingulate cortex (Fig. 2a), the specific region-of-interest is positioned 3.3 mm posterior in the cingulate cortex and the nonspecific region-of-interest is positioned in the S1bf.
Extended Data Fig. 6 |. StandardRat dataset description.
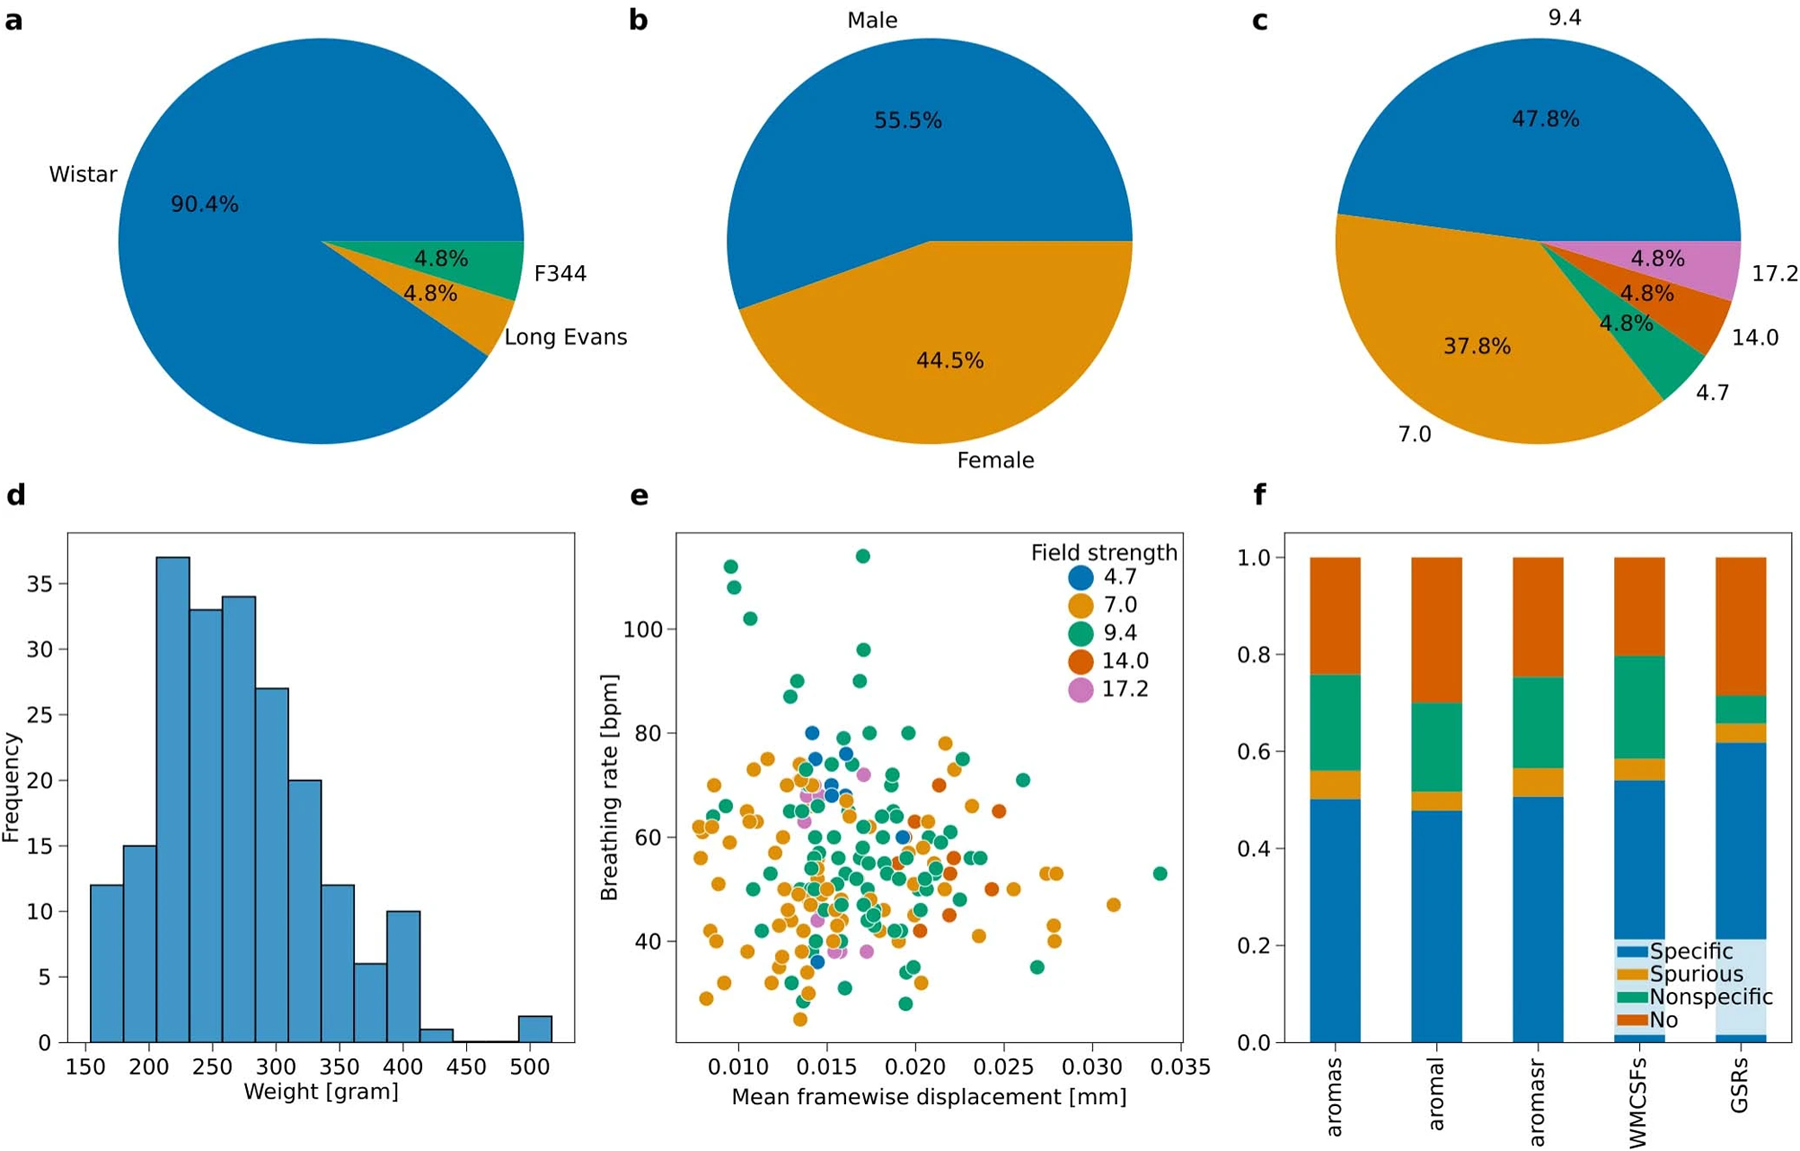
a. Strain. b. Sex. c. Field strength. d. Weight. e. Breathing rate as a function of MFW. f. FC specificity as a function of confound correction models.
Extended Data Fig. 7 |. FC incidence.
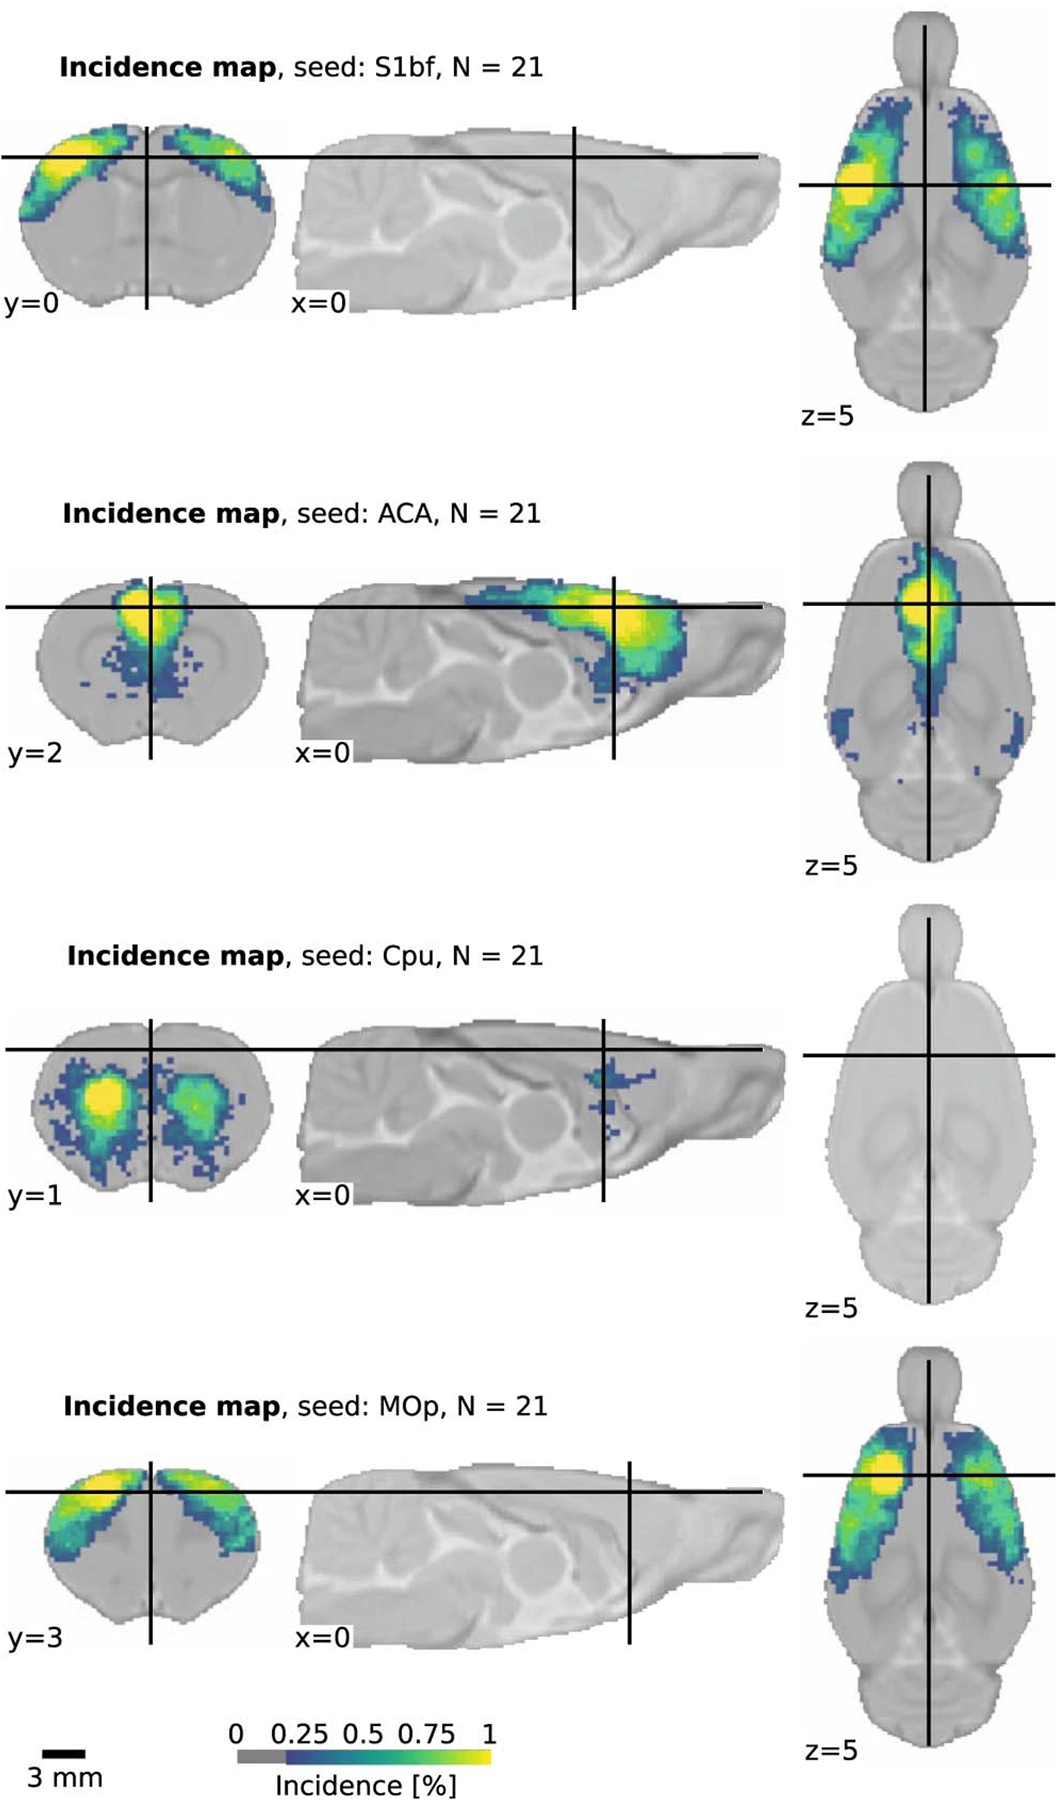
Incidence of FC at the group level in the StandardRat collection for four selected seeds (n = 21 datasets, n ~ 10 subjects per dataset). Connectivity incidence is improved in the StandardRat collection relative to MultiRat_rest (Fig. 3).
Extended Data Fig. 8 |. Between-datasets connectivity comparisons.
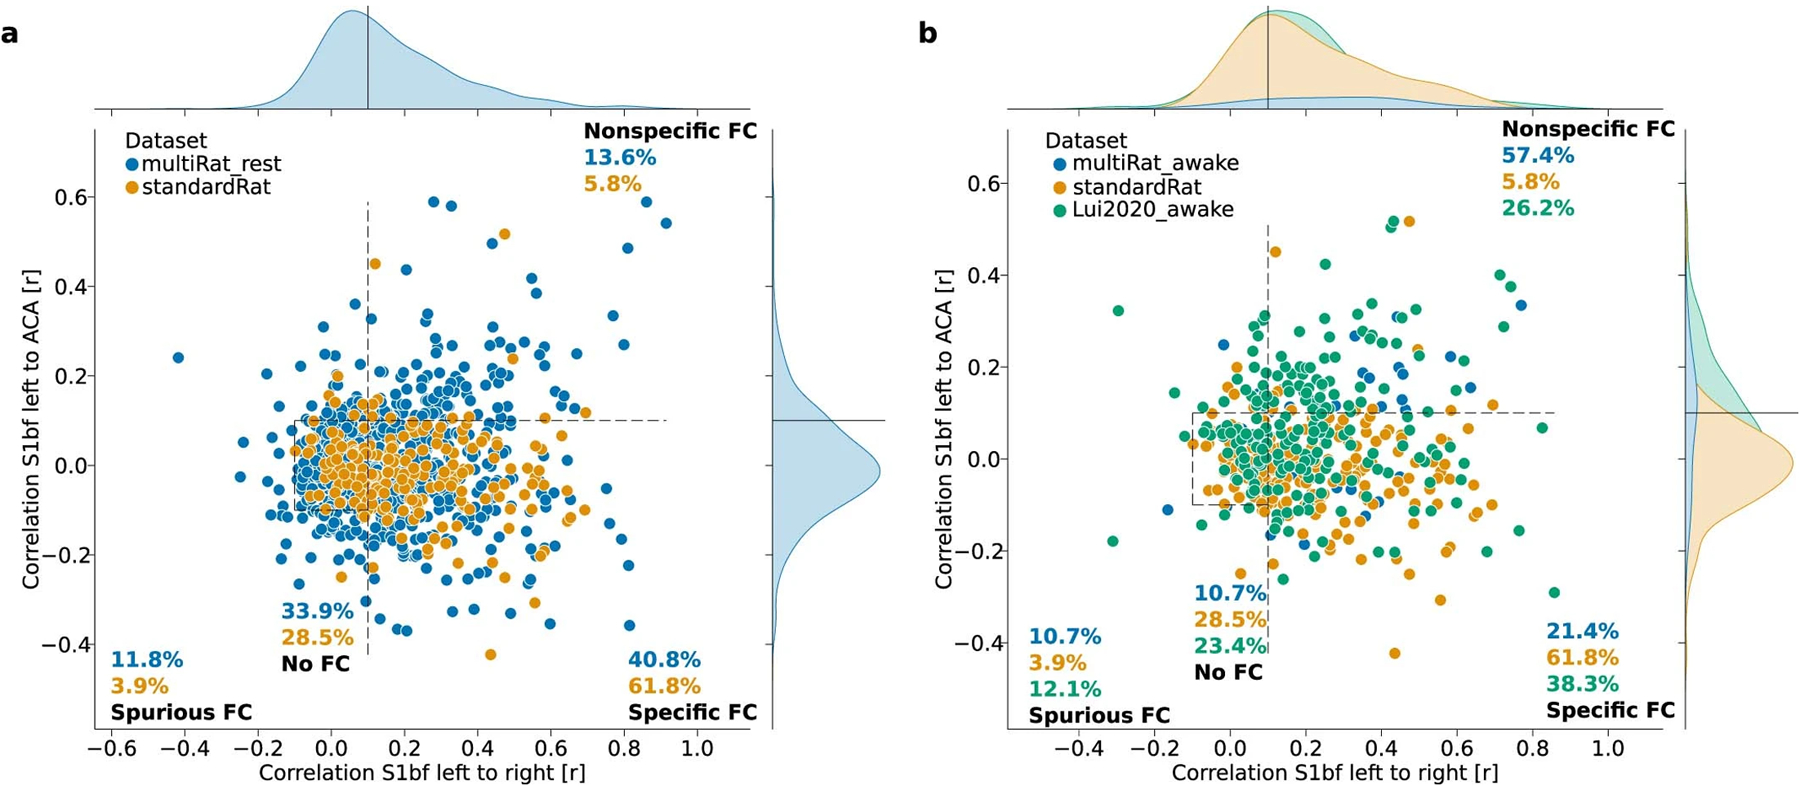
FC category comparison between MultiRat_rest and StandardRat (a) and between the awake datasets of MultiRat_rest and the awake dataset from Lui et al. 2020 (b).
Extended Data Fig. 9 |. Connectivity specificity as a function of breathing rate and signal-to-noise ratio.
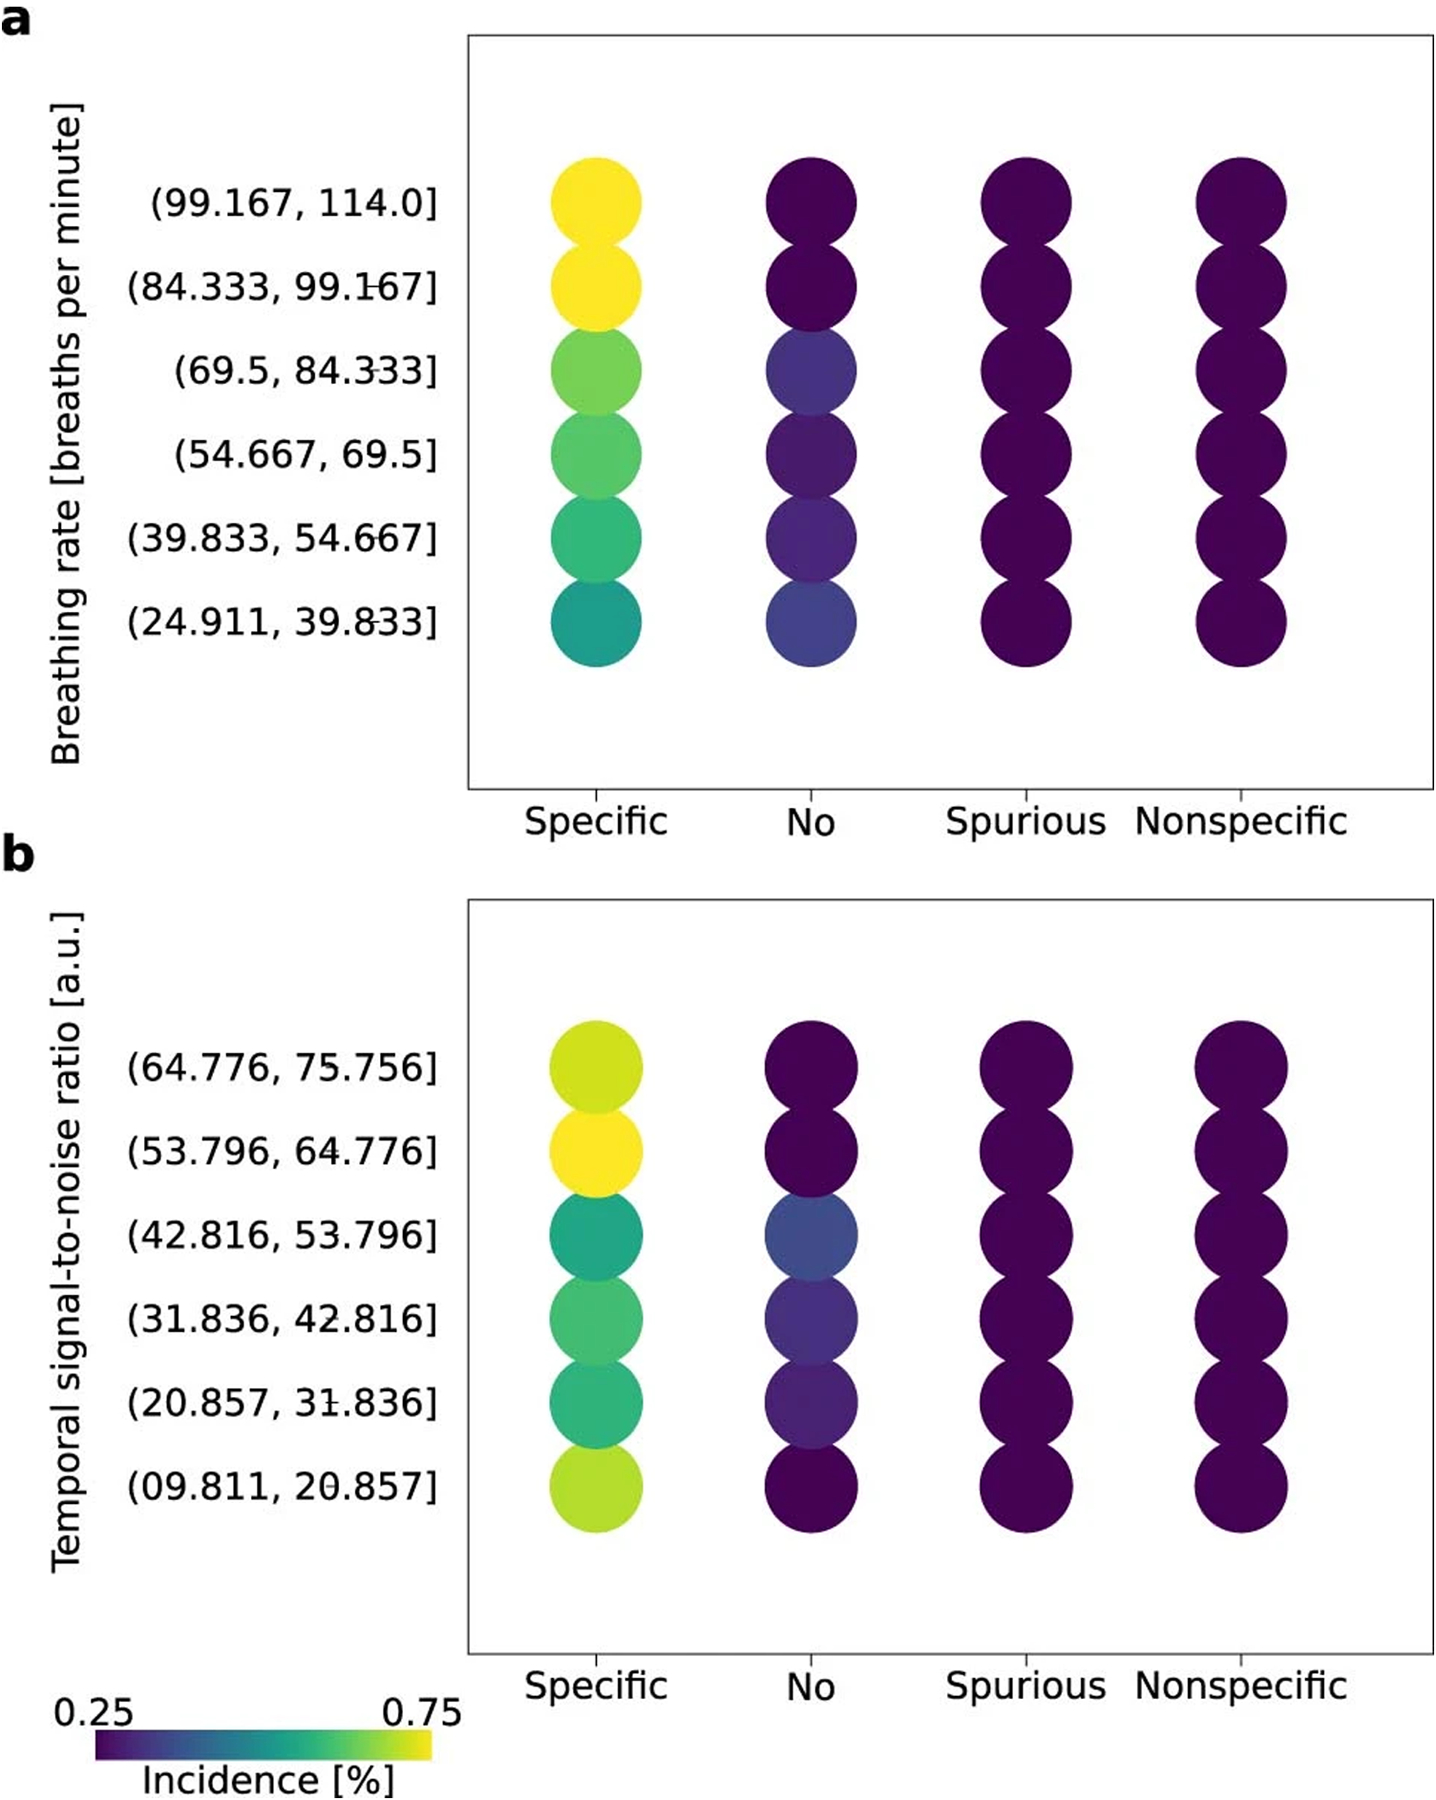
FC specificity as a function of binned breathing rate (a) AND temporal signal-to-noise ratio (b) in the StandardRat collection. The percentage of each condition is size and color-coded. High levels of connectivity specificity were achieved in scans where the breathing rates were in the 84 to 114 bpm range. Similarly, higher connectivity specificity incidences were found when the cortical temporal signal-to-noise ratio was > 53. These observations support the notion of an optimal breathing rate when applying the StandardRat protocol, along with temporal signal-to-noise ratio and movement targets.
Extended Data Fig. 10 |. Group independent components analysis.
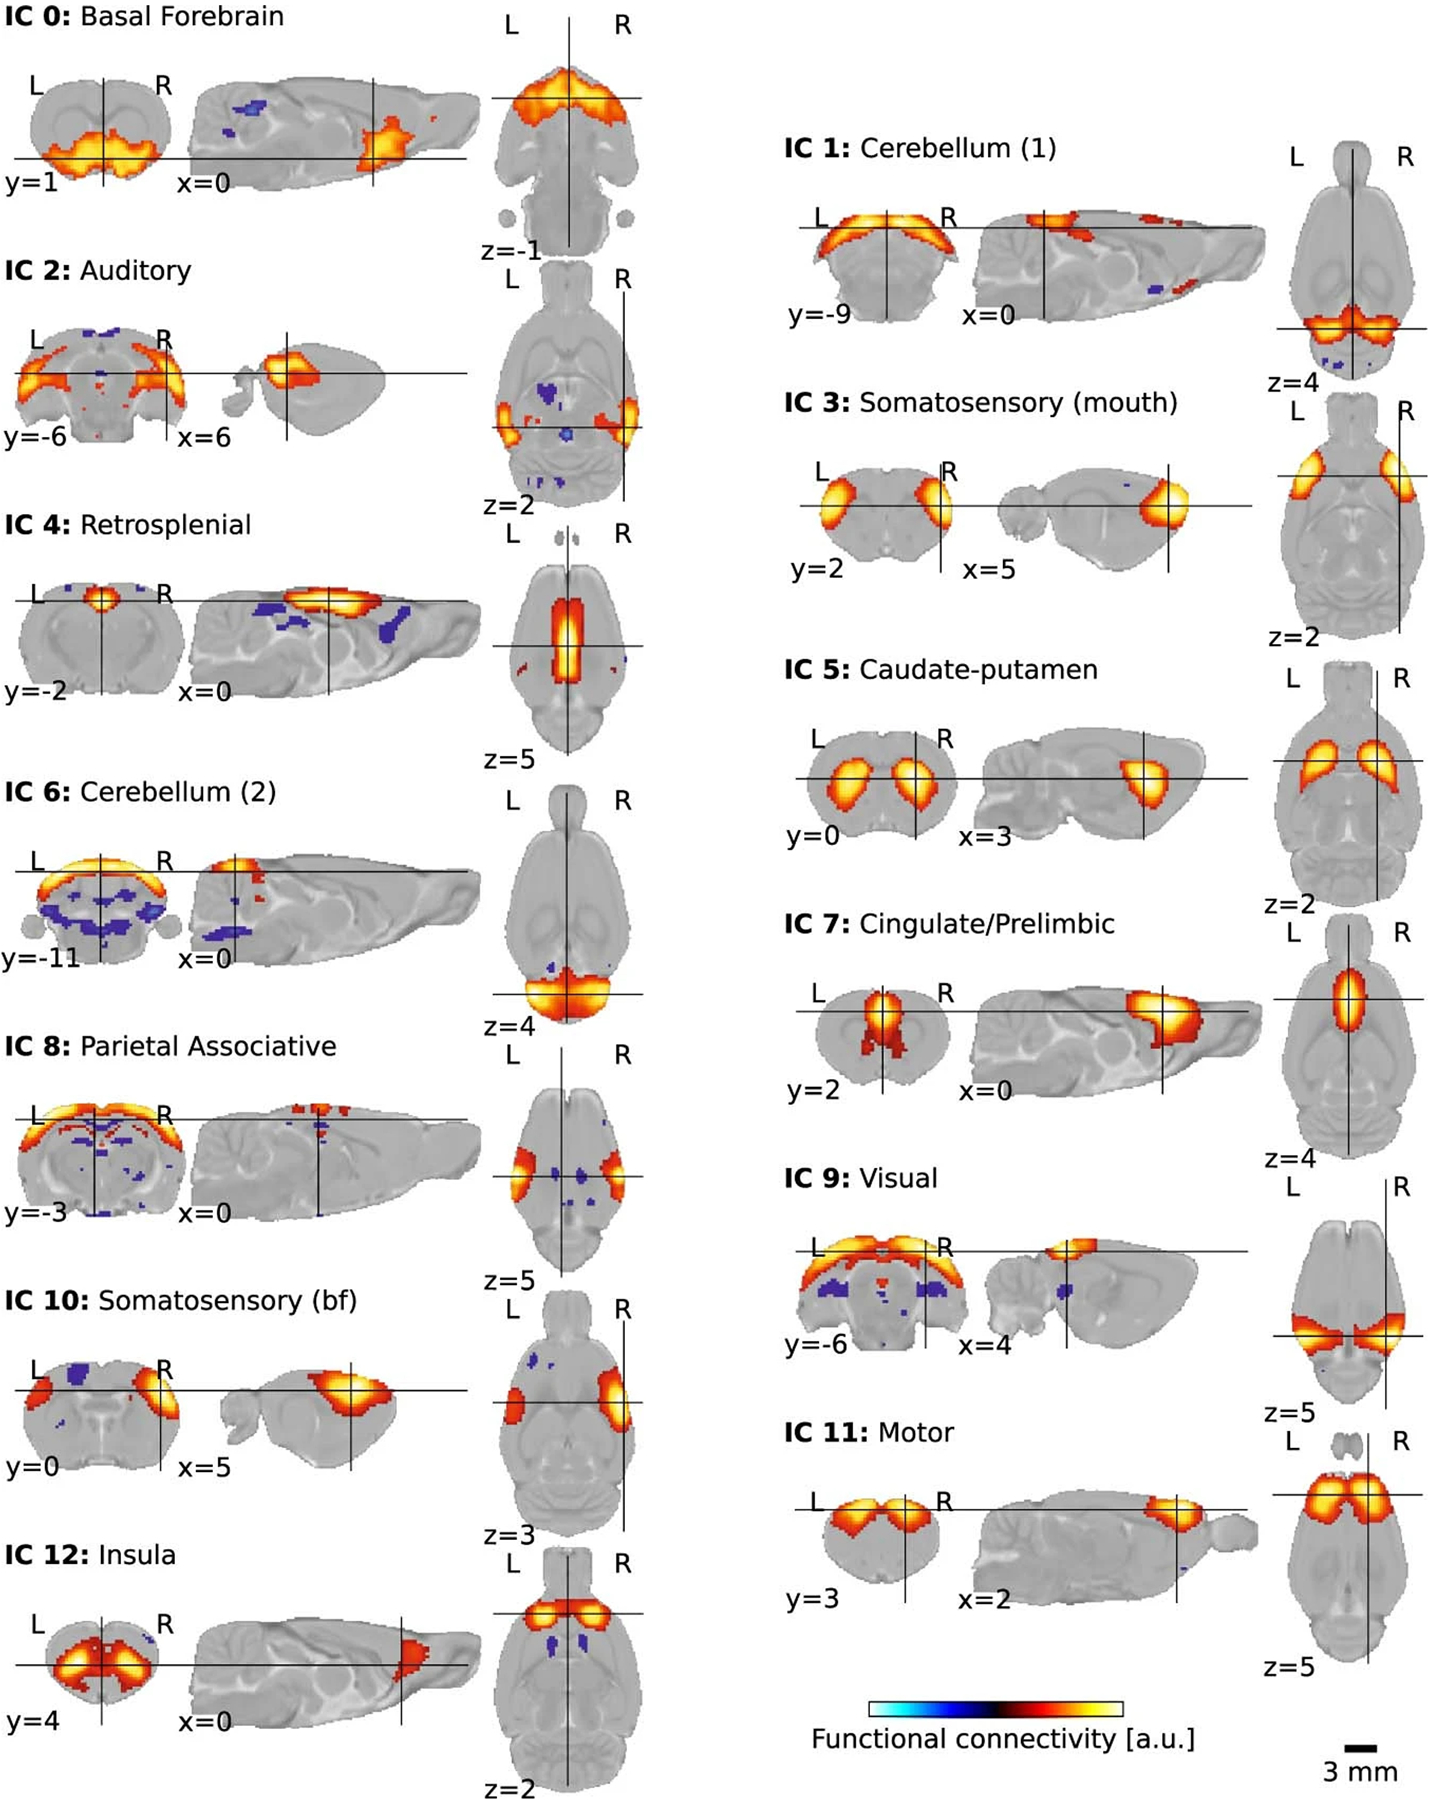
Plausible independent components overlapping with known rodent networks, obtained after group-level decomposition with n = 20 components. Labels are based on the SIGMA anatomical atlas.
Supplementary Material
Acknowledgements
This research was enabled, in part, by support provided by Compute Ontario (https://www.computeontario.ca/) and Compute Canada (www.computecanada.ca). For the purpose of open access, we have applied a CC BY public copyright license to any Author Accepted Manuscript version arising from this submission. This research was funded by: the National Institutes of Health (K01EB023983, R03DA042971, R21AG065819, K25DA047458, I015I01CX000642–04, R01NS085200, R01MH098003, RF1MH114224, T32AA007573, R01MH067528, P30NS05219, T32GM007205, R01MH111416, R01NS078095, R01EB029857, F31 MH115656 and 1R21MH116473–01A1); the Wellcome Trust (212934/Z/18/Z, 109062/Z/15/Z, 110027/Z/15/Z, 204814/Z/16/Z and 203139/Z/16/Z); the Dutch Research Council (OCENW.KLEIN.334, 021.002.053, 016.130.662 and 016.168.038); the German Research Foundation (SA 1869/15–1, SA 2897/2–1, SFB 1436/B06, SFB874/B3 project no.: 122679504, SFB 1280/A04 project no.: 316803389); the French National Research Agency (ANR-15-IDEX-02 and ANR-11-INBS-0006); Programa de Apoyo a Proyectos de Investigación e Innovación Tecnológica (IN212219, IA202120 and IA201622); the UK Medical Research Council (MR/N013700/1 and 1653552); the Portuguese Foundation for Science and Technology (LISBOA-01–0145-FEDER-022170 and 275-FCT-PTDC/BBB/IMG/5132/2014); the Swiss National Science Foundation (PCEFP3_203005 and PCEFP2_194260); King’s College London, Biotechnology and Biological Sciences Research Council (BB/N009088/1); the European Community’s Seventh Framework Program (FP7/2007–2013); TACTICS (278948); the Brain and Behaviour Foundation (NARSAD, 25861); the Dutch Brain Foundation (F2014(1)-06); the National Science Foundation (DMR-1644779, DMR-1533260, DMR-2128556); the Human Brain Project (945539); the Canadian Institutes of Health Research (PJT-148751, PJT-173442 and MOP-102599); the Natural Sciences and Engineering Research Council of Canada (RGPIN-2020–05917, RGPIN-375457–09 and RGPIN-2015–05103); the Horizon 2020 Framework Programme of the European Union (740264 and 802371); the Academy of Finland (298007); the European Research Council (679058 and 802371); Innosuisse (18546.1); the Research Foundation – Flanders (12W1619N, FWO-G048917N and G045420N); the Stichting Alzheimer Onderzoek (SAO-FRA-20180003); Special Research Programmes (1158); CIBER-BBN; Instituto de Salut Carlos III - FEDER (PI18/00893); Versus Arthritis (20777); the Brain Behavior Foundation (25861); the Telethon Foundation (GGP19177); Eurostars (E!114985); the Brain Canada Foundation platform support grant (PSG15–3755); the National Natural Science Foundation of China (81950410637); Science Foundation Ireland (20/FFPP/8799); Trinity Foundation (RCN 20028626); Consejo Nacional de Ciencia y Tecnologia Ciencia de Frontera (171874); PAPIIT-DGAPA (IA208022); Fonds de recherche du Québec – Nature et technologies; the Forrest Research Foundation; the Australian National Imaging Facility; the University of Western Australia; the National Health and Medical Research Council of the Australian Government; the Perron Institute for Neurological and Translational Science; McGill University’s Faculty of Medicine; the Seaver Foundation; Autism Speaks; the Centre d’Imagerie BioMédicale of the UNIL, UNIGE, HUG, CHUV, EPFL; the Leenaards and Louis-Jeantet Foundations; the DFG Research Center for Nanoscale Microscopy and Molecular Physiology of the Brain; the Synapsis Foundation; the Simons Initiative for the Developing Brain; the Patrick Wild Centre; the Department of Biotechnology India; Utrecht University High Potential Program; ERA-NET NEURON Neuromarket; Mannheim Advanced Clinician Scientist Program; ICON – Interfaces and Interventions in Complex Chronic Conditions; the Werner Siemens Foundation; the Lisboa Regional Operational Programme; the Japan Ministry of Education, Culture, Sports, Science and Technology (MEXT); ShanghaiTech University; the Shanghai Municipal Government; and the Interdisciplinary Center for Clinical Research Münster (PIX).
Footnotes
Competing interests
A.S. is an employee of Bruker, the manufacturer of preclinical MRI systems used for the acquisition of most of the datasets in this collection. E.L.B. is a consultant for Bruker. B.V. is an employee of Theranexus. S.Z., A.D. and N.B. are employees of Novartis Pharma AG. T.N. is founder and CEO of MRI.TOOLS GmbH. The other authors declare no competing interests.
Reporting summary
Further information on research design is available in the Nature Portfolio Reporting Summary linked to this article.
Extended data is available for this paper at https://doi.org/10.1038/s41593-023-01286-8.
Supplementary information The online version contains supplementary material available at https://doi.org/10.1038/s41593-023-01286-8.
Code availability
Jupyter notebooks demonstrating the analysis code are available under the terms of the Apache-2.0 license (https://github.com/grandjeanlab/MultiRat;https://doi.org/10.5281/zenodo.7614670).
Data availability
The raw datasets are available here: unstandardized resting-state fMRI (MultiRat_rest) (https://doi.org/10.18112/openneuro.ds004114.v1.0.0); standardized resting-state fMRI (StandardRat) (https://doi.org/10.18112/openneuro.ds004116.v1.0.0).The pre-processed volumes, time series and quality control files are available here: https://doi.org/10.34973/1gp6-gg97. Image pre-processing, confound correction and connectivity analysis were performed using RABIES 0.3.5 (https://github.com/CoBrALab/RABIES(ref.14).
References
- 1.Elam JS et al. The Human Connectome Project: a retrospective. Neuroimage 244, 118543 (2021). [DOI] [PMC free article] [PubMed] [Google Scholar]
- 2.Mennes M, Biswal B, Castellanos FX & Milham MP Making data sharing work: the FCP/INDI experience. Neuroimage 82, 683 (2013). [DOI] [PMC free article] [PubMed] [Google Scholar]
- 3.Miller KL et al. Multimodal population brain imaging in the UK Biobank prospective epidemiological study. Nat. Neurosci 19, 1523–1536 (2016). [DOI] [PMC free article] [PubMed] [Google Scholar]
- 4.Smith SM et al. Resting-state fMRI in the Human Connectome Project. Neuroimage 80, 144–168 (2013). [DOI] [PMC free article] [PubMed] [Google Scholar]
- 5.Van Essen DC et al. The WU-Minn Human Connectome Project: an overview. Neuroimage 80, 62–79 (2013). [DOI] [PMC free article] [PubMed] [Google Scholar]
- 6.Homberg JR et al. The continued need for animals to advance brain research. Neuron 109, 2374–2379 (2021). [DOI] [PubMed] [Google Scholar]
- 7.Alfaro-Almagro F et al. Image processing and quality control for the first 10,000 brain imaging datasets from UK Biobank. Neuroimage 166, 400–424 (2018). [DOI] [PMC free article] [PubMed] [Google Scholar]
- 8.Esteban O et al. FMRIPrep: a robust preprocessing pipeline for functional MRI. Nat. Methods 16, 111–116 (2019). [DOI] [PMC free article] [PubMed] [Google Scholar]
- 9.Mandino F et al. Animal functional magnetic resonance imaging: trends and path toward standardization. Front. Neuroinform 13, 78 (2019). [DOI] [PMC free article] [PubMed] [Google Scholar]
- 10.Reimann HM & Niendorf T The (un)conscious mouse as a model for human brain functions: key principles of anesthesia and their impact on translational neuroimaging. Front. Syst. Neurosci 14, 8 (2020). [DOI] [PMC free article] [PubMed] [Google Scholar]
- 11.Pais-Roldán P et al. Contribution of animal models toward understanding resting state functional connectivity. Neuroimage 245, 118630 (2021). [DOI] [PMC free article] [PubMed] [Google Scholar]
- 12.Grandjean J et al. Common functional networks in the mouse brain revealed by multi-centre resting-state fMRI analysis. Neuroimage 205, 116278 (2020). [DOI] [PMC free article] [PubMed] [Google Scholar]
- 13.Milham MP et al. An open resource for non-human primate imaging. Neuron 100, 61–74 (2018). [DOI] [PMC free article] [PubMed] [Google Scholar]
- 14.Desrosiers-Gregoire G, Devenyi GA, Grandjean J & Chakravarty MM Rodent Automated Bold Improvement of EPI Sequences (RABIES): a standardized image processing and data quality platform for rodent fMRI. 2022.08.20.504597 Preprint at https://www.biorxiv.org/content/10.1101/2022.08.20.504597v1 (2022). [DOI] [PMC free article] [PubMed] [Google Scholar]
- 15.Paasonen J, Stenroos P, Salo RA, Kiviniemi V & Gröhn O Functional connectivity under six anesthesia protocols and the awake condition in rat brain. Neuroimage 172, 9–20 (2018). [DOI] [PubMed] [Google Scholar]
- 16.Biswal B, Yetkin FZ, Haughton VM & Hyde JS Functional connectivity in the motor cortex of resting human brain using echo-planar MRI. Magn. Reson. Med 34, 537–541 (1995). [DOI] [PubMed] [Google Scholar]
- 17.Gozzi A & Schwarz AJ Large-scale functional connectivity networks in the rodent brain. Neuroimage 127, 496–509 (2016). [DOI] [PubMed] [Google Scholar]
- 18.Mandino F et al. A triple-network organization for the mouse brain. Mol. Psychiatry 27, 865–872 (2021). [DOI] [PMC free article] [PubMed] [Google Scholar]
- 19.Fox MD et al. The human brain is intrinsically organized into dynamic, anticorrelated functional networks. Proc. Natl Acad. Sci. USA 102, 9673–9678 (2005). [DOI] [PMC free article] [PubMed] [Google Scholar]
- 20.Zerbi V, Grandjean J, Rudin M & Wenderoth N Mapping the mouse brain with rs-fMRI: an optimized pipeline for functional network identification. Neuroimage 123, 11–21 (2015). [DOI] [PubMed] [Google Scholar]
- 21.Liu Y et al. An open database of resting-state fMRI in awake rats. Neuroimage 220, 117094 (2020). [DOI] [PMC free article] [PubMed] [Google Scholar]
- 22.Lee S-H et al. An isotropic EPI database and analytical pipelines for rat brain resting-state fMRI. Neuroimage 243, 118541 (2021). [DOI] [PMC free article] [PubMed] [Google Scholar]
- 23.Lee H-L, Li Z, Coulson EJ & Chuang K-H Ultrafast fMRI of the rodent brain using simultaneous multi-slice EPI. Neuroimage 195, 48–58 (2019). [DOI] [PubMed] [Google Scholar]
- 24.Milham MP et al. Assessment of the impact of shared brain imaging data on the scientific literature. Nat. Commun 9, 2818 (2018). [DOI] [PMC free article] [PubMed] [Google Scholar]
- 25.Barrière DA et al. The SIGMA rat brain templates and atlases for multimodal MRI data analysis and visualization. Nat. Commun 10, 5699 (2019). [DOI] [PMC free article] [PubMed] [Google Scholar]
- 26.Papp EA, Leergaard TB, Calabrese E, Johnson GA & Bjaalie JG Waxholm Space atlas of the Sprague Dawley rat brain. Neuroimage 97, 374–386 (2014). [DOI] [PMC free article] [PubMed] [Google Scholar]
- 27.Gorgolewski KJ et al. The brain imaging data structure, a format for organizing and describing outputs of neuroimaging experiments. Sci. Data 3, 160044 (2016). [DOI] [PMC free article] [PubMed] [Google Scholar]
- 28.Cox RW AFNI: software for analysis and visualization of functional magnetic resonance neuroimages. Comput. Biomed. Res 29, 162–173 (1996). [DOI] [PubMed] [Google Scholar]
- 29.Avants B, Tustison NJ & Song G Advanced Normalization Tools: V1.0. Insight J. 10.54294/uvnhin (2009). [DOI] [Google Scholar]
- 30.Pruim RHR et al. ICA-AROMA: a robust ICA-based strategy for removing motion artifacts from fMRI data. Neuroimage 112, 267–277 (2015). [DOI] [PubMed] [Google Scholar]
- 31.Abraham A et al. Machine learning for neuroimaging with scikit-learn. Front. Neuroinform 8, 14 (2014). [DOI] [PMC free article] [PubMed] [Google Scholar]
- 32.Virtanen P et al. SciPy 1.0: fundamental algorithms for scientific computing in Python. Nat. Methods 17, 261–272 (2020). [DOI] [PMC free article] [PubMed] [Google Scholar]
- 33.Vallat R Pingouin: statistics in Python. J. Open Source Softw 3, 1026 (2018). [Google Scholar]
Associated Data
This section collects any data citations, data availability statements, or supplementary materials included in this article.
Supplementary Materials
Data Availability Statement
The raw datasets are available here: unstandardized resting-state fMRI (MultiRat_rest) (https://doi.org/10.18112/openneuro.ds004114.v1.0.0); standardized resting-state fMRI (StandardRat) (https://doi.org/10.18112/openneuro.ds004116.v1.0.0).The pre-processed volumes, time series and quality control files are available here: https://doi.org/10.34973/1gp6-gg97. Image pre-processing, confound correction and connectivity analysis were performed using RABIES 0.3.5 (https://github.com/CoBrALab/RABIES(ref.14).


