Abstract
Both machine learning and physiologically-based pharmacokinetic models are becoming essential components of the drug development process. Integrating the predictive capabilities of physiologically-based pharmacokinetic (PBPK) models within machine learning (ML) pipelines could offer significant benefits in improving the accuracy and scope of drug screening and evaluation procedures. Here, we describe the development and testing of a self-contained machine learning module capable of faithfully recapitulating summary pharmacokinetic (PK) parameters produced by a full PBPK model, given a set of input drug-specific and regimen-specific information. Because of its widespread use in characterizing the disposition of orally administered drugs, the PBPK model chosen to demonstrate the methodology was an open-source implementation of a state-of-the-art compartmental and transit model called OpenCAT. The model was tested for drug formulations spanning a large range of solubility and absorption characteristics, and was evaluated for concordance against predictions of OpenCAT and relevant experimental data. In general, the values predicted by the ML models were within 20% of those of the PBPK model across the range of drug and formulation properties. However, summary PK parameter predictions from both the ML model and full PBPK model were occasionally poor with respect to those derived from experiments, suggesting deficiencies in the underlying PBPK model.
Subject terms: Pharmacokinetics, Computational science
Introduction
Machine learning is increasingly used in many aspects of drug discovery and development1–3, with a common use being the virtual screening of chemical libraries. Many of the studies published in the literature have focused on advances in screening for bioactivity4–7, with many fewer centered on pharmacokinetics8–11. These latter studies have proven to be relatively effective across large chemical libraries, but do not generally have the predictive power of special-purpose tools like physiologically based pharmacokinetic (PBPK) models.
PBPK models, which incorporates anatomical, physiological, and biochemical relationships, are widely used in the drug development process and have proven useful in predicting drug ADME for a range of therapeutics12,13, including pediatric drugs14, biopharmaceutics15, generic drugs16, monoclonal antibodies17, and nanoparticles18. In the case of orally administered drugs, compartmental absorption and transit (CAT) PBPK models are often used. These models include many details of drug absorption, metabolism, and transport in the gastrointestinal tract, which is often divided into discrete segments, each of which may account for drug in various states, e.g., unreleased, undissolved, dissolved, and absorbed into the enterocytes. Implementations of such models include the ACAT (advanced compartmental and transient) model19, part of the proprietary software GastroPlus®, and the OpenCAT model20,21, developed de novo using the open source software GNU MCSim22.
Usage of PBPK models, like ACAT or OpenCAT, requires the solution of (often complex) systems of differential equations that may make implementation difficult in certain workflows, like those common in machine learning pipelines23. One approach to address this limitations is to capture the essential features of PBPK simulation predictions within a trained ML model. Such a model could take as input drug-specific information and would output essential PK parameters as a stage in a multi-element analysis pipeline. The aim of this work was to explore the feasibility of this approach using OpenCAT as the underlying PBPK model.
Methods
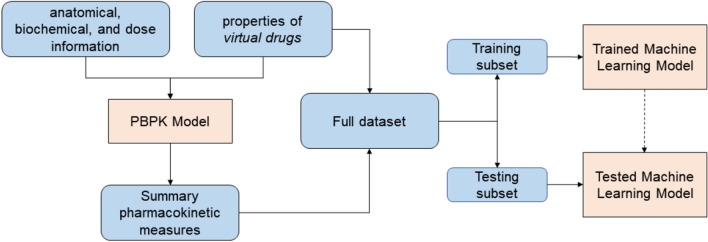
To achieve the project aim, a machine-learning model was developed to take as input drug-specific properties and produce as output various summary pharmacokinetic measures comparable to those generated by the full PBPK model. The development workflow comprised several steps: (i) Generating a dataset comprising properties of a large set of virtual drugs, (ii) Simulating the pharmacokinetics of each member of the dataset using the PBPK model and calculating summary pharmacokinetic measures, (iii) Developing and training machine learning models using the drug properties and summary PK measures, (iv) Critically evaluating the models in terms of their predictive capabilities. A schematic of the workflow is shown in Fig. 1.
Figure 1.
Elements and steps in the workflow.
Dataset generation
Drug properties
The aim of this part of the workflow was to generate a large set of virtual drugs whose properties spanned the four classes of the Biopharmaceutics Classification System (BCS)24, which organizes compounds into four categories: Class I—high permeability, high solubility; Class II—high permeability, low solubility; Class III—low permeability, high solubility; and Class IV—low permeability, low solubility. To generate these property sets, drug properties (molecular mass, molar volume, acidic dissociation constant, effective permeability, precipitation rate constant, drug solubility, particle radius, and drug density) and additional parameters influencing drug pharmacokinetics (the ratio of the drug unbound fraction over its partition coefficient (), metabolic parameters, dose magnitude, and subject body weight) were taken from the literature25–31 to establish realistic ranges for all measures (see Table 1). Assuming a uniform distribution for each of the ranges, a Monte Carlo sampling procedure was employed in which a given sample was constructed by drawing from each parameter distribution. In total, 15,000 virtual drugs were generated for use in subsequent steps in the workflow.
Table 1.
Ranges for property of interest determined by examining physical properties of actual drugs spanning all BCS classes.
| Parameter name | Range | Units |
|---|---|---|
| Molecular mass | 20–1700 | |
| Molar volume | 30–1200 | |
| Acidic dissociation constant | 0–14 | – |
| Particle radius | 5–50 | |
| Drug density | 0.1–0.7 | |
| Drug solubility | 0.001–1000 | |
| Precipitation rate constant | 0.01–1 | h-1 |
| Effective permeability of GI tract epithelia | 0.015–8 | |
| Unbound fraction over partition coefficient in compartment i, FuPCi | 0.01–100 | – |
| Subject’s body mass | 45–125 | kg |
| Dose magnitude | 1–50 103 | |
| Metabolism rate constant, | 0.04–10 | mM |
| Metabolism rate constant, | 10-6–10-2 |
To assess whether the generated virtual drugs were representative of actual drugs, 40 drugs across all BCS classes were selected from ChEMBL32 and PubChem33 and their properties determined. Tests confirmed that 90% of the real drugs had at least one ’close match’ in the virtual drugs dataset and all of them had at least one ’moderate match’. In this analysis, ’close match’ and ’moderate match’ meant that all of the following properties of the virtual drug were within 15% and 50%, respectively, of those of an actual drug: molecular weight, density, molar volume, pKa, solubility, and effective permeability.
Though assigning drugs to a specific BCS classes is not always straightforward34,35, for the purpose of this work, classes were assigned based simply on specific thresholds of solubility and permeability24,36 Using this procedure, the library of virtual drugs comprised 6392 Class I, 2097 Class II, 4920 Class III, and 1591 Class IV drugs.
Pharmacokinetic information
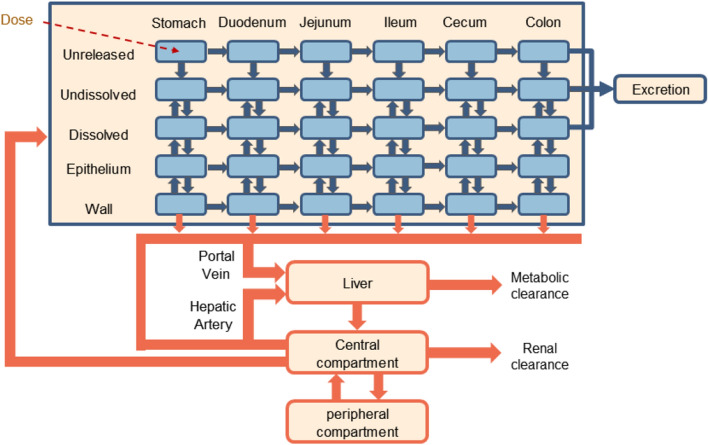
For each member of the set of virtual drugs, a simulation was performed using the OpenCAT model, whose structure is shown in Fig. 2. These simulations produced predicted time-course concentrations of the chemical in each state (unreleased, undissolved, dissolved) and compartment. For the purpose of comparison to experimental values from the literature, the detailed simulation results were condensed into the summary pharmacokinetic metrics (SPKMs) , , and using the predicted PK information from the blood. SPKMs values were normalized using min-max scaling.
Figure 2.
Structural overview of the OpenCAT PBPK model.
Finally, to create the full dataset, the properties of each virtual drug were combined with its corresponding normalized SPKMs.
Model development
Prior to model development, values were randomly selected from the full dataset (inputs + normalized SPKMs) to create training and testing subsets comprising 80% and 20% of the values, respectively. For each machine learning model, the drug properties and additional parameters noted earlier were used as features, while the normalized SPKMs were used as labels. Though a multivariate model could be constructed to predict all three normalized SPKMs, it was found that distinct models for each label (i.e., each normalized SPKM) consistently performed better in recapitulating target values.
Algorithm selection: To inform the process of algorithm selection, two machine learning algorithms appropriate for regression analyses, were evaluated: random forest37 and gradient boosting38,39. Preliminary evaluations indicated that both gradient boosting and random forest algorithm were equally suitable for this application, but because it proved to be more computationally efficient in cases of interest, random forest (RF) regression was selected.
Model training: Utilizing the training data set, the algorithm’s hyperparameters were tuned by performing a grid search. In addition to hyperparameters, the number of trees were optimized to maximize the accuracy of the algorithm while minimizing overfitting. From this process, the number of trees was set to 150 for all models.
Model evaluation
Assessment metrics: To assess the performance of each ML-based model relative to those from the OpenCAT model, two metrics were used: (i) the relative error in predicted normalized SPKMs between the OpenCAT and ML models and (ii) the adjusted coefficient of determination across the entire set of virtual drugs, which is defined as
where n is the number of values in the data set, k is the number of independent features included, and is the the unadjusted coefficient of determination given by the conventional definition: , where SSR is the sum of squares of the residuals and SST is the total sum of squares.
Feature importance assessment: A study was conducted to evaluate the influence of feature set (number of features and features selected) on the accuracy of the model. Subsets having fewer features than the full feature set (FFS) are known as reduced feature sets (RFS). The RFS were generated iteratively and utilized the feature importance score40 for aggregation. The performance of each model was evaluated when trained using the FFS and all RFS. The optimal RFS was selected as the set with the highest value relative to the OpenCAT predictions.
Testing against experimental data: To further test the models, the normalized SPKMs were compared to those from OpenCAT and from experimentally-measured values for ten specific drugs (see Table 2).
Table 2.
Drugs used for model evaluation.
| Drug name | CAS number | BCS class | Literature references |
|---|---|---|---|
| Acetaminophen | 103-90-2 | Class III/IV | 41–43 |
| Codeine | 76-57-3 | Class I | 44,45 |
| Diazepam | 439-14-5 | Class I | 42,46 |
| Enalapril | 75847-73-3 | Class III | 47,48 |
| Fluvastatin | 93957-54-1 | Class II | 49,50 |
| Metoprolol | 51384-51-1 | Class I | 51,52 |
| Midazolam | 59467-70-8 | Class I | 53,54 |
| Ranitidine | 66357-35-5 | Class III | 42,55 |
| Trazodone | 19794-93-5 | Class II | 56,57 |
| Valacyclovir hydrochloride | 124832-27-5 | Class III | 58,59 |
Software
Python60 (v3.8) was used for general data processing. All machine learning simulations were conducted using scikit-learn (v1.1.3)61, and pharmacokinetic simulations were implemented and run using GNU MCSim22 (v6.1.0).
Results
Model verification
Full feature set model
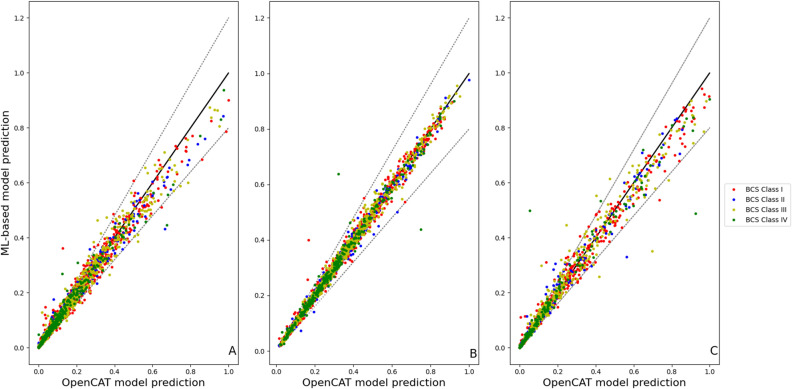
Figure 3 shows a comparison of the predictions of the full feature set (FFS) models with those from OpenCAT across the testing subset of virtual drugs. The values for the individual models were 0.85, 0.93, 0.86 for , , and , respectively.
Figure 3.
Comparison of normalized machine learning-based model predictions and their OpenCAT counterparts using the testing subset for (A) , (B) , and (C) . In all panels, the solid line represents perfect agreement and the dashed lines indicate the ± 20% error bounds.
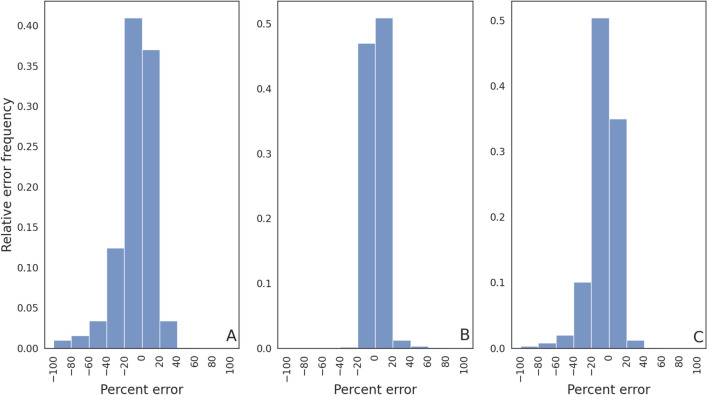
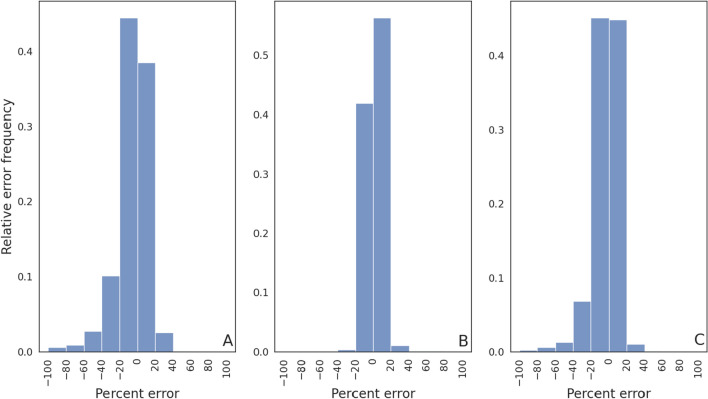
To assess the degree of relative error between the machine learning and OpenCAT model predictions across the testing subset of virtual drugs, results were binned to create error frequency distributions (see Fig. 4). In the panels of this figure, the abscissa represents the relative error percentage, while the ordinate of the plots represents the relative error magnitude frequency. As summarized in Table 3, the total fraction of samples having relative errors in the range was 0.77, 0.97, and 0.82 for , , and , respectively. At a threshold of , the fractions were increased to 0.93, 0.99, and 0.95 for these same metrics.
Figure 4.
Relative error frequency for the full feature training set FFS for (A) , (B) , and (C) .
Table 3.
Fraction of predictions within relative error ranges for the full and reduced training set models.
| Model | ± 20% | ± 40% | ||||
|---|---|---|---|---|---|---|
| FFS | 0.77 | 0.97 | 0.82 | 0.93 | 0.99 | 0.95 |
| Optimal RFS | 0.83 | 0.98 | 0.90 | 0.96 | 0.99 | 0.98 |
Optimal reduced feature set model
Following the identification of the optimal reduce feature set, an evaluation identical to that for the FFS models was conducted. In this case, the values were 0.93, 0.98, and 0.95 for the , , and models, respectively.
Similar to the previous case, histograms were generated to quantify the frequency of obtaining a prediction within a certain error percentage (see Fig. 5). As listed in Table 3, for this model the total fraction of samples having relative errors in the range was 0.83 for , 0.98 for , and 0.90 for . For errors in the range of , these fractions were increased to 0.96, 0.99, and 0.98.
Figure 5.
Relative error frequency for the optimal reduced feature training set (RFS) for (A) , (B) , and (C) .
Feature importance
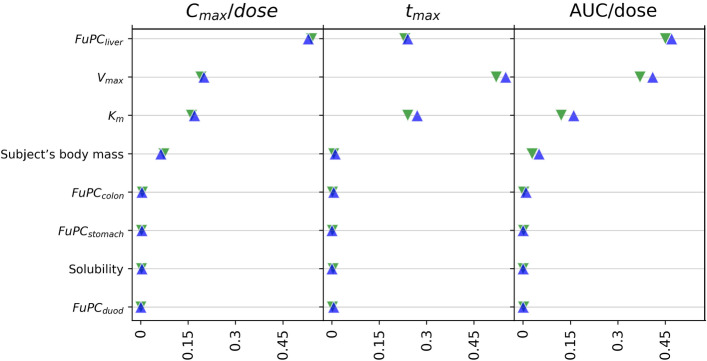
As noted earlier, to assess the influence of each of the features on the model predictions, a feature importance study was conducted. It was found that the eight most influential features overall—and those used to create the optimal RFS model—were (i) the fraction unbound to partition coefficient ratio for the liver (FuPCliver), (ii, iii) the two metabolism rate constants ( and ), (iv) the subject’s body mass, (v) the drug solubility, and (vi, vii, viii) the fraction unbound to partition coefficient ratio for the colon , stomach , and duodenum (FuPCcolon, FuPCstomach, FuPCduod). Other results of this study are shown in Fig. 6, which depicts the feature importance scores for both the FFS and optimal RFS models.
Figure 6.
Feature importance assessment for the ML-based models. Green inverted triangles represent the feature importance scores associated with the FFS model while blue triangles represent the scores for the optimal RFS model.
Model verification against experimental data
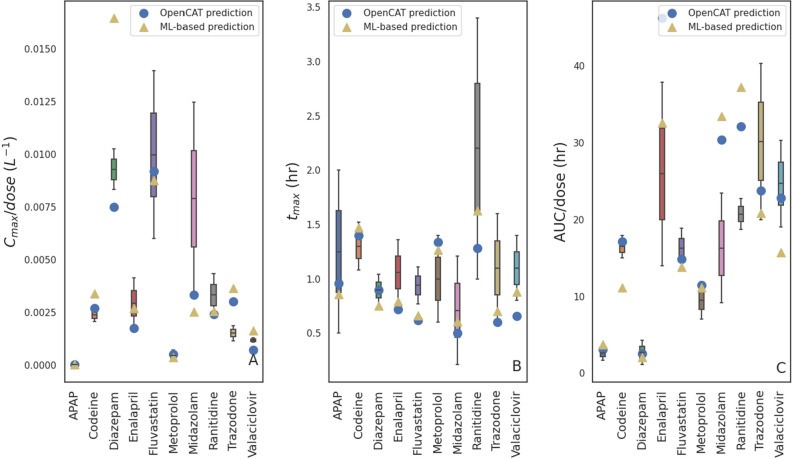
As an additional test, the optimized RFS models underwent comparison to the experimental data described earlier. The resulting values for the min-max normalized PK parameters are depicted in Fig. 7. There were often several values of the same SPKM from different experiments and/or cited uncertainty in these values. These values are represented in the figure as boxes (first to the third quartiles) and whiskers (minimum and maximum values). The predicted SPKMs from the ML and OpenCAT models are indicated by symbols. As expected, the agreement between the ML models and experimentally-obtained data was similar to that of the full PBPK model. While good agreement with experimental values was seen for many drugs and BCS classes ( of 0.61, 0.79, and 0.77 for , , and , respectively), models showed relatively poor predictive capabilities for others. These deficiencies may correspond to shortcomings previously described in the literature for the ACAT model for certain kinds of drugs62.
Figure 7.
Comparison of experimental results vs those of the presents ML-based models and OpenCAT for (A) , (B) , and (C) .
Discussion
Agreement between predicted SPKMs for the machine learning models and full OpenCAT PBPK model were generally very good, suggesting that the methodology can be a viable means to introduce PBPK-level accuracy in pharmacokinetic predictions to a machine learning workflow. Models based on the optimized reduced feature set outperformed those based on the full feature set for all SPKMs evaluated, indicating that a feature optimization step is warranted to produce a model with the best fidelity with respect to the original PBPK model.
Though the primary focus here was on translating the OpenCAT model to a self-contained module appropriate as a component in a machine learning pipeline, it is expected that the methodology will be amenable to almost any PBPK model. Moreover, while this study focused on a specific set of model inputs and outputs (SPKMs), these can easily be customized for the application of interest.
Despite its promise, there are two potential deficiencies that must be considered. First, the generation of the set of virtual drugs used to underpin the methodology relied on randomly sampling values across parameter ranges. Although realistic values were used to establish these ranges, some combinations of properties likely resulted in unrealistic drug candidates. Second, the derived ML model will suffer the same predictive deficiencies and anomalies as the underlying PBPK model, so a prudent choice of the underlying model must be made.
Author contributions
B.R. conceived the study, S.H. developed the software and conducted the simulations, S.H. and B.R. analysed the results. Both authors reviewed the manuscript.
Data availability
The datasets generated and/or analysed during the current study are available in a Zenodo repository, https://doi.org/10.5281/zenodo.7837360.
Competing interests
The authors declare no competing interests.
Footnotes
Publisher's note
Springer Nature remains neutral with regard to jurisdictional claims in published maps and institutional affiliations.
References
- 1.Issa, N. T., Stathias, V., Schürer, S. & Dakshanamurthy, S. Machine and deep learning approaches for cancer drug repurposing. In Seminars in Cancer Biology, vol. 68, 132–142 (Elsevier, 2021). [DOI] [PMC free article] [PubMed]
- 2.Martinelli, D. Generative machine learning for de novo drug discovery: A systematic review. Comput. Biol. Med. 105403 (2022). [DOI] [PubMed]
- 3.Ekins S, et al. Exploiting machine learning for end-to-end drug discovery and development. Nat. Mater. 2019;18:435–441. doi: 10.1038/s41563-019-0338-z. [DOI] [PMC free article] [PubMed] [Google Scholar]
- 4.An T, et al. A machine learning-based approach to ER bioactivity and drug ADMET prediction. Front. Genet. 2022;13:1087273. doi: 10.3389/fgene.2022.1087273. [DOI] [PMC free article] [PubMed] [Google Scholar]
- 5.Periwal V, et al. Bioactivity assessment of natural compounds using machine learning models trained on target similarity between drugs. PLoS Comput. Biol. 2022;18:e1010029. doi: 10.1371/journal.pcbi.1010029. [DOI] [PMC free article] [PubMed] [Google Scholar]
- 6.Lane TR, et al. Bioactivity comparison across multiple machine learning algorithms using over 5000 datasets for drug discovery. Mol. Pharm. 2021;18:403–415. doi: 10.1021/acs.molpharmaceut.0c01013. [DOI] [PMC free article] [PubMed] [Google Scholar]
- 7.Robinson MC, Glen RC, Lee AA. Validating the validation: Reanalyzing a large-scale comparison of deep learning and machine learning models for bioactivity prediction. J. Comput. Aided Mol. Des. 2020;34:717–730. doi: 10.1007/s10822-019-00274-0. [DOI] [PMC free article] [PubMed] [Google Scholar]
- 8.Miljković F, et al. Machine learning models for human in vivo pharmacokinetic parameters with in-house validation. Mol. Pharm. 2021;18:4520–4530. doi: 10.1021/acs.molpharmaceut.1c00718. [DOI] [PubMed] [Google Scholar]
- 9.Destere A, et al. A hybrid model associating population pharmacokinetics with machine learning: A case study with iohexol clearance estimation. Clin. Pharmacokinet. 2022;61:1157–1165. doi: 10.1007/s40262-022-01138-x. [DOI] [PubMed] [Google Scholar]
- 10.Danishuddin N, Kumar V, Faheem M, Woo Lee K. A decade of machine learning-based predictive models for human pharmacokinetics: Advances and challenges. Drug Discov. Today. 2022;27:529–537. doi: 10.1016/j.drudis.2021.09.013. [DOI] [PubMed] [Google Scholar]
- 11.Ota R, Yamashita F. Application of machine learning techniques to the analysis and prediction of drug pharmacokinetics. J. Control. Release. 2022;352:961–969. doi: 10.1016/j.jconrel.2022.11.014. [DOI] [PubMed] [Google Scholar]
- 12.Shaik, A. N., Khan, A. A. & ADMET & DMPK. Physiologically based pharmacokinetic (PBPK) modeling and simulation in drug discovery and development. Admet & Dmpk. 7, 1–3. 10.5599/admet.667 (2019). [DOI] [PMC free article] [PubMed]
- 13.Zhuang X, Lu C. PBPK modeling and simulation in drug research and development. Acta Pharm. Sin. B. 2016;6:430–440. doi: 10.1016/j.apsb.2016.04.004. [DOI] [PMC free article] [PubMed] [Google Scholar]
- 14.Wang K, et al. Physiologically based pharmacokinetic models are effective support for pediatric drug development. AAPS PharmSciTech. 2021;22:208. doi: 10.1208/s12249-021-02076-w. [DOI] [PMC free article] [PubMed] [Google Scholar]
- 15.Anand O, Pepin XJH, Kolhatkar V, Seo P. The Use of Physiologically Based Pharmacokinetic Analyses-in Biopharmaceutics Applications -Regulatory and Industry Perspectives. Pharm. Res. 2022;39:1681–1700. doi: 10.1007/s11095-022-03280-4. [DOI] [PubMed] [Google Scholar]
- 16.Manolis E, et al. Using mechanistic models to support development of complex generic drug products: European Medicines Agency perspective. CPT Pharm. Syst. Pharmacol. 2023 doi: 10.1002/psp4.12906. [DOI] [PMC free article] [PubMed] [Google Scholar]
- 17.Glassman PM, Balthasar JP. Physiologically-based modeling of monoclonal antibody pharmacokinetics in drug discovery and development. Drug Metab. Pharmacokinet. 2019;34:3–13. doi: 10.1016/j.dmpk.2018.11.002. [DOI] [PMC free article] [PubMed] [Google Scholar]
- 18.Li M, Zou P, Tyner K, Lee S. Physiologically based pharmacokinetic (PBPK) modeling of pharmaceutical nanoparticles. AAPS J. 2017;19:26–42. doi: 10.1208/s12248-016-0010-3. [DOI] [PubMed] [Google Scholar]
- 19.Agoram B, Woltosz WS, Bolger MB. Predicting the impact of physiological and biochemical processes on oral drug bioavailability. Adv. Drug Deliv. Rev. 2001;50:S41–S67. doi: 10.1016/S0169-409X(01)00179-X. [DOI] [PubMed] [Google Scholar]
- 20.Bois, F. Y. PopKAT Default Pharmacokinetic Models Structures and Parameters. Tech. Rep. FDA: 1U01FD005838-01), INERIS, Verneuil en Halatte, France (2020).
- 21.Hsieh N-H, et al. A Bayesian population physiologically based pharmacokinetic absorption modeling approach to support generic drug development: Application to Bupropion hydrochloride oral dosage forms. J. Pharmacokinet. Pharmacodyn. 2021;48:893–908. doi: 10.1007/s10928-021-09778-5. [DOI] [PMC free article] [PubMed] [Google Scholar]
- 22.Bois, F. Y. & Maszle, D. R. Gnumcsim: A monte carlo simulation program. J. Stat. Softw. (1997).
- 23.Ping D. The Machine Learning Solutions Architect Handbook: Create Machine Learning Platforms to Run Solutions in an Enterprise Setting. Packt Publishing; 2022. [Google Scholar]
- 24.Amidon GL, Lennernäs H, Shah VP, Crison JR. A theoretical basis for a biopharmaceutic drug classification: The correlation of in vitro drug product dissolution and in vivo bioavailability. Pharm. Res. 1995;12:413–420. doi: 10.1023/A:1016212804288. [DOI] [PubMed] [Google Scholar]
- 25.Manallack DT. The p k a distribution of drugs: Application to drug discovery. Perspect. Med. Chem. 2007;1:1177391X0700100003. [PMC free article] [PubMed] [Google Scholar]
- 26.Williams HD, et al. Strategies to address low drug solubility in discovery and development. Pharmacol. Rev. 2013;65:315–499. doi: 10.1124/pr.112.005660. [DOI] [PubMed] [Google Scholar]
- 27.Dahlgren D, et al. Regional intestinal permeability of three model drugs in human. Mol. Pharm. 2016;13:3013–3021. doi: 10.1021/acs.molpharmaceut.6b00514. [DOI] [PubMed] [Google Scholar]
- 28.Reith D, et al. Simultaneous modelling of the Michaelis–Menten kinetics of paracetamol sulphation and glucuronidation. Clin. Exp. Pharmacol. Physiol. 2009;36:35–42. doi: 10.1111/j.1440-1681.2008.05029.x. [DOI] [PubMed] [Google Scholar]
- 29.Claassen K, Willmann S, Eissing T, Preusser T, Block M. A detailed physiologically based model to simulate the pharmacokinetics and hormonal pharmacodynamics of enalapril on the circulating endocrine renin-angiotensin-aldosterone system. Front. Physiol. 2013;4:4. doi: 10.3389/fphys.2013.00004. [DOI] [PMC free article] [PubMed] [Google Scholar]
- 30.Isbister GK, et al. Zero-order metoprolol pharmacokinetics after therapeutic doses: Severe toxicity and cardiogenic shock. Clin. Toxicol. 2016;54:881–885. doi: 10.1080/15563650.2016.1209768. [DOI] [PubMed] [Google Scholar]
- 31.Abebe BT, et al. Pharmacokinetic drug-drug interactions between trospium chloride and ranitidine substrates of organic cation transporters in healthy human subjects. J. Clin. Pharmacol. 2020;60:312–323. doi: 10.1002/jcph.1523. [DOI] [PubMed] [Google Scholar]
- 32.Gaulton A, et al. ChEMBL: A large-scale bioactivity database for drug discovery. Nucleic Acids Res. 2012;40:D1100–1107. doi: 10.1093/nar/gkr777. [DOI] [PMC free article] [PubMed] [Google Scholar]
- 33.Kim S, et al. PubChem 2023 update. Nucleic Acids Res. 2023;51:D1373–D1380. doi: 10.1093/nar/gkac956. [DOI] [PMC free article] [PubMed] [Google Scholar]
- 34.Zur M, Hanson AS, Dahan A. The complexity of intestinal permeability: Assigning the correct BCS classification through careful data interpretation. Eur. J. Pharm. Sci. 2014;61:11–17. doi: 10.1016/j.ejps.2013.11.007. [DOI] [PubMed] [Google Scholar]
- 35.Bergström CAS, Andersson SBE, Fagerberg JH, Ragnarsson G, Lindahl A. Is the full potential of the biopharmaceutics classification system reached? Eur. J. Pharm. Sci. 2014;57:224–231. doi: 10.1016/j.ejps.2013.09.010. [DOI] [PubMed] [Google Scholar]
- 36.Bransford P, et al. Ich m9 guideline in development on biopharmaceutics classification system-based biowaivers: An industrial perspective from the iq consortium. Mol. Pharm. 2019;17:361–372. doi: 10.1021/acs.molpharmaceut.9b01062. [DOI] [PubMed] [Google Scholar]
- 37.Ho, T. K. Random decision forests. In Proceedings of 3rd International Conference on Document Analysis and Recognition, vol. 1, 278–282 (IEEE, 1995).
- 38.Friedman, J. H. Greedy function approximation: A gradient boosting machine. Ann. Stat. 1189–1232 (2001).
- 39.Ke, G. et al. Lightgbm: A highly efficient gradient boosting decision tree. Adv. Neural Inf. Process. Syst.30 (2017).
- 40.Nembrini S, König IR, Wright MN. The revival of the gini importance? Bioinformatics. 2018;34:3711–3718. doi: 10.1093/bioinformatics/bty373. [DOI] [PMC free article] [PubMed] [Google Scholar]
- 41.Kalantzi L, et al. Biowaiver monographs for immediate release solid oral dosage forms: Acetaminophen (paracetamol) J. Pharm. Sci. 2006;95:4–14. doi: 10.1002/jps.20477. [DOI] [PubMed] [Google Scholar]
- 42.Papich MG, Martinez MN. Applying biopharmaceutical classification system (BCS) criteria to predict oral absorption of drugs in dogs: Challenges and pitfalls. AAPS J. 2015;17:948–964. doi: 10.1208/s12248-015-9743-7. [DOI] [PMC free article] [PubMed] [Google Scholar]
- 43.Critchley J, Critchley L, Anderson P, Tomlinson B. Differences in the single-oral-dose pharmacokinetics and urinary excretion of paracetamol and its conjugates between Hong Kong Chinese and Caucasian subjects. J. Clin. Pharm. Ther. 2005;30:179–184. doi: 10.1111/j.1365-2710.2004.00626.x. [DOI] [PubMed] [Google Scholar]
- 44.Zur M, Hanson AS, Dahan A. The complexity of intestinal permeability: Assigning the correct BCS classification through careful data interpretation. Eur. J. Pharm. Sci. 2014;61:11–17. doi: 10.1016/j.ejps.2013.11.007. [DOI] [PubMed] [Google Scholar]
- 45.Kim I, et al. Plasma and oral fluid pharmacokinetics and pharmacodynamics after oral codeine administration. Clin. Chem. 2002;48:1486–1496. doi: 10.1093/clinchem/48.9.1486. [DOI] [PubMed] [Google Scholar]
- 46.Friedman H, et al. Pharmacokinetics and pharmacodynamics of oral diazepam: Effect of dose, plasma concentration, and time. Clin. Pharmacol. Ther. 1992;52:139–150. doi: 10.1038/clpt.1992.123. [DOI] [PubMed] [Google Scholar]
- 47.Verbeeck RK, et al. Biowaiver monographs for immediate-release solid oral dosage forms: Enalapril. J. Pharm. Sci. 2017;106:1933–1943. doi: 10.1016/j.xphs.2017.04.019. [DOI] [PubMed] [Google Scholar]
- 48.Arafat T, et al. Pharmacokinetics and pharmacodynamics profiles of enalapril maleate in healthy volunteers following determination of enalapril and enalaprilat by two specific enzyme immunoassays. J. Clin. Pharm. Ther. 2005;30:319–328. doi: 10.1111/j.1365-2710.2005.00646.x. [DOI] [PubMed] [Google Scholar]
- 49.Sandhala D, Lankalapalli S. New method for the in vivo estimation of fluvastatin and its application for pharmacokinetic studies in rabbit. Indian J. Pharm. Educ. Res. 2020;54:1153–1158. doi: 10.5530/ijper.54.4.211. [DOI] [Google Scholar]
- 50.Smith H, Jokubaitis L, Troendle A, Hwang D, Robinson W. Pharmacokinetics of fluvastatin and specific drug interactions. Am. J. Hypertens. 1993;6:375S–382S. doi: 10.1093/ajh/6.11.375S. [DOI] [PubMed] [Google Scholar]
- 51.Yang Y, et al. Biopharmaceutics classification of selected -blockers: Solubility and permeability class membership. Mol. Pharm. 2007;4:608–614. doi: 10.1021/mp070028i. [DOI] [PubMed] [Google Scholar]
- 52.Stout SM, et al. Influence of metoprolol dosage release formulation on the pharmacokinetic drug interaction with paroxetine. J. Clin. Pharmacol. 2011;51:389–396. doi: 10.1177/0091270010365559. [DOI] [PMC free article] [PubMed] [Google Scholar]
- 53.Guittet C, Manso M, Burton I, Granier L-A, Marçon F. A two-way randomized cross-over pharmacokinetic and pharmacodynamic study of an innovative oral solution of midazolam (adv6209) Pharm. Res. 2017;34:1840–1848. doi: 10.1007/s11095-017-2193-4. [DOI] [PubMed] [Google Scholar]
- 54.Link B, et al. Pharmacokinetics of intravenous and oral midazolam in plasma and saliva in humans: Usefulness of saliva as matrix for cyp3a phenotyping. Br. J. Clin. Pharmacol. 2008;66:473–484. doi: 10.1111/j.1365-2125.2008.03201.x. [DOI] [PMC free article] [PubMed] [Google Scholar]
- 55.Van Hecken A, Tjandramaga T, Mullie A, Verbesselt R, De Schepper P. Ranitidine: Single dose pharmacokinetics and absolute bioavailability in man. Br. J. Clin. Pharmacol. 1982;14:195–200. doi: 10.1111/j.1365-2125.1982.tb01961.x. [DOI] [PMC free article] [PubMed] [Google Scholar]
- 56.Danielak D, et al. Physiologically based dissolution testing in a drug development process—A case study of a successful application in a bioequivalence study of trazodone er formulations under fed conditions. AAPS PharmSciTech. 2020;21:1–11. doi: 10.1208/s12249-020-01662-8. [DOI] [PMC free article] [PubMed] [Google Scholar]
- 57.Kale P, Agrawal YK. Pharmacokinetics of single oral dose trazodone: A randomized, two-period, cross-over trial in healthy, adult, human volunteers under fed condition. Front. Pharmacol. 2015;6:224. doi: 10.3389/fphar.2015.00224. [DOI] [PMC free article] [PubMed] [Google Scholar]
- 58.Metry M, Polli JE. Evaluation of excipient risk in BCS class i and iii biowaivers. AAPS J. 2022;24:20. doi: 10.1208/s12248-021-00670-1. [DOI] [PMC free article] [PubMed] [Google Scholar]
- 59.Lin H, Tian Y, Tian J-X, Zhang Z-J, Mao G-G. Pharmacokinetics and bioequivalence study of valacyclovir hydrochloride capsules after single dose administration in healthy Chinese male volunteers. Arzneimittelforschung. 2010;60:162–167. doi: 10.1055/s-0031-1296266. [DOI] [PubMed] [Google Scholar]
- 60.van Rossum, G. (Guido). Python reference manual (1995). Issue: R 9525 Publication Title: Department of Computer Science [CS].
- 61.Pedregosa F, et al. Scikit-learn: Machine learning in python. J. Mach. Learn. Res. 2011;12:2825–2830. [Google Scholar]
- 62.Gobeau N, Stringer R, De Buck S, Tuntland T, Faller B. Evaluation of the gastroplus advanced compartmental and transit (acat) model in early discovery. Pharm. Res. 2016;33:2126–2139. doi: 10.1007/s11095-016-1951-z. [DOI] [PubMed] [Google Scholar]
Associated Data
This section collects any data citations, data availability statements, or supplementary materials included in this article.
Data Availability Statement
The datasets generated and/or analysed during the current study are available in a Zenodo repository, https://doi.org/10.5281/zenodo.7837360.


