

Abstract
This quality improvement study evaluates whether pediatric intensive care units sustained reduced blood culture rates after participation in the Bright STAR collaborative from 2017 to 2020.
Sustaining improvement in clinical practice is an essential but challenging aspect of quality improvement (QI). Many QI programs with initially promising results fail to sustain those outcomes long term.1,2 A growing body of literature is focused on understanding determinants of sustainability as an element of QI research.3
From 2017 to 2020, 14 pediatric intensive care units (PICUs) participated in the Bright STAR (Testing Stewardship for Antibiotic Reduction) QI collaborative to reduce unnecessary blood cultures for PICU patients.4 Sites demonstrated a 33% reduction in blood culture rates and a 13% reduction in broad-spectrum antibiotic use. Our objective was to evaluate whether sites sustained reduced blood culture rates after completion of the formal project.
Methods
This quality improvement study was conducted from 2017 to 2020. During Bright STAR participation, PICU sites implemented strategies to influence blood culture practices, and the coordinating center team held coaching calls with individual sites and the larger collaborative.4 At the end of the postimplementation period, each site created a sustainability plan informed by the Clinical Sustainability Assessment Tool (CSAT), which includes 7 domains (eTables 1-3 in Supplement 1).5,6 This study was approved by the Johns Hopkins University and individual sites’ institutional review boards, and no consent was required because it was a quality improvement and unit-level intervention, so no individual patients were ever enrolled.4 Data are reported according to the SQUIRE reporting guideline.
Monthly blood culture rates per 1000 patient-days were collected before and after implementation (for 24 and 18 months, respectively) as well as for a subsequent 24 months (the sustainability period). A random intercept Poisson model for the monthly number of blood cultures, with the number of patient-days as an offset and robust variance estimate, was used to estimate the relative change comparing the sustainability with the preimplementation and postimplementation periods. We performed planned sensitivity analyses to account for (1) seasonal variation (categorical variable for the 4 seasons) and (2) the COVID-19 pandemic. Interrupted time series analysis was used to estimate (1) relative change in blood culture rates during each study period and (2) the relative change in blood culture rate at the start and end of the project. Analysis was completed using Stata, version 17 (StataCorp LP) and R, version 4.2.2 (R Group for Statistical Computing).4
Results
All sites had lower blood culture rates during the sustainability period compared with the preimplementation period (Figure, A). The estimated mean (95% CI) monthly blood culture rates per 1000 patient-days for the preimplementation, postimplementation, and sustainability periods were 148.3 (118.3-185.9), 100.2 (77.6-129.4), and 108.0 (83.7-139.4), respectively. The blood culture rate increased 8% (95% CI, 1%-15%) during the sustainability period compared with the postimplementation period but was 27% (95% CI, 18%-35%) lower than during the preimplementation period (Table).1 Sensitivity analysis yielded similar results. Interrupted time series analysis demonstrated an immediate increase in the blood culture rate during the sustainability period, followed by an estimated monthly decrease (Figure).
Figure. Blood Culture Rates During the Preimplementation, Postimplementation, and Sustainability Periods.
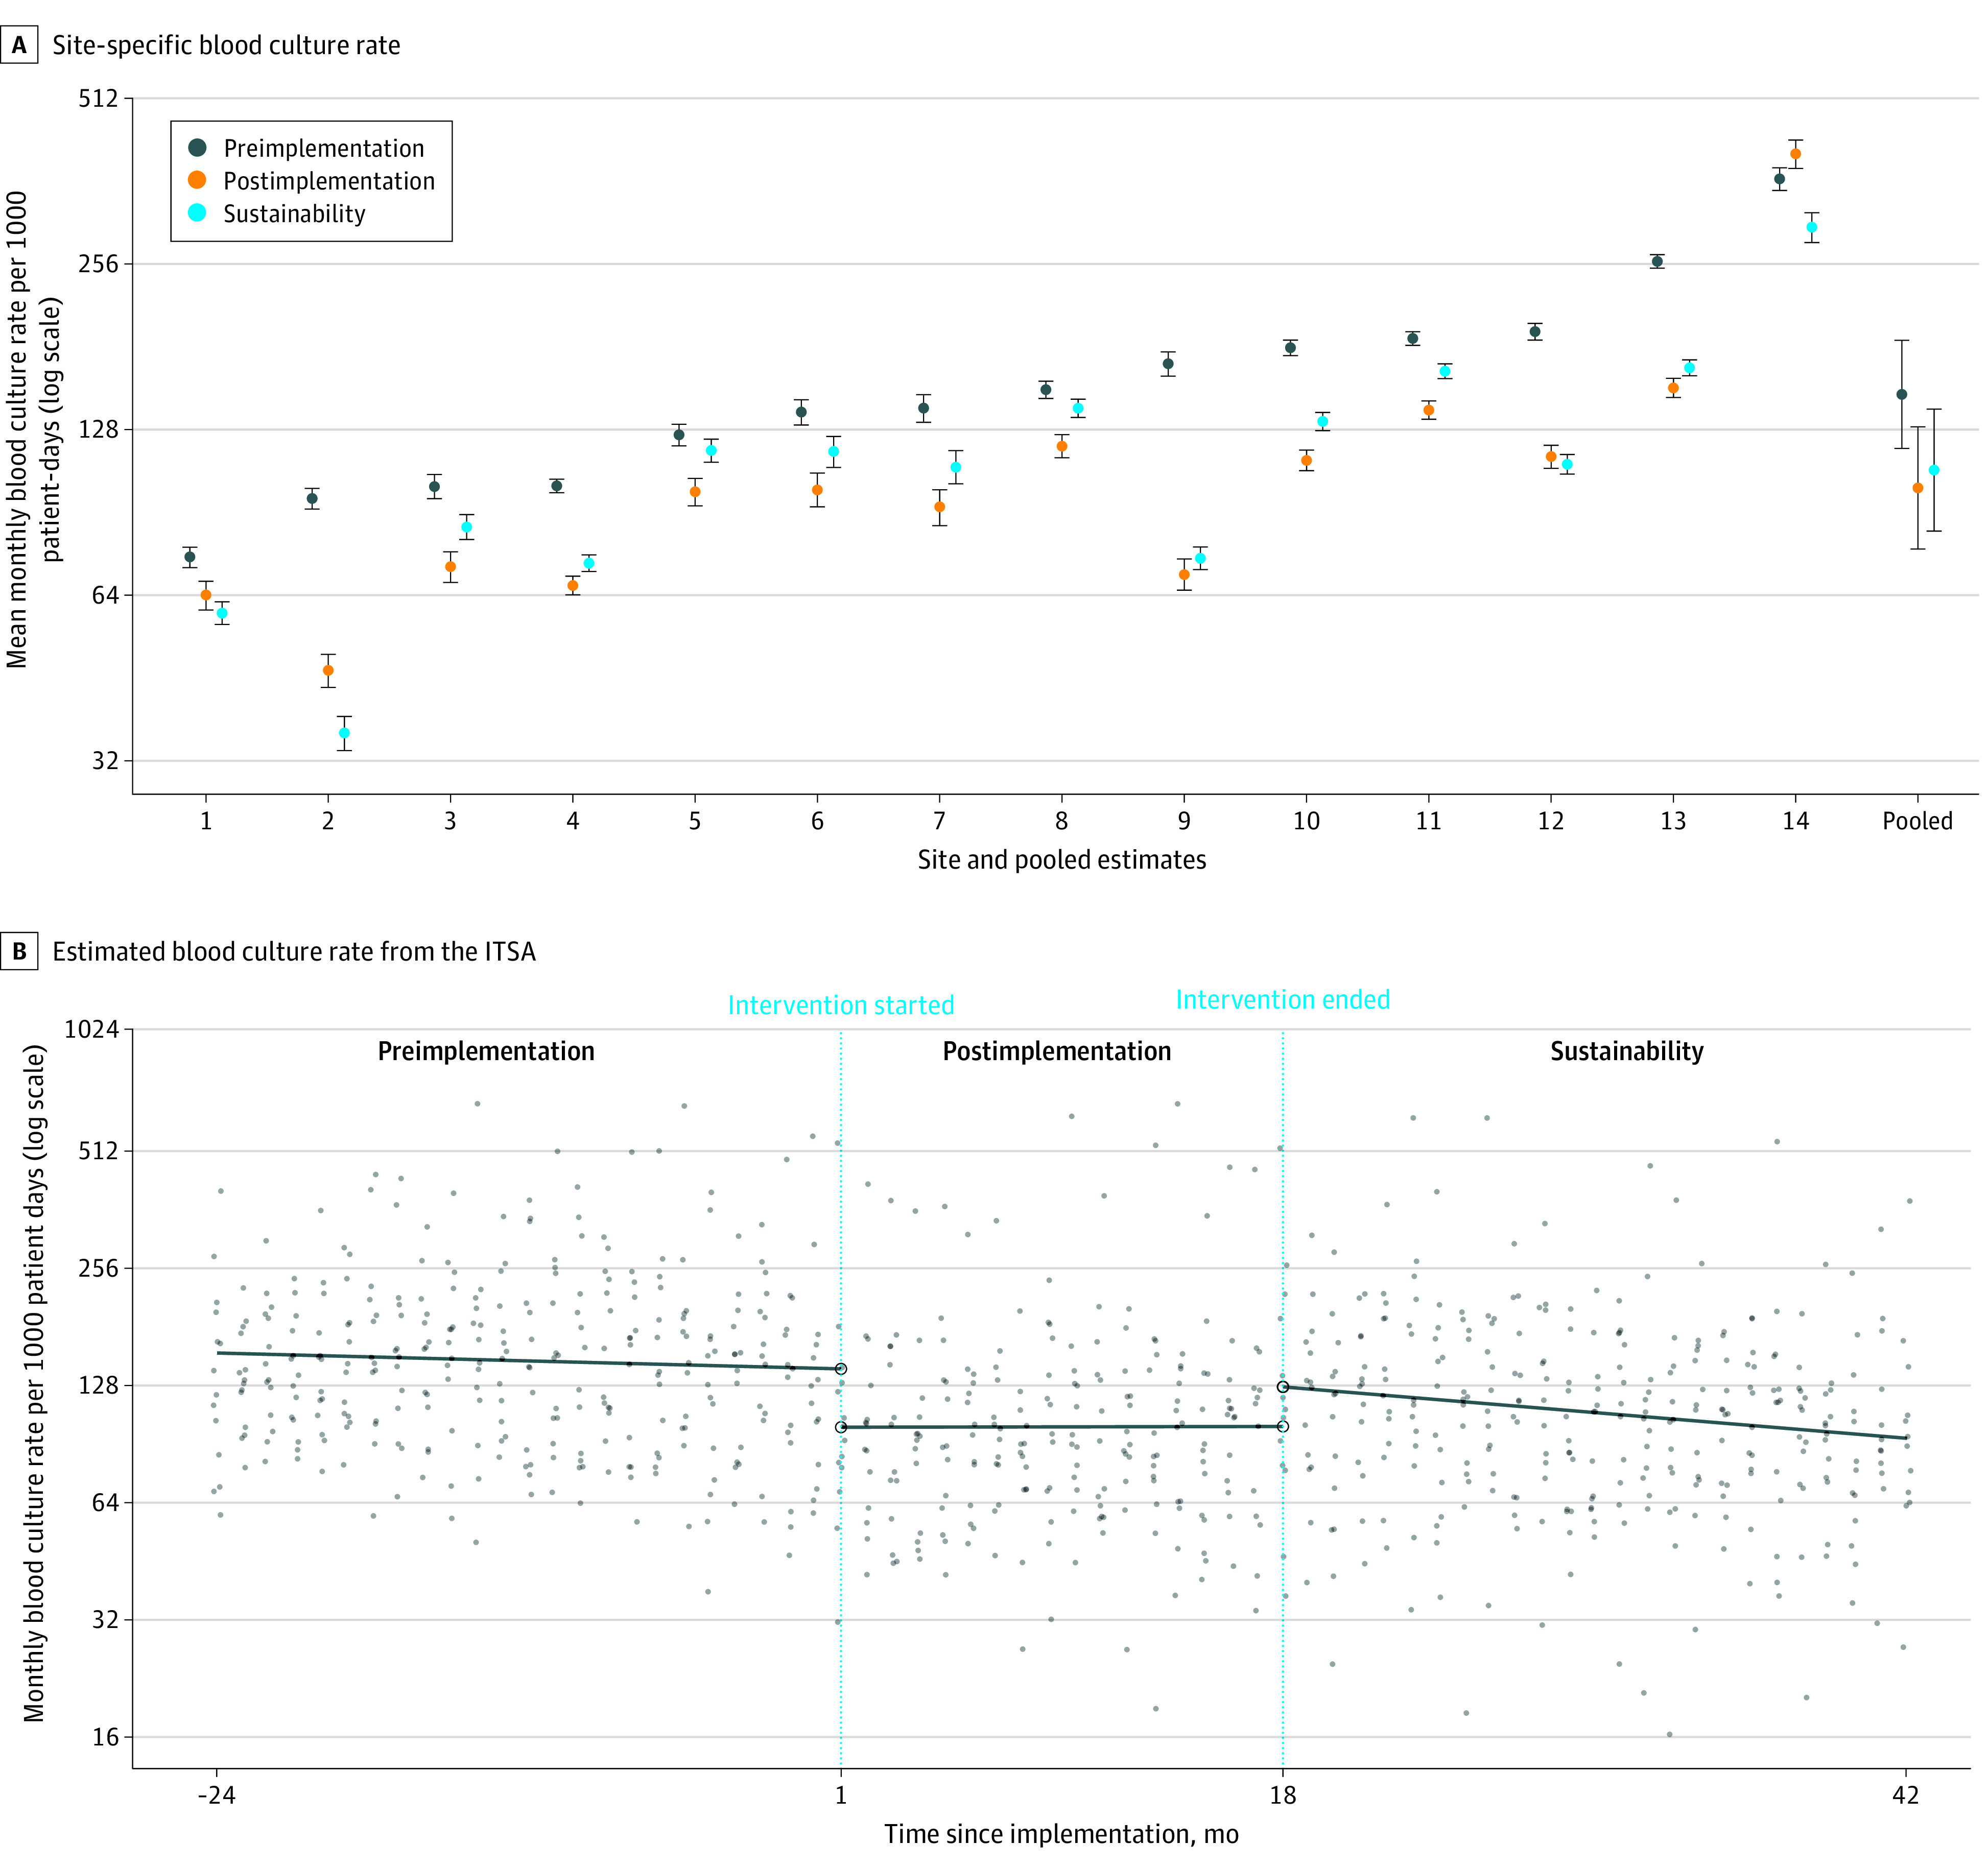
A, Site-specific mean monthly blood culture rate per 1000 patient-days for the preimplementation, postimplementation, and sustainability periods with pooled estimates from the random intercept Poisson model. Error bars indicate 95% CIs. B, Estimated mean blood culture rate per 1000 patient-days for each study month from the interrupted time series analysis (ITSA). Site-specific monthly blood culture rates per 1000 patient-days are displayed as points. Values are displayed on the log scale.
Table. Relative Monthly Blood Culture Rate and Absolute Difference in Monthly Blood Culture Rates Comparing the Sustainability Period With the Postimplementation and Preimplementation Periods.
| Analysis | Relative monthly blood culture rate (95% CI) | Absolute difference in monthly blood culture rate (95% CI) | ||
|---|---|---|---|---|
| Sustainability vs postimplementation periods | Sustainability vs preimplementation periods | Sustainability vs postimplementation periods | Sustainability vs preimplementation periods | |
| Primary analysisa | 1.08 (1.01 to 1.15) | 0.73 (0.65 to 0.82) | 7.77 (1.11 to 14.42) | −40.27 (−55.55 to −24.99) |
| Sensitivity analysis for seasonalityb | 1.07 (1.01 to 1.13) | 0.73 (0.65 to 0.81) | 6.78 (0.36 to 13.21) | −39.88 (−53.82 to −25.94) |
| Sensitivity analysis for COVID-19c | 1.08 (1.01 to 1.15) | 0.72 (0.65 to 0.81) | 7.50 (0.43 to 14.57) | −41.29 (−56.38 to −26.21) |
Results were derived from a generalized linear mixed model assuming the Poisson distribution for the log monthly number of blood cultures as a function of an intercept plus a main term for study period (preimplementation, postimplementation, or sustainability), with the monthly number of patient-days as an offset. The model included a random intercept for pediatric intensive care unit with SEs derived from a robust variance estimate. The mean monthly blood culture rates during each period, relative rates, and absolute rate differences were derived from linear or nonlinear combinations of the estimated intercept and coefficients from the model. The estimated monthly mean blood culture rates (95% CI) for the preimplementation, postimplementation, and sustainability periods were 148.3 (118.3-185.9), 100.2 (77.6-129.4), and 108.0 (83.7-139.4), respectively.
To adjust for seasonal variation, the model described by Burke and Marang-van de Mheen1 was extended to include indicators for the 4 seasons. The estimated monthly mean blood culture rates (95% CI) for the preimplementation, postimplementation, and sustainability period were 145.7 (116.4-182.5), 99.1 (75.9-129.3), and 105.9 (81.0-138.3), respectively.
Data from March 2020 through June 2020 were excluded from the model described by Burke and Marang-van de Mheen1 to assess the association of COVID-19 with our estimates. The estimated monthly mean blood culture rates (95% CI) for preimplementation, postimplementation, and sustainability period were 148.5 (118.5-186.1), 99.7 (77.0-129.0), and 107.2 (83.1-138.1), respectively.
Discussion
To our knowledge, no work has examined sustainability of blood culture diagnostic stewardship in the PICU, and little is known about how to maintain practice improvements for diagnostic decisions for blood cultures. We incorporated a tool, the CSAT, to help sites organize strategies for sustaining practice change. Blood culture rates did increase slightly after Bright STAR, possibly associated with practice or case mix changes at the start of COVID-19, but rates remained significantly lower than their preimplementation baseline over the subsequent 24 months. Limitations included lack of knowledge of how well sites adhered to their sustainability plans during the sustainability period.
Diagnostic stewardship programs can facilitate significant and sustained decreases in blood culture rates. Further work is needed to determine optimal strategies for implementing and sustaining such decreases in additional centers.
eTable 1. Comparison of Program Level Activities in the Post-implementation vs Sustainability Period
eTable 2. Example Site CSAT Tool (Site Identifying Information Removed)
eTable 3. CSAT Tool Domains Addressed in Site Plans, Summarized by Site; and Examples of How Different Sites Proposed to Practically Accomplish That Task in the Sustainability Period
Data Sharing Statement
References
- 1.Burke RE, Marang-van de Mheen PJ. Sustaining quality improvement efforts: emerging principles and practice. BMJ Qual Saf. 2021;30(11):848-852. doi: 10.1136/bmjqs-2021-013016 [DOI] [PubMed] [Google Scholar]
- 2.Glasgow JM, Davies ML, Kaboli PJ. Findings from a national improvement collaborative: are improvements sustained? BMJ Qual Saf. 2012;21(8):663-669. doi: 10.1136/bmjqs-2011-000243 [DOI] [PubMed] [Google Scholar]
- 3.Wiltsey Stirman S, Kimberly J, Cook N, Calloway A, Castro F, Charns M. The sustainability of new programs and innovations: a review of the empirical literature and recommendations for future research. Implement Sci. 2012;7:17. doi: 10.1186/1748-5908-7-17 [DOI] [PMC free article] [PubMed] [Google Scholar]
- 4.Woods-Hill CZ, Colantuoni EA, Koontz DW, et al. ; Bright STAR Authorship Group . Association of Diagnostic Stewardship for Blood Cultures in Critically Ill Children With Culture Rates, Antibiotic Use, and Patient Outcomes: Results of the Bright STAR Collaborative. JAMA Pediatr. 2022;176(7):690-698. doi: 10.1001/jamapediatrics.2022.1024 [DOI] [PMC free article] [PubMed] [Google Scholar]
- 5.Malone S, Prewitt K, Hackett R, et al. The Clinical Sustainability Assessment Tool: measuring organizational capacity to promote sustainability in healthcare. Implement Sci Commun. 2021;2(1):77. doi: 10.1186/s43058-021-00181-2 [DOI] [PMC free article] [PubMed] [Google Scholar]
- 6.Nilsen P, Bernhardsson S. Context matters in implementation science: a scoping review of determinant frameworks that describe contextual determinants for implementation outcomes. BMC Health Serv Res. 2019;19(1):189. doi: 10.1186/s12913-019-4015-3 [DOI] [PMC free article] [PubMed] [Google Scholar]
Associated Data
This section collects any data citations, data availability statements, or supplementary materials included in this article.
Supplementary Materials
eTable 1. Comparison of Program Level Activities in the Post-implementation vs Sustainability Period
eTable 2. Example Site CSAT Tool (Site Identifying Information Removed)
eTable 3. CSAT Tool Domains Addressed in Site Plans, Summarized by Site; and Examples of How Different Sites Proposed to Practically Accomplish That Task in the Sustainability Period
Data Sharing Statement