

Abstract

The A3 adenosine receptor (A3AR) is implicated in a variety of (patho)physiological conditions. While most research has focused on agonists and antagonists, inverse agonism at A3AR has been scarcely studied. Therefore, this study aimed at exploring inverse agonism, using two previously engineered cell lines (hA3ARLgBiT-SmBiTβarr2 and hA3ARLgBiT-SmBiTminiGαi), both employing the NanoBiT technology. The previously established inverse agonist PSB-10 showed a decrease in basal signal in the β-arrestin 2 (βarr2) but not the miniGαi recruitment assay, indicative of inverse agonism in the former assay. Control experiments confirmed the specificity and reversibility of this observation. Evaluation of a set of presumed neutral antagonists (MRS7907, MRS7799, XAC, and MRS1220) revealed that all displayed concentration-dependent signal decreases when tested in the A3AR-βarr2 recruitment assay, yielding EC50 and Emax values for inverse agonism. Conversely, in the miniGαi recruitment assay, no signal decreases were observed. To assess whether this observation was caused by the inability of the ligands to induce inverse agonism in the G protein pathway, or rather by a limitation inherent to the employed A3AR-miniGαi recruitment assay, a GloSensor cAMP assay was performed. The outcome of the latter also suggests inverse agonism by the presumed neutral antagonists in this latter assay. These findings emphasize the importance of prior characterization of ligands in the relevant test system. Moreover, it showed the suitability of the NanoBiT βarr2 recruitment and the GloSensor cAMP assays to capture inverse agonism at the A3AR, as opposed to the NanoBiT miniGαi recruitment assay.
Keywords: adenosine receptor, GPCR, nucleosides, second messengers, inverse agonism, antagonism
1. Introduction
The A3 adenosine receptor (A3AR) is one of the four adenosine receptors (alongside A1, A2A, and A2B), which are all G protein-coupled receptors (GPCRs). More specifically, activation of the A3AR mainly results in coupling to Gi, which subsequently causes inhibition of adenylate cyclase, thereby reducing cAMP (cyclic AMP) accumulation. Additionally, other signaling cascades can be modulated by A3AR activation, e.g., the recruitment of the cytosolic scaffolding protein β-arrestin (βarr).1−3 This potential of inducing intracellular effects permits the A3AR to play a role in a variety of (patho)physiological processes, rendering it a promising therapeutic target for inflammatory diseases, such as rheumatoid arthritis and psoriasis, in neuropathic pain, as well as in liver cancer. The selective A3AR agonists IB-MECA and Cl-IB-MECA, both ribonucleosides, have reached advanced clinical trials for autoimmune inflammatory diseases and liver diseases.1,4 A mixed A1AR/A3AR agonist has entered a Phase I trial for stroke.5,6 Conversely, several A3AR antagonists are in clinical trials for treating glaucoma, psoriasis, and ulcerative colitis.7 The use of A3AR antagonists for glaucoma was first suggested by Civan and co-workers,8 and the nucleoside derivative FM101 that was first reported by Jeong et al.9 has advanced to clinical trials for that indication.10
The potential therapeutic value of targeting the A3AR has resulted in a broad panel of ligands being synthesized. This extensive exploratory effort has mainly focused on the investigation of structural determinants inducing (partial) agonism, in which the receptor is activated to a certain extent, and antagonism, in which a ligand binds the receptor without inducing its activation.1,11−14 Furthermore, ligand structure–activity relationships (SAR) have been combined with advanced GPCR homology modeling efforts, aiming at an improved mechanistic understanding of the processes involved in receptor binding and activation.15 On the other hand, inverse agonism, defined as a situation in which a ligand reduces the (constitutive) receptor activity, thereby inducing the inverse effect of an agonist, has only been seldom described at the A3AR.13,14,16,17 So far, the non-nucleoside ligands PSB-10 and PSB-11, both imidazopurinones, have been described to induce a reduction in basal [35S]GTPγS binding at the A3AR, corresponding to inverse agonist behavior.18,19 Furthermore, MRS1220 has been reported to induce accumulation of cAMP, suggesting it may behave as an inverse agonist in a cAMP accumulation assay.20 Even though it has been hypothesized that “neutral” antagonism is a rarely encountered phenomenon in GPCR ligands, with inverse agonists occurring more commonly, this latter feature can only be defined when the ligand is tested in an appropriate system. A systematic exploration of in vitro systems capable of capturing inverse agonism as decreases in constitutive activity is lacking for many GPCRs, among which is the A3AR.14
In previous research, we have developed and applied two complementary, highly similar assay formats to functionally characterize A3AR ligands. These assays monitor either the recruitment of βarr2 or an engineered miniGαi protein to the activated receptor, by means of a luminescent readout of the functional complementation of two parts of a split nanoluciferase.2,21−24 However, so far, the application of these formats has been focused on the identification and characterization of A3AR agonists.21,22 Following the serendipitous finding of signals in the presence of various A3AR ligands that were markedly lower than those of the solvent control, we therefore aimed to determine whether the developed formats are able to identify inverse agonists at the A3AR, which appeared to be the case for the βarr2, but not for the miniGαi recruitment assay. In light of the scarce description of inverse agonism at the A3AR, despite the hypothesized relevance of GPCR inverse agonists over “neutral antagonists,”14 we further aimed to characterize a small set of “antagonists” frequently used in A3AR pharmacological research. Moreover, as none of the ligands was able to induce a concentration-dependent decrease in signal in the miniGαi recruitment assay, a GloSensor cAMP assay was additionally applied to estimate a signaling event further downstream in the canonical G protein signaling cascade.
2. Results and Discussion
2.1. PSB-10 Displays Inverse Agonism in the β-Arrestin 2 Recruitment Assay
To test the in vitro A3AR activation by ligands, we previously developed two assays that monitor the recruitment of either βarr2 or miniGαi to the receptor.21,22 These two highly analogous assays employ the same receptor construct (hA3AR-LgBiT) in the NanoBiT (Nanoluciferase Binary Technology) system. This technology has been specifically developed to monitor protein–protein interactions in live cells. In particular, a nanoluciferase enzyme has been split into two nonfunctional parts (LgBiT and SmBiT), which are each fused to one of the potentially interacting proteins (in our case, LgBiT is fused to the receptor’s C-terminus, and SmBiT to the N-terminus of either βarr2 or miniGαi). Upon protein interaction (i.e., recruitment of the cytosolic protein to the receptor), functional complementation of the enzyme is achieved, which can be monitored by means of the generation of luminescence product in the presence of the enzyme’s substrate furimazine.23
To verify whether the developed assays are able to capture the divergent behavior of inverse agonists, the previously described potent and selective inverse agonist PSB-10 was tested in both formats.18 Inverse agonism is described as a situation in which a ligand reduces the constitutive activity of the receptor, hence inducing an effect inverse to that of an agonist.13,14,17 This implies that, to be able to measure inverse agonism in a given experimental system, that system needs to display a certain degree of constitutive activity.17 When testing a concentration range (10–11 M to 10–5 M) of PSB-10, a concentration-dependent decrease in luminescent signal was obtained in the βarr2 recruitment assay, as shown in Figure 1A–B. Plotting the blank-subtracted AUC (area under the curve) values additionally showed a clear sigmoidal (log) concentration–response curve (Figure 1C). Conversely, in the miniGαi recruitment assay, no defined concentration-dependent effect could be observed (Figure 1D–E), with only a clear decrease in signal when measuring 10 μM PSB-10. Plotting the concentration–response curve (Figure 1F) confirmed this observation, with blank-subtracted AUC values only slightly differing from 0.
Figure 1.

Time–luminescence profiles of PSB-10 in the βarr2 (A, B) and miniGαi (D, E) recruitment assay. Panels (A) and (D) additionally show the time–luminescence profile of 10 μM reference agonist NECA, whereas panels (B) and (E) zoom in on the (lack of) concentration-dependent response of PSB-10. (C, F) Derived blank-subtracted AUC values, in the βarr2 and miniGαi assay, respectively. Data are from one representative experiment, in which each condition was measured in duplicate. Note the differences in y-axis scales.
Because the (upward) agonist signal for NECA, used as a reference agonist in the βarr2 recruitment assay, was in absolute terms much higher than a potential downward signal of an inverse agonist (the signal can only drop from “baseline” (constitutive signal observed in nonstimulated cells) to nondetectable), an alternative way of expressing an inverse agonist signal was required. More specifically, when expressed relative to the upward increase of NECA, the downward signal obtained for 10 μM PSB-10 in the βarr2 assay would only be approximately −5%. This clearly hinted at the need to introduce a dedicated reference inverse agonist into each experiment, relative to which the efficacy of other inverse agonists could be expressed. Moreover, this would also allow normalization between different experiments when assessing inverse agonism. For this purpose, the 10 μM condition of PSB-10 was arbitrarily set as −100%, with the solvent control (“blank”) condition serving as 0%.
2.2. Specificity of the Signal Decrease Observed with PSB-10
In case PSB-10 is an inverse agonist in both βarr2 and G protein pathways (the latter suggested by its observed inverse agonism in a [35S]GTPγS assay),18 the above-described effects suggest that inverse agonism at the A3AR can be assessed by means of the βarr2 but not by the miniGαi recruitment assay (importantly, the nondetectability may rather be caused by the characteristics of the assay than by the characteristics of the ligand).17 However, a reduction in signal in an in vitro assay can be the result of other factors as well, which may be nonspecific (non-A3AR-related) in nature. To confirm the specificity of the observed effects, PSB-10 was tested in an in vitro assay that monitors the recruitment of βarr2 to the activated CB1 receptor, also employing a NanoBiT-based assay format, and hence highly similar to the A3AR-βarr2 assay.25,26 The aim of this experiment was to exclude nonspecific effects as the cause of a decreased luminescent signal, e.g., caused by cell toxicity, interference with the luminescent readout, or general inhibition of the interaction between a GPCR and βarr2. In the case of an A3AR-specific reaction, we do not expect a decrease in signal in the highly similar CB1-βarr2 assay in the NanoBiT system. The synthetic cannabinoid receptor agonist JWH-018 was included as a reference agonist to confirm the appropriate functionality of the test system. As can be observed in Figure 2, the reference agonist JWH-018 induced an obvious increase in luminescence (panel A), whereas the time–luminescence profiles of the four tested concentrations of PSB-10 nearly coincided with the curve of the solvent control (panel A, and “zoomed-in” curves with an expanded y-axis in panel B). The lack of a concentration-dependent decrease in signal when utilizing a similar test system to monitor the recruitment of βarr2 to a different GPCR is indicative of the A3AR-specificity of the observed effects and demonstrates that the observed decrease in signal is not owing to, e.g., a reduced cell viability.
Figure 2.

(A, B) Time–luminescence profiles of different concentrations of the presumed inverse agonist PSB-10 in the CB1-βarr2 recruitment assay employing the NanoBiT technology, in which panel (B) is zoomed in from panel (A).
It can be anticipated that inverse agonism can be overcome by co-incubation of the inverse agonist with an agonist. We therefore performed the A3AR-βarr2 recruitment assay by first pre-incubating the cells with 100 nM PSB-10, followed by the addition of a concentration gradient of the reference agonist NECA. As can be derived from the bar chart in Figure 3 (black columns) for βarr2, NECA is able to surmount the inhibitory effect of 100 nM PSB-10 and induce an activation of the assay, in a concentration-dependent manner. Importantly, this demonstrates the “reversibility” of the observed inverse agonism, as the drop in signal can be overcome by adding a sufficiently high concentration of an agonist.
Figure 3.

Bar chart plotting the normalized AUC (area under the curve) of the time–luminescence profiles obtained in the βarr2 (black) or miniGαi (gray) recruitment assay, following preincubation of the cells with 100 nM PSB-10. AUCs more than 10% lower than that of the solvent control are normalized relative to the reference inverse agonist PSB-10, and depicted in empty bars, all others are relative to the maximal response of NECA and depicted in filled bars. Data represent the mean ± SEM (standard error of the mean) of three independent experiments, each performed in duplicate.
Notably, when the same experimental protocol was used to characterize PSB-10 in the A3AR—miniGαi recruitment assay, only antagonistic effects—and no inverse agonism—were observed (gray bars in Figure 3). Antagonism was evident from the response measured in cells pre-incubated with 100 nM PSB-10 before being treated with 10, 1, or 0.1 nM NECA—in all of these conditions, the curves coincided with that of the solvent control. This antagonism could be surmounted in a concentration-dependent manner by NECA.
The observation that the decrease in signal can be reversed with an agonist and is not observed with highly similar systems (CB1-βarr2 and A3AR-miniGαi) using the same technology indicates that the effects observed for PSB-10 in the A3AR-βarr2 recruitment assay are specific to the assay system for the A3AR, and only for the recruitment of βarr2 in the employed format. More specifically, the results allow the exclusion of the hypothesis that the observed effects could stem from potential cell toxicity or (other) nonspecific effects caused by increasing concentrations of PSB-10.17
Interestingly, PSB-10 has previously been reported to show inverse agonism in a GTPγS assay, which also measures G protein activation—as our A3AR-miniGαi assay theoretically does. This suggests that, rather than PSB-10 exhibiting βarr2-biased inverse agonism, the currently used miniGαi recruitment assay is apparently unable to capture inverse agonism, which could be considered a limitation of the assay system, rather than a property of the ligand tested. In line with this, the results in gray in Figure 3 nicely illustrate that an inverse agonist, when tested in a system that is unable to capture inverse agonism, apparently behaves as a “neutral” antagonist.17
2.3. Exploration of Inverse Agonism in Ligands Previously Characterized as Antagonists
Somewhat in contrast to common belief, it is estimated that neutral antagonists are rather rare and ligands mostly behave as (partial) agonists or inverse agonists in GPCR pharmacology.14 Hence, we used the A3AR-βarr2 recruitment assay to explore a set of structurally diverse ligands that have been previously denoted as antagonists, including several non-nucleoside heterocyclic A3AR antagonists (MRS1220, MRS7799, MRS7907, and XAC). The structures of the test compounds are shown in Figure 4, alongside with that of the “reference” inverse agonist PSB-10. In all experiments, NECA was included as well to validate the response and guarantee comparability with our previous results. The in vitro functional results obtained with the test substances in the A3AR-βarr2 recruitment assay are numerically provided in Table 1, with concentration–response curves visually depicted in Figure 5.
Figure 4.

Structures of the previously described reference inverse agonist PSB-10, and the presumed antagonists MRS1220, MRS7799, MRS7907, and XAC.
Table 1. Summary of the Potency (EC50) and Efficacy (Emax) in the A3AR-βarr2 Recruitment Assay of the Reference Agonist NECA, Reference Inverse Agonist PSB-10, and a Selection of Substances Previously Characterized as Antagonistsa.
| EC50 (nM) (95% CI) | Emax (%) (95% CI) | |
|---|---|---|
| NECA | 132 (107–164) | 103 (99.5 to 106) |
| PSB-10 | 12.1 (7.24–20.5) | –97 (−104 to −89.8) |
| MRS1220 | 6.45 (3.25–12.9) | –97 (−108 to −87.3) |
| MRS7799 (DPTN) | 63.8 (35.0–114) | –99 (−109 to −89.8) |
| MRS7907 | 82.5 (38.0–180) | –107 (−120 to −94.1) |
| XAC | 199 (108–377) | –108 (−121 to −96.2) |
Data are from three independent experiments, each performed in duplicate. The Emax of NECA is used as 100% in each independent experiment, whereas the Emax of PSB-10 is used as −100%, respectively. Final curves are fit through the mean of the normalized values from the independent experiments, resulting in values slightly deviating from (−)100%.
Figure 5.
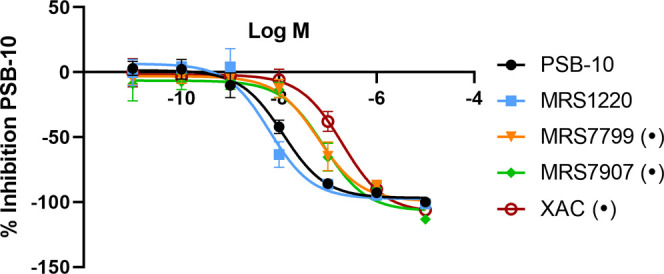
Concentration–response curves in the A3AR-βarr2 recruitment assay of the reference inverse agonist PSB-10, and the substances of which the structures are shown in Figure 4, and the EC50 and Emax values are given in Table 1. Data points represent the mean of three independent experiments ± SEM (standard error of the mean). The response of PSB-10 was set at −100% for the purpose of normalization. Dots (•) indicate those compounds for which the highest concentration showed a decreased luminescence value in the CB1-βarr2 assay (Figure 6).
Notably, from Table 1 and Figure 5, it can be derived that all of the putative antagonists induced a pronounced and concentration-dependent decrease in basal luminescence signals in the A3AR-βarr2 assay, hinting at an inverse agonist character in the assay conditions employed here. For all compounds, full sigmoidal concentration–response curves were obtained, with potencies ranging from 6.45 nM (MRS1220) to 199 nM (XAC). All of the substances in the current exploratory panel showed “full” inverse agonism relative to PSB-10, as reflected by the Emax values around −100%. For the reference agonist NECA, an EC50 value of 132 nM was obtained, which is in line with the values previously reported in the same assay system, and hence indicative of its appropriate functionality in the current series of experiments.21,22 For MRS1220, a previous study reported a pEC50 value of 9.21 in a cAMP accumulation assay, which is in line with the low nanomolar EC50 value obtained in the A3AR-βarr2 recruitment assay.20
In analogy with the assessment of the receptor specificity of the observed effects with PSB-10, the current compounds were also subjected to the CB1-βarr2 assay (Figure 6). Overall, the obtained time–luminescence curves coincided with that of the corresponding solvent control (“average blank”). However, for the highest concentration (10 μM) of MRS7799, MRS7907, and XAC, the signals dropped below that of the solvent control. While this underscores the importance of maximally including controls for non-receptor-mediated effects when assessing inverse agonism, the fact that at lower concentrations no negative impact was observed in the CB1-βarr2 assay supports the inverse agonism hypothesis formulated above.
Figure 6.

Time–luminescence profiles of different concentrations of the tested substances MRS1220, MRS7799, MRS7907, and XAC in the CB1-βarr2 recruitment assay in the NanoBiT system. Results are two replicates of one control experiment.
As the exploration of PSB-10 alone did not yet conclusively exclude the option that it was possible to measure inverse agonism in the miniGαi assay, a concentration range of all compounds was measured at least once in that assay as well. However, none of the evaluated compounds displayed an outspoken and concentration-dependent decrease in luminescence values. It has been described that the qualification of ligands as inverse agonists or neutral antagonists depends on the pharmacological system that is applied to characterize a ligand. Given that all functional assays are inherently different, it is possible that one assay may be able to capture constitutive activity and inverse agonism, whereas another may not be able to do so.14,17 The fact that all ligands from this subset were previously assumed to be neutral antagonists (in at least one other assay system), and did not show signal decreases in the miniGαi recruitment assay, is in line with that hypothesis, pointing out that the latter assay is not able to distinguish inverse agonists. The assay dependence of the response underpins the need for in-depth pharmacological characterization of a ligand before using it as a supposedly neutral antagonist in a given experimental setup.17
2.3.1. Assessment of the Test Compounds in a GloSensor cAMP Assay
To further investigate the assay dependence of the observed responses, all presumed antagonists were tested in a GloSensor cAMP assay. In this assay, the cells express a protein that consists of a fusion of a PKA (protein kinase A)-derived cAMP-binding domain and a luminescent enzyme. Thereby, this protein has both a binding moiety for cAMP and for the enzyme’s substrate. In the absence of cAMP, the enzyme displays low affinity for its substrate. The interaction of cAMP with the cAMP-binding domain induces a conformational change in the substrate-binding domain. This change increases the affinity between the enzyme and the substrate, which is eventually measurable as an increased luminescence.27 As activation of the A3AR canonically results in coupling and activation of Gαi, and a subsequent reduction in adenylate cyclase activity and cAMP levels, an inverse agonist is expected to increase cAMP levels in a concentration-dependent manner.1−3Figure 7 accordingly shows full sigmoidal concentration–response curves for PSB-10, MRS7799, and MRS7907 with increasing cAMP levels, as measured in the GloSensor cAMP assay. The corresponding pharmacological parameters are provided in Table 2. Representative results for forskolin, the selective A3AR agonist 2-Cl-IB-MECA, XAC, and MRS1220 are provided in Supporting Figures S1 and S2.
Figure 7.

Concentration–response curves obtained in the GloSensor cAMP assay for the reference inverse agonist PSB-10, MRS7799, and MRS7907. The corresponding EC50 and Emax values are given in Table 2. Data points represent the mean of four independent experiments ± SEM (standard error of the mean). The response of PSB-10 was set at 100% for the purpose of normalization.
Table 2. Summary of the Potency (EC50) and Efficacy (Emax) of the Reference Inverse Agonist PSB-10, MRS7799, and MRS7907 in the GloSensor cAMP Assaya.
| EC50 (nM) (95% CI) | Emax (%) (95% CI) | |
|---|---|---|
| PSB-10 | 9.41 (0.34–156) | 98.4 (68.2–136) |
| MRS7799 | 2.24 (0.10–46.6) | 92.5 (70.7–116) |
| MRS7907 | 91.3 (25.3–259) | 203 (175–233) |
Data are from four independent experiments, each performed in duplicate. The Emax of PSB-10 is used as 100% in each independent experiment. Final curves are fit through the mean of the normalized values from the independent experiments, resulting in values slightly deviating from 100%.
As can be derived from Table 2 and Figure 7, PSB-10, MRS7799, and MRS7907 are capable of increasing cAMP levels, indicative of their A3AR-mediated inverse agonism. EC50 values in this assay ranged from 2.27 to 91.3 nM, with the Emax of MRS7907 being 203% (relative to the Emax of PSB-10). These results confirm but are not unambiguously comparable to those obtained in the βarr2 recruitment assay, which measures a distinct signaling event. Indeed, it should be noted that the interpretation of each in vitro assay comes with inherent caveats, such as signal amplification and potential non-A3AR-mediated effects in the cAMP assay, and the modification of proteins in the βarr2 recruitment assay.28 When looking at the responses obtained for 2-Cl-IB-MECA in the cAMP assay (Figure S2), it is visible that the lower concentrations of this prototypical A3AR agonist induce decreases in cAMP levels, as expected for an A3AR agonist. However, at higher concentrations, the signal increases rather than the decrease observed at the lower concentrations. Presumably, this effect is caused by (minimal) interaction of 2-Cl-IB-MECA with A2AR and/or A2BR, both Gαs-coupled receptors that are endogenously expressed in HEK cells.29−31 Also the profiles of MRS1220 and the nonselective ligand XAC are hypothesized to result from interaction with both A3AR and other adenosine receptors (Figure S2).
The observed concentration-dependent response of PSB-10 in the cAMP assay led to the hypothesis that the lack of a concentration-dependent decrease in luminescence in the NanoBiT miniGαi recruitment assay is caused by an inherent inability of that assay to detect inverse agonism, rather than by an inherent inability of the ligands to exert inverse agonism at the G protein signal transduction cascade.
Although so far most of the clinical trials of selective A3AR ligands have been with agonists, several recent trials have begun using A3AR antagonists. Thus, our study is relevant for future therapeutics as well as the use of pharmacological tool compounds. All test compounds included here have previously been described to be antagonists at the A3AR and have accordingly been used as pharmacological tools.11,32−37 The triazoloquinazoline MRS1220 was previously reported to behave as an antagonist for the effect of (NECA and) the A3AR-selective agonist Cl-IB-MECA in adenylate cyclase and [35S]GTPγS assays.34 Remarkably, the high-affinity substance MRS1220 reversed the effects of Cl-IB-MECA on TNF-α secretion by a human macrophage cell line.34 Furthermore, MRS1220 was reported to behave as an antagonist in a PathHunter assay for βarr translocation.38 In a separate study, MRS1220 was reported to behave as an inverse agonist in a cAMP assay in which constitutive A3AR activity could be shown.20 DPTN (MRS7799) has been reported to behave as an antagonist in a cAMP functional assay monitoring NECA-induced reduction of cAMP accumulation. Noteworthy, the concentration–response curve in that report showed signals dropping markedly below zero, although this was not further discussed.39 XAC has been reported to behave as a competitive antagonist of NECA in a calcium response assay at the A3AR.40 Ozola et al. reported PSB-10 to be an A3AR inverse agonist in a [35S]GTPγS assay.18 Strikingly, all of the above-described substances behaved as inverse agonists in the currently used experimental setup, indicating the relevance of inverse agonism, and confirming that the effect of PSB-10 was not coincidental. We did not characterize here any A3AR-selective antagonists with nucleoside scaffolds, which often retain some low-efficacy partial agonist properties.41 One such antagonist, 4′-truncated (N)-methanocarba nucleoside MRS5127, was previously shown to activate A3AR-mediated βarr2 recruitment with an Emax of 5.2%.21
Although the physiological relevance of constitutive receptor activity and inverse agonism has at present not been entirely elucidated,14,17,19 the impact on in vitro effects, when used as a (supposedly “neutral”) competitive antagonist, appears undeniable. The above results, characterizing all tested antagonists as inverse agonists when tested in an appropriate system, support the hypothesis of “neutral antagonism” being rather rare, with (partial) agonists and inverse agonists populating most of the pharmacological landscape.14
In conclusion, using PSB-10, a compound reported to be an inverse agonist at the A3AR, we found the previously developed NanoBiT-hA3AR-βarr2 recruitment assay, but not the NanoBiT-hA3AR-miniGαi recruitment assay, to be able to capture inverse agonist behavior. The specificity of the observed effect was confirmed via testing PSB-10 in a highly analogous in vitro assay monitoring βarr2 recruitment to the CB1 receptor in the NanoBiT system. Furthermore, the reversibility of the effects was demonstrated by combining a preincubation of PSB-10 with a concentration range of the A3AR agonist NECA, which could counteract the PSB-10-induced inverse agonism. As the relative prevalence of antagonism and inverse agonism is currently unclear, we further sought to test an exploratory panel of presumed antagonists. Remarkably, all of the putative A3AR antagonists evaluated here displayed potent and fully efficacious inverse agonism, highlighting the relevance of investigating inverse agonism—in addition to “neutral” antagonism—in A3AR research, despite the paucity of reports on this phenomenon. Moreover, assessment of the ligands in a cAMP assay showed that the lack of observed inverse agonism in the miniGαi recruitment assay is not caused by the inability of the ligands to cause decreases in Gi-protein mediated constitutive activity, but rather by the inability of that assay to capture such decreases. The βarr2 recruitment assay and the GloSensor cAMP assays both appear capable of detecting such effects at the A3AR. Undeniably, our results indicate the relevance of thorough characterization of test systems and presumed antagonists when applying these as tool compounds in pharmacological research, whether for A3AR or for other receptors.
3. Materials and Methods
3.1. Chemicals and Reagents
Dulbecco’s modified Eagle’s medium (DMEM), Hank’s balanced salt solution (HBSS), CO2-independent medium, OptiMEM, penicillin/streptomycin, amphotericin B, and phosphate-buffered saline (PBS) were purchased from Fisher Scientific Belgium (Merelbeke, Belgium). NECA (5′-N-ethylcarboxamidoadenosine), 2-Cl-IB-MECA (2-chloro-N6-(3-iodobenzyl)-5′-N-methylcarboxamidoadenosine), and PSB-10 were obtained from Tocris Bioscience (Biotechne, Abingdon, UK). Promega (Madison, WI) provided NanoGlo Live Cell Substrate, LCS Dilution Buffer, FuGENE HD transfection reagent, the pGloSensor-22F cAMP plasmid, and GloSensor cAMP reagent. Poly-d-lysine hydrobromide, MRS1220, and XAC were bought from Sigma-Aldrich (Steinheim, Germany). Compounds MRS7799 and MRS7907 were synthesized according to previously published methods.35
3.2. Pharmacological Characterization
3.2.1. Routine Cell Culture and Transfection
The previously described hA3ARLgBiT-SmBiTβarr2 or hA3ARLgBiT-SmBiTminiGαi stable cell lines were used in this study. These correspond to HEK 293T cells stably expressing the hA3AR together with either βarr2 or miniGαi as components of the NanoBiT functional complementation assay.21,22 Routine cell culture took place in DMEM (GlutaMAX) supplemented with 10% heat-inactivated FBS, 100 IU/mL of penicillin, 100 μg/mL streptomycin, and 0.25 μg/mL amphotericin B, at 5% CO2 in a humidified atmosphere. For the GloSensor cAMP assay, HEK 293T cells were seeded in 6-well plates at a density of 500,000 cells per well and incubated overnight. Subsequently, the cells were transfected with 1.65 μg of A3AR plasmid DNA (in vector pCMV4-XL4, NM 000677.2, Origene Technologies, Rockville, MD), and 1.65 μg of the pGloSensor-22F cAMP plasmid, in a FuGENE HD:DNA 3:1 ratio in OptiMEM, according to the manufacturer’s protocol.
3.2.2. NanoBiT Assay Protocol
The routinely cultured hA3ARLgBiT-SmBiTβarr2 or hA3ARLgBiT-SmBiTminiGαi cells were seeded into poly-d-lysine coated 96-well plates, at a density of 50,000 cells per well. After 24 h of incubation, the cells were rinsed twice, and 90 μL of HBSS was placed into each well. To this, 25 μL of the NanoGlo Live Cell Reagent (diluted 1/20 in LCS Dilution Buffer, following the manufacturer’s instructions) was added, and the plate was transferred to a Tristar2 LB942 multimode microplate reader (Berthold Technologies GmbH & Co, Germany), where luminescence was read out until equilibration of the signal. For characterization experiments, 20 μL of a 6.75 times concentrated ligand solution was added to the wells. For “combination experiments,” first, 10 μL of a 12.5 times concentrated solution of “ligand 1” was added to the wells, followed by 5 min of incubation, and the addition of 10 μL of the 13.5 times concentrated solution of “ligand 2.” In all experiments, luminescence was monitored for 90 min. All experiments included a concentration range of both the reference agonist NECA and the reference inverse agonist PSB-10, for the purpose of normalization, as well as the appropriate solvent controls.
The experiments with the CB1-βarr2 recruitment assay were performed in a highly similar manner, as previously described, with OptiMEM being used as the assay buffer.25,26
3.2.3. GloSensor cAMP Assay
At least 6 h post-transfection, the cells were reseeded into poly-d-lysine precoated 96-well plates at a density of 50,000 cells per well. Following overnight incubation, the culture medium was aspirated, and the cells were rinsed with a CO2-independent medium. Following the manufacturer’s instructions, the cells were incubated in 100 μL of equilibration medium, consisting of CO2-independent medium with 2% GloSensor substrate for 30 min at 37 °C. Subsequently, the plate was cooled down to room temperature for 15 min, followed by a readout of the initial luminescence values in the Tristar2 LB942 multimode microplate reader (Berthold Technologies, Germany). Concentration ranges of each test substance were added as 11× concentrated solutions, followed by a 90 min continuous readout of luminescence. Each experiment contained the appropriate solvent controls.
3.3. Data Analysis
Data obtained in the above-described experiments were analyzed by means of two different methods for normalization, to accommodate for the occurrence of both agonism and inverse agonism. In the GloSensor cAMP assay, where an inverse agonist induces an increase in signal, the “agonist normalization method” was used, with PSB-10 as the reference ligand. In both normalization methods, the generated time–luminescence profiles were corrected for inter-well variability, and the area under the curve (AUC) was calculated.
In the “agonist normalization method,” data were further analyzed as described before in more detail.22 In brief, the AUC of the corresponding blanks was subtracted, and the data were transferred to GraphPad Prism software (San Diego, CA). The three-parametric nonlinear regression model was used to fit a concentration–response curve of NECA, and data were normalized, with 0 set as 0% and the maximal response of NECA (or PSB-10 in the GloSensor cAMP assay) set as 100%. For the “inverse agonist normalization method,” no blank subtraction was performed, and data were transferred to GraphPad for the purpose of normalization. To this end, the AUC value of 10 μM PSB-10, serving as the reference inverse agonist in this study, was set as −100%, and the AUC of the solvent control was defined as 0%. In all cases, the normalized values of the independently performed experiments were pooled together, to calculate the mean values and respective SEM (standard error of the mean) and SD (standard deviation) values. These mean values are subsequently used to fit three-parametric nonlinear regression curves, from which the EC50 and Emax values are calculated.
Acknowledgments
The authors acknowledge funding from NIDDK Intramural Research (ZIADK031117).
Glossary
Abbreviations
- AR
adenosine receptor
- AUC
area under the curve
- βarr2
β-arrestin 2
- cAMP
cyclic AMP
- GPCR
G protein-coupled receptor
- HEK
human embryonic kidney
- NECA
5′-N-ethylcarboxamidoadenosine
- SAR
structure–activity relationship
- SEM
standard error of the mean
- XAC
xanthine amine congener
Supporting Information Available
The Supporting Information is available free of charge at https://pubs.acs.org/doi/10.1021/acsptsci.3c00071.
Time–luminescence profile of forskolin in the GloSensor cAMP assay; concentration–response traces of XAC, MRS1220, and 2-Cl-IB-MECA in the GloSensor cAMP assay (PDF)
Author Contributions
E.P., K.A.J., and C.P.S.: conceptualization; E.P.: experimental results; R.R.S.: preparation of reagents.
The authors declare no competing financial interest.
Notes
MRS1220 (PubChem CID:393595), MRS7799 (PubChem CID: 22282339), MRS7907 (PubChem CID: 166633518), XAC (PubChem CID:5697), NECA (PubChem CID:448222), PSB-10 (PubChem CID:135401232), 2-Cl-IB-MECA (PubChem CID: 3035850)
Special Issue
Published as part of the ACS Pharmacology & Translational Science virtual special issue “GPCR Signaling”.
Supplementary Material
References
- Jacobson K. A.; Merighi S.; Varani K.; Borea P. A.; Baraldi S.; Aghazadeh Tabrizi M.; Romagnoli R.; Baraldi P. G.; Ciancetta A.; Tosh D. K.; et al. A3 Adenosine Receptors as Modulators of Inflammation: From Medicinal Chemistry to Therapy. Med. Res. Rev. 2018, 38, 1031–1072. 10.1002/med.21456. [DOI] [PMC free article] [PubMed] [Google Scholar]
- Storme J.; Cannaert A.; Van Craenenbroeck K.; Stove C. P. Molecular dissection of the human A3 adenosine receptor coupling with beta-arrestin2. Biochem. Pharmacol. 2018, 148, 298–307. 10.1016/j.bcp.2018.01.008. [DOI] [PubMed] [Google Scholar]
- Borea P. A.; Varani K.; Vincenzi F.; Baraldi P. G.; Tabrizi M. A.; Merighi S.; Gessi S. The A3 adenosine receptor: history and perspectives. Pharmacol. Rev. 2015, 67, 74–102. 10.1124/pr.113.008540. [DOI] [PubMed] [Google Scholar]
- McNeill S. M.; Baltos J. A.; White P. J.; May L. T. Biased agonism at adenosine receptors. Cell Signalling 2021, 82, 109954 10.1016/j.cellsig.2021.109954. [DOI] [PubMed] [Google Scholar]
- Liston T. E.; Hinz S.; Muller C. E.; Holstein D. M.; Wendling J.; Melton R. J.; Campbell M.; Korinek W. S.; Suresh R. R.; Sethre-Hofstad D. A.; et al. Nucleotide P2Y(1) receptor agonists are in vitro and in vivo prodrugs of A(1)/A(3) adenosine receptor agonists: implications for roles of P2Y(1) and A(1)/A(3) receptors in physiology and pathology. Purinergic Signalling 2020, 16, 543–559. 10.1007/s11302-020-09732-z. [DOI] [PMC free article] [PubMed] [Google Scholar]
- Liston T. E.; Hama A.; Boltze J.; Poe R. B.; Natsume T.; Hayashi I.; Takamatsu H.; Korinek W. S.; Lechleiter J. D. Adenosine A1R/A3R (Adenosine A1 and A3 Receptor) Agonist AST-004 Reduces Brain Infarction in a Nonhuman Primate Model of Stroke. Stroke 2022, 53, 238–248. 10.1161/STROKEAHA.121.036396. [DOI] [PubMed] [Google Scholar]
- Mazziotta C.; Rotondo J. C.; Lanzillotti C.; Campione G.; Martini F.; Tognon M. Cancer biology and molecular genetics of A(3) adenosine receptor. Oncogene 2022, 41, 301–308. 10.1038/s41388-021-02090-z. [DOI] [PMC free article] [PubMed] [Google Scholar]
- Wang Z.; Do C. W.; Avila M. Y.; Peterson-Yantorno K.; Stone R. A.; Gao Z. G.; Joshi B.; Besada P.; Jeong L. S.; Jacobson K. A.; Civan M. M. Nucleoside-derived antagonists to A3 adenosine receptors lower mouse intraocular pressure and act across species. Exp. Eye Res. 2010, 90, 146–154. 10.1016/j.exer.2009.10.001. [DOI] [PMC free article] [PubMed] [Google Scholar]
- Jeong L. S.; Choe S. A.; Gunaga P.; Kim H. O.; Lee H. W.; Lee S. K.; Tosh D. K.; Patel A.; Palaniappan K. K.; Gao Z. G.; et al. Discovery of a new nucleoside template for human A3 adenosine receptor ligands: D-4′-thioadenosine derivatives without 4′-hydroxymethyl group as highly potent and selective antagonists. J. Med. Chem. 2007, 50, 3159–3162. 10.1021/jm070259t. [DOI] [PubMed] [Google Scholar]
- Park C. W.; Han C. T.; Sakaguchi Y.; Lee J.; Youn H. Y. Safety evaluation of FM101, an A3 adenosine receptor modulator, in rat, for developing as therapeutics of glaucoma and hepatitis. EXCLI J. 2020, 19, 187–200. 10.17179/excli2019-2058. [DOI] [PMC free article] [PubMed] [Google Scholar]
- Jacobson K. A.; Klutz A. M.; Tosh D. K.; Ivanov A. A.; Preti D.; Baraldi P. G. Medicinal chemistry of the A3 adenosine receptor: agonists, antagonists, and receptor engineering. Handb. Exp. Pharmacol. 2009, 193, 123–159. 10.1007/978-3-540-89615-9_5. [DOI] [PMC free article] [PubMed] [Google Scholar]
- Gao Z. G.; Kim S. K.; Biadatti T.; Chen W.; Lee K.; Barak D.; Kim S. G.; Johnson C. R.; Jacobson K. A. Structural determinants of A(3) adenosine receptor activation: nucleoside ligands at the agonist/antagonist boundary. J. Med. Chem. 2002, 45, 4471–4484. 10.1021/jm020211. [DOI] [PMC free article] [PubMed] [Google Scholar]
- Neubig R. R.; Spedding M.; Kenakin T.; Christopoulos A.; International Union of Pharmacology Committee on Receptor Nomenclature and Drug Classification. XXXVIII. Update on terms and symbols in quantitative pharmacology. Pharmacol. Rev. 2003, 55, 597–606. 10.1124/pr.55.4.4. [DOI] [PubMed] [Google Scholar]
- Kenakin T. Efficacy as a vector: the relative prevalence and paucity of inverse agonism. Mol. Pharmacol. 2004, 65, 2–11. 10.1124/mol.65.1.2. [DOI] [PubMed] [Google Scholar]
- Ciancetta A.; Rubio P.; Lieberman D. I.; Jacobson K. A. A3 adenosine receptor activation mechanisms: molecular dynamics analysis of inactive, active, and fully active states. J. Comput.-Aided Mol. Des. 2019, 33, 983–996. 10.1007/s10822-019-00246-4. [DOI] [PMC free article] [PubMed] [Google Scholar]
- Costa T.; Cotecchia S. Historical review: Negative efficacy and the constitutive activity of G-protein-coupled receptors. Trends Pharmacol. Sci. 2005, 26, 618–624. 10.1016/j.tips.2005.10.009. [DOI] [PubMed] [Google Scholar]
- Berg K. A.; Clarke W. P. Making Sense of Pharmacology: Inverse Agonism and Functional Selectivity. Int. J. Neuropsychopharmacol. 2018, 21, 962–977. 10.1093/ijnp/pyy071. [DOI] [PMC free article] [PubMed] [Google Scholar]
- Ozola V.; Thorand M.; Diekmann M.; Qurishi R.; Schumacher B.; Jacobson K. A.; Muller C. E. 2-Phenylimidazo[2,1-i]purin-5-ones: structure-activity relationships and characterization of potent and selective inverse agonists at Human A3 adenosine receptors. Bioorg. Med. Chem. 2003, 11, 347–356. 10.1016/s0968-0896(02)00456-x. [DOI] [PMC free article] [PubMed] [Google Scholar]
- Soudijn W.; van Wijngaarden I.; Ijzerman A. P. Structure-activity relationships of inverse agonists for G-protein-coupled receptors. Med. Res. Rev. 2005, 25, 398–426. 10.1002/med.20031. [DOI] [PubMed] [Google Scholar]
- Barkan K.; Lagarias P.; Stampelou M.; Stamatis D.; Hoare S.; Safitri D.; Klotz K. N.; Vrontaki E.; Kolocouris A.; Ladds G. Pharmacological characterisation of novel adenosine A(3) receptor antagonists. Sci. Rep. 2020, 10, 20781 10.1038/s41598-020-74521-y. [DOI] [PMC free article] [PubMed] [Google Scholar]
- Storme J.; Tosh D. K.; Gao Z. G.; Jacobson K. A.; Stove C. P. Probing structure-activity relationship in beta-arrestin2 recruitment of diversely substituted adenosine derivatives. Biochem. Pharmacol. 2018, 158, 103–113. 10.1016/j.bcp.2018.10.003. [DOI] [PMC free article] [PubMed] [Google Scholar]
- Pottie E.; Tosh D. K.; Gao Z. G.; Jacobson K. A.; Stove C. P. Assessment of biased agonism at the A3 adenosine receptor using beta-arrestin and miniGalphai recruitment assays. Biochem. Pharmacol. 2020, 177, 113934 10.1016/j.bcp.2020.113934. [DOI] [PMC free article] [PubMed] [Google Scholar]
- Dixon A. S.; Schwinn M. K.; Hall M. P.; Zimmerman K.; Otto P.; Lubben T. H.; Butler B. L.; Binkowski B. F.; Machleidt T.; Kirkland T. A.; et al. NanoLuc Complementation Reporter Optimized for Accurate Measurement of Protein Interactions in Cells. ACS Chem. Biol. 2016, 11, 400–408. 10.1021/acschembio.5b00753. [DOI] [PubMed] [Google Scholar]
- Nehmé R.; Carpenter B.; Singhal A.; Strege A.; Edwards P. C.; White C. F.; Du H.; Grisshammer R.; Tate C. G. Mini-G proteins: Novel tools for studying GPCRs in their active conformation. PloS One 2017, 12, e0175642 10.1371/journal.pone.0175642. [DOI] [PMC free article] [PubMed] [Google Scholar]
- Cannaert A.; Storme J.; Franz F.; Auwarter V.; Stove C. P. Detection and Activity Profiling of Synthetic Cannabinoids and Their Metabolites with a Newly Developed Bioassay. Anal. Chem. 2016, 88, 11476–11485. 10.1021/acs.analchem.6b02600. [DOI] [PubMed] [Google Scholar]
- Cannaert A.; Franz F.; Auwarter V.; Stove C. P. Activity-Based Detection of Consumption of Synthetic Cannabinoids in Authentic Urine Samples Using a Stable Cannabinoid Reporter System. Anal. Chem. 2017, 89, 9527–9536. 10.1021/acs.analchem.7b02552. [DOI] [PubMed] [Google Scholar]
- Binkowski B. F.; Butler B. L.; Stecha P. F.; Eggers C. T.; Otto P.; Zimmerman K.; Vidugiris G.; Wood M. G.; Encell L. P.; Fan F.; Wood K. V. A luminescent biosensor with increased dynamic range for intracellular cAMP. ACS Chem. Biol. 2011, 6, 1193–1197. 10.1021/cb200248h. [DOI] [PubMed] [Google Scholar]
- Zhang R.; Xie X. Tools for GPCR drug discovery. Acta Pharmacol. Sin. 2012, 33, 372–384. 10.1038/aps.2011.173. [DOI] [PMC free article] [PubMed] [Google Scholar]
- Atwood B. K.; Lopez J.; Wager-Miller J.; Mackie K.; Straiker A. Expression of G protein-coupled receptors and related proteins in HEK293, AtT20, BV2, and N18 cell lines as revealed by microarray analysis. BMC Genomics 2011, 12, 14. 10.1186/1471-2164-12-14. [DOI] [PMC free article] [PubMed] [Google Scholar]
- Borea P. A.; Gessi S.; Merighi S.; Varani K. Adenosine as a Multi-Signalling Guardian Angel in Human Diseases: When, Where and How Does it Exert its Protective Effects?. Trends Pharmacol. Sci. 2016, 37, 419–434. 10.1016/j.tips.2016.02.006. [DOI] [PubMed] [Google Scholar]
- Liu H.; Xia Y. Beneficial and detrimental role of adenosine signaling in diseases and therapy. J. Appl. Physiol. 2015, 119, 1173–1182. 10.1152/japplphysiol.00350.2015. [DOI] [PMC free article] [PubMed] [Google Scholar]
- Kim Y. C.; Ji X. D.; Jacobson K. A. Derivatives of the triazoloquinazoline adenosine antagonist (CGS15943) are selective for the human A3 receptor subtype. J. Med. Chem. 1996, 39, 4142–4148. 10.1021/jm960482i. [DOI] [PMC free article] [PubMed] [Google Scholar]
- Li A. H.; Moro S.; Melman N.; Ji X. D.; Jacobson K. A. Structure-activity relationships and molecular modeling of 3, 5-diacyl-2,4-dialkylpyridine derivatives as selective A3 adenosine receptor antagonists. J. Med. Chem. 1998, 41, 3186–3201. 10.1021/jm980093j. [DOI] [PMC free article] [PubMed] [Google Scholar]
- Jacobson K. A.; Park K. S.; Jiang J. L.; Kim Y. C.; Olah M. E.; Stiles G. L.; Ji X. D. Pharmacological characterization of novel A3 adenosine receptor-selective antagonists. Neuropharmacology 1997, 36, 1157–1165. 10.1016/s0028-3908(97)00104-4. [DOI] [PMC free article] [PubMed] [Google Scholar]
- Suresh R. R.; Gao Z. G.; Salmaso V.; Chen E.; Campbell R. G.; Poe R. B.; Liston T. E.; Jacobson K. A. Selective A(3) Adenosine Receptor Antagonist Radioligand for Human and Rodent Species. ACS Med. Chem. Lett. 2022, 13, 623–631. 10.1021/acsmedchemlett.1c00685. [DOI] [PMC free article] [PubMed] [Google Scholar]
- Miwatashi S.; Arikawa Y.; Matsumoto T.; Uga K.; Kanzaki N.; Imai Y. N.; Ohkawa S. Synthesis and biological activities of 4-phenyl-5-pyridyl-1,3-thiazole derivatives as selective adenosine A3 antagonists. Chem. Pharm. Bull. 2008, 56, 1126–1137. 10.1248/cpb.56.1126. [DOI] [PubMed] [Google Scholar]
- Jacobson K. A.; Kirk K. L.; Padgett W. L.; Daly J. W. A functionalized congener approach to adenosine receptor antagonists: amino acid conjugates of 1,3-dipropylxanthine. Mol. Pharmacol. 1986, 29, 126–133. [PMC free article] [PubMed] [Google Scholar]
- Gao Z. G.; Jacobson K. A. Translocation of arrestin induced by human A(3) adenosine receptor ligands in an engineered cell line: comparison with G protein-dependent pathways. Pharmacol. Res. 2008, 57, 303–311. 10.1016/j.phrs.2008.02.008. [DOI] [PMC free article] [PubMed] [Google Scholar]
- Gao Z. G.; Suresh R. R.; Jacobson K. A. Pharmacological characterization of DPTN and other selective A(3) adenosine receptor antagonists. Purinergic Signalling 2021, 17, 737–746. 10.1007/s11302-021-09823-5. [DOI] [PMC free article] [PubMed] [Google Scholar]
- May L. T.; Briddon S. J.; Hill S. J. Antagonist selective modulation of adenosine A1 and A3 receptor pharmacology by the food dye Brilliant Black BN: evidence for allosteric interactions. Mol. Pharmacol. 2010, 77, 678–686. 10.1124/mol.109.063065. [DOI] [PMC free article] [PubMed] [Google Scholar]
- Tosh D. K.; Salmaso V.; Rao H.; Bitant A.; Fisher C. L.; Lieberman D. I.; Vorbruggen H.; Reitman M. L.; Gavrilova O.; Gao Z. G.; et al. Truncated (N)-Methanocarba Nucleosides as Partial Agonists at Mouse and Human A3 Adenosine Receptors: Affinity Enhancement by N(6)-(2-Phenylethyl) Substitution. J. Med. Chem. 2020, 63, 4334–4348. 10.1021/acs.jmedchem.0c00235. [DOI] [PMC free article] [PubMed] [Google Scholar]
Associated Data
This section collects any data citations, data availability statements, or supplementary materials included in this article.