

Abstract
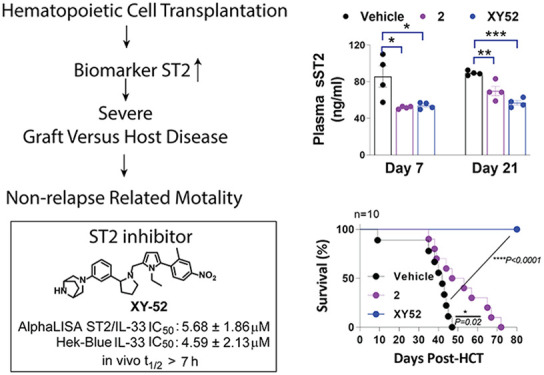
Hematopoietic cell transplantation (HCT) is a proven and potentially curable therapy for hematological malignancies and inherited hematological disease. The main risk of HCT is the development of graft versus host disease (GVHD) acquired in up to 50% of patients. Upregulation of soluble ST2 (sST2) is a key clinical biomarker for GVHD prognosis and was shown to be a potential therapeutic target for GVHD. Agents targeting sST2 to reduce the sST2 level after HCT have the potential to mitigate GVHD progression. Here, we report 32 (or XY52) as the lead ST2 inhibitor from our optimization campaign. XY52 had improved inhibitory activity and metabolic stability in vitro and in vivo. XY52 suppressed proinflammatory T-cell proliferation while increasing regulatory T cells in vitro. In a clinically relevant GVHD model, a 21-day prophylactic regimen of XY52 reduced plasma sST2 and IFN-γ levels and GVHD score and extended survival in mice. XY52 represented a significant improvement over our previous compound, iST2-1, and further optimization of XY52 is warranted. The small-molecule ST2 inhibitors can potentially be used as a biomarker-guided therapy for mitigating GVHD in future clinical applications.
Keywords: ST2, soluble ST2, biomarker, small-molecule inhibitors, IL-33, GVHD, HCT, cytokines, cytokine receptors, IL-1RL1
Hematopoietic cell transplantation (HCT) can be a curable therapy for patients with hematological malignancy, metabolic diseases, or born with immune-hematological diseases.1 A million patients have received HCT up to 2013,2 and the patient population continues to grow to this date.3 In HCT, bone marrow and T cells (including the pathological blood cells) are first depleted and then reconstituted through the engraftment of donors’ bone marrow cells. The procedure provides the benefit of the graft versus leukemia (GVL) effect to cancer patients through minor or major human leukocyte antigens (HLAs) mismatched between donor cells and recipient cells in transplantation. Despite the antitumor benefit, the conditioning regimens required for cell depletion can cause tissue damage,4 which subjects the hosts to cytokine release (i.e., IL-1, IL-6, TNFα, and IFNγ),5 amplifying the allogeneic T-cell-mediated immune response after transplantation. Primed by antigens presented from hosts’ antigen-presenting cells (APCs), donor-derived T cells are activated to invoke an immune response to attack recipients’ (or hosts’) organs, leading to graft versus host disease (GVHD).6 Because most organ damages in GVHD are contributed by the activated proinflammatory T cells, including type 1 and 17 T helper (CD4+) and cytotoxic (CD8+) cells (Th1, Tc1, Th17, Tc17), the standard GVHD prophylaxis uses immunosuppressants, including tacrolimus and sirolimus, to reduce the severity of GVHD progression for many decades.6,7
Development of GVHD can be viewed as an outcome of the inability of the human immune system to manage transplantation because such events rarely occur through evolution. Regulation of immune response is always mediated through a check-and-balance between the proinflammatory and anti-inflammatory arms in the immune system.8 In the early onset of GVHD (or acute GVHD, aGVHD), the overwhelming proinflammatory response incapacitates the anti-inflammatory regulation during the reconstitution of the T-cell population in the host. Patients therefore require therapeutic intervention to restrain T-cell activation and minimize organ damage. In T-cell activation, the JAK-STAT pathway serves as one central hub of the immune system9,10 that regulates both proinflammatory and anti-inflammatory subsets of T helper cells (Th1, Th2, Th17, and Treg) polarization.11 Specifically, the JAK-STAT pathway responds to IL-6 and IFNγ9,10 stimulation to induce inflammatory response including GVHD.10
Another major effector in GVHD development is the IL-1 receptor (IL-1R) family that binds to the IL-1 family of cytokines to activate gene transcription via MyD88 to NF-κB12,13, skewing the differentiation of naïve T lymphocytes into different T effector lymphocyte subpopulations.12 We had previously discovered an important GVHD prognostic biomarker, soluble ST2 (sST2),14 encoded by the IL1RL1 (interleukin-1 receptor-like 1) gene in the IL-1R family. Elevated sST2 levels are significantly associated with GVHD progression and the nonrelapse-related death of patients resistant to steroid therapy.14,15 The increased level of sST2 can sequester the damaged cells released IL-3316 (only known ligand for ST217) to limit IL-33-mediated expansion of the membrane-bound ST2 (denoted as ST2) expressing regulatory Th2, Treg cells, and type 2 innate lymphoid cells in the early phase of tissue repair that follows type 1 immunity response.18 Persistent excess amounts of sST2 will suppress the immune tolerance to control proinflammatory type 1 and 17 cells’ proliferation and activation in aGVHD.19,20 Besides GHVD, elevation of sST2 has been associated with various immune-mediated diseases, e.g., cardiac disease,21 inflammatory bowel disease (IBD),22 and type 2 diabetes.23
Previously, we had demonstrated that sST2 can be a potential therapeutic target for GVHD. Administration of either an ST2 antibody24 or a small-molecule ST2 inhibitor25 (iST2-1 in Figure 1) in two murine GVHD models led to decreased sST2, reduced GVHD scores, improved survival, and maintenance of GVL in allo-HCT. Both studies suggested that administration of either the ST2 antibody or a small-molecule ST2 inhibitor, iST2-1, may release IL-33 from excess sST2 to act on ST2+ regulatory T (Treg) cells to induce immune tolerance in the GVHD models. The unbound sST2 may also be subject to degradation in plasma, as well. We recently reported 1-(furan-2ylmethyl)pyrrolidine-based analogues represented by compound 4 (Figure 1)26 with a better activity than iST2-1 in biochemical assays. However, the activity of 4 in a cell-based assay and the metabolic stability in vitro and in vivo were not ideal for an in vivo animal disease model study. Here, we report our further optimization of 4 to obtain 32 with improved activity and in vivo metabolic stability. In a clinically relevant minor HLA mismatch mouse GVHD model, we demonstrated the efficacy of 32 in mitigating GVHD severity in mice.
Figure 1.
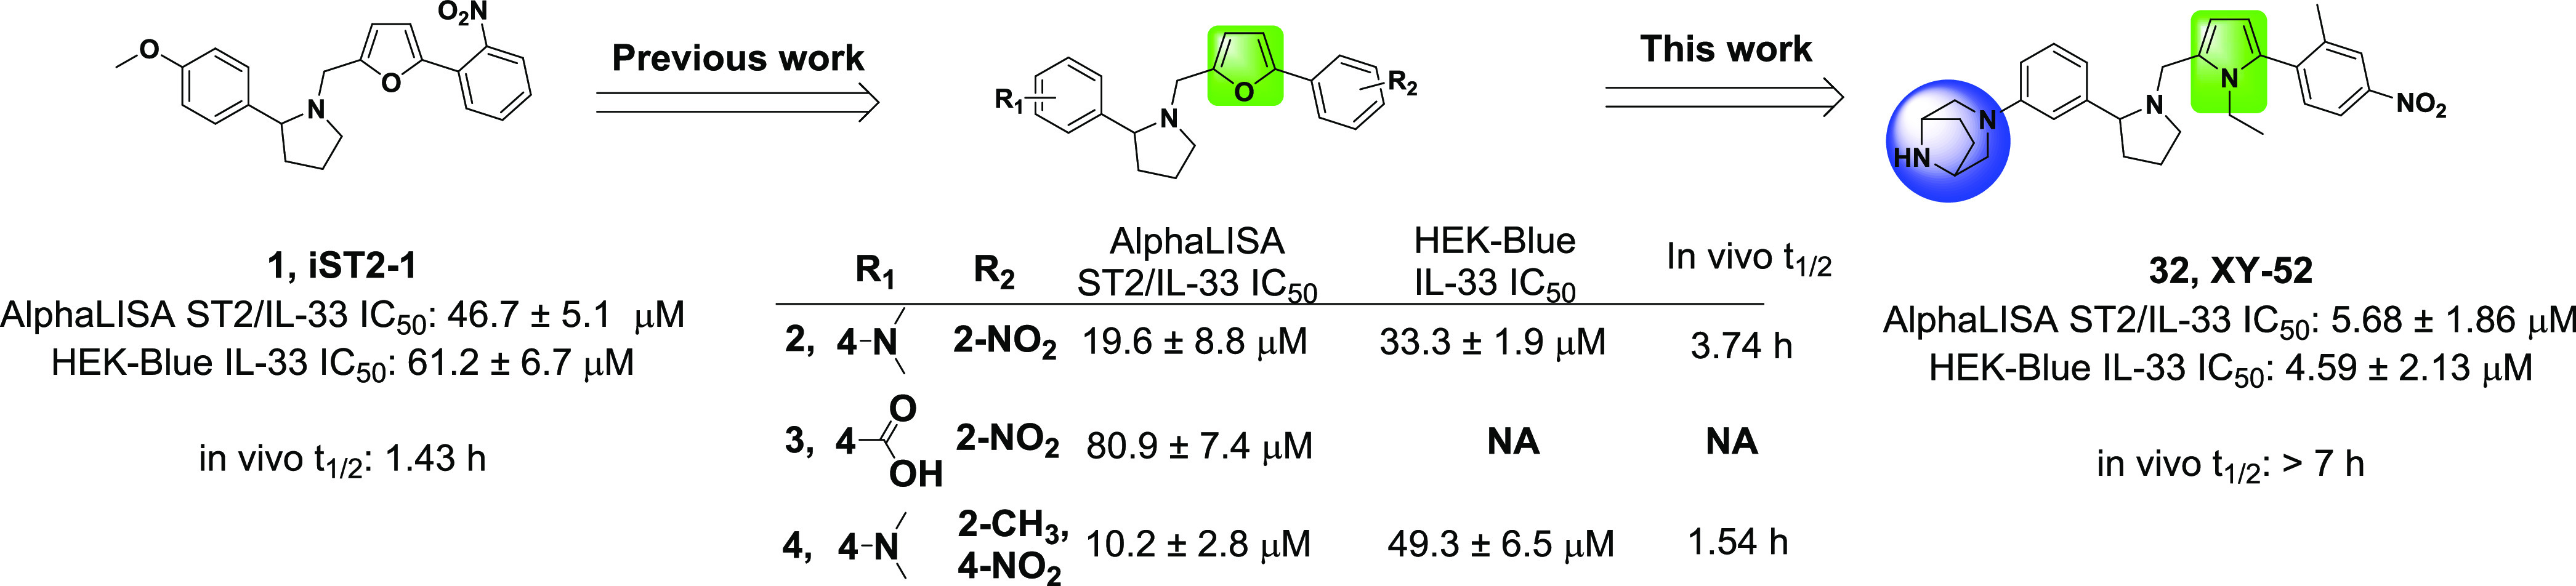
Summary of the optimization of iST2-1 to obtain compounds 2, 4, and 32. The inhibitory activities in AlphaLISA and HEK-Blue reporter cells and the in vivo metabolic stability (t1/2) of the compounds are provided. The in vivo t1/2 is calculated based on one compartment pharmacokinetic model27 using data collected from mice administered intraperitoneally with inhibitors at 40 (iST2-1) or 20 mg/kg (2, 4, and 32) for 7 h.
Results and Discussions
Optimization Rationale and Structure–Activity Relationship
Following our previous studies, we determined the activities of our compounds using two complementary assays, the AlphaLISA ST2/IL-33 biochemical binding assay and the HEK-Blue IL-33 cell-based reporter assay (a functional assay to confirm the inhibitory activity).25,26 Our previous work focused on modifying the phenylpyrrolidine moiety and the nitrophenyl group in iST2-1 to obtain 4 (Figure 1).26 Compound 4 had improved activity in the AlphaLISA ST2/IL-33 biochemical activity but had a similar IC50 value as iST2-1 in the cellular reporter assay (Figure 1).26 Based on 4, we first replaced the furan ring with a pyrrole ring, which was a more soluble isostere. Although 5 (pyrrole) had a slightly higher IC50 value than 4 (furan) in the AlphaLISA assay, 5 showed an approximately 7-fold improvement in the activity of the HEK-Blue assay (Table 1). When the 3-dimethylamine group was used, 6 retained the activity (IC50 = 12.7 ± 1.6 μM) in the HEK-Blue assay and gave a lower IC50 value at 11.2 ± 0.4 μM than 5 in the AlphaLISA assay. To improve the solubility and block potential metabolic sites on the dimethylaniline group in 6, we introduced disubstitutions or heteroatoms into the phenylpyrrolidine moiety. Both 3-dimethylamino-5-methyl (7) and 3-dimethylamine-5-methoxyl (8) groups maintained the activities in the AlphaALISA and HEK-Blue assays, but a dimethoxy group (Table S1) gave a 4-fold activity reduction in the AlphaLISA assay and a slightly decreased activity in the HEK-Blue assay. We next studied whether the more soluble heteroaromatic rings (9–11) could yield improved activities. Only 9 maintained comparable activities to those of 6 in both assays (Tables 1 and S1).
Table 1. Activities of Compounds 4–29 Determined from the AlphaLISA and the HEK-Blue Assaysa.


IC50 values are averages of ≥2 independent experiments.
Based on 5–11, we found that hydrophobic groups on the phenyl group were preferred. We then replaced the dimethylanilline in 6 with a larger methylindole group (12) and observed no improved activity. Data of 7, 8, and 12 also informed that disubstitution of smaller groups on the phenyl group in 6 resulted in decreased activity. We next studied replacement of the dimethylamino group with a methylsulfonyl group, pyrrolidine, azetidine, and piperazine ring (13–22) as listed in Table 1. While 13 and 14 with the methylsulfonyl group showed a significant decrease in the activity of the AlphaLISA assay, cyclization of the dimethylamino group to pyrrolidine (15–16) or azetidine (17–18) resulted in enhanced inhibitory activity (IC50: 8.0–10.0 μM) in the AlphaLISA assay. These results suggested that a hydrophobic alkyl group connected to the phenylpyrrolidine moiety gave favorable higher activities despite the fact that 15–18 were more hydrophobic than 6. To improve the solubility and maintain the activity of 15–18, we introduced cycloalkanes decorated with polar substituents (19–22) such as the hydroxyl and piperazine groups to the phenylpyrrolidine moiety. A hydroxyl azetidine on either the 4- or 3-position in phenylpyrrolidine (19, 20) gave a 2-fold increase of IC50 values in the AlphaLISA assay but retained potency in the HEK-Blue assay. Although the piperazine group yielded higher IC50 values in the AlphaLISA assay (IC50: 25.0–30.0 μM), 22 with the 3-piperazine group had an IC50 of 7.85 ± 3.03 μM, which is comparable to that of 5, yet 22 was expected to have better solubility (Clog P: 5.50/5 versus 4.77/22).
Among 5–22, both 5 and 22 showed the highest inhibition activity, with IC50 values of about 7 μM in the HEK-Blue assay. To check whether the higher inhibitory activities of 5 and 22 in the HEK-Blue assay were unrelated to cytotoxicity, we determined the viability of the HEK-Blue cells treated with 5 and 22 at 25 μM. The HEK-Blue cells were 75.3 and 91.1% viable at 25 μM 5 and 22, respectively, suggesting the IC50 values of ST2/IL-33 inhibition determined from the HEK-Blue assay were not attributed to cytotoxicity of the compounds (Table S2). Based on the structure, we expected 22 to have an improved metabolic stability compared to the other compounds. To confirm our hypothesis, we determined the metabolic stability of select compounds (4, 6, 16, 18, 20, and 22) in the mouse liver microsome (Table 2). Similar to iST-1 (Figure 1), 4 and 6 had shorter half-lives (t1/2 = 3.7 and 1.9 min, respectively), and cyclization of the dimethylamino group (16, 18) gave improved stability. Although 18 and 20 had a similar half-life in microsomes, 22 indeed had a longer half-life (t1/2 = 27.5 min; Table 2) than the other compounds. Based on the data, we continued our optimization of 22 by modifying the piperazine group.
Table 2. Potency and Mouse Microsomal Stability of Select ST2 Inhibitors with the Goal of Improving Their Metabolic Stability.


Different six-member ring substitutions (23–29), including piperazine and morpholine, at the meta-position in the phenylpyrrolidine moiety in 22 were investigated further. Modifications within the piperazine ring (23, 24) retained the compound activity (IC50 ∼ 6.0 μM) in the HEK-Blue assay, and 23 had a 3-fold improvement of IC50 values over 22 according to the AlphaLISA assay (Table 1). Addition of chemical groups to the terminal amine in the piperazine group (25, 27, and 28) or using the methyl and amine group (26) gave IC50 values similar to 22 in both assays except for 25 and 28. Interestingly, replacement of piperazine with morpholine (29) led to reduced activity (Table 1).
Among 23–29, 23 had improved activities over that of 22 in the AlphaLISA and HEK-Blue assays. The microsomal stability of 23 was, however, lower than that of 22 (t1/2 = 9.9 versus 27.5 min, Table 2). We next investigated if modifications on the nitrophenyl-pyrrole group in 23 (i.e., 30–32) can improve the metabolic stability of the compounds and retain the activity. We found that replacement of the methyl group with CF3 (30) indeed improved the microsomal stability (t1/2 = 24.4 min) but showed a 2-fold reduction of activities in both assays in comparison to 23. Furthermore, although 31 did not have improved activity or stability over 23, 32 (or XY52), carrying an ethyl-pyrrole group, showed a higher potency in the AlphaLISA (IC50 = 5.68 ± 1.86 μM) and HEK-Blue (IC50 = 4.59 ± 2.13 μM) assays and exhibited a much higher stability in mouse liver microsomes (t1/2 > 60.0 min) than 23 (Table 2). In addition, 32 did not induce toxicity to the HEK-Blue cells because the viability of HEK-Blue cells treated with 32 at 25 μM was similar to that of the other compounds (Table S2).
Differential Inhibition Activities of ST2 Inhibitors against sST2 and ST2/IL1RAcP
Although the HEK-Blue assay reflects the inhibition activity of our compounds to membrane ST2 signaling, the IC50 values from the HEK-Blue assay are not directly comparable to the IC50 values determined from the AlphaLISA assay because they are different types of assays. IL-33 binds with ST2 and IL1RAcP to form a trimeric complex on the cell membrane to induce downstream signaling, whereas sST2 binds only with IL-33.13,20,28 Our ST2/IL-33 AlphaLISA assay measured the inhibition of our compounds to sST2 and IL-33 binding. To make a direct comparison, we developed an AlphaLISA assay to determine the binding between IL-33 and the ST2/IL1RAcP complex to estimate the inhibition of our compounds to membrane ST2. Based on the AlphaLISA assays, IL-33 had similar binding activities to sST2 and ST2/IL1RAcP, with IC50 values of 1.30 ± 0.04 and 1.06 ± 0.30 nM, respectively (Figure 2). Our most effective compound, 32 (or XY52), showed ∼11-fold selectivity between sST2 and ST2/IL1RAcP, giving IC50 values of 5.68 ± 1.86 and 64.3 ± 3.2 μM, respectively (Figure 2). To further validate the assay, we examined 2 and 3 from our previous study.26 Compound 2 was a close analogue of iST2-1 and had an improved PK profile over iST2-1, whereas 3 had a weak inhibitory activity (Figure 1). We found the IC50 values of 2 were 19.6 ± 8.8 and 66.6 ± 9.7 μM to sST2 and ST2/IL1RAcP, respectively (Figure 2). The weak control, compound 3, had a much weaker inhibition activity to ST2/IL1RAcP than to either 2 or 32 (Figure 2), consistent with other data from our assays. Our biochemical binding assay suggested that our ST2 inhibitors inhibited more effectively the binding of IL-33 with sST2 than membrane ST2 bound with IL1RAcP. The differential inhibition activities of our compounds may facilitate the release of IL-33 sequestered by sST2 relative to membrane ST2 especially when sST2 is in large excess.
Figure 2.
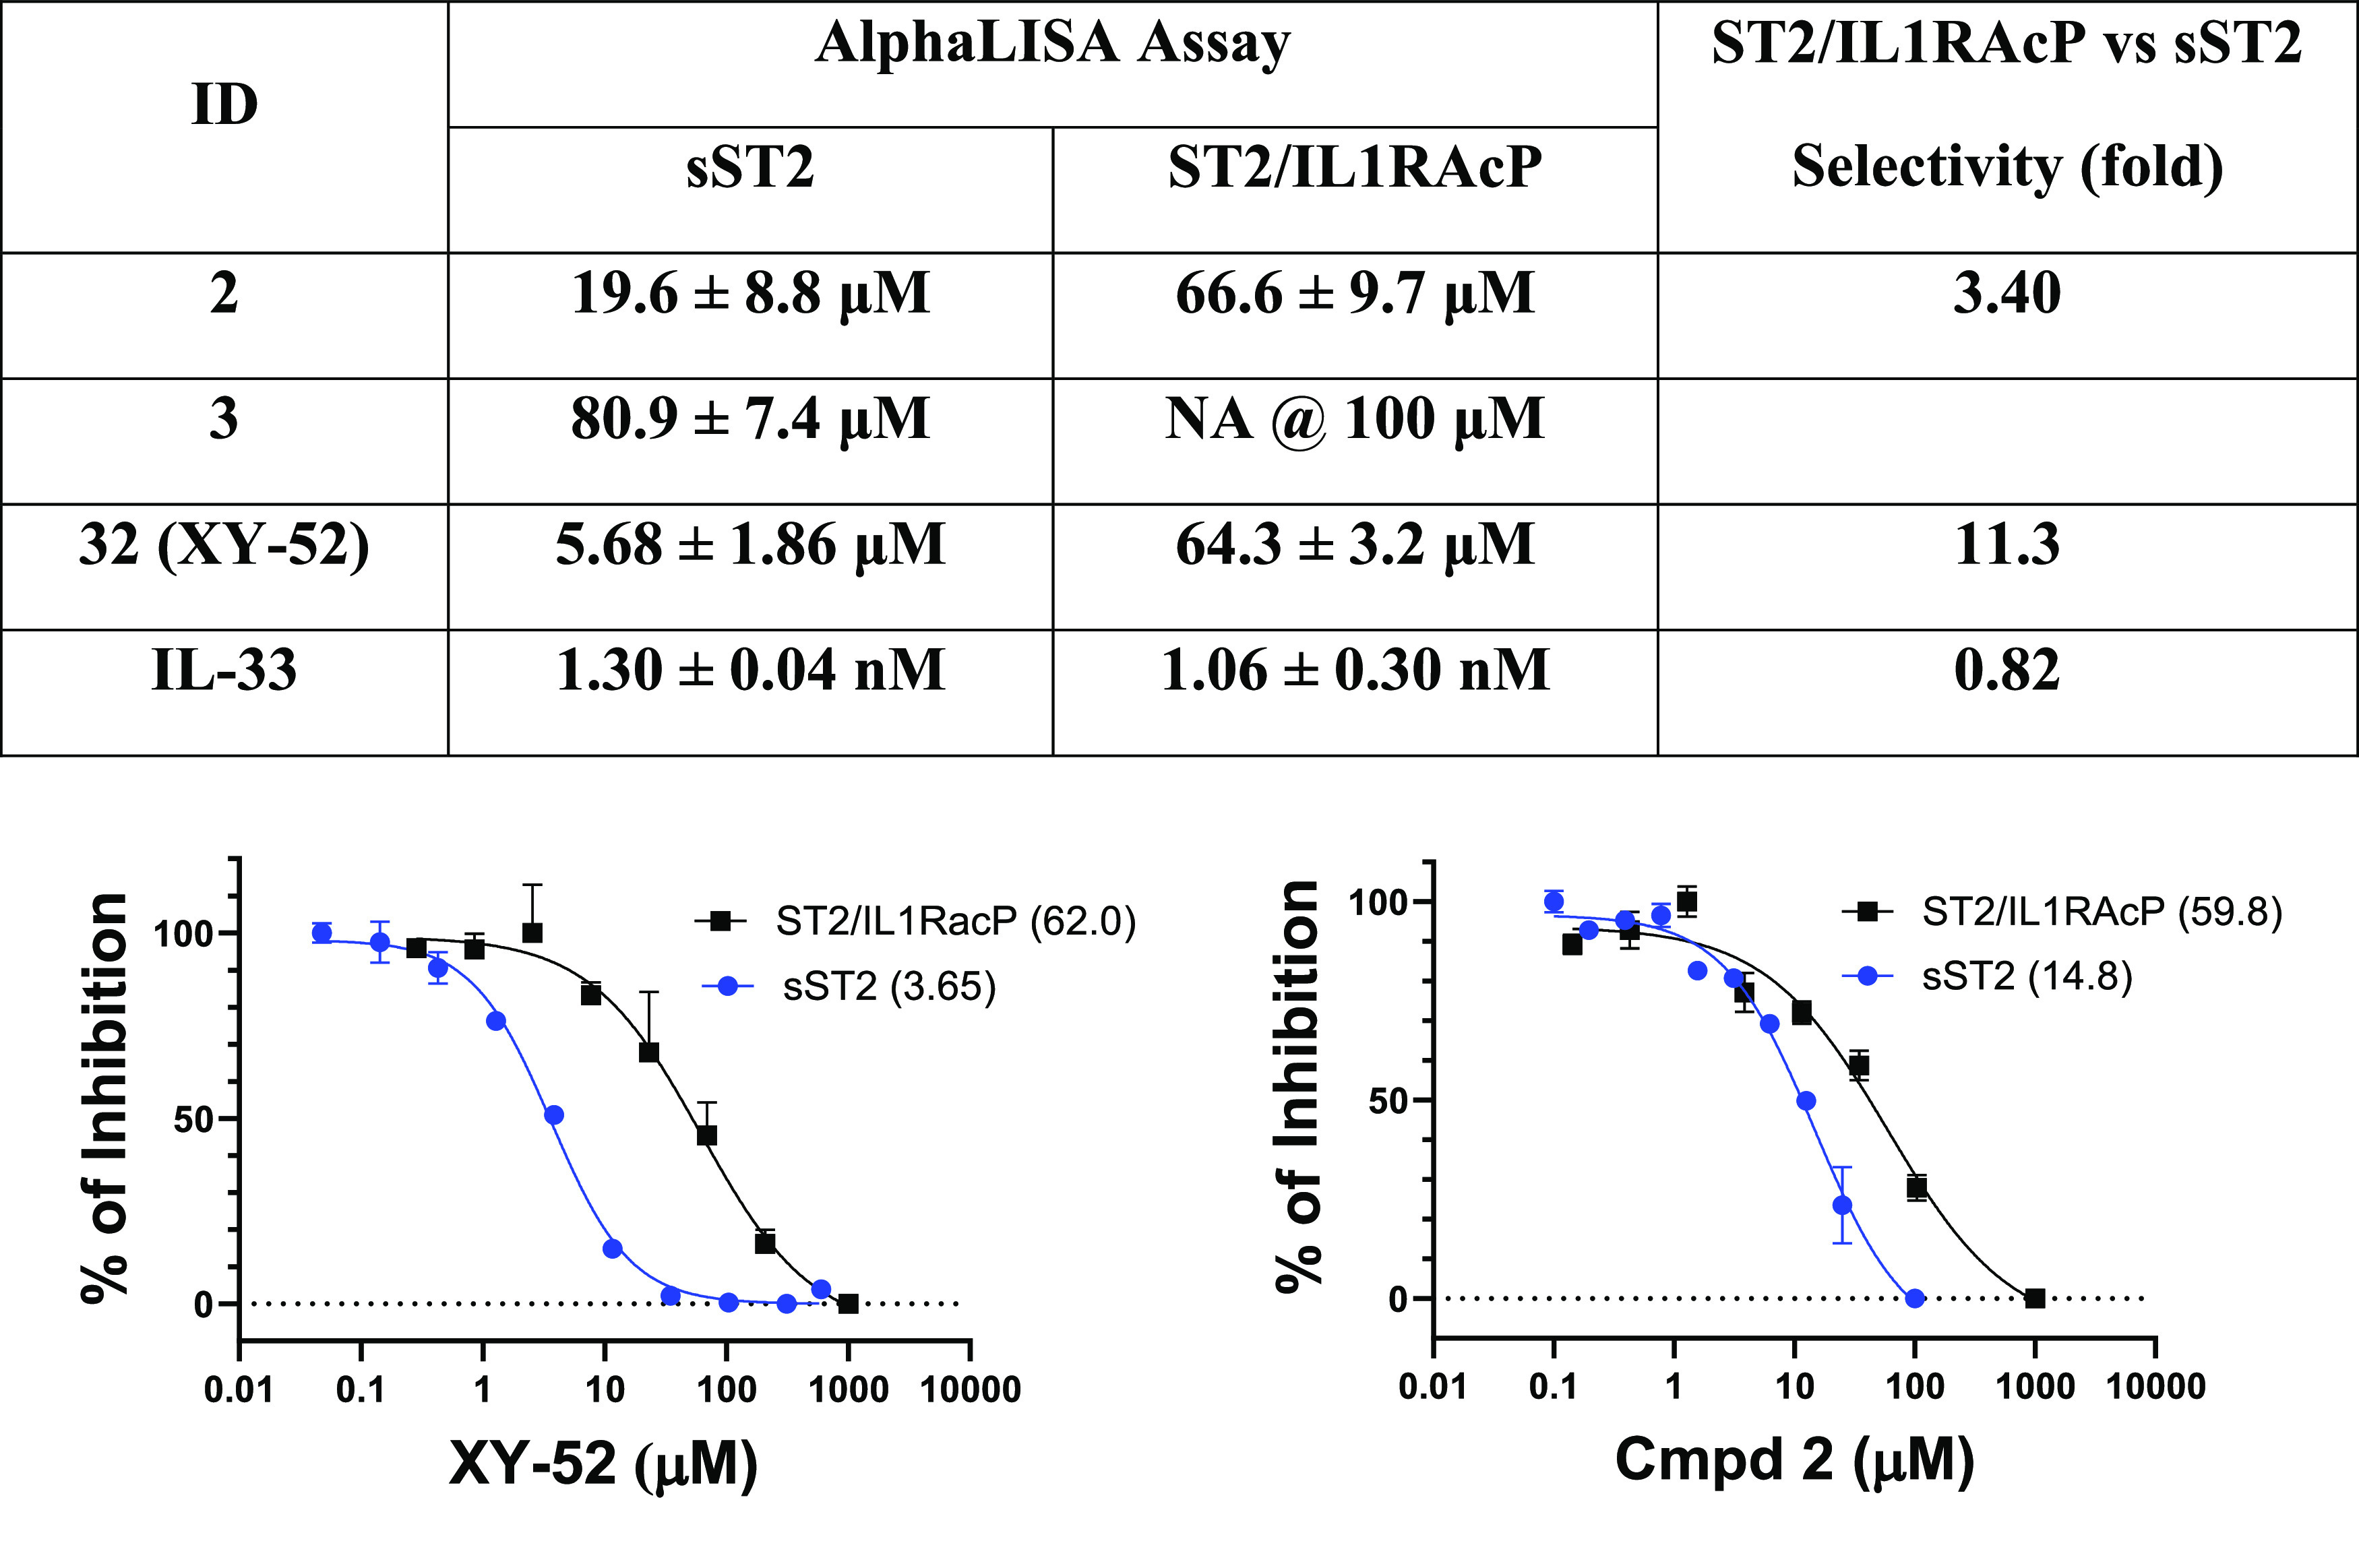
Selectivity of IL-33, 2, 3, and XY52 to sST2 and ST2/IL1RAcP based on the AlphaLISA assay. Representative titration curves of 2 and 32 (or XY52) from the AlphaLISA assay are shown. IC50 values shown in the parentheses in the titration curves are determined by experiments performed in duplicate, and the average IC50 values listed in the table are calculated from two independent experiments except for 3 in ST2/IL1RAcP.
In Vitro Effect of ST2 Inhibitors on T-Cell Proliferation in a Mixed Lymphocyte Reaction Assay
To functionally validate the activities of our new ST2 inhibitors, we examined four representative compounds (23, 24, 26, and 32), a positive control compound 2, and a weak compound 3 (or negative control, Figure 1) in an in vitro mixed lymphocyte reaction (MLR) experiment. The activity of 4 in the MLR was weaker than that of 2 from our previous study26 and was thus not included as the positive control here. In the MLR experiment, T cells from the spleen in C57BL/6 mice (responder) were mixed with irradiated T-cell-depleted splenocytes from C3H.SW mice (stimulator) to induce the allo-reaction of T cells to model the initiation of GVHD in vitro. All four new ST2 inhibitors induced dose-dependent reductions in CD4+ and CD8+ T-cell proliferation and had better activities than 2 at 5 and 10 μM, whereas the negative control, 3, had no effects (Figures 3, S1). Similar to 2, all compounds also promoted CD4+ Foxp3+ Treg cell expansion, and more pronounced changes relative to the dimethyl sulfoxide (DMSO) control were found in 24, 26, and 32 (Figure S1). Similar to our previous study,25 we found no significant toxicity to human peripheral blood mononuclear cells (PBMCs) from healthy donors of these four compounds at 10 μM (about the average IC50 value based on the AlphaLISA assay and ∼2-fold higher than the average IC50 value based on the HEK-Blue assay). Specifically, >77% of human PBMC was viable after 20 h of treatment of these four new compounds (Figure 3).
Figure 3.

Proliferation of CFSElow CD4+, CD8+, and CD4+Foxp3+ T cells after treatment with select ST2 inhibitors in the MLR experiment. The data are collected after 7 days of incubation with each inhibitor at 1, 5, and 10 μM, and experiments are performed in duplicate. Compound 2 is a positive ST2 inhibitor developed from a previous work, whereas 3 is a weaker ST2 inhibitor and is considered a negative control in this experiment. The significances of changes in the T-cell population between DMSO and ST2 inhibitors at 10 μM are calculated using an unpaired t test. ns: p > 0.05, *p < 0.05, **p < 0.01. The IC50 values of the four compounds and the viability of human PBMCs after 20 h of inhibitor treatment at 10 μM are listed.
In Vivo Metabolic Stability and Pharmacokinetic Parameters
Data from an in vitro assessment indicated that 32 had better activity and metabolic stability than 4 developed from our previous study.26 We then determined the in vivo pharmacokinetic (PK) profile of 32 and compared it with that of our lead, iST2-1. The t1/2 of 32 in mice was greater than 7 h (much longer than t1/2 = 1.42 h of iST2-1), but the AUC0–7hobs of 32 was 2-fold lower than that of iST2-1 (Table S3). Compound 32 also had a modest oral bioavailability at 36.5%. When the tissue distribution in the GVHD-targeted organs was examined, 32 had a relatively higher exposure in the spleen, liver, and lung than iST2-1 (Table S3). Accumulation of 32 at these GVHD-targeted organs may serve as a compound reservoir for release when these organs are damaged during GVHD progression.
In Vivo Study of ST2 Inhibitors in the Minor-Mismatched (BoyJ → C3H.SW) GVHD Model
To determine the in vivo efficacy of our new ST2 inhibitors, we used a well-established preclinical minor-mismatched GVHD model. In this model, T cells and T-cell-depleted bone marrow cells from C57BL/6 with congenic marker CD45.1 (BoyJ) mice, enabling donor T-cell tracking, were transplanted into irradiated C3H.SW mice to induce GVHD. Compound 2 with relatively higher activity and longer in vivo t1/2 was selected for comparison in this work (Figure 1). We used a 21-day prophylactic treatment schedule for the mice that were administered with the vehicle, 2, and 32 (40 mg/kg, i.p., BID), respectively, similar to our previous dosing schedule25 (Figure 4A). Up to day 28 post HCT, we observed no induced adverse toxicity of 2 and 32 to the mice because no significant mice weight changes were found between the treatment and vehicle groups (Figure 4B). Of note, the vehicle group still exhibited moderate-to-severe GVHD, leading to 100% mortality on day 47. Both compounds mitigated the severity of GVHD symptoms relative to the control group (Figure 4C). Between 2 and 32, the GVHD scores of the mice treated with 32 were significantly reduced relative to those of the mice treated with 2. Additionally, mice treated with either 2 or 32 had a longer survival than the control group (Figure 4D). Although most mice treated with 2 died on day 72, all mice treated with 32 survived up to day 78, which is the end of the experiment (Figure 3D).
Figure 4.

Treatment schedule, mouse weight changes, GVHD scores, and survival in the minor-mismatched (BoyJ → C3H.SW) GVHD model treated with 2 and 32 (XY52). Treatment of vehicle, 2, and 32 starts on day -1 before HCT and continues at a daily dose of 40 mg/kg BID via the i.p. route until day 20 post HCT. The GVHD scores and survival are monitored until the end of the experiment on day 80 post HCT. Ten mice are used in each group in the experiment. p values are calculated for GVHD scores by the t test and for survival by the log-rank test. *p < 0.05, **p < 0.01, ***p < 0.001.
To examine the effects of 2 and 32 (XY52) on GVHD-associated organ damage, we collected the tissues of the liver and small and large intestines from mice 22 days post HCT after the completion of inhibitor treatment for histopathology analysis. Tissue damage scores were calculated in mice receiving either 2 or 32 treatment (Figures 5 and S2), which were lower than the vehicle, and the trend paralleled their GVHD scores (Figure 4C). Although most of the tissue damage scores in mice treated with 2 were lower than those of the vehicle group, inflammatory cell infiltration to the small and large intestinal epithelium was comparable (Figures 5 and S2). A more pronounced reduction of the tissue damage scores in three organs was observed in the 32-treated group, including a marked reduction of lymphocyte infiltration and apoptosis to both small and large intestines (Figures 5 and S2). Additional features indicating GVHD mitigation included the reduction of inflammatory cell infiltration to liver tissues, vascular endothelialitis, lamina propria inflammation, and epithelial apoptosis to both small and large intestinal epithelial tissues (Figures 5 and S2). Taken together, the histopathology analyses of the liver and small and large intestines in mice treated with 2, 32, and vehicle were consistent with the standard GVHD score and the mice survival data.
Figure 5.
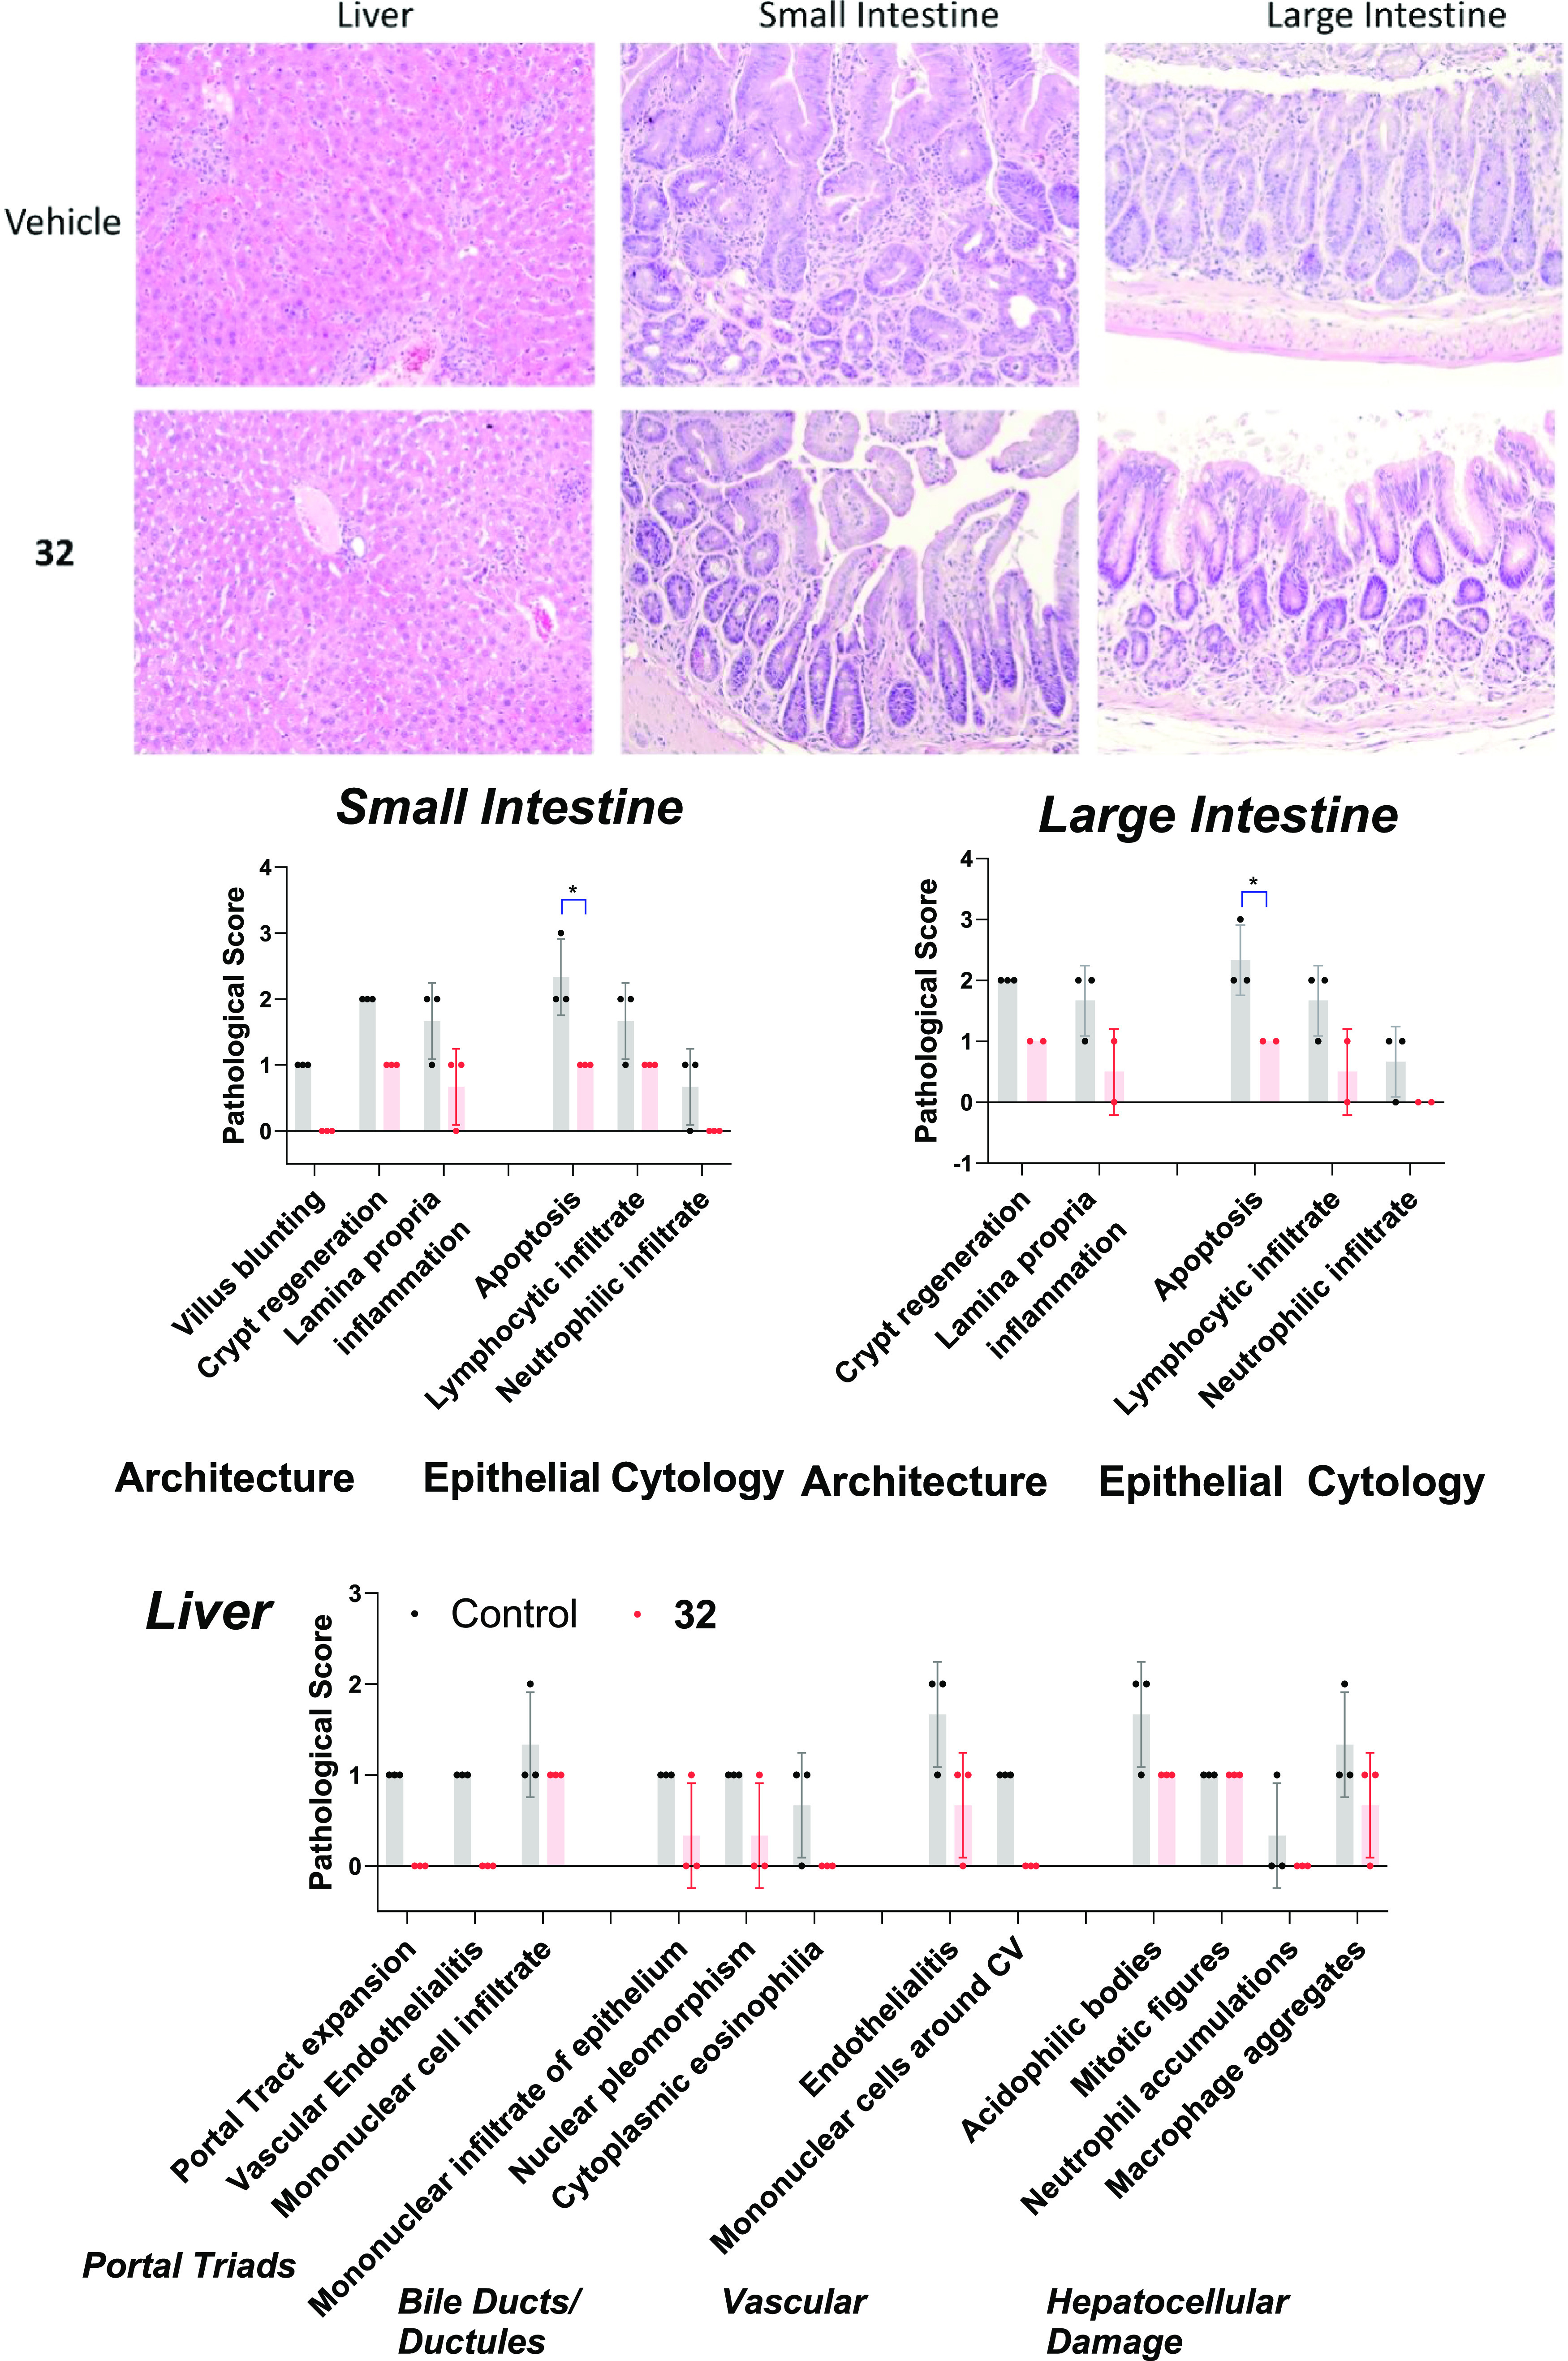
Histopathology of the liver, small intestine, and large intestine in mice treated with the control and 32. Representative hematoxylin and eosin (H&E) images at a magnification of 200×. Pathology scores of each sample (maximum 3) and the standard deviations in mice treated with the control (black dots) and 32 (red dots) are displayed in bar plots. *p ≤ 0.05.
To study the impact on cytokine biomarkers by our ST2 inhibitors, we collected the plasma of the mice on days 7 and 21 post HCT. As shown in Figure 6A, plasma sST2, the GVHD biomarker, was significantly reduced in mice treated with 2 or 32 compared to vehicle-treated mice on days 7 and 21. In addition, the plasma level of proinflammatory IFN-γ in 2- or 32-treated mice decreased on day 7 and more significantly on day 21 (Figure 6B). To study the frequency of effector T cells in these organs, we collected the gastrointestinal (GI) tract and liver tissues from three mice on day 21 post HCT to perform an ex vivo analysis. Note that, donor T cells were CD45.1+ and the ex vivo T-cell analysis represented T cells of the donor origin. Figure 6C shows that treatment of 2 and 32 led to a reduction of the total T cells in the GI tract on day 21. Both 2 and 32 had modest effects on reducing proinflammatory CD4+Tbet+ (Th1) and CD8+Tbet+ frequencies in the GI tract. Between both compounds, 32 markedly reduced the activation of CD4+Tbet+ and CD8+Tbet+ cells compared to the vehicle-treated mice, reflected by the decreased frequencies of IFN-γ producing CD4+ and CD8+ T cells, indicative of the decreased proinflammatory T-cell proliferation (Figure 6F and G). We also found that 2 and 32 decreased the frequencies of CD4+IL-17A+ cells (Th17) in the GI tract on day 21 (Figure 6H). While the overall immune-tolerant CD4+ FoxP3+ Tregs increased in either 2- or 32-treated mice compared with the vehicle group (Figure 6I), more pronounced increased ST2+FoxP3+ Tregs cells in the GI tract were detected in mice treated with either 2 or 32 (Figure 6J). The expansion of the ST2+FoxP3+ subset frequency in the GI tract may be attributed to the stimulation of released IL-33 during the inhibitor treatment up to day 21. Increased frequencies were also found in the activated KLRG1+ST2+FoxP3+ cells (tissue-resident Treg29) and the anti-inflammatory IL-10+ST2+FoxP3+ cells30 (Figure 6K and L). Both KLRG1+ and IL-10+ST2+FoxP3+ cells likely contributed to reducing intestinal damage31 and exerting anti-inflammatory effects30 to reduce GVHD severity.
Figure 6.

Analyses of plasma biomarkers, effector T cells, and immune-tolerant Treg cell population from the minor-mismatched (BoyJ → C3H.SW) GVHD model treated with 2 and 32. (A, B) Levels of plasma biomarkers (sST2, IFNγ) on days 7 and 21 post HCT. (C–L) Ex vivo analyses of CD3ε+ T-cell numbers, CD4+Tbet+ (Th1), CD8+Tbet+(Tc1), CD4+IFNγ+, CD8+IFNγ+, CD4+IL-17A+ (Th17), CD4+Foxp3+ (Treg), ST2+Foxp3+, ST2+Foxp3+KLRG1+, and ST2+Foxp3+IL1-10+ T-cell frequencies in the GI tract on day 21 post HCT. p values are calculated by the unpaired t test. *p < 0.05, **p < 0.01, ***p < 0.001.
Similar trends of T-cell frequencies in the intestine tissue were found in the liver tissue as well. Figure 7 shows the decreased frequencies of proinflammatory IFNγ+ and IL17A+ CD4+ or CD8+ T cells in the liver on day 21 post HCT. Although both 2 and 32 significantly reduced these T-cell populations in the liver as compared with the vehicle, the differences between 2 and 32 were less than those found in the GI tract. The percentage of immune-tolerant CD4+Foxp3+ Treg cells in both 2 and 32 treatment groups decreased slightly relative to the vehicle (not shown), but the percentage of ST2+Foxp3+ Treg cells significantly increased in the liver when treated with 2 (Figure 7D). In summary, these data demonstrated that frequencies of T cells expressing the major proinflammatory IFNγ and IL-17A (activating inflammatory Th1, Th17 cells) were decreased, and the immune-tolerant FoxP3+ and ST2+ positive (responsive to IL-33) Treg cells increased their frequencies in mice treated with our ST2 inhibitors. The ex vivo T-cell population analysis in mice on day 21 post HCT strongly supports the idea that 32 reduced GVHD severity and prolonged mouse survival in the minor-mismatched BoyJ → C3H.SW GVHD mouse model.
Figure 7.

T-cell populations in the liver from the minor-mismatched (BoyJ → C3H.SW) GVHD model treated with 2 and 32. Proinflammatory (A) CD4+IFNγ+, (B) CD8+IFNγ+, (C) CD4+IL-17A+ (Th17), and (D) regulatory ST2+Foxp3+ T-cell frequencies in the liver of mice treated with vehicle, 2, and 32 on day 21 post HCT. p values are calculated by the unpaired t test. *p < 0.05, **p < 0.01, ***p < 0.001.
Chemistry
The compounds described above can be obtained by following the synthetic sequences outlined in Scheme 1. As depicted in Scheme 1A, key intermediate 37 was obtained from commercially available 33 and 34 through the Suzuki–Miyaura coupling reaction, followed by Boc deprotection and the Vilsmeier–Haack reaction. A subsequent reductive amination reaction of 37 and the substituted pyrrolidine (Schemes S1 and S2) provided the final compounds 5–14 and intermediates 38a and 38b.
Scheme 1. Synthesis of Compounds 5–32.
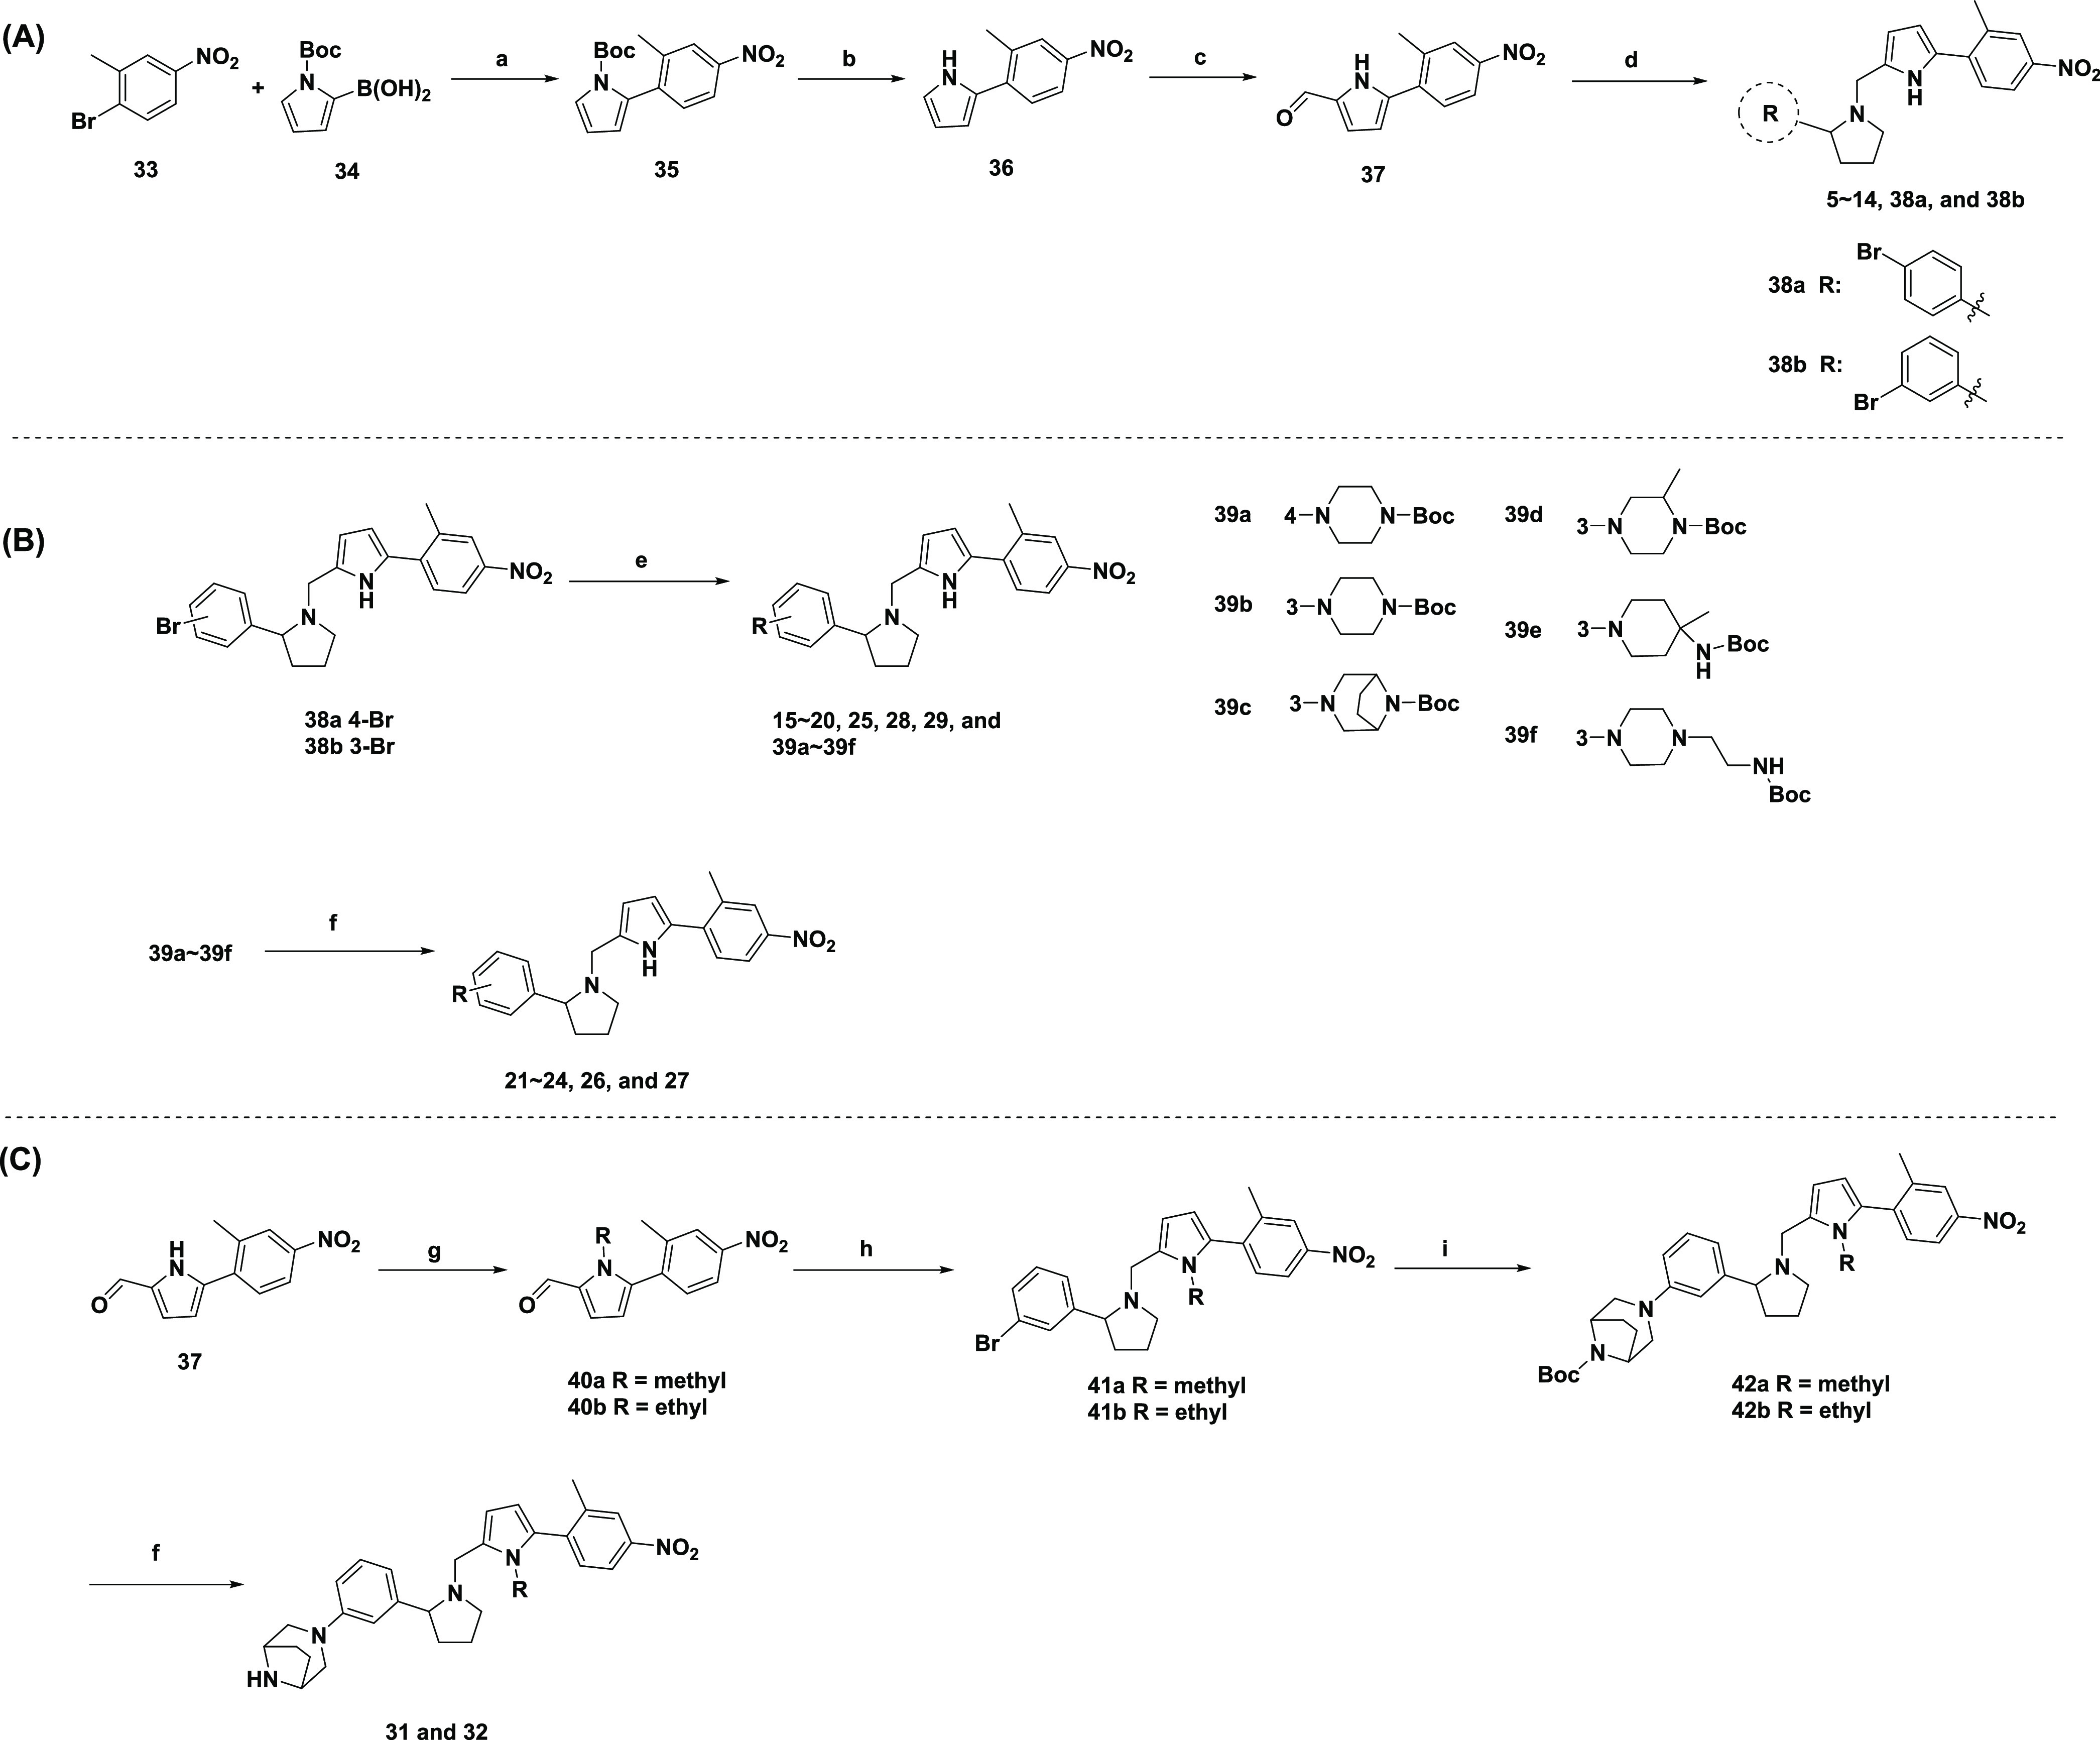
Reagents and conditions: (a) Pd(PPh3)4, Na2CO3, toluene/ethanol/water, 80 °C; (b) CH3ONa, CH3OH/tetrahydrofuran (THF), rt; (c) POCl3, N,N-dimethylformamide (DMF), dichloromethane (DCM), rt; (d) substituted pyrrolidine, NaBH(OAc)3, AcOH, 1,2-dichloroethane (DCE), rt; (e) amine, Pd2(dba)3, Xphos, t-BuOK, toluene, 95 °C; (f) 4 M HCl in dioxane, rt; (g) iodomethane or iodoethane, NaH, DMF, rt; (h) NaBH(OAc)3, AcOH, DCE, rt; (i) 8-boc-3,8-diaza-bicyclo[3.2.1]octane, Pd2(dba)3, Xphos, T-BuOK, toluene, 95 °C.
Compounds 15–29, shown in Scheme 1B, were prepared in two steps starting with the Buchwald–Hartwig cross-coupling reaction of 38a–b with various amines, which were subjected to Boc deprotection. Similar to 23, CF3 substitution of the intermediate 37 by commercially available 2-bromo-5-nitrobenzotrifluoride provided compound 30. As illustrated in Scheme 1C, compounds 31 and 32 were also prepared similarly to 23. 37 was converted to methyl and ethyl intermediates 40a and 40b. Reductive amination reaction provided 41a and 42b, which were subjected to Buchwald–Hartwig cross-coupling reaction and Boc deprotection to afford 31 and 32.
Conclusions
Targeting the protein–protein interaction interface remains a challenging task in drug discovery and development.32 Our previously discovered iST2-1 that blocked the binding between ST2 and IL-3325 represents one of the few small-molecule inhibitors that target cytokine receptors.33 Based on our recently reported compound 4, we obtained 32 (or XY52) exhibiting improved activities in biochemical, cell-based reporter assays and the in vitro MLR experiment that models the allo-reaction of T-cell activation. For the first time, we showed that our compounds had inhibitory activities differential with those of sST2 and ST2 using the biochemical assay that supports our previous hypothesis. XY52 also possesses much improved metabolic stability in vitro and in vivo. In the minor-mismatched GVHD mouse model, XY52 was more effective than 2 in reducing the GVHD score and promoting survival, and both compounds were more protective than the vehicle control. Our in vivo data also showed that both XY52 and 2 also reduced the plasma sST2 and IFNγ biomarkers in the animal GVHD model. Ex vivo analysis of the T-cell population in the intestine, a direct GVHD-targeted organ causing mortality, further indicated a decrease of cytotoxic CD4 and CD8 T cells and an increase of activated immune-tolerant Treg cells. Although XY52 showed very promising protective effects in our GVHD model, whether XY52 can preserve the GVL effects in HCT similar to iST2-1(25) needs to be evaluated. Further optimization of XY52 to improve its potency and pharmacokinetic properties is still needed.
Besides targeting ST2, other single-agent therapeutic strategies to improve the success of HCT have been reported, including ruxolitnib and perforin inhibitors. Ruxolitinib targets JAK1/2 by inhibiting a distinctive JAK/STAT pathway from the ST2/IL-33 axis. Perforin inhibitors reduce natural killer cell-mediated killing of bone marrow cells after HCT to improve stem cell engraftment for T-cell reconstitution.34 A potential and untested therapeutic strategy related to our work is to combine our ST2 inhibitors with other types of inhibitors to study their synergistic effects in treating or managing GVHD. In addition, our study demonstrated the prophylactic treatment in which mice received the compound before HCT to reduce GVHD progression. Whether ST2 inhibitors can be an efficacious treatment when sST2 is elevated and GVHD symptoms manifest post HCT needs to be investigated in the future. GVHD remains a primary risk factor for patients receiving allo-HCT. Although therapeutics developed to prevent or manage GVHD progression have grown in recent years,35 nondiscriminative immunosuppressive strategies remain the main regimens for aGVHD in clinics.35 Our ST2 inhibitors potentially offered a novel biomarker-based therapeutic approach to mitigate the uncontrolled inflammatory T-cell activation and proliferation associated with HCT that contributes to GVHD development.
Experimental Section
Enzyme-Linked Immunosorbent Assay (ELISA)
Plasma samples were collected from GVHD mice treated with 2, 32, or a vehicle control on the indicated days. Mouse plasma sST2 and IL-17A were assayed with the Quantikine ELISA kits (R&D Systems). The IFNγ was measured by using the DuoSet ELISA kit (R&D Systems). The specific protocols were carried out according to the manufacturer’s instructions. After the completion of the assay, the plates were read at OD 450 nm using the SpectraMax ABS Plus Plate Reader (Molecular Devices Corporation, CA). The standard curve was prepared with each test.
Cell Culture
The HEK-Blue IL-33 cell line was purchased from InvivoGen (catalog code: hkb-hil33) and was cultured in Dulbecco’s modified Eagle’s medium (DMEM) (4.5 g/L glucose, 2 mM l-glutamine, Gibco) supplemented with 10% heat-inactivated fetal bovine serum (FBS), 1% penicillin/streptomycin, and 100 μg/mL Normocin. Human PBMCs were isolated from healthy donors at the Medical University of South Carolina using Ficoll density gradient centrifugation by following the manufacturing protocol. The RPMI-1640 (Gibco) medium containing 10% FBS and 1% penicillin/streptomycin was used to culture human PBMC. Both cells were grown at 37 °C in a humidified atmosphere containing 5% CO2.
Cytotoxicity Assay
HEK-Blue IL-33 cells (1 × 10⁵) and human PBMC (1 × 10⁵) were plated in 96-well plates. HEK-Blue IL-33 cells were treated for 24 h, and human PBMC cells were treated for 20 h with various concentrations of different compounds followed by the addition of an MTS solution (Promega) to each well for 4 h incubation. The cell viability was then assessed following the manufacturer’s protocol.
Liver Microsomal Stability Studies, Pharmacokinetic Studies in Mice, AlphaLISA ST2/IL-33, ST2/IL1RAcP/IL-33 Binding Assay, HEK-Blue IL-33 Assays, and Mixed Lymphocyte Reaction (MLR)
The procedures to perform these experiments have been described previously.25,26 For the IL-33 and ST2/IL1RAcP AlphaLISA assays, the ST2/IL1RAcP protein (catalog # 11268-CP) was purchased from R&D. We used the same protein concentration of ST2/IL1RAcP as ST2 when performing the AlphaLISA assay.
In Vivo GVHD Animal Experiment
The protocol to construct the minor HA-mismatched GVHD (B6 → C3H.SW) mouse model has been described previously.25 Briefly, C3H.SW recipient mice received total body irradiation (TBI) at a dose of 1100 cGy (137Cs source) on day −1. On day 0, C3H.SW recipient mice were injected intravenously with BoyJ-derived T-cell-depleted BM cells (5 × 10⁶ per mouse) and splenic T cells (1.5 × 10⁶ per mouse) in 100 μL of endotoxin-free PBS. Compounds 2 and 32 were administered to the recipient mice at the dose of 20 mg/kg each time and twice daily (BID, the first dose at 10:00 am, the second one at 6:00 pm) via i.p. injection at the amount of 200 μL of PBS containing either 3% DMSO as the vehicle control or 2, 32 from day –1 to day 20 for a total of 21 days. Survival of each mouse was monitored daily, and the GVHD score was assessed twice each week. Mice that reached a clinical GVHD score of 5.5 were euthanized. All of the protocols of the animal tests are contained in our IACUC (no.: 20-0977), which has been reviewed and approved by the Animal Ethics Committee of the Medical University of South Carolina. We also followed the NIH guidelines regarding the care and use of laboratory animals in this study. Ex vivo T-cell analysis including the gating to identify CD4+, CD8+, Treg+, and the subpopulations has been described previously.25,31
Acknowledgments
The authors thank Dejian Ma for technical assistance in collecting analytical data on the compounds.
Glossary
Abbreviations
- HCT
hematopoietic cell transplantation
- GVHD
graft versus host disease
- ST2
STimulation 2
- IL-1
interleukin 1
- IL-33
interleukin 33
- IFNγ
interferon γ
- MLR
mixed lymphocyte reaction
- Treg
regulatory T cell
- Th1
type 1 helper T cell
- Th2
type 2 helper T cell
- Th17
type 17 helper T cell
- GI
gastrointestinal
- PK
pharmacokinetics
- IV
intravenous
- IP
intraperitoneal
- AUC
area under the curve
- PO
per os or by mouth
Supporting Information Available
The Supporting Information is available free of charge at https://pubs.acs.org/doi/10.1021/acsptsci.3c00122.
Synthetic schemes, chemical data including mass spectra and NMR spectra, purity, HEK-Blue cells viability, PK data, representative flow cytometry plots from MLR experiments, and pathology scores of GVHD-affected organs (PDF)
Author Contributions
△ X.Y. and H.J. contributed equally. X.Y. and J.C.R synthesized the compounds; H.J. and D.F. conducted the MLR assay and GVHD studies; X.Y. and A.R. performed the AlphaLISA assay; X.Y. carried out the HEK-Blue experiment and the MTS assay; K.R., H.Y., M.H., B.W., and D.S. performed and analyzed the PK experiments; C.L. performed the pathology analysis; K.C. and J.A.S. expressed the IL-33 proteins; and C.-Y.Y. and S.P. designed and supervised the study. The manuscript was written through the contributions of all authors. All authors have approved the final version of the manuscript.
The work was supported by R01HL141432 from the National Institute of Health (C.-Y.Y., S.P.) Additional support was provided by the UTHSC College of Pharmacy startup fund (C.-Y.Y.) and the University of Michigan Rogel Cancer Center Core Grant from the National Cancer Institute, NIH (P30 CA046592). The content is solely the responsibility of the authors and does not necessarily represent the official views of the National Institutes of Health.
The authors declare no competing financial interest.
Supplementary Material
References
- Hill G. R.; Betts B. C.; Tkachev V.; Kean L. S.; Blazar B. R. Current Concepts and Advances in Graft-Versus-Host Disease Immunology. Annu. Rev. Immunol. 2021, 39, 19–49. 10.1146/annurev-immunol-102119-073227. [DOI] [PMC free article] [PubMed] [Google Scholar]
- Gratwohl A.; Pasquini M. C.; Aljurf M.; Atsuta Y.; Baldomero H.; Foeken L.; Gratwohl M.; Bouzas L. F.; Confer D.; Frauendorfer K.; Gluckman E.; Greinix H.; Horowitz M.; Iida M.; Lipton J.; Madrigal A.; Mohty M.; Noel L.; Novitzky N.; Nunez J.; Oudshoorn M.; Passweg J.; van Rood J.; Szer J.; Blume K.; Appelbaum F. R.; Kodera Y.; Niederwieser D. One million haemopoietic stem-cell transplants: a retrospective observational study. Lancet Haematol. 2015, 2 (3), e91–e100. 10.1016/S2352-3026(15)00028-9. [DOI] [PubMed] [Google Scholar]
- a Passweg J. R.; Baldomero H.; Chabannon C.; Basak G. W.; de la Cámara R.; Corbacioglu S.; Dolstra H.; Duarte R.; Glass B.; Greco R.; Lankester A. C.; Mohty M.; Peffault de Latour R.; Snowden J. A.; Yakoub-Agha I.; Kröger N.; Marrow T. Hematopoietic cell transplantation and cellular therapy survey of the EBMT: monitoring of activities and trends over 30 years. Bone Marrow Transplant. 2021, 56 (7), 1651–1664. 10.1038/s41409-021-01227-8. [DOI] [PMC free article] [PubMed] [Google Scholar]; b Granot N.; Storb R. History of hematopoietic cell transplantation: challenges and progress. Haematologica 2020, 105 (12), 2716–2729. 10.3324/haematol.2019.245688. [DOI] [PMC free article] [PubMed] [Google Scholar]; c Hooker D. S.; Grabe-Heyne K.; Henne C.; Bader P.; Toumi M.; Furniss S. J. Improved Therapeutic Approaches are Needed to Manage Graft-versus-Host Disease. Clin. Drug Invest. 2021, 41 (11), 929–939. 10.1007/s40261-021-01087-6. [DOI] [PMC free article] [PubMed] [Google Scholar]
- Ferrara J. L.; Levine J. E.; Reddy P.; Holler E. Graft-versus-host disease. Lancet 2009, 373 (9674), 1550–1561. 10.1016/S0140-6736(09)60237-3. [DOI] [PMC free article] [PubMed] [Google Scholar]
- a Henden A. S.; Hill G. R. Cytokines in Graft-versus-Host Disease. J. Immunol. 2015, 194 (10), 4604–4612. 10.4049/jimmunol.1500117. [DOI] [PubMed] [Google Scholar]; b Jiang H.; Fu D.; Bidgoli A.; Paczesny S. T Cell Subsets in Graft Versus Host Disease and Graft Versus Tumor. Front. Immunol. 2021, 12, 761448 10.3389/fimmu.2021.761448. [DOI] [PMC free article] [PubMed] [Google Scholar]
- Zeiser R.; Blazar B. R. Acute Graft-versus-Host Disease - Biologic Process, Prevention, and Therapy. N. Engl. J. Med. 2017, 377 (22), 2167–2179. 10.1056/NEJMra1609337. [DOI] [PMC free article] [PubMed] [Google Scholar]
- Patel D. A.; Crain M.; Pusic I.; Schroeder M. A. Acute Graft-versus-Host Disease: An Update on New Treatment Options. Drugs 2023, 83, 893. 10.1007/s40265-023-01889-2. [DOI] [PubMed] [Google Scholar]
- Mangalmurti N.; Hunter C. A. Cytokine Storms: Understanding COVID-19. Immunity 2020, 53 (1), 19–25. 10.1016/j.immuni.2020.06.017. [DOI] [PMC free article] [PubMed] [Google Scholar]
- O’Shea J. J.; Plenge R. JAK and STAT signaling molecules in immunoregulation and immune-mediated disease. Immunity 2012, 36 (4), 542–550. 10.1016/j.immuni.2012.03.014. [DOI] [PMC free article] [PubMed] [Google Scholar]
- Abboud R.; Choi J.; Ruminski P.; Schroeder M. A.; Kim S.; Abboud C. N.; DiPersio J. F. Insights into the role of the JAK/STAT signaling pathway in graft-versus-host disease. Ther. Adv. Hematol. 2020, 11, 2040620720914489 10.1177/2040620720914489. [DOI] [PMC free article] [PubMed] [Google Scholar]
- Seif F.; Khoshmirsafa M.; Aazami H.; Mohsenzadegan M.; Sedighi G.; Bahar M. The role of JAK-STAT signaling pathway and its regulators in the fate of T helper cells. Cell Commun. Signaling 2017, 15 (1), 23 10.1186/s12964-017-0177-y. [DOI] [PMC free article] [PubMed] [Google Scholar]
- Boraschi D.; Italiani P.; Weil S.; Martin M. U. The family of the interleukin-1 receptors. Immunol. Rev. 2018, 281 (1), 197–232. 10.1111/imr.12606. [DOI] [PubMed] [Google Scholar]
- Dinarello C. A. Overview of the IL-1 family in innate inflammation and acquired immunity. Immunol. Rev. 2018, 281 (1), 8–27. 10.1111/imr.12621. [DOI] [PMC free article] [PubMed] [Google Scholar]
- Vander Lugt M. T.; Braun T. M.; Hanash S.; Ritz J.; Ho V. T.; Antin J. H.; Zhang Q.; Wong C. H.; Wang H.; Chin A.; Gomez A.; Harris A. C.; Levine J. E.; Choi S. W.; Couriel D.; Reddy P.; Ferrara J. L.; Paczesny S. ST2 as a marker for risk of therapy-resistant graft-versus-host disease and death. N. Engl. J. Med. 2013, 369 (6), 529–539. 10.1056/NEJMoa1213299. [DOI] [PMC free article] [PubMed] [Google Scholar]
- a Levine J. E.; Braun T. M.; Harris A. C.; Holler E.; Taylor A.; Miller H.; Magenau J.; Weisdorf D. J.; Ho V. T.; Bolanos-Meade J.; Alousi A. M.; Ferrara J. L. A prognostic score for acute graft-versus-host disease based on biomarkers: a multicentre study. Lancet Haematol. 2015, 2 (1), e21–29. 10.1016/S2352-3026(14)00035-0. [DOI] [PMC free article] [PubMed] [Google Scholar]; b Choe H.; Ferrara J. L. M. New therapeutic targets and biomarkers for acute graft-versus-host disease (GVHD). Expert Opin. Ther. Targets 2021, 25, 761. 10.1080/14728222.2021.1992383. [DOI] [PMC free article] [PubMed] [Google Scholar]; c Ponce D. M.; Hilden P.; Mumaw C.; Devlin S. M.; Lubin M.; Giralt S.; Goldberg J. D.; Hanash A.; Hsu K.; Jenq R.; Perales M. A.; Sauter C.; van den Brink M. R.; Young J. W.; Brentjens R.; Kernan N. A.; Prockop S. E.; O’Reilly R. J.; Scaradavou A.; Paczesny S.; Barker J. N. High day 28 ST2 levels predict for acute graft-versus-host disease and transplant-related mortality after cord blood transplantation. Blood 2015, 125 (1), 199–205. 10.1182/blood-2014-06-584789. [DOI] [PMC free article] [PubMed] [Google Scholar]; d Abu Zaid M.; Wu J.; Wu C.; Logan B. R.; Yu J.; Cutler C.; Antin J. H.; Paczesny S.; Choi S. W. Plasma biomarkers of risk for death in a multicenter phase 3 trial with uniform transplant characteristics post-allogeneic HCT. Blood 2017, 129 (2), 162–170. 10.1182/blood-2016-08-735324. [DOI] [PMC free article] [PubMed] [Google Scholar]; e Paczesny S. Post-haematopoietic cell transplantation outcomes: why ST2 became a ‘golden nugget’ biomarker. Br. J. Haematol. 2021, 192 (6), 951–967. 10.1111/bjh.16497. [DOI] [PMC free article] [PubMed] [Google Scholar]
- a Cayrol C.; Girard J.-P. Interleukin-33 (IL-33): A critical review of its biology and the mechanisms involved in its release as a potent extracellular cytokine. Cytokine 2022, 156, 155891 10.1016/j.cyto.2022.155891. [DOI] [PubMed] [Google Scholar]; b Molofsky A. B.; Savage A. K.; Locksley R. M. Interleukin-33 in Tissue Homeostasis, Injury, and Inflammation. Immunity 2015, 42 (6), 1005–1019. 10.1016/j.immuni.2015.06.006. [DOI] [PMC free article] [PubMed] [Google Scholar]
- Schmitz J.; Owyang A.; Oldham E.; Song Y.; Murphy E.; McClanahan T. K.; Zurawski G.; Moshrefi M.; Qin J.; Li X.; Gorman D. M.; Bazan J. F.; Kastelein R. A. IL-33, an interleukin-1-like cytokine that signals via the IL-1 receptor-related protein ST2 and induces T helper type 2-associated cytokines. Immunity 2005, 23 (5), 479–490. 10.1016/j.immuni.2005.09.015. [DOI] [PubMed] [Google Scholar]
- a Wynn T. A. Type 2 cytokines: mechanisms and therapeutic strategies. Nat. Rev. Immunol. 2015, 15 (5), 271–282. 10.1038/nri3831. [DOI] [PubMed] [Google Scholar]; b Gieseck R. L.; Wilson M. S.; Wynn T. A. Type 2 immunity in tissue repair and fibrosis. Nat. Rev. Immunol. 2018, 18 (1), 62–76. 10.1038/nri.2017.90. [DOI] [PubMed] [Google Scholar]
- a Biton J.; Khaleghparast Athari S.; Thiolat A.; Santinon F.; Lemeiter D.; Herve R.; Delavallee L.; Levescot A.; Roga S.; Decker P.; Girard J. P.; Herbelin A.; Boissier M. C.; Bessis N. In Vivo Expansion of Activated Foxp3+ Regulatory T Cells and Establishment of a Type 2 Immune Response upon IL-33 Treatment Protect against Experimental Arthritis. J. Immunol. 2016, 197 (5), 1708–1719. 10.4049/jimmunol.1502124. [DOI] [PubMed] [Google Scholar]; b Dinarello C. A. Immunological and inflammatory functions of the interleukin-1 family. Annu. Rev. Immunol. 2009, 27, 519–550. 10.1146/annurev.immunol.021908.132612. [DOI] [PubMed] [Google Scholar]; c Dinarello C. A. Overview of the interleukin-1 family of ligands and receptors. Semin. Immunol. 2013, 25 (6), 389–393. 10.1016/j.smim.2013.10.001. [DOI] [PubMed] [Google Scholar]
- Griesenauer B.; Paczesny S. The ST2/IL-33 Axis in Immune Cells during Inflammatory Diseases. Front. Immunol. 2017, 8, 475. 10.3389/fimmu.2017.00475. [DOI] [PMC free article] [PubMed] [Google Scholar]
- a Broch K.; Ueland T.; Yndestad A.; Aukrust P.; Gullestad L. Heart failure biomarkers: focus on interleukin-1 receptor-like 1-based blood tests. Drugs Today 2012, 48 (7), 479–491. 10.1358/dot.2012.48.7.1811719. [DOI] [PubMed] [Google Scholar]; b Ciccone M. M.; Cortese F.; Gesualdo M.; Riccardi R.; Di Nunzio D.; Moncelli M.; Iacoviello M.; Scicchitano P. A novel cardiac bio-marker: ST2: a review. Molecules 2013, 18 (12), 15314–15328. 10.3390/molecules181215314. [DOI] [PMC free article] [PubMed] [Google Scholar]
- a Beltrán C. J.; Nunez L. E.; Diaz-Jimenez D.; Farfan N.; Candia E.; Heine C.; Lopez F.; Gonzalez M. J.; Quera R.; Hermoso M. A. Characterization of the novel ST2/IL-33 system in patients with inflammatory bowel disease. Inflammatory Bowel Dis. 2010, 16 (7), 1097–1107. 10.1002/ibd.21175. [DOI] [PubMed] [Google Scholar]; b Pastorelli L.; Garg R. R.; Hoang S. B.; Spina L.; Mattioli B.; Scarpa M.; Fiocchi C.; Vecchi M.; Pizarro T. T. Epithelial-derived IL-33 and its receptor ST2 are dysregulated in ulcerative colitis and in experimental Th1/Th2 driven enteritis. Proc. Natl. Acad. Sci. U.S.A. 2010, 107 (17), 8017–8022. 10.1073/pnas.0912678107. [DOI] [PMC free article] [PubMed] [Google Scholar]
- Lin Y. H.; Zhang R. C.; Hou L. B.; Wang K. J.; Ye Z. N.; Huang T.; Zhang J.; Chen X.; Kang J. S. Distribution and clinical association of plasma soluble ST2 during the development of type 2 diabetes. Diabetes Res. Clin. Pract. 2016, 118, 140–145. 10.1016/j.diabres.2016.06.006. [DOI] [PubMed] [Google Scholar]
- Zhang J.; Ramadan A. M.; Griesenauer B.; Li W.; Turner M. J.; Liu C.; Kapur R.; Hanenberg H.; Blazar B. R.; Tawara I.; Paczesny S. ST2 blockade reduces sST2-producing T cells while maintaining protective mST2-expressing T cells during graft-versus-host disease. Sci. Transl. Med. 2015, 7 (308), 308ra160 10.1126/scitranslmed.aab0166. [DOI] [PMC free article] [PubMed] [Google Scholar]
- Ramadan A. M.; Daguindau E.; Rech J. C.; Chinnaswamy K.; Zhang J.; Hura G. L.; Griesenauer B.; Bolten Z.; Robida A.; Larsen M.; Stuckey J. A.; Yang C. Y.; Paczesny S. From proteomics to discovery of first-in-class ST2 inhibitors active in vivo. JCI Insight 2018, 3 (14), e99208 10.1172/jci.insight.99208. [DOI] [PMC free article] [PubMed] [Google Scholar]
- Yuan X.; Jiang H.; Fu D.; Robida A.; Rajanayake K.; Yuan H.; Wen B.; Sun D.; Watch B. T.; Chinnaswamy K.; Stuckey J. A.; Paczesny S.; Rech J. C.; Yang C.-Y. Structure-Activity relationship of 1-(Furan-2ylmethyl)Pyrrolidine-Based Stimulation-2 (ST2) inhibitors for treating graft versus host disease. Biorg. Med. Chem. 2022, 71, 116942 10.1016/j.bmc.2022.116942. [DOI] [PMC free article] [PubMed] [Google Scholar]
- Smith D. A.; Beaumont K.; Maurer T. S.; Di L. Relevance of Half-Life in Drug Design. J. Med. Chem. 2018, 61 (10), 4273–4282. 10.1021/acs.jmedchem.7b00969. [DOI] [PubMed] [Google Scholar]
- Fields J. K.; Gunther S.; Sundberg E. J. Structural Basis of IL-1 Family Cytokine Signaling. Front. Immunol. 2019, 10, 1412. 10.3389/fimmu.2019.01412. [DOI] [PMC free article] [PubMed] [Google Scholar]
- a Panduro M.; Benoist C.; Mathis D. Tissue Tregs. Annu. Rev. Immunol. 2016, 34 (1), 609–633. 10.1146/annurev-immunol-032712-095948. [DOI] [PMC free article] [PubMed] [Google Scholar]; b Delacher M.; Imbusch C. D.; Weichenhan D.; Breiling A.; Hotz-Wagenblatt A.; Träger U.; Hofer A.-C.; Kägebein D.; Wang Q.; Frauhammer F.; Mallm J.-P.; Bauer K.; Herrmann C.; Lang P. A.; Brors B.; Plass C.; Feuerer M. Genome-wide DNA-methylation landscape defines specialization of regulatory T cells in tissues. Nat. Immunol. 2017, 18 (10), 1160–1172. 10.1038/ni.3799. [DOI] [PMC free article] [PubMed] [Google Scholar]; c Schiering C.; Krausgruber T.; Chomka A.; Fröhlich A.; Adelmann K.; Wohlfert E. A.; Pott J.; Griseri T.; Bollrath J.; Hegazy A. N.; Harrison O. J.; Owens B. M. J.; Löhning M.; Belkaid Y.; Fallon P. G.; Powrie F. The alarmin IL-33 promotes regulatory T-cell function in the intestine. Nature 2014, 513 (7519), 564–568. 10.1038/nature13577. [DOI] [PMC free article] [PubMed] [Google Scholar]
- a Maynard C. L.; Harrington L. E.; Janowski K. M.; Oliver J. R.; Zindl C. L.; Rudensky A. Y.; Weaver C. T. Regulatory T cells expressing interleukin 10 develop from Foxp3+ and Foxp3– precursor cells in the absence of interleukin 10. Nat. Immunol. 2007, 8 (9), 931–941. 10.1038/ni1504. [DOI] [PubMed] [Google Scholar]; b Jankovic D.; Kugler D. G.; Sher A. IL-10 production by CD4+ effector T cells: a mechanism for self-regulation. Mucosal Immunol. 2010, 3 (3), 239–246. 10.1038/mi.2010.8. [DOI] [PMC free article] [PubMed] [Google Scholar]; c Zhang P.; Hill G. R. Interleukin-10 mediated immune regulation after stem cell transplantation: Mechanisms and implications for therapeutic intervention. Semin. Immunol. 2019, 44, 101322 10.1016/j.smim.2019.101322. [DOI] [PubMed] [Google Scholar]
- Yang J.; Ramadan A.; Reichenbach D. K.; Loschi M.; Zhang J.; Griesenauer B.; Liu H.; Hippen K. L.; Blazar B. R.; Paczesny S. Rorc restrains the potency of ST2+ regulatory T cells in ameliorating intestinal graft-versus-host disease. JCI Insight 2019, 4 (5), e122014 10.1172/jci.insight.122014. [DOI] [PMC free article] [PubMed] [Google Scholar]
- a Lu H.; Zhou Q.; He J.; Jiang Z.; Peng C.; Tong R.; Shi J. Recent advances in the development of protein–protein interactions modulators: mechanisms and clinical trials. Signal Transduction Targeted Ther. 2020, 5 (1), 213. 10.1038/s41392-020-00315-3. [DOI] [PMC free article] [PubMed] [Google Scholar]; b Coleman N.; Rodon J. Taking Aim at the Undruggable. Am. Soc. Clin. Oncol. Educ. Book 2021, (41), e145–e152. 10.1200/EDBK_325885. [DOI] [PubMed] [Google Scholar]; c Zinzalla G.; Thurston D. E. Targeting protein-protein interactions for therapeutic intervention: a challenge for the future. Future Med. Chem. 2009, 1 (1), 65–93. 10.4155/fmc.09.12. [DOI] [PubMed] [Google Scholar]; d Surade S.; Blundell T. L. Structural biology and drug discovery of difficult targets: the limits of ligandability. Chem. Biol. 2012, 19 (1), 42–50. 10.1016/j.chembiol.2011.12.013. [DOI] [PubMed] [Google Scholar]
- Zheng J.; Chen D.; Xu J.; Ding X.; Wu Y.; Shen H. C.; Tan X. Small molecule approaches to treat autoimmune and inflammatory diseases (Part III): Targeting cytokines and cytokine receptor complexes. Bioorg. Med. Chem. Lett. 2021, 48, 128229 10.1016/j.bmcl.2021.128229. [DOI] [PubMed] [Google Scholar]
- a Spicer J. A.; Miller C. K.; O’Connor P. D.; Jose J.; Giddens A. C.; Jaiswal J. K.; Jamieson S. M. F.; Bull M. R.; Denny W. A.; Akhlaghi H.; Trapani J. A.; Hill G. R.; Chang K.; Gartlan K. H. Inhibition of the Cytolytic Protein Perforin Prevents Rejection of Transplanted Bone Marrow Stem Cells in Vivo. J. Med. Chem. 2020, 63 (5), 2229–2239. 10.1021/acs.jmedchem.9b00881. [DOI] [PubMed] [Google Scholar]; b Gartlan K. H.; Jaiswal J. K.; Bull M. R.; Akhlaghi H.; Sutton V. R.; Alexander K. A.; Chang K.; Hill G. R.; Miller C. K.; O’Connor P. D.; Jose J.; Trapani J. A.; Charman S. A.; Spicer J. A.; Jamieson S. M. F. Preclinical Activity and Pharmacokinetic/Pharmacodynamic Relationship for a Series of Novel Benzenesulfonamide Perforin Inhibitors. ACS Pharmacol. Transl. Sci. 2022, 5 (6), 429–439. 10.1021/acsptsci.2c00009. [DOI] [PMC free article] [PubMed] [Google Scholar]
- Zeiser R.; Blazar B. R. Preclinical models of acute and chronic graft-versus-host disease: how predictive are they for a successful clinical translation?. Blood 2016, 127 (25), 3117–3126. 10.1182/blood-2016-02-699082. [DOI] [PMC free article] [PubMed] [Google Scholar]
Associated Data
This section collects any data citations, data availability statements, or supplementary materials included in this article.