Abstract
Background:
Bile acid (BA) is a crucial determinant of the gut microbiome, and cholecystectomy can alter the physiology of BA. Physiological changes in BA resulting from cholecystectomy can also influence the gut microbiome. We aimed to identify the specific taxa associated with perioperative symptoms, including postcholecystectomy diarrhea (PCD), and to evaluate the effect of cholecystectomy on the microbiome by investigating the fecal microbiome of patients with gallstones.
Methods:
We analyzed the fecal samples of 39 patients with gallstones (GS group) and 26 healthy controls (HC group) to evaluate their gut microbiome. We also collected fecal samples from GS group 3 months postcholecystectomy. Symptoms of patients were evaluated before and after cholecystectomy. Further, 16S ribosomal RNA amplification and sequencing were performed to determine the metagenomic profile of fecal samples.
Results:
The microbiome composition of GS differed from that of HC; however, the alpha diversity was not different. No significant microbiome alterations were observed before and after cholecystectomy. Moreover, GS group showed a significantly lower Firmicutes to Bacteroidetes ratio before and after cholecystectomy than the HC group (6.2, P<0.05). The inter-microbiome relationship was lower in GS than in HC and tended to recover 3 months after surgery. Furthermore, ~28.1% (n=9) of patients developed PCD after surgery. The most prominent species among PCD (+) patients was Phocaeicola vulgatus. Compared with the preoperative state, Sutterellaceae, Phocaeicola, and Bacteroidals were the most dominant taxa among PCD (+) patients.
Conclusion:
GS group showed a different microbiome from that of HC; however, their microbiomes were not different 3 months after cholecystectomy. Our data revealed taxa-associated PCD, highlighting the possibility of symptom relief by restoring the gut microbiome.
Keywords: 16S RNA sequencing, cholecystectomy, gallstone, microbiome, postcholecystectomy diarrhea
Introduction
Highlights
Bile acid (BA) is a crucial determinant of the gut microbiome, and cholecystectomy can alter the physiology of BA.
Physiological changes in BA resulting from cholecystectomy can also influence the gut microbiome.
Patients with gallstones showed a different microbiome from that of healthy controls; however, their microbiomes were not different 3 months after cholecystectomy.
Our data revealed taxa-associated PCD, highlighting the possibility of symptom relief by restoring the gut microbiome.
The prevalence of gallstones ranges from 10 to 15% in the United States and Europe. Although 75% of patients with gallstones are asymptomatic, treatment is required if symptoms develop1. Cholecystectomy, the surgical removal of gallbladder (GB), is the standard surgical intervention for treating gallstone diseases2. The GB stores and concentrates the bile which is released into the gastrointestinal tract via the ampulla. Therefore, the secretory function of GB may influence bile composition in the small intestine3.
Bile acid (BA) is a major determinant of the gut microbiome4. Gut bacteria have been linked to gallstone formation, and patients with gallstone-related diseases show a less diverse gut microbiome than healthy individuals5. GB, the BA reservoir, is removed during cholecystectomy. Therefore, BA flows directly into the duodenum after production, regardless of food intake. The physiological changes in BA, resulting from cholecystectomy, can also influence the gut microbiome5. A case–control study reported that patients who underwent cholecystectomy showed alterations in the beta diversity and abundance of Blautia obeum and Veillonella parvula in fecal samples, as compared with the healthy group6.
Furthermore, BA released directly into the intestines stimulates bowel motility, thereby decreasing the gut transit time by 20%7. In the mice model, elevated serotonin levels following cholecystectomy enhance colon motility8. This can result in diarrhea following cholecystectomy9–12. Postcholecystectomy diarrhea (PCD) is a symptom of postcholecystectomy syndrome, and its prevalence is 35.6%13. Whether such symptoms are related to an altered gut microbiome is unknown, and a recent study proposed that dysbiosis of the gut microbiome can play a role in the onset of PCD14.
Cholecystectomy is a surgical intervention that could alter bile physiology, which may have an impact on the gut microbiome and contribute to the onset of PCD. Therefore, we hypothesized that an association existed between PCD and gut microbiome alteration. Furthermore, our knowledge of the role of the gut microbiome in patients with gallstones is limited, and research on postcholecystectomy alterations in the gut microbiome is currently in its nascent stages. Therefore, we aimed to explore the relationship between cholecystectomy-related symptoms and the gut microbiome. Accordingly, we investigated the gut microbiome in patients with gallstones and evaluated the extent of microbiome restoration after cholecystectomy.
Materials and methods
Patients
This prospective, single-center study included patients with gallstones and abdominal symptoms scheduled for cholecystectomy between 1 June 2018 and 31 May 2020. The exclusion criteria were as follows: age less than 20 years, suspected GB malignancy in the preoperative workup, use of antibiotics or probiotics within 3 months before study enrollment, anatomical changes due to prior gastrointestinal surgery, history of inflammatory bowel disease, and history of irritable bowel syndrome (IBS). Furthermore, we enrolled healthy controls (HC group) who visited our center for regular health screening during the study period. Among them, we selected HC confirmed to have no known medical history, normal laboratory test results, and no abnormal findings on imaging workup (computed tomography or ultrasonography). This study was conducted following the reporting guideline of the Strengthening the Reporting of Observational Studies in Epidemiology (STROBE)15 and Strengthening The Reporting Of Cohort Studies in Surgery (STROCSS) criteria16 (Supplemental Digital Content 1, http://links.lww.com/JS9/A607).
Sample collection
Fecal samples from the patients with gallstones (GS group) were collected twice before (1 week before the scheduled operation date) and 3 months after cholecystectomy. The HC group submitted fecal samples only once. All patients were educated on the standard guidelines for fecal sample collection. On the morning of the scheduled visit date to the center, the patients collected ~3 g of their fecal sample at home using an aseptic exclusive stool collector (Stool Nucleic Acid Collection and Preservation Tubes, Catalog number 45660; Norgen Biotek Corp., Ontario, Canada), and stored the obtained sample in a freezer at −20°C immediately after collection17,18. Upon arrival at the center, samples were immediately stored in a −80°C laboratory freezer. The patients completed a questionnaire on abdominal pain and other abdominal symptoms at the time of fecal sample submission. The patients submitted another fecal sample 3 months after surgery by visiting the center and completed a questionnaire about any changes or newly developed symptoms after surgery. The common bile duct reportedly undergoes a physiologic dilatation within a certain period (4–6 months) after cholecystectomy, resulting in the restoration of the bile physiology to its preoperative state19,20. However, only minimal alterations in the microbiome may be observed if sampling was performed at an early time point after the surgery. Therefore, we decided to perform the fecal sampling 3 months after surgery. The collected fecal samples were sent to Macrogen Inc. (Gwangmyung, Korea) for gut microbiome analyses. In the GS group, patients were administered a single dose of preoperative intravenous antibiotic (2 g cefoxitin) 30 mins before the operation.
Study outcome
The primary outcome of this study was to identify the predominant bacterial species in patients with PCD and examine whether these species can predict the occurrence of the associated symptoms. Secondary outcomes included comparing the gut microbiomes of fecal samples before and after cholecystectomy in the GS group and between the GS group (before and after cholecystectomy) and the HC group (Fig. 1). The concept behind this scientific exploration has been illustrated in Supplementary Figure 1 (Supplemental Digital Content 2, http://links.lww.com/JS9/A608). Furthermore, we assessed the variations in the gut microbiome of GS based on typical preoperative biliary colic symptoms. Preoperative biliary colic is defined as acute severe abdominal pain in the right upper quadrant or epigastrium lasting 15–30 min or longer21. PCD is defined as the development of diarrhea more than three times a day for more than 4 weeks in patients with cholecystectomy status.
Figure 1.
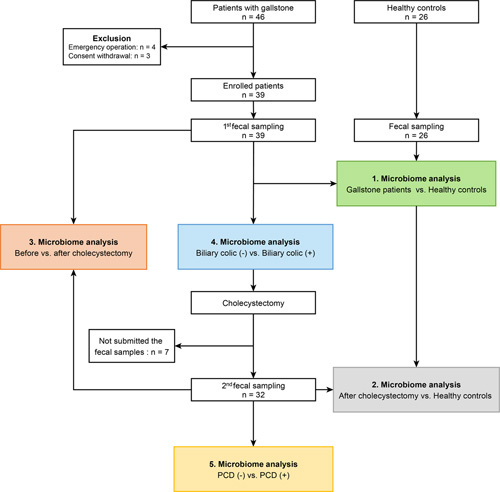
Flow diagram of enrolled patients and schematic study design. PCD, postcholecystectomy diarrhea.
The detailed materials and methods, including sequencing profile and statistical analysis, are provided in Supplementary Methods, Supplemental Digital Content 2, http://links.lww.com/JS9/A608.
Results
Baseline characteristics of the participants
Overall, 39 patients were enrolled, and their preoperative fecal samples were submitted. Seven patients were lost to follow-up, and 32 submitted their fecal samples after surgery (Fig. 1). HC (n=26) included in the study also submitted fecal samples. Their baseline demographics are shown in Table 1. The median age was 47 years in both groups, and 56.5 and 57.7% of the subjects were males in GS and HC groups, respectively (P for all >0.05). All patients were confirmed to have gallstones in the preoperative radiologic evaluation (computed tomography or ultrasonography), and GB polyps and adenomyomatosis were confirmed in 12.8% (n=3) and 23.1% (n=9) of the patients, respectively. The most common surgical approach was laparoscopic cholecystectomy (82.1%, n=32). The postoperative pathology reports confirmed chronic cholecystitis in 87.2% (n=34) and GB wall thickening in 20.5% (n=8) of the patients. Further, 53.8% (n=21) of patients had typical preoperative biliary colic, and 28.1% (n=9) of patients had PCD after GB removal.
Table 1.
Characteristics of patients with cholecystectomy (n=39).
| Variables | Patients with GB stone (n=39) | Healthy controls (n=26) |
|---|---|---|
| Sex, n (%) | ||
| Males | 22 (56.4) | 15 (57.7) |
| Females | 19 (48.7) | 11 (42.3) |
| Age, year, median (range) | 47 (28–71) | 47 (32–70) |
| Body mass index, mean, kg/m2 | 24.7±3.0 | 23.8±2.4 |
| Medical history, n (%) | ||
| Hypertension | 10 (25.6) | |
| Diabetes | 4 (10.3) | |
| Dyslipidemia | 8 (20.5) | |
| Alcohol history, n (%) | ||
| None | 28 (71.8) | 26 (100.0) |
| Social | 7 (17.9) | |
| More than twice a week | 4 (10.3) | |
| Presence of typical biliary colic, n (%) | 21 (53.8) | |
| Radiologic evaluationa (preoperation), n (%) | ||
| GB stone | 39 (100) | |
| GB polyp | 5 (12.8) | |
| GB adenomyomatosis | 9 (23.1) | |
| Chronic cholecystitis | 36 (92.3) | |
| Operation type, n (%) | ||
| Laparoscopic cholecystectomy | 32 (82.1) | |
| Robotic-assisted laparoscopic cholecystectomy | 7 (17.9) | |
| Surgical complication, n (%) | ||
| None | 39 (100.0) | |
| Hospital stay, mean, days | 2.8±0.6 | |
| Pathologic evaluation, n (%) | ||
| Chronic cholecystitis | 34 (87.2) | |
| GB polyp | 6 (15.4) | |
| GB adenomyomatosis | 7 (17.9) | |
| GB wall thickening | 9 (23.1) | |
| GB surface erosion | 32 (82.1) | |
| GB exudate | 2 (5.1) | |
| Presence of postcholecystectomy diarrhea, n (%) | 9 (23.1) | |
| Laboratory parameters (preoperation) | ||
| WBC, median (range) | 6600 (3900–9300) | |
| Total bilirubin, median (range), mg/dL | 0.5 (0.2–1.4) | |
| ALP, median (range), U/L | 66 (32–91) | |
Values are presented as medians (interquartile ranges) for continuous variables or numbers (percentages) for categorical variables.
Radiological evaluation included in abdominal ultrasonography and computed tomography.
ALP, alkaline phosphatase; GB, gall bladder; WBC, white blood cell.
Comparison of gut microbiome between GS (before cholecystectomy) and HC group
In our study, the sequencing depth was sufficient to analyze all samples because all samples reached a plateau in the rarefaction curve (Supplementary Figure 2, Supplemental Digital Content 2, http://links.lww.com/JS9/A608). In alpha diversity, there was no significant difference between the two groups, that is GS (before cholecystectomy) and HC (Fig. 2A). However, unweighted UniFrac PCoA demonstrated a clear separation between GS and HC [PC1=14.21%, analysis of similarities (ANOSIM) R=0.240, P=0.001; Fig. 2B]. Hierarchical clustering heatmaps of Pearson’s correlation coefficients also revealed that the fecal microbiome composition of GS differed from that of HC (Fig. 2C).
Figure 2.
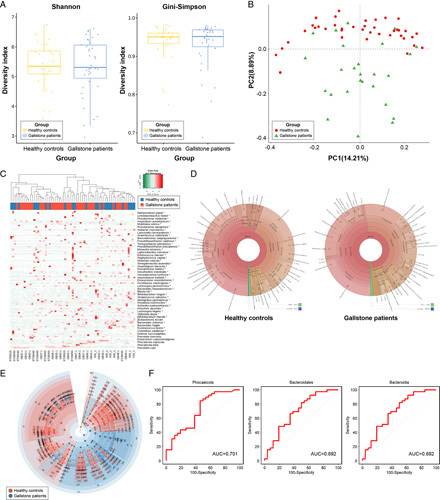
Comparison of the fecal microbiome in patients with gallstones (GS) and healthy controls (HC). (A) Comparison of alpha diversity between the two groups (Shannon and Gini–Simpson indices). (B) Unweighted UniFrac principal coordinate analysis. GS (red dot) versus HC (green dot). (C) Heat map of taxonomic assignment of fecal samples. The colored columns in the upper part of the heat map indicate GS and HC, and those in the lower part of the heat map indicate each participant. Taxonomic abundance is proportional to color intensity (color scale in the upper-left panel of the figure). (D) Krona chart illustrating the differential abundance of bacteria in GS and HC. (E) Cladogram highlighting the distribution of the fecal microbiome with differential abundance. (F) Receiver operating characteristic curves of genera with dominant abundance in the fecal microbiome of GS compared with HC.
Changes in the relative abundance of bacteria between GS and HC are presented in the Krona chart (Fig. 2D) and bar plot (Fig. 3A). At the phylum level, Bacteroidetes [HC vs. GS, mean (standard error): 35.7 (3.7)% vs. 47.8 (2.1)%, P=0.009] and Proteobacteria [2.5 (0.5)% vs. 5.2 (1.0)%, P=0.008] were less abundant in the HC group than in the GS group. In contrast, Firmicutes [55.3 (3.3)% vs. 43.9 (2.1)%, P=0.008) and Actinobacteria [4.3 (1.0)% vs. 0.7 (0.2)%, P<0.001] were more abundant in the HC group than in the GS group (Supplementary Table 1, Supplemental Digital Content 3, http://links.lww.com/JS9/A609). At the species level, Prevotella copri was the most prominent species in GS [18.1 (3.3)%]. The F/B ratio was significantly higher in the HC group than in the GS group before cholecystectomy (6.2 vs. 1.1, P=0.012; Fig. 4).
Figure 3.
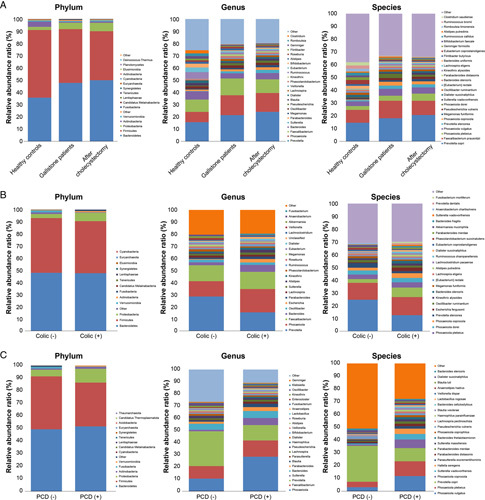
Relative abundance of bacteria at the phylum, genus, and species level. (A) Healthy controls versus patients with gallstones versus after cholecystectomy. (B) Presence of typical biliary colic symptoms before cholecystectomy. (C) Presence of postcholecystectomy diarrhea 3 months after cholecystectomy. The top 15 bacteria detected at the three levels (phylum, genus, and species) are indicated. PCD, postcholecystectomy diarrhea.
Figure 4.
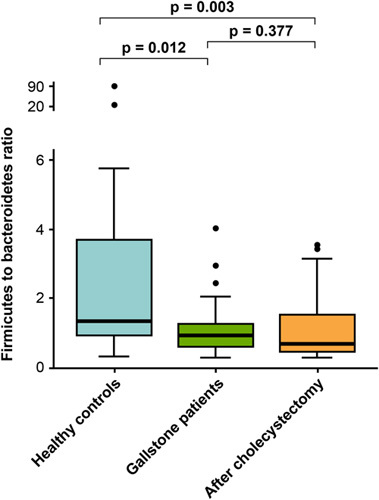
The ratio of Firmicutes to Bacteroidetes in healthy controls, patients with gallstones, and after cholecystectomy status.
We identified the specific microbial taxa that differed between HC and GS via linear discriminant analysis effect size (LEfSe) and visualized them through a cladogram (Fig. 2E; Supplementary Figure 3, Supplemental Digital Content 2, http://links.lww.com/JS9/A608). We found significant differences in bacterial composition between the two groups. Among the taxa with dominant abundance in the fecal samples (GS group), Phocaeicola (genus), Bacteroidales (order), and Bacteroidia (class) showed the highest AUROC (area under the receiver operating characteristic curve) values (0.701, 0.692, and 0.692, respectively) (Fig. 2F). The detailed linear discriminant analysis (LDA) scores between the two groups are shown in Supplementary Table 2, Supplemental Digital Content 4, http://links.lww.com/JS9/A610.
Changes in gut microbiome before and after cholecystectomy
Alpha diversity, based on the Shannon (P=0.510) and Gini–Simpson index (P=0.560), did not change after surgery compared with the baseline (Fig. 5A). There was also no significant difference in beta diversity between the two statuses (PC1=21.1%, ANOSIM R=−0.007, P=0.304; Fig. 5B). The hierarchical clustering of the two groups was visualized using a heat map (Fig. 5C). We illustrated the differential abundance of bacteria using a Krona chart; however, the intergroup difference before and after cholecystectomy was less remarkable than that between patients with gallstones before cholecystectomy and HC (Fig. 5D).
Figure 5.
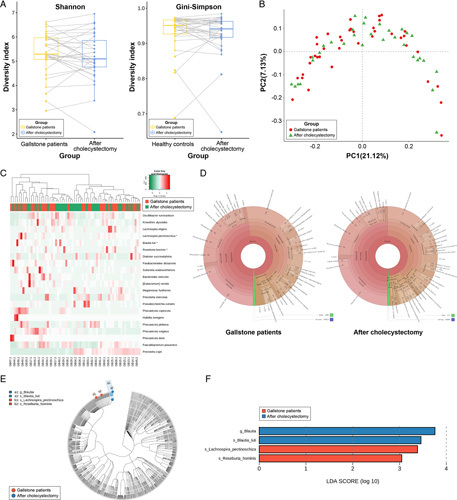
Comparison of the fecal microbiome in patients with gallstones (before cholecystectomy) and after cholecystectomy (n=32). (A) Comparison of overall diversity (Shannon and Gini–Simpson indices) between patients with gallstone and after cholecystectomy. (B) Unweighted UniFrac principal coordinate analysis [patients with gallstones (red dot) vs. after cholecystectomy (green dot)]. (C) Heat map of taxonomic assignment of fecal samples. The colored columns in the upper part of the heat map indicate patients with gallstones and after cholecystectomy, and those in the lower part of the heat map indicate each participant. Taxonomic abundance is proportional to the color intensity (color scale in the upper-left panel of the figure). (D) Krona chart illustrating the differential abundance of bacteria in patients with gallstones and after cholecystectomy. (E) Cladogram highlighting the distribution of the fecal microbiome with differential abundance between the two conditions. (F) Linear discriminant analysis coupled with effect size measurements illustrating the most differentially abundant taxa between the two groups.
The relative abundance of bacteria through their levels and distribution is shown in Figure 3A. In addition, the relative changes in microbial abundance before and after cholecystectomy were evaluated using LEfSe analysis. Only four taxa showed significantly different abundances in patients with gallstones who underwent cholecystectomy. At the species level, Lachnospir pectinoschiza and Roseburia hominis were dominant in patients with gallstones before cholecystectomy. In contrast, Blautia luti was the most abundant species in patients who underwent cholecystectomy (Fig. 5E, F). In other words, the relative abundances of most species did not change markedly after cholecystectomy.
The three bacterial species with the highest relative abundance were P. copri [before vs. after: 18.1 (3.3)% vs. 20.6 (3.8)%], Fecalibacterium prausnitzii [13.7 (1.6)% vs. 11.2 (1.7)%], and Phocaeicola vulgatus [5.4 (1.4)% vs. 4.9 (1.4)%], but the difference was not statistically significant (P for all >0.05). However, F. prausnitzii, which accounted for a higher proportion in GS than in HC [13.7 (1.6)% vs. 10.1 (2.4)%, respectively; P=0.017], decreased after surgery (P=0.236). The detailed LDA score data for the cholecystectomy and HC groups are shown in Supplementary Table 3 (Supplemental Digital Content 5, http://links.lww.com/JS9/A611). The bubble chart shows the changes in the four major phyla in all patients after surgery compared with baseline (Fig. 6). Additionally, the F/B ratio of patients who underwent cholecystectomy was not different between the two conditions (Fig. 4).
Figure 6.
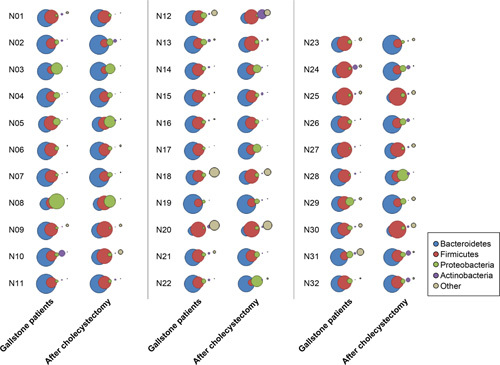
Bubble chart illustrating the differential abundance of bacteria at the phylum level between patients with gallstones and those 3 months after cholecystectomy.
The HC and GS after cholecystectomy groups showed no statistically significant difference in alpha diversity (Shannon and Gini–Simpson indices, P=0.409 and P=0.550, respectively); however, the difference in beta diversity was statistically significant (PC1=14.7%, ANOSIM R=0.205, P=0.001). This is similar to the comparison between the HC and precholecystectomy groups. The relative abundance, assessed using a bar plot for the two groups, was also similar before and after surgery (Fig. 3A). Detailed information is provided in Supplementary Figure 4 (Supplemental Digital Content 2, http://links.lww.com/JS9/A608) and Supplementary Table 4 (Supplemental Digital Content 6, http://links.lww.com/JS9/A612).
Network analysis revealed microbial relationships among operational taxonomic units (OTU) (Fig. 7). GS group showed reduced edge density compared with the HC group (estimated density of the network, d=0.010 vs. d=0.012). However, edge density increased in GS after cholecystectomy (d=0.012), suggesting a stronger microbial relationship than before surgery. Postoperative edge density was similar to that of HC, suggesting that the relationship among OTU was relatively more restored 3 months after surgery than before surgery.
Figure 7.
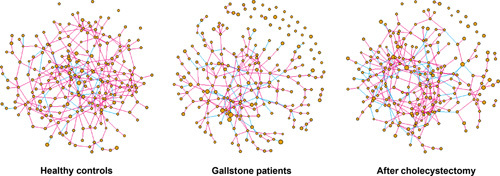
Microbial network analysis. Each node indicates an amplicon sequence variant and node size indicates relative abundance. Each edge indicates the correlation between nodes. Pink and blue lines reflect positive and negative relationships between nodes, respectively.
Symptoms-related analysis
Gut microbiome analysis associated with typical biliary colic symptoms before cholecystectomy
Typical preoperative biliary colic was significantly reduced after surgery [21 (65.6)% vs. 7 (21.9)%, P<0.001]. We divided the patients into two groups depending on the presence of preoperative symptoms [colic (−) and colic (+)] and analyzed the differences in the microbiome between the two groups. The two groups were not different in alpha and beta diversities but differed in the proportion of bacterial species (Fig. 3B; Supplementary Figure 5, Supplemental Digital Content 2, http://links.lww.com/JS9/A608). At the species level, 19 taxa were different between the two groups (Supplementary Table 5, Supplemental Digital Content 7, http://links.lww.com/JS9/A613), and the species that accounted for the highest proportion were P. copri, Prevotella stercorea, and Bacteroides stercoris. P. copri [24.7 (5.3)% vs. 12.5 (3.9)%, P=0.049] and P. stercorea [3.6 (0.9)% vs. 1.6 (1.0)%, P=0.005] were higher in the colic (−) group, and B. stercoris [0.2 (0.1)% vs. 2.1 (0.8)%, P=0.012] was higher in the colic (+) group.
Gut microbiome analysis associated with PCD after cholecystectomy
Results showed that 28.1% (n=9) of the patients did not have IBS symptoms (e.g. loose stool, frequent defecation, and abdominal discomfort relief after defecation) before surgery but newly developed these symptoms after surgery. We divided the patients into two subgroups based on the occurrence of PCD [PCD (−) and PCD (+)] and analyzed the differences in their microbiomes (Fig. 8A–E; Supplementary Figure 6, Supplemental Digital Content 2, http://links.lww.com/JS9/A608). The two groups did not differ in alpha diversity, and although the two groups seemed to differ in PCoA, the difference was not statistically significant (PC1=22.5%, ANOSIM R=0.135, P=0.075). However, the proportion of bacterial species differed between the two groups (Fig. 3C). LEfSe confirmed that P. copri was the most abundant species (LDA score: 4.923) in the PCD (−) group [PCD (−) vs. PCD (+), 25.2 (4.6)% vs. 8.9 (5.1)%, P=0.024] and P. vulgatus was the most abundant species (LDA score: 4.466) in the PCD (+) group [2.8 (0.8)% vs. 10.3 (4.3)%, P=0.009] (Supplementary Table 6, Supplemental Digital Content 8, http://links.lww.com/JS9/A614). We examined the AUROC to determine whether preoperative LEfSe results can be used to predict PCD (Fig. 8F). Sutterellaceae (family), Phocaeicola (genus), and Bacteroidales (order) showed the highest AUROC values in the taxa with PCD (+) patients compared with those before cholecystectomy (0.863, 0.735, and 0.735, respectively).
Figure 8.
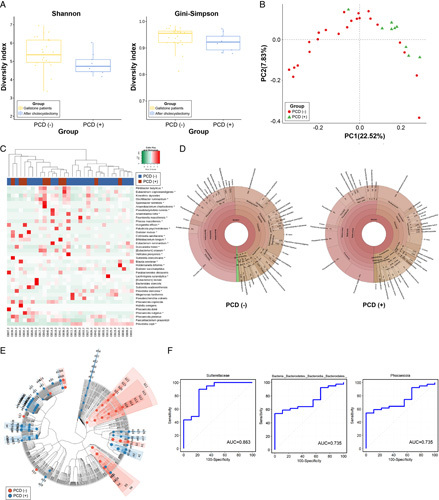
Comparison of the gut microbiome in patients with gallstones with postcholecystectomy diarrhea (PCD) (−) and PCD (+). (A) Comparison of alpha diversity (Shannon and Gini–Simpson indices). (B) Unweighted UniFrac principal coordinate analysis. PCD (−) (red dot) versus PCD (+) (green dot). (C) Heat map of taxonomic assignment of fecal samples. The colored columns in the upper part of the heat map indicate patients with PCD (−) and PCD (+), and those in the lower part of the heat map indicate each participant. Taxonomic abundance is proportional to color intensity (color scale in the upper-left panel of the figure). (D) Krona chart illustrating the differential abundance of bacteria in PCD (−) and PCD (+). (E) Cladogram highlighting the distribution of the fecal microbiome with differential abundance. (F) The prediction of PCD 3 months after cholecystectomy with the relative abundance of fecal microbiome and receiver operating curve of top three genera with dominant abundance in the fecal samples. PCD, postcholecystectomy diarrhea.
Discussion
Bile is a crucial factor influencing the gut microbiome4,22. Most bile flowing into the duodenum is reabsorbed in the small bowel via enterohepatic circulation and transported to the liver, and is partly excreted through feces23. BA accounts for ~50% of the bile and can directly influence the gut microbiome composition. As the gut microbiome plays a key role in BA metabolism, bile and gut microbiome are said to be in a complex relationship4,24. Cholecystectomy alters the physiology of BA. This is because the removal of the GB, which serves as a BA reservoir, causes the direct flow of bile into the duodenum after production6. The flow of BA into the duodenum without being stored in the GB alters the gut microbiome composition, and this may be linked to postoperative symptoms such as PCD14,25. In the present study, we obtained fecal microbiome samples from patients with gallstones before and after cholecystectomy to examine the changes in the microbiome after GB removal. In addition, we compared these microbiome compositions with those of fecal samples from HC to identify the bacterial species that are predominant in the GS group. We also analyzed the association between PCD symptoms and the microbiome 3 months after cholecystectomy, and to the best of our knowledge, this study is the first to analyze this relationship. According to our results, GS and HC showed no difference in alpha diversity but showed a difference in beta diversity. The microbiome of GS 3 months after cholecystectomy was similar to those before surgery. After cholecystectomy, the typical biliary colic significantly improved, but 28.1% of patients developed PCD. PCD symptoms were not associated with diversity. However, P. vulgatus was the most abundant species in the PCD (+) group. The taxa of both Phocaeicola and Sutterellaceae were significantly more abundant in PCD (+) patients. Network analysis showed that patients with gallstones had reduced microbial relationships compared with HC, but their microbial relationship increased to levels similar to those of HC after surgery, suggesting that it was restored to similar levels observed among HC.
Some factors contributing to gallstone formation include GB motility, BA metabolism, cholesterol metabolism, BA secretion, and the gut microbiome. Emerging evidence supports the role of the gut microbiome in BA metabolism26. BA and host metabolism can modulate the composition of the gut microbiome. At the same time, changes in microbiome composition can influence BA metabolism27,28. Little research has been conducted on the gut microbiome of patients with gallstones. According to previous studies, HC and patients with gallstones display different microbiome compositions. However, each study has reported varying results. Keren et al.5 reported that Ruminococcaceae (family) and Oscillospira (genus) were more abundant in patients with gallstones before cholecystectomy than in controls. In contrast, Roseburia (genus) and Bacteroides uniformis were decreased in these patients. Wu et al.29 reported that Proteobacteria (phylum) was increased in patients with gallstones, but Fecalibacterium (genus), Lachnospira (genus), and Roseburia (genus) were decreased compared with the control. B. uniformis was also reduced in GS group in our study [2.3 (0.6)% vs. 0.7 (0.2)%, P=0.043]. However, Fecalibacterium [10.1 (2.4)% vs. 13.7 (1.6)%, P=0.017] and Lachnospira [0.3 (0.1)% vs. 1.6 (0.3)%, P<0.001] were higher in GS than in the HC group. There may be a few reasons underlying the inconsistencies in bacterial compositions reported in the literature. First, the studies, including ours, had small sample sizes. Second, many factors may influence the gut microbiome even in HC; therefore, whether HC is an appropriate comparison group should be examined. Third, the bacterial species may vary depending on the type of gallstone30. Thus, validation studies using a larger study population are needed, and for these reasons, the composition of the gut microbiome of patients with gallstones must be interpreted with caution.
Cholecystectomy is a representative treatment option for symptomatic cholelithiasis, and GB removal may be the most potent factor that alters bile physiology31,32. Because GB functions as a reservoir for bile produced in the liver, removal of GB results in the direct flow of bile into the duodenum, which in turn may alter the composition of the gut microbiome3,33. Studies on the effect of cholecystectomy on the microbiome are scarce. In the mice model, GB-driven surfactant protein D is reportedly synthesized in the GB, delivered to the intestinal lumen, and bound selectively to gut commensal bacterial species34. A deficiency of this protein is linked to gut microbial dysbiosis, which can alter the commensal intestinal bacteria following cholecystectomy, leading to the onset of diarrhea. A case–control study reported that alpha diversity was lower in the cholecystectomy group than in the control group and that beta diversity also differed between the two groups6. Another study reported that the postcholecystectomy group showed altered microbiome composition and abundance compared with the control group31. Studies comparing the preoperative and postoperative states are lacking. A study comparing the preoperative and immediate postoperative (1–3 days after the operation) states in a Russian female cohort reported that there were no changes in alpha diversity, but the microbiome compositions differed35. In contrast, our data showed no changes in alpha and beta diversity. The discrepancy between our results and previous studies may be attributable to the following reasons; however, few studies have been conducted. First, we collected fecal samples 3 months after surgery. Three months may be too early to assess the effect of cholecystectomy on the microbiome. Second, the changes observed immediately after surgery in previous studies may be transient changes caused by general anesthesia and antibiotics. Since the bacterial composition differed according to the presence of PCD in our study, long-term follow-up data are required. However, our network analysis showed that the GS group had an increase in the microbial relationship after surgery to levels similar to that of the HC group. The results of previous studies and our study suggest that cholecystectomy can influence the gut microbiome; however, more studies should be performed, including a large number of participants with reasonable environmental control.
The postcholecystectomy syndrome is a new onset of abdominal symptoms, such as diarrhea, following laparoscopic cholecystectomy. Diarrhea occurring following cholecystectomy is referred to as PCD36. The prevalence of PCD is up to 57%24,37. The importance of PCD is increasing, as it is a delayed complication of cholecystectomy and is pertinent to the quality of life. However, its pathogenesis remains unclear. Owing to the removal of GB, which reserves and concentrates bile, the enterohepatic circulation of BA is elevated, resulting in increased BA concentration in the colon3. Primary BA synthesis occurs in the liver, and secondary BA synthesis in the intestine via the gut microbiome38. Not all microbial species are involved in BA synthesis, and because BA has bactericidal effects, the amount and concentration of bile influence microbial species, which in turn affects BA metabolism39. An increased proportion of primary BA in feces as a result of microbiome alteration has been observed in patients with IBS, suggesting that the alteration of BA proportion may be linked to the symptoms40,41. In the mice model transplanted with the fecal microbiome of PCD patients, tryptophan metabolism was increased, and abundant serotonin levels were observed in their serum and colon8. In other words, elevated BA in the colon after cholecystectomy stimulates colonic 5-hydroxytryptamine and increased colon motility, which can cause diarrhea. Thus, given that bile flows directly into the duodenum after cholecystectomy, the BA is predicted to increase, resulting in IBS-like symptoms, such as PCD.
Recent reports have suggested a link between PCD and microbiome. Xu et al.25 reported that bacterial composition was altered in patients with PCD compared with the controls, and the co-abundance network was decreased in patients with PCD. In our study, PCD occurred in 28.1% of the patients. While the two groups (PCD [+] and PCD [−]) did not differ in microbiome diversity, their bacterial proportions were different. The two characteristic species were P. copri and P. vulgatus. P. copri is an anaerobic gram-negative bacterium that induces inflammation via the T-helper 17 cell-related immune response and is associated with chronic inflammation42–44. While the abundance of P. copri was higher in patients with PCD than in those without PCD, P. copri was the predominant bacterial species before and after surgery in our study. Thus, it is difficult to conclude that P. copri is associated with PCD. On the other hand, P. vulgatus is one of the most common species of the Bacteroidaceae family present in the colon45. The genus Bacteroides is known to contribute to the maintenance of a healthy human gut ecosystem46. Phocaeicola contributes to the breakdown of complex heteropolysaccharides into small-chain fatty acids and is thus known to play an essential role in the human colon47. Its roles are not well known, but it has been reported to influence the dominance of Bacteroidales species by producing antibacterial toxins48. However, whether this species and toxin are linked to gastrointestinal symptoms remains unknown. In a mouse model, it is suggested that, while the mechanism of P. vulgatus is unclear, it could be related to the pathogenesis of bowel inflammation and thus explains the development of inflammatory bowel disease49. A recent study suggested that P. vulgatus could inhibit the production of colon microbial lipopolysaccharide, which is related to the immune response, in a mouse model50. In our study, P. vulgatus was 3.7-fold more abundant in PCD (+) patients. Because its abundance was significantly elevated, we suspected it was associated with these symptoms. We believe that the observed discrepancy in the proportion of a gut microbiome ecosystem, where there is an interaction with many different strains, is very meaningful. However, future biological or functional analysis studies are needed to understand the exact mechanism of the association with PCD because whether the increased proportion of P. vulgatus has a protective role due to a defense mechanism or has a causative role in PCD remains unclear. We identified bacterial species that may predict PCD using LEfSe and AUROC, and Phocaeicola and Sutterellaceae had the highest AUROC. Data on Sutterellaceae are also scarce; however, they have been proposed to be linked to IBS. PCoA showed that patients with IBS were clustered and distinguished from the control group, and these patients had an increased abundance of Sutterellaceae 40. Parasutterella is a gram-negative anaerobe in the Sutterellaceae family and has been linked to chronic inflammation and IBS development51. Therefore, these two species may be associated with IBS symptoms and are suspected to be linked to the onset of PCD in patients with gallstones after cholecystectomy. Functional analysis profile with shotgun metagenome sequencing should be performed in future studies to explain the role of cholecystectomy and its influence on the gut microbiome in patients with gallstones.
This study has some limitations. First, we did not include patients with acute cholecystitis who required emergency cholecystectomy. Therefore, the microbial alterations observed in patients with elevated inflammation due to gallstones remain uncertain. Second, we did not analyze the BA component in fecal samples. The relationship between the microbiome and BA concentration needs to be analyzed because BA concentration can trigger PCD. Not all patients who undergo cholecystectomy develop the symptoms; hence, the degree of BA release may influence the gut microbiome. Third, we could not perform long-term postoperative follow-up. Collecting fecal samples 6 months after surgery might have been appropriate for a more accurate analysis of microbial alterations. Fourth, diet is a known factor affecting the gut microbiome composition52. The lack of dietary information in this study may have disregarded the effects of diet on the analysis. Fifth, obesity is known to have an impact on the gut microbiome53,54. The GS group has a slightly higher BMI than the HC group; however, no statistical difference was found (P=0.558), and we believe this has a negligible impact on the results. Sixth, due to the small number of participants, further studies with a larger cohort number will be required to validate the results. Finally, we could not assess the bile secretion function of the GB before surgery in the GS group.
In conclusion, using fecal samples from GS before and after cholecystectomy, we confirmed that the gut microbiome in GS differed from that of HC in beta diversity. Furthermore, cholecystectomy did not influence the gut microbiome 3 months after surgery in our study. However, patients’ symptoms that had been present before surgery were significantly reduced, and network analysis confirmed an elevated inter-microbial relationship after surgery in the GS group. Thus, long-term follow-up data are required to determine the recovery of the gut microbiome. Moreover, we propose that PCD, a delayed postoperative complication, may be associated with the gut microbiome, suggesting that the gut microbiome may play a crucial role in predicting and modulating symptoms. Finally, in the future, we expect to obtain further evidence through clinical trials to collect long-term, large-scale serial data on postcholecystectomy gut microbial alteration in humans and to further validate our findings using animal models. Functional analysis and further validation with a larger study population are needed to clarify the roles of bacterial species linked to the onset of PCD.
Ethical approval
The study protocol was approved by the Ajou University Hospital Institutional Review Board and Ethics Committee (approval no. AJIRB-MED-OBS-18-153).
Sources of funding
This work was supported by a National Research Foundation of Korea (NRF) grant funded by the Korean government (MSIT) (No. 2018R1D1A1B07043601).
Author contribution
C.-K.N. and J.C.H.: conception and design; W.J., M.J.Y., and W.H.K.: administrative support; W.J. and J.C.H.: provision of study materials or patients; C.-K.N., W.J., and J.C.H.: collection and assembly of data; C.-K.N. and J.C.H.: data analysis and interpretation; C.-K.N. and J.C.H.: manuscript writing. All authors were involved in the final approval of the manuscript.
Conflicts of interest disclosure
The authors have no conflicts of interest.
Research registration unique identifying number (UIN)
Name of the registry: The Clinical Research Information Service (cris.nih.go.kr), Korea Centers for Disease Control and Prevention, Ministry of Health and Welfare, Osong, Republic of Korea).
Unique identifying number or registration ID: KCT0003033.
Hyperlink to your specific registration (must be publicly accessible and will be checked): https://cris.nih.go.kr/cris/search/detailSearch.do?seq=12114&search_page=L.
Guarantor
Jae Chul Hwang, MD, PhD, Department of Gastroenterology, Ajou University School of Medicine, 164 World Cup-ro, Yeongtong-gu, Suwon 16499, Republic of Korea, E-mail: cath07@ajou.ac.kr; Tel.: +82 31 219 5119; fax: +82 31 219 5999.
Data availability statement
The data that support the findings of this study are available from the corresponding author, [J.C.H.], upon reasonable request. But, all sequencing data is available at DOI: 10.17632/hyndhh7xgn.1
Provenance and peer review
Not commissioned, externally peer-reviewed.
Supplementary Material
Footnotes
C.K.N. and W.J. contributed equally as co-first authors to this article.
Sponsorships or competing interests that may be relevant to content are disclosed at the end of this article.
Supplemental Digital Content is available for this article. Direct URL citations are provided in the HTML and PDF versions of this article on the journal's website, www.lww.com/international-journal-of-surgery.
Published online 5 June 2023
Contributor Information
Choong-Kyun Noh, Email: cknoh23@gmail.com.
Woohyun Jung, Email: jwh2636@gmail.com.
Min Jae Yang, Email: creator1999@hanmail.net.
Wook Hwan Kim, Email: gimukani@nate.com.
Jae Chul Hwang, Email: cath07@ajou.ac.kr.
References
- 1. Everhart JE, Ruhl CE. Burden of digestive diseases in the United States Part III: liver, biliary tract, and pancreas. Gastroenterology 2009;136:1134–1144. [DOI] [PubMed] [Google Scholar]
- 2. Shaffer EA. Epidemiology and risk factors for gallstone disease: has the paradigm changed in the 21st century? Curr Gastroenterol Rep 2005;7:132–140. [DOI] [PubMed] [Google Scholar]
- 3. Housset C, Chretien Y, Debray D, et al. Functions of the gallbladder. Compr Physiol 2016;6:1549–1577. [DOI] [PubMed] [Google Scholar]
- 4. Ridlon JM, Kang DJ, Hylemon PB, et al. Bile acids and the gut microbiome. Curr Opin Gastroenterol 2014;30:332–338. [DOI] [PMC free article] [PubMed] [Google Scholar]
- 5. Keren N, Konikoff FM, Paitan Y, et al. Interactions between the intestinal microbiota and bile acids in gallstones patients. Environ Microbiol Rep 2015;7:874–880. [DOI] [PubMed] [Google Scholar]
- 6. Yoon WJ, Kim HN, Park E, et al. The impact of cholecystectomy on the gut microbiota: a case–control study. J Clin Med 2019;8:79. [DOI] [PMC free article] [PubMed] [Google Scholar]
- 7. Sauter GH, Moussavian AC, Meyer G, et al. Bowel habits and bile acid malabsorption in the months after cholecystectomy. Am J Gastroenterol 2002;97:1732–1735. [DOI] [PubMed] [Google Scholar]
- 8. Xu Y, Wang J, Wu X, et al. Gut microbiota alteration after cholecystectomy contributes to post-cholecystectomy diarrhea via bile acids stimulating colonic serotonin. Gut Microbes 2023;15:2168101. [DOI] [PMC free article] [PubMed] [Google Scholar]
- 9. Wanjura V, Sandblom G. How do quality-of-life and gastrointestinal symptoms differ between post-cholecystectomy patients and the background population? World J Surg 2016;40:81–88. [DOI] [PubMed] [Google Scholar]
- 10. Barrasa JI, Olmo N, Lizarbe MA, et al. Bile acids in the colon, from healthy to cytotoxic molecules. Toxicol In Vitro 2013;27:964–977. [DOI] [PubMed] [Google Scholar]
- 11. Midtvedt T. Microbial bile acid transformation. Am J Clin Nutr 1974;27:1341–1347. [DOI] [PubMed] [Google Scholar]
- 12. Tanaka H, Doesburg K, Iwasaki T, et al. Screening of lactic acid bacteria for bile salt hydrolase activity. J Dairy Sci 1999;82:2530–2535. [DOI] [PubMed] [Google Scholar]
- 13. Fisher M, Spilias DC, Tong LK. Diarrhoea after laparoscopic cholecystectomy: incidence and main determinants. ANZ J Surg 2008;78:482–486. [DOI] [PubMed] [Google Scholar]
- 14. Li YD, Liu BN, Zhao SH, et al. Changes in gut microbiota composition and diversity associated with post-cholecystectomy diarrhea. World J Gastroenterol 2021;27:391–403. [DOI] [PMC free article] [PubMed] [Google Scholar]
- 15. von Elm E, Altman DG, Egger M, et al. The Strengthening the Reporting of Observational Studies in Epidemiology (STROBE) statement: guidelines for reporting observational studies. Ann Intern Med 2007;147:573–577. [DOI] [PubMed] [Google Scholar]
- 16. Mathew G, Agha R, Albrecht J, et al. STROCSS 2021: strengthening the reporting of cohort, cross-sectional and case–control studies in surgery. Int J Surg 2021;96:106165. [DOI] [PubMed] [Google Scholar]
- 17. Cardona S, Eck A, Cassellas M, et al. Storage conditions of intestinal microbiota matter in metagenomic analysis. BMC Microbiol 2012;12:158. [DOI] [PMC free article] [PubMed] [Google Scholar]
- 18. Tedjo DI, Jonkers DM, Savelkoul PH, et al. The effect of sampling and storage on the fecal microbiota composition in healthy and diseased subjects. PLoS One 2015;10:e0126685. [DOI] [PMC free article] [PubMed] [Google Scholar]
- 19. Chung SC, Leung JW, Li AK. Bile duct size after cholecystectomy: an endoscopic retrograde cholangiopancreatographic study. Br J Surg 1990;77:534–535. [DOI] [PubMed] [Google Scholar]
- 20. Park SM, Kim WS, Bae IH, et al. Common bile duct dilatation after cholecystectomy: a one-year prospective study. J Korean Surg Soc 2012;83:97–101. [DOI] [PMC free article] [PubMed] [Google Scholar]
- 21. Cotton PB, Elta GH, Carter CR, et al. Gallbladder and sphincter of Oddi disorders. Gastroenterology 2016;150:1420–1429.e2. [DOI] [PubMed] [Google Scholar]
- 22. Guzior DV, Quinn RA. Review: microbial transformations of human bile acids. Microbiome 2021;9:140. [DOI] [PMC free article] [PubMed] [Google Scholar]
- 23. Cai JS, Chen JH. The mechanism of enterohepatic circulation in the formation of gallstone disease. J Membr Biol 2014;247:1067–1082. [DOI] [PMC free article] [PubMed] [Google Scholar]
- 24. Farina A, Dumonceau JM, Lescuyer P. Proteomic analysis of human bile and potential applications for cancer diagnosis. Expert Rev Proteomics 2009;6:285–301. [DOI] [PubMed] [Google Scholar]
- 25. Xu Y, Jing H, Wang J, et al. Disordered gut microbiota correlates with altered fecal bile acid metabolism and post-cholecystectomy diarrhea. Front Microbiol 2022;13:800604. [DOI] [PMC free article] [PubMed] [Google Scholar]
- 26. Grigor’eva IN, Romanova TI. Gallstone disease and microbiome. Microorganisms 2020;8:835. [DOI] [PMC free article] [PubMed] [Google Scholar]
- 27. Wahlstrom A, Sayin SI, Marschall HU, et al. Intestinal crosstalk between bile acids and microbiota and its impact on host metabolism. Cell Metab 2016;24:41–50. [DOI] [PubMed] [Google Scholar]
- 28. Tian Y, Gui W, Koo I, et al. The microbiome modulating activity of bile acids. Gut Microbes 2020;11:979–996. [DOI] [PMC free article] [PubMed] [Google Scholar]
- 29. Wu T, Zhang Z, Liu B, et al. Gut microbiota dysbiosis and bacterial community assembly associated with cholesterol gallstones in large-scale study. BMC Genomics 2013;14:669. [DOI] [PMC free article] [PubMed] [Google Scholar]
- 30. Georgescu D, Ionita I, Lascu A, et al. Gallstone disease and bacterial metabolic performance of gut microbiota in middle-aged and older patients. Int J Gen Med 2022;15:5513–5531. [DOI] [PMC free article] [PubMed] [Google Scholar]
- 31. European Association for the Study of the Liver (EASL). EASL Clinical Practice Guidelines on the prevention, diagnosis and treatment of gallstones. J Hepatol 2016;65:146–181. [DOI] [PubMed] [Google Scholar]
- 32. Ren X, Xu J, Zhang Y, et al. Bacterial alterations in post-cholecystectomy patients are associated with colorectal cancer. Front Oncol 2020;10:1418. [DOI] [PMC free article] [PubMed] [Google Scholar]
- 33. Hepner GW, Hofmann AF, Malagelada JR, et al. Increased bacterial degradation of bile acids in cholecystectomized patients. Gastroenterology 1974;66:556–564. [PubMed] [Google Scholar]
- 34. Sarashina-Kida H, Negishi H, Nishio J, et al. Gallbladder-derived surfactant protein D regulates gut commensal bacteria for maintaining intestinal homeostasis. Proc Natl Acad Sci U S A 2017;114:10178–10183. [DOI] [PMC free article] [PubMed] [Google Scholar]
- 35. Grigor’eva I, Romanova T, Naumova N, et al. Gut microbiome in a Russian cohort of pre- and post-cholecystectomy female patients. J Pers Med 2021;11:294. [DOI] [PMC free article] [PubMed] [Google Scholar]
- 36. Jaunoo SS, Mohandas S, Almond LM. Postcholecystectomy syndrome (PCS). Int J Surg 2010;8:15–17. [DOI] [PubMed] [Google Scholar]
- 37. Farrugia A, Attard JA, Hanmer S, et al. Rates of bile acid diarrhoea after cholecystectomy: a multicentre audit. World J Surg 2021;45:2447–2453. [DOI] [PMC free article] [PubMed] [Google Scholar]
- 38. Russell DW. The enzymes, regulation, and genetics of bile acid synthesis. Annu Rev Biochem 2003;72:137–174. [DOI] [PubMed] [Google Scholar]
- 39. Jones ML, Martoni CJ, Ganopolsky JG, et al. The human microbiome and bile acid metabolism: dysbiosis, dysmetabolism, disease and intervention. Expert Opin Biol Ther 2014;14:467–482. [DOI] [PubMed] [Google Scholar]
- 40. Lee SM, Kim N, Yoon H, et al. Compositional and functional changes in the gut microbiota in irritable bowel syndrome patients. Gut Liver 2021;15:253–261. [DOI] [PMC free article] [PubMed] [Google Scholar]
- 41. Dior M, Delagreverie H, Duboc H, et al. Interplay between bile acid metabolism and microbiota in irritable bowel syndrome. Neurogastroenterol Motil 2016;28:1330–1340. [DOI] [PubMed] [Google Scholar]
- 42. Hofer U. Microbiome: pro-inflammatory Prevotella? Nat Rev Microbiol 2014;12:5. [DOI] [PubMed] [Google Scholar]
- 43. Larsen JM. The immune response to Prevotella bacteria in chronic inflammatory disease. Immunology 2017;151:363–374. [DOI] [PMC free article] [PubMed] [Google Scholar]
- 44. Jousimies-Somer HR. Update on the taxonomy and the clinical and laboratory characteristics of pigmented anaerobic gram-negative rods. Clin Infect Dis 1995;20(Suppl 2):S187–S191. [DOI] [PubMed] [Google Scholar]
- 45. Salyers AA. Bacteroides of the human lower intestinal tract. Annu Rev Microbiol 1984;38:293–313. [DOI] [PubMed] [Google Scholar]
- 46. Friedrich V, Forné I, Matzek D, et al. Helicobacter hepaticus is required for immune targeting of bacterial heat shock protein 60 and fatal colitis in mice. Gut Microbes 2021;13:1–20. [DOI] [PMC free article] [PubMed] [Google Scholar]
- 47. Luck R, Deppenmeier U. Genetic tools for the redirection of the central carbon flow towards the production of lactate in the human gut bacterium Phocaeicola (Bacteroides) vulgatus . Appl Microbiol Biotechnol 2022;106:1211–1225. [DOI] [PMC free article] [PubMed] [Google Scholar]
- 48. Evans JC, McEneany VL, Coyne MJ, et al. A proteolytically activated antimicrobial toxin encoded on a mobile plasmid of Bacteroidales induces a protective response. Nat Commun 2022;13:4258. [DOI] [PMC free article] [PubMed] [Google Scholar]
- 49. Waidmann M, Bechtold O, Frick JS, et al. Bacteroides vulgatus protects against Escherichia coli-induced colitis in gnotobiotic interleukin-2-deficient mice. Gastroenterology 2003;125:162–177. [DOI] [PubMed] [Google Scholar]
- 50. Yoshida N, Emoto T, Yamashita T, et al. Bacteroides vulgatus and Bacteroides dorei reduce gut microbial lipopolysaccharide production and inhibit atherosclerosis. Circulation 2018;138:2486–2498. [DOI] [PubMed] [Google Scholar]
- 51. Chen YJ, Wu H, Wu SD, et al. Parasutterella, in association with irritable bowel syndrome and intestinal chronic inflammation. J Gastroenterol Hepatol 2018;33:1844–1852. [DOI] [PubMed] [Google Scholar]
- 52. Wolter M, Grant ET, Boudaud M, et al. Leveraging diet to engineer the gut microbiome. Nat Rev Gastroenterol Hepatol 2021;18:885–902. [DOI] [PubMed] [Google Scholar]
- 53. John GK, Mullin GE. The Gut microbiome and obesity. Curr Oncol Rep 2016;18:45. [DOI] [PubMed] [Google Scholar]
- 54. Sanmiguel C, Gupta A, Mayer EA. Gut microbiome and obesity: a plausible explanation for obesity. Curr Obes Rep 2015;4:250–261. [DOI] [PMC free article] [PubMed] [Google Scholar]
Associated Data
This section collects any data citations, data availability statements, or supplementary materials included in this article.
Supplementary Materials
Data Availability Statement
The data that support the findings of this study are available from the corresponding author, [J.C.H.], upon reasonable request. But, all sequencing data is available at DOI: 10.17632/hyndhh7xgn.1


