

Abstract
Background
The etiology of autism spectrum (ASD) and Attention Deficit/Hyperactivity (ADHD) disorders are multifactorial. Epidemiological studies have shown associations with environmental pollutants, such as plasticizers. This study focused on two of these compounds, the Bisphenol-A (BPA) and Diethylhexyl Phthalate (DEHP). The major pathway for BPA and DEHP excretion is via glucuronidation. Glucuronidation makes insoluble substances more water-soluble allowing for their subsequent elimination in urine.
Hypothesis
Detoxification of these two plasticizers is compromised in children with ASD and ADHD. Consequently, their tissues are more exposed to these two plasticizers.
Methods
We measured the efficiency of glucuronidation in three groups of children, ASD (n = 66), ADHD (n = 46) and healthy controls (CTR, n = 37). The children were recruited from the clinics of Rutgers-NJ Medical School. A urine specimen was collected from each child. Multiple mass spectrometric analyses including the complete metabolome were determined and used to derive values for the efficiency of glucuronidation for 12 varied glucuronidation pathways including those for BPA and MEHP.
Results
(1) Both fold differences and metabolome analyses showed that the three groups of children were metabolically different from each other. (2) Of the 12 pathways examined, only the BPA and DEHP pathways discriminated between the three groups. (3) Glucuronidation efficiencies for BPA were reduced by 11% for ASD (p = 0.020) and 17% for ADHD (p<0.001) compared to controls. DEHP showed similar, but not significant trends.
Conclusion
ASD and ADHD are clinically and metabolically different but share a reduction in the efficiency of detoxification for both BPA and DEHP with the reductions for BPA being statistically significant.
Introduction
The etiology of autism spectrum disorders (ASD) is believed to be multifactorial. One prominent hypothesis involves toxicant exposure acting upon genetically susceptible individuals. ASD has strong associations with both environmental factors and genetic components [1–7]. It is now generally accepted that chemicals introduced into the environment by human activity can have adverse effects on human health [1, 8–12].
The present study focused on two of these compounds, the common plasticizers Bisphenol-A (BPA) and Diethylhexyl Phthalate (DEHP). BPA and phthalates plasticizers are moderate molecular weight, hydrophilic and relatively inert aromatic compounds. BPA is used in the manufacture of polycarbonate plastics, as an antioxidant in some plasticizers, in polyvinyl chloride (PVC) manufacture, and the Epoxy resins used to coat the inside of many food and beverage cans [11, 13, 14]. DEHP is used to control the rigidity of a plastic [7, 15]. The principal routes of exposure are believed to be dietary—through ingestion of food products via contaminated packaging although there is some evidence that inhalation and personal products are also important [12, 15, 16].
The evidence for an association of neurodevelopmental disorders with exposure to plasticizers is primarily from epidemiological studies based on maternal urine analyses [7]. Multiple mechanisms have been proposed; most involve the plasticizer acting as a weak endocrine disruptor [17–21]. Numerous gene mutations have also been associated with ASD [5, 6]. Details about how gene mutations lead to ASD in some children and not others are lacking.
We propose that the linkage is a genetically determined compromised ability to detoxify the plasticizers BPA and MEHP. The major pathway for BPA and DEHP metabolism and excretion is via glucuronidation. The glucuronidation pathway makes a large variety of substances more water-soluble allowing for their subsequent elimination from the body upon urination. Most BPA and DEHP excretion is as the glucuronide with a small amount as the sulfate [22–25].
The key step in the glucuronidation process is the transfer of glucuronic acid from uridine-5′-diphospho-α-D-glucuronic acid (UDPGA) to the target molecule which could be a hydroxyl, amine, carboxyl, sulfhydryl etc. by Uridine 5′-diphospho-glucuronosyltransferases (UGTs) [26–28]. The different UGT’s have numerous and overlapping substrates [29]. Thus, while the mechanism is common, execution is by a multitude of closely related enzymes leaving much scope for individual variability.
Previously, we reported that the efficiency of glucuronidation of DEHP and BPA metabolites was lower in children with ASD [30]. The objectives of the present study were:
To determine whether the association of compromised glucuronidation was specific to ASD or was more general applying to other childhood neurodevelopmental disorders by measuring the efficiency of glucuronidation for another neurological disorder. Attention Deficit/Hyperactivity disorder (ADHD) was selected as the other disorder because it has many outward similarities to ASD [31, 32]. ADHD is one of the most common neurodevelopmental disorders in children [33, 34]. Both BPA and phthalates have been implicated in the development of ADHD symptoms [12, 17, 35–37]. The prevalence of ADHD and ASD is higher in males than in females [33, 35, 38].
Glucuronidation encompasses many different sub-pathways. The second objective of the present study was to ascertain whether the association of ASD with decreased glucuronidation efficiency was unique to a specific plasticizer sub-pathway or common to other variants of the glucuronidation pathway. Therefore, the present study examined the relationships of ASD and ADHD with a varied group of twelve glucuronidation sub-pathways. Five were plasticizers, specifically, BPA and four phthalates, the primary metabolites of DEHP, mono-2-ethylhexyl phthalate (MEHP) and three of its secondary metabolites, mono-(2-ethyl-5-oxohexyl) phthalate (5-oxo MEHP), mono-(2-ethyl-5-hydroxyhexyl) phthalate (5-OH MEHP) and mono-(2-ethyl-5-carboxypentyl phthalate (5-CX MEPP). The other seven pathways were derived from metabolites present in the metabolome There was one steroid, cortisol; two bile acids, glycocholic acid (GCA) and glycodeoxycholic acid, (GCDA); two vitamin E metabolites (2,5,7,8-tetramethyl-2-(2’-carboxyethyl)-6-hydroxychroman (α-CEHC) and 7,8-Trimethyl-2-(beta-carboxyethyl)-6-hydroxychroman (γ- CEHC): a food additive (Naringenin) and plant compound (salicylate). Salicylate occurs widely in fruits and vegetables as well as aspirin
Methods and materials
Subjects
The study was approved by the Institutional Review Boards of Rutgers University-New Jersey Medical School, Rowan University-School of Osteopathic Medicine and their predecessor, the University of Medicine and Dentistry of New Jersey (UMDNJ). Subjects were recruited from the Pediatric Neurology and Pediatrics clinical practices of Rutgers-New Jersey Medical School. Written informed consent was obtained from each child’s guardian or parent as appropriate by either an investigator (XM) or a team member. A member of the clinic staff witnessed the procedure.
The study population consisted of three groups of children from 3–16 years old. All the children who were diagnosed with ASD were under the care of a pediatric neurologist (X.M), and the diagnoses were made according to the Diagnostic Statistical Manual IV-TR and/or V, and were further confirmed by Autism Diagnostic Interview-Revised, Autism Diagnostic Observation Scale-Generic, or both rating scales. Medical histories and comorbidity data were collected for the ASD and ADHD subjects. The diagnosis of ADHD was also made according to DSM-IV-TR criteria and DSM V and confirmed with the Vanderbilt ADHD diagnostic scale. Although DSM V was released in 2013, the DSM-IV-TR criteria for ASD and ADHD continued to be used to ensure that the diagnostic criteria would be the same as those employed in our earlier BPA and DEHP studies [30, 39, 40]. Healthy children compromised a third group, the control group were recruited from the Pediatric Ambulatory Care Center of our Institute. Efforts were made to age match the three groups. Spot urine specimens were collected from each child between 10:00 a.m. and 4:00 p.m. [39]. The samples were frozen and then stored at −70°C within 2 hours of collection.
Because medical and psychiatric comorbidities along with intellectual impairment are frequent among ASD and ADHD children [41], we included ASD and ADHD children who were diagnosed with or without comorbid disorders. There were no exclusionary criteria with respect to levels of intellectual performance. However, children with ASD and ADHD and a known genetic disorder, e.g., Fragile X syndrome, were excluded. The children in the control group were screened for medical and developmental disorders in addition to chart reviews, and only children without chronic or recurrent medical disorders were considered healthy and included in the study. The subjects were carefully screened for signs of infection or other illnesses on the day of specimen acquisition, and subjects with acute illness were excluded. The dietary intake history was recorded within 24 hours of the urine collection and included current medications being taken and vitamin intake.
Analytical methodology. The urinary creatinine concentrations were measured by us using a kit (Sigma Aldrich, St. Louis, MO 68178), and by LC-MSMS by Metabolon as part of the Metabolome. Metabolite concentrations measured by us were normalized to the Sigma-Aldrich kit values and the metabolome determined metabolites to the metabolome creatinine values. The reason for using metabolome creatinine values for metabolome metabolites was that the metabolome values correct for the possibility of any evaporative losses during sample preparation (aliquoting) for Metabolon. The correlation by regression analysis between the two methods was r2<0.95.
The analytical methodology for measuring BPA and Phthalates in urine has been previously described [30, 40]. Briefly, the concentration of free and total BPA in the collected urine specimens was measured by isotope dilution-liquid chromatography mass spectrometry–mass spectrometry (ID-LC-MSMS) using the methodology Koch et al for phthalates and our modifications of the BPA methodology of Liao and Kannan for BPA [22, 25, 30, 42]. The limits of detection for phthalates was 0.5 to 1ng/ml for phthalates [25] and 0.2 ng/ml for BPA [30]. The ID-LC-MSMS assays measure free BPA and free phthalates. To measure the total BPA or phthalate present in the urine, the glucuronidated plasticizers has to be deconjugated by treating the urine with β-glucuronidase to remove the glucuronic acid residue from the glucuronidated BPA or phthalate (Sigma-Aldrich, St. Louis MO).
Metabolomic analyses
Urine specimens were sent to Metabolon, Inc. (Morrisville, NC 27560) for metabolomic analysis. The results were used for two purposes. Firstly, for calculating the efficiency of glucuronidation (= % bound) for certain compounds in the metabolome and secondly for analysis of the distribution of compounds in the metabolome.
The requirements for being able to calculate a value for % bound from the metabolome is the presence of both free and bound compounds in the metabolome, total absence of bound compound after treatment of the urine with glucuronidase and a corresponding increase in the amount of free compound in the metabolome. The metabolomic screen gives values for the area-under-the -curve data (AUC) for the free and bound compounds. The measured area is a function of the amount of compound present, the fragmentation pattern and the mass spectrometer settings. The AUC cannot be used directly for calculating the efficiency of glucuronidation (% bound) because the fragmentation patterns for the free and bound compound are different. To calculate the total amount of a compound present and bound, it is necessary to first convert glucuronide areas into their free compound equivalents. The necessary conversion factors were determined by selecting 20 random urine specimens, preparing two aliquots, ‘control’ and ‘treated’. A fresh solution containing ~250–300 units/ml of E. Coli β-glucuronidase in 1M Ammonium Acetate was prepared immediately before use. Either 1 ml of enzyme solution (treated) or 1 ml of 1M ammonium acetate (control) was added to the control and treated tubes respectively. The tubes were incubated at 37°overnight (~19 hours) after which an aliquot was removed, frozen and sent to Metabolon, Inc., (Morrisville, NC 27560) for metabolomic analysis.
The amount of glucuronide hydrolyzed to free compound was obtained from the treated metabolome and a conversion factor for glucuronide to free compound equivalents. The control urine gives the AUCs for free (F) and, separately, glucuronidated (G) compound in the urine. The enzyme treated group gave a value for the total amount of compound T, (F + G) present in the original sample. The glucuronidated area was converted to free compound area equivalents by multiplying it by the conversion factor (R). The % free metabolite was calculated using the equation: % free = 100*(F/(T*R)). The % bound (efficiency of glucuronidation) values for the 12 glucuronidation metabolites were then calculated by subtracting the respective % free metabolite value from 100.
Statistical Analyses. In calculating the frequency distributions for the % bound values, two subjects were found to have negative % bound values for BPA suggesting one of the two parameters (F or G) used for the calculation was in error. Because negative percentages for % bound metabolites are impossible, the data for the two children with negative percentages were excluded from further analyses involving BPA calculations but were included in analyses involving the other 11 glucuronides. In addition, compounds were excluded if the number of detections for a particular metabolite was < 50% of the sum of the total number of metabolites found in the ASD, CTR, or ADHD groups. No missing data were imputed.
The metabolome metabolites were normalized child’s urinary creatinine concentration [35, 43]. An alternate way would have been to control for creatinine. For the present study, normalization of the metabolome data to creatinine is the preferred way because creatinine is being used to give a value for excretion over time [43, 44]. In our prior BPA study, the BPA metabolite values were controlled for by regressing the BPA values on the child’s gender, ethnicity, age, and creatinine levels after applying log10 transformations to decrease the severity of skewness [30]. However, we found that the latter parametric approach yielded results that were comparable to just employing nonparametric statistics to compare mean ranks of the metabolites among groups, such as Kruskal-Wallis H test and calculating Spearman rank-order correlations (rs), instead of Pearson product-moment correlations (rp) to estimate the magnitudes of the relationships of the BPA indices with respect to other types of metabolites. The use of rs is a valid approach to for estimating the magnitudes of association when data are minimally to moderately skewed and there are only several extreme outliers [45]. The statistical analyses were performed with either EXCEL 365 or SPSS29.
Results
The raw data, from which all that follows has been derived is given in the S1 Dataset. Table 1 displays the characteristics of the three samples. The percentages of boys in each group are listed along with the mean ages, BMI levels, and urinary creatinine levels for each of the three groups. None of these four characteristics significantly differentiated among the three groups after applying a Bonferroni adjustment of α of 0.05/4 = 0.0125, two-tailed test of significance to control for the familywise error rate of performing four comparative analyses. Therefore, we concluded that gender, age, and BMI did not have to be controlled for in comparing the three groups’ metabolite levels.
Table 1. Subject characteristics.
| CHARACTERISTIC | GROUP | N | % | STATISTIC | P | EFFECT SIZE | |
|---|---|---|---|---|---|---|---|
| Sex (boys) | ASD | 66 | 74 | χ2 (2) = 5.24 | 0.07 | Cramer’s V = .19 | |
| CTR | 37 | 54 | |||||
| ADHD | 46 | 74 | |||||
| N | M | SD | |||||
| Age (years) | ASD | 65 | 10.11 | 3.41 | F (2,144) = 3.32 | 0.04 | η2 = .04 |
| CTR | 37 | 8.78 | 2.96 | ||||
| ADHD | 45 | 10.53 | 3.00 | ||||
| BMI | ASD | 63 | 21.87 | 6.57 | F (2, 138) = 1.36 | 0.26 | η2 = .02 |
| CTR | 33 | 19.82 | 4.62 | ||||
| ADHD | 45 | 20.89 | 5.63 | ||||
| Creatinine (mg/ml) | ASD | 66 | 1.08 | 0.64 | F (2, 146) = 1.78 | 0.17 | η2 = .02 |
| CTR | 37 | 1.31 | 0.58 | ||||
| ADHD | 46 | 1.29 | 0.89 |
Table 2 presents the mean, median, geometric mean, min-max, and % of children with data for each analyte by group. After making the necessary Bonferroni adjustments, none of the data is significant at the p<0.05 level.
Table 2. a. free compounds.
b. total compounds.
| a | |||||||||||
| PARAMETER | MEAN (SD) | MEDIAN | GEOMETRIC MEAN | ||||||||
| 5 OXO-MEHP | 0.26 (0.38) | 0.14 (0.17) | 0.22 (0.21) | 0.15 | 0.09 | 0.15 | 0.14 | 0.08 | 0.14 | ||
| 5 CX-MEPP | 41 (143) | 11 (14) | 17 (17) | 9 | 7 | 10 | 11 | 6 | 12 | ||
| 5 OH-MEHP | 0.67 (1.51) | 0.33 (0.38) | 0.57 (0.60) | 0.33 | 0.26 | 0.39 | 0.29 | 0.19 | 0.36 | ||
| MEHP | 2.11 (5.95) | 0.56 (0.38) | 0.89 (1.42) | 0.60 | 0.47 | 0.54 | 0.73 | 0.47 | 0.61 | ||
| BPA | 1.33 (4.21) | 0.45 (0.42) | 0.44 (0.41) | 0.35 | 0.37 | 0.27 | 0.43 | 0.35 | 0.32 | ||
| α-CEHC | 108 (105) | 115 (169) | 86 (80) | 79 | 66 | 63 | 79 | 74 | 63 | ||
| γ-CEHC. | 256 (239) | 222 (262) | 344 (313) | 178 | 155 | 226 | 177 | 146 | 246 | ||
| CORTISOL. | 71 (99) | 87 (111) | 39 (24) | 44 | 48 | 33 | 47 | 55 | 32 | ||
| GLYCODEOXYCHOLATE | 93 (92) | 68 (47) | 101 (76) | 66 | 55 | 88 | 66 | 53 | 75 | ||
| GLYCOCHOLATE | 383 (403) | 257 (228) | 389 (309) | 233 | 202 | 315 | 255 | 185 | 290 | ||
| NARINGENIN | 58 (71) | 43 (59) | 34 (33) | 27 | 17 | 18 | 29 | 23 | 22 | ||
| SALICYLATE | 2128 (3661) | 4158 (18164) | 2287 (2813) | 1164 | 848 | 1114 | 1151 | 978 | 1290 | ||
| PARAMETER | MINIMUM VALUE | MAXIMUM VALUE | % WITH DATA | ||||||||
| 5 OXO-MEHP | 0.02 | 0.02 | 0.02 | 3 | 1 | 1 | 85 | 98 | 95 | ||
| 5 CX-MEPP | 2 | 1 | 3 | 949 | 66 | 75 | 91 | 100 | 100 | ||
| 5 OH-MEHP | 0.01 | 0.01 | 0.04 | 11 | 2 | 3 | 87 | 98 | 97 | ||
| MEHP | 0.16 | 0.09 | 0.20 | 35 | 2 | 9 | 91 | 100 | 100 | ||
| BPA | 0.04 | 0.05 | 0.09 | 28 | 2 | 2 | 88 | 100 | 100 | ||
| α-CEHC | 19 | 27 | 7 | 511 | 959 | 379 | 66 | 71 | 68 | ||
| γ-CEHC. | 23 | 27 | 36 | 1314 | 1629 | 1398 | 96 | 100 | 100 | ||
| CORTISOL. | 8 | 10 | 8 | 665 | 479 | 98 | 82 | 84 | 84 | ||
| GLYCODEOXYCHOLATE | 13 | 6 | 7 | 520 | 212 | 312 | 91 | 98 | 97 | ||
| GLYCOCHOLATE | 38 | 17 | 26 | 1968 | 1089 | 1614 | 99 | 100 | 100 | ||
| NARINGENIN | 2 | 2 | 6 | 276 | 262 | 128 | 46 | 67 | 50 | ||
| SALICYLATE | 187 | 151 | 175 | 25976 | 125854 | 13704 | 99 | 100 | 100 | ||
| b | |||||||||||
| PARAMETER | MEAN (SD) | MEDIAN | GEOMETRIC MEAN | ||||||||
| 5 OXO-MEHP | 18 (57) | 12 (12) | 7 (8) | 6 | 7 | 4 | 7 | 8 | 4 | ||
| 5 CX-MEPP | 85 (311) | 33 (32) | 21 (22) | 18 | 22 | 14 | 22 | 24 | 13 | ||
| 5 OH-MEHP | 29 (100) | 19 (20) | 11 (12) | 9 | 12 | 8 | 10 | 12 | 7 | ||
| MEHP | 49 (9) | 4 (3) | 2 (3) | 2 | 3 | 1 | 3 | 3 | 2 | ||
| BPA | 12 (69) | 7 (21) | 2 (1) | 2 | 3 | 1 | 2 | 3 | 1 | ||
| α-CEHC | 1440 (1186) | 1198 (837) | 1249 (1605) | 913 | 971 | 804 | 1063 | 973 | 891 | ||
| γ-CEHC. | 113 (138) | 70 (41) | 124 (131) | 81 | 63 | 77 | 80 | 57 | 85 | ||
| CORTISOL. | 8844 (6414) | 9542 (5078) | 8427 (6255) | 6989 | 9026 | 7092 | 7174 | 8142 | 6643 | ||
| GLYCODEOXYCHOLATE | 390 (260) | 298 (164) | 251 (159) | 311 | 269 | 191 | 308 | 250 | 205 | ||
| GLYCOCHOLATE | 485 (434) | 450 (315) | 305 (242) | 319 | 353 | 264 | 356 | 363 | 235 | ||
| NARINGENIN | 5316 (7329) | 6116 (8088) | 2663 (2853) | 2079 | 1716 | 1065 | 2052 | 2463 | 1238 | ||
| SALICYLATE | 3246 (4149) | 3271 (3269) | 10370 (51838) | 2191 | 1887 | 1704 | 2232 | 2176 | 1908 | ||
| PARAMETER | MINIMUM VALUE | MAXIMUM VALUE | % WITH DATA | ||||||||
| 5 OXO-MEHP | 0 | 2 | 1 | 441 | 61 | 32 | 91 | 100 | 100 | ||
| 5 CX-MEPP | 2 | 7 | 3 | 2112 | 146 | 96 | 91 | 100 | 100 | ||
| 5 OH-MEHP | 1 | 1 | 1 | 785 | 106 | 53 | 91 | 100 | 100 | ||
| MEHP | 0 | 1 | 0 | 52 | 19 | 15 | 91 | 100 | 100 | ||
| BPA | 0 | 1 | 0 | 530 | 129 | 6 | 88 | 100 | 100 | ||
| α-CEHC | 173 | 143 | 184 | 5197 | 4112 | 7587 | 99 | 100 | 98 | ||
| γ-CEHC. | 8 | 7 | 9 | 1028 | 163 | 619 | 94 | 95 | 96 | ||
| CORTISOL. | 1705 | 1318 | 1596 | 35951 | 24245 | 35381 | 96 | 100 | 98 | ||
| GLYCODEOXYCHOLATE | 48 | 51 | 27 | 1281 | 656 | 651 | 82 | 97 | 96 | ||
| GLYCOCHOLATE | 73 | 98 | 37 | 2044 | 1657 | 1208 | 79 | 95 | 91 | ||
| NARINGENIN | 119 | 107 | 121 | 30748 | 26278 | 8480 | 61 | 39 | 62 | ||
| SALICYLATE | 468 | 401 | 266 | 29197 | 14537 | 349510 | 99 | 100 | 100 | ||
Analytical data for plasticizers. Table 2A gives the mean, median, geometric mean, min-max, and % of children with data for each analyte by group for the free compound, Table 2B for the total compound (free plus glucuronidated). Note that absence of data could imply below the limits of detection or poorly resolved mass spectrometer peak and therefore unable to obtain a measurement. For the five plasticizers the units are ng/mg creatinine. For the other 7 compounds where the data was derived from the metabolome, the units are LC-MSMS chromatogram area (raw data from Metabolon) normalized to creatinine and divided by 106. The division by 106 is solely for readability.
Twelve sets of % glucuronidation values were available for data analyses. Five were plasticizers, BPA the primary metabolite of DEHP, MEHP plus three of its secondary metabolites, 5 OXO-MEHP, 5 CX-MEPP and 5 OH-MEHP. MEHP is a more potent endocrine disruptor than the parent compound or its metabolites [46, 47]. None of these were detected in the metabolome. Their concentrations were below the detection threshold of the metabolome methodology used.
The other seven glucuronidation efficiencies were derived from metabolites present in the metabolome. The criteria for being useable were (i) both the compound (free) and its glucuronide (bound) were present in the metabolome, (ii) after treatment with glucuronidase no glucuronide was present in metabolome, (iii) there was a parallel increase in the amount of free compound present, (iv) % bound values (= efficiency of glucuronidation) had to be obtained for at least half the subjects and (iv) the glucuronidation efficiencies covered a reasonable range (Table 2).
Seven metabolome compounds met all of these criteria. There was one steroid (cortisol), two bile acids (glycocholic acid (GCA) and glycodeoxycholic acid, (GCDA)), two vitamin E metabolites (2,5,7,8-tetramethyl-2-(2’-carboxyethyl)-6-hydroxychroman (α-CEHC) and 7,8-Trimethyl-2-(beta-carboxyethyl)-6-hydroxychroman, (γ- CEHC)), and two plant compounds, the fruit flavonoid Naringenin and Salicylate. Salicylate occurs widely in fruits and vegetables as well as the drug aspirin. When drugs are the source, Salicylate level in the urine are orders of magnitude greater than the background level. There was one such instance in the present study; a subject was found to have a level approximately six times higher than the total sample’s Salicylate mean. This data point was dropped from all further analyses.
The quantification of the data and subsequent statistical analyses were conducted in stages. First, the skewness indices of the frequency distributions for the 12 glucuronidation efficiencies (% bound) were calculated. There were five metabolites with negative skewness indices < -1.0 and one metabolite with a positive skewness > 1.0. Therefore, we used nonparametric statistical analyses for comparisons between the 12 glucuronidation efficiency data sets.
To determine whether there was sufficient variability within each of the 12 glucuronidation pathways to support further analyses, the frequency distribution for each of the 12 metabolites was divided into tertiles, highest, middle and lowest. The means and standard deviations shown in Table 2 for each of the 12 metabolites’ tertiles indicated that there was sufficient spread in the % bound glucuronidation levels to support further analyses.
Metabolon reports the metabolome results with each detected compound categorized into super-families and sub-pathways using Metabolon’s classification scheme. There were 8 super-pathways, Amino Acids (n = 226), Carbohydrates (n = 29), Cofactors and Vitamins (n = 23), Energy (n = 14), Lipids (n = 124), Nucleotides (n = 53), Peptides (n = 27), Xenobiotics (142) and unclassified compounds (n = 44). The super-pathways are broken up into numerous sub-pathways. Examples from the Amino Acids super-pathway are Glutamate metabolism, Histidine metabolism. Leucine, Isoleucine and Valine Metabolism etc. The Xenobiotics super-family include Drugs, Food additives, Chemicals etc. The two largest super-pathways were Amino Acids and Xenobiotics.
Analyses of mean fold differences between the means of the metabolites in the metabolome were used to confirm that the three groups of children were metabolically distinct and that correlational analyses to confirm associations among the plasticizers and clinical state were statistically warranted. To demonstrate that the three groups of children were metabolically different, the mean fold ratios of the means for the ASD, CTR, and ADHD groups were calculated for each of the metabolites in the metabolome (Table 3). The standard deviations (SD) of the Xenobiotic super-family, which encompassed a mixture of drugs, food additives, and various environmental chemicals were greater than for the other metabolite groupings (Table 4).
Table 3. Range of glucuronidation efficiencies.
| TERTILE/ PATHWAY | HIGHEST | MIDDLE | LOWEST |
|---|---|---|---|
| MEAN (SD) | MEAN (SD) | MEAN (SD) | |
| 5 OXO-MEHP (N = 143) | 95.22 (4.62) | 98.28(0.33) | 99.24 (0.40) |
| 5 CX-MEPP (N = 138) | 34.6 (10.06) | 51.87 (2.98) | 65.29 (6.63) |
| 5 OH-MEHP (N = 142) | 93.51 (5.55) | 97.44 (0.35) | 98.81 (0.62) |
| MEHP (N = 142) | 39.45 (9.95) | 69.04 (6.98) | 87.47 (4.84) |
| BPA (N = 140) | 51.78(17.63) | 79.08 (4.52) | 91.95 (3.76) |
| α-CEHC (N = 148) | 88.72 (3.59) | 95.98 (1.41) | 100 (0) |
| γ-CEHC (N = 146) | 95.25 (2.48) | 98.00 (0) | 99.07 (0.25) |
| CORTISOL (N = 124)) | 31.39 (7.53) | 48.9 (3.85) | 66.61 (9.81) |
| GLYCHODEOXYCHOLATE (N = 134) | 54.88 (9.19) | 73.35 (3.28) | 85.75 (4.65) |
| GLYCHOCOLATE (N = 128) | 3.1 (1.25) | 9.11 (2.22) | 30.07 (17.63) |
| NARINGENIN (N = 81) | 95 (6.04) | 99.35 (0) | 100 (0) |
| SALYCYLATE (N = 148) | 19.72 (6.87) | 42.22 (6.90) | 66.76 (8.19) |
Range of Glucuronidation Efficiencies (= % bound) for the 12 glucuronidation pathways by tertile. Abbreviations: Mono-2-ethylhexyl phthalate (MEHP), mono-(2-ethyl-5-oxohexyl) phthalate (5-oxo MEHP), mono-(2-ethyl-5-carboxypentyl phthalate (5-CX MEPP), mono-(2-ethyl-5-hydroxyhexyl) phthalate (5-OH MEHP), BPA Bisphenol A; α-CEHC, γ-CEHC, GlyCO, Glycocholate; Glydeox, Glycodeoxycholate.
Table 4. Fold ranges.
| CLASS OF METABOLITES | N | ASD / CTR | SD | ASD / ADHD | SD | ADHD / CTR | SD |
|---|---|---|---|---|---|---|---|
| Total Metabolome | 692 | 1.08* | 0.53 | 1.18** | 0.79 | 0.99 | 0.53 |
| Amino acids | 193 | 1.01 | 0.28 | 1.12** | 0.28 | 0.92** | 0.14 |
| Non-essential amino acids | 41 | 1.07 | 0.32 | 1.14** | 0.32 | 0.95 | 0.13 |
| Essential amino acids | 152 | 1.00 | 0.25 | 1.11** | 0.25 | 0.91** | 0.12 |
| Carbohydrates | 43 | 1.04 | 0.26 | 1.19 | 0.26 | 0.89 | 0.13 |
| Vitamins and Co-factors | 33 | 1.04 | 0.17 | 1.20* | 0.29 | 0.89* | 0.17 |
| Fatty acids | 52 | 1.06 | 0.45 | 1.14 | 0.39 | 0.97 | 0.25 |
| Steroids | 26 | 1.51* | 0.61 | 1.05 | 0.25 | 1.46** | 0.51 |
| Phospholipids | 19 | 1.18 | 0.38 | 1.26 | 0.34 | 0.93 | 0.12 |
| Bile acids | 21 | 0.98 | 0.23 | 1.24* | 0.27 | 0.82 | 0.23 |
| Purines and pyrimidines | 53 | 0.94 | 0.15 | 1.14 | 0.29 | 0.84 | 0.29 |
| Xenobiotics | 142 | 1.19 | 0.95 | 1.16 | 0.33 | 1.15 | 0.84 |
| All other compounds | 110 | 1.11 | 0.49 | 1.16 | 0,33* | 1.04 | 0.46 |
Mean Fold Difference Ratios by Type of Group for Different Classes of Metabolites. *p<0.05, **p<0.01.
Examination of the 151 metabolites in the Xenobiotic super-family showed that this was attributable to highly skewed data for two drugs, Acetaminophen and Ibuprofen, and the artificial sweeteners, Sucralose, Acesulfame K and Saccharine and their metabolites. This observation is not surprising because these drugs are common analgesics, and the three sweeteners are frequently added to low calorie drinks. Using z score analyses, number of SDs above the cluster’s mean, to identify outliers for these five compounds, we found z scores > 10 and even > 25. Eliminating these five compounds and their metabolites from the Xenobiotics cluster reduced the N from 151 to 142 for Xenobiotics and brought the SDs into the same range as the other compound families in the Metabolome. Removing them from the total metabolome (n = 701→n = 692) had only minimal effect on the statistical analyses because of the large number of compounds in the metabolome. A few steroid values appeared to be appeared to be anomalously high (<2SD from mean) across all groups. The likely cause was androgens in the steroid cluster (7 out of 22 compounds); there is a higher percentage of boys in the ASD and ADHD groups, hence more androgens [48].
The frequency distributions of mean fold differences were then graphically examined and approached those that might be expected for a normal distribution, and independent t tests were considered appropriate for estimating the significance of mean differences among the groups. However, some of the significant mean ratio differences between groups disappeared after application of a Bonferroni correction.
Some differences remained. For the total Metabolome, with or without inclusion of analgesics and soda sweeteners, the mean fold ratios were statistically significant for the ASD/CTR and ADHD/CTR mean ratios indicating that both the ASD and ADHD mean fold ratios were different from each other and the controls. There also were significant differences for the amino acids and vitamins-co-factors super-pathways. Mean fold ratios for the ASD and ADHD groups differed significantly from the CTR group, but not from each other. For the purposes of this study, the need was to establish that the three groups of children were metabolically distinct, and the mean fold ratio data that are displayed in Table 3 support of such differentiation.
Table 5 shows the Spearman correlations (rss) among the 12% bound glucuronidation pathways. As expected for closely related metabolic groups, there are multiple significant correlations. Although the pattern of correlations is complex, it is not random. The phthalates are chemically related, and their rss tend to cluster together. The two bile acids correlate only with each other. Cortisol seems to be unique as does Naringenin. Details about the relationships among putative groupings of the 12 glucuronidation efficiencies are tangential for the present study; the requirement for the present study is that the 12 metabolites’ rss display different patterns of significant relationships indicating that although the pathways are related, they do differ (Table 5).
Table 5. Spearman correlations.
| 5 OXO-MEHP | 5 CX-MEPP | 5 OH-MEHP | MEHP | BPA | CORTI-SOL | α-CEHC | γ-CEHC | GLYCO | GLYCO-DEOX | NARIN-GENIN | SALICY-LATE | |
|---|---|---|---|---|---|---|---|---|---|---|---|---|
| 5 OXO-MEHP | -- | 0.076 | .607** | 0.100 | -0.048 | 0.072 | 0.132 | .467** | -0.142 | -0.029 | 0.175 | .363** |
| 5 CX-MEPP | 0.076 | -- | .194* | -.263** | -.183* | -0.083 | .272** | .299** | -0.042 | 0.018 | -0.221 | .232** |
| 5 OH-MEHP | .607** | .194* | -- | -0.064 | -0.129 | 0.103 | .200* | .505** | -0.087 | 0.045 | -0.023 | .563** |
| MEHP | 0.100 | -.263 | -0.064 | -- | 0.162 | -0.124 | -.239** | -0.027 | -0.020 | 0.134 | -0.022 | |
| BPA | -0.048 | -.183* | -0.129 | .167** | -- | .302** | .249** | -0.164 | 0.022 | 0.133 | 0.067 | 0.003 |
| α-CEHC | 0.132 | .272** | .200* | -0.124 | .249** | -- | -0.047 | .383** | -0.105 | -0.091 | -.225* | 0.109 |
| γ-CEHC | .467** | .299** | .505** | -.239** | -0.164 | -0.050 | .383** | -- | -0.118 | 0.022 | -0.206 | .538** |
| CORTISOL | 0.072 | -0.083 | 0.103 | 0.162 | .302** | -0.047 | -- | -0.050 | 0.014 | 0.177 | 0.054 | .281** |
| GLYCO | -0.142 | -0.042 | -0.087 | -0.027 | 0.022 | 0.014 | -0.105 | -0.118 | -- | .681** | 0.048 | -0.115 |
| GLYDEOX | -0.029 | 0.018 | 0.045 | -0.020 | 0.133 | 0.177 | -0.091 | 0.022 | .681** | -- | 0.169 | 0.053 |
| NARINGENIN | 0.175 | -0.221 | -0.023 | 0.134 | 0.067 | 0.054 | -.225* | -0.206 | 0.048 | 0.169 | -- | -.296** |
| SALYCYLATE | .363** | .232** | .563** | -0.022 | 0.003 | .281** | 0.109 | .538** | -0.115 | 0.053 | -.296** | -- |
**. Correlation significant at the 0.01 level (2-tailed).
*. Correlation significant at the 0.05 level (2-tailed).
Spearman correlations coefficients between the 12 glucuronide conjugation. Abbreviations: Mono-2-ethylhexyl phthalate (MEHP), mono-(2-ethyl-5-oxohexyl) phthalate (5-oxo MEHP), mono-(2-ethyl-5-carboxypentyl phthalate (5-CX MEPP), mono-(2-ethyl-5-hydroxyhexyl) phthalate (5-OH MEHP), BPA Bisphenol A; α-CEHC, γ-CEHC, GlyCO, Glycocholate; Glydeox, Glycodeoxycholate. efficiencies.
*p<0.05
** p<0.01.
Table 6 displays the nonparametric comparisons of the mean ranks among the ASD, CTR, and ADHD groups for the 12 glucuronidation % bound metabolites using Kruskal-Wallis H tests. A Bonferroni adjustment of 0.05/12 (= 0.0125) was employed to control for the familywise error rate from conducting 12 mean rank comparisons. The BPA pathway was the only pathway that significantly discriminated among three groups of children (p<0.001). There was a trend for a similar relationship with MEHP (p<0.03), but after the Bonferroni adjustment, the Kruskal-Wallis H statistic was not significant.
Table 6. a. Glucuronidation pathway analysis.
b. Comparisons.
| a | |||||||||
| PATHWAY | N-ASD | ASD MEAN RANK | N-CTR | CTR MEAN RANK | N-ADHD | ADHD MEAN RANK | K-W H (1) | P | η2 |
| % Bound 5 OXO-MEHP | 60 | 70.35 | 37 | 78.50 | 46 | 68.92 | 1.26 | 0.53 | 0.01 |
| % Bound 5 CX-MEPP | 57 | 66.76 | 35 | 71.06 | 46 | 71.71 | 0.46 | 0.79 | 0.01 |
| % Bound 5 OH-MEHP | 60 | 71.88 | 36 | 73.08 | 46 | 69.77 | 0.14 | 0.93 | 0.01 |
| % Bound MEHP | 60 | 68.38 | 36 | 87.08 | 46 | 63.38 | 7.30 | 0.03 | 0.04 |
| % Bound BPA | 58 | 68.99 | 37 | 89.45 | 45 | 56.87 | 13.24 | <0.001 | 0.08 |
| % Bound α-CEHC | 66 | 76.52 | 37 | 74.64 | 45 | 71.42 | 0.40 | 0.82 | 0.01 |
| % Bound γ-CEHC | 64 | 75.88 | 37 | 61.43 | 45 | 80.03 | 4.50 | 0.10 | 0.02 |
| % Bound Cortisol | 54 | 65.06 | 31 | 71.11 | 39 | 52.12 | 5.31 | 0.07 | 0.03 |
| % Bound Glycocholate | 55 | 72.42 | 36 | 57.51 | 43 | 69.57 | 3.39 | 0.18 | 0.01 |
| % Bound Deoxyglycocholate | 53 | 66.51 | 34 | 63.53 | 41 | 62.71 | 0.28 | 0.87 | 0.01 |
| % Bound Naringenin | 40 | 43.54 | 14 | 44.14 | 27 | 35.61 | 2.25 | 0.32 | 0.0 |
| % Bound Salicylate | 65 | 78.14 | 37 | 65.24 | 46 | 76.80 | 2.33 | 0.32 | 0.0 |
| b | |||||||||
| PLANNED CONTRASTS, % BOUND BPA | U | P | d | ||||||
| ASD < CTR | 784 | 0.03 | 0.47 | ||||||
| ASD > ADHD | 981 | 0.03 | 0.51 | ||||||
| ADHD < CTR | 396 | <0.001 | 1.00 | ||||||
| POST HOC COMPARISONS FOR % BOUND MEHP | |||||||||
| ASD = CTR | 891 | 0.15 | 0.29 | ||||||
| ASD = ADHD | 1,003 | 0.16 | 0.40 | ||||||
| ADHD < CTR | 484 | <0.001 | 0.77 | ||||||
Comparisons of the 12 glucuronidation pathways among ASD, CTR, and ADHD Groups by Kruskal-Wallis H Tests with a Bonferroni adjustment for alpha/12 (= 0.0125) to control for the familywise error rate (Table 6A) followed up by Mann-Whitney U Tests with a priori planned contrasts for % Bound BPA and Bonferroni post-hoc comparisons for % Bound MEHP (Table 6B).
The mean ± SEM values for glucuronidation efficiency of the BPA pathway were ASD 72.8 ± 2.9%, CTR 69.3 ± 2.7% and ADHD 69.3 ± 2.7%. Compared to the control group, the reductions for the ASD and ADHD groups were statistically significant. Expressed as percentages, the reductions in glucuronidation efficiency are 11% for the ASD (p = 0.020) and 15% for the ADHD (p<0.001) groups. MEHP showed similar, but non-significant trends; ASD 57.6 ± 4.3%, CTR 69.2 ± 3.4% and ADHD 61.7 ± 4.3%) corresponding to reductions of the efficiency of glucuronidation of 17% for ASD and 11% for ADHD.
The next step in the statistical analyses was to examine the relationships between the metabolome metabolites and the 12 pathways with each clinical state (ASD, CTR and ADHD). First the rss were calculated to determine what the relationships of the % bound values were for each of the 12 pathways with each of the 692 metabolites in the metabolome. Only the number of positive and negative rss that were significant at ≥ 0.05 level, two-tailed test, were included in the subsequent analyses. No attempt was made to control for the plausibly high false positive rate that would occur from calculating 478,864 (3 x 12 x 692) rss. Our focus was on identifying chemically recognizable patterns of relationships. Accordingly, we examined the results by familial groupings.
Fig 1A plots the total number of statistically significant sign independent Spearman correlations between the Metabolome constituents (n = 692) and each of the 12 glucuronidation pathways for the ASD, CTR and ADHD groups. Similar patterns are found when two other ‘super-families’ amino acids (Fig 1B) and xenobiotics (Fig 1C) are plotted separately. The pattern is varied and complex, but there is nothing obviously apparent that relates to clinical status. The complex pattern of results is consistent with the 12 glucuronidation pathway being related, but not identical.
Fig 1.

a, b and c. Relationship between the total number of statistically significant correlations for each of the 12 glucuronidation pathways with ASD, CTR and ADHD for the 692 compounds in the metabolome (Fig 1a), amino acids (Fig 1c) and Xenobiotic super-families. 1 = 5-OXO MEHP, 2 = 5-X MEHP, 3 = 5-OH 4 = MEHP, 5 = BPA, 6 = GLYCOCHOLATE, 7 = GLYCODEOXYCHOLATE, 8 = CORTISOL, 9 = α-CEHC, 10 = γ-CEHC, 11 = NARINGNIN, 12 = SALYCYLATE.
The situation changes when the distributions of positive and negative correlations are examined as percentages of the total number of significant (p ≤ .05) correlations. The sum of the % positive and % negative correlations equals 100%. Fig 2A is for the total Metabolome (n = 692), whereas Fig 2B is for the Amino Acids super-pathway (n = 226) and Fig 2C is for Xenobiotics (n = 141). The three figures are similar. The numbers are not large enough to obtain meaningful plots for the other super-families, but if they are combined a similar plot to those shown in Fig 2A–2C is obtained. Marked differences between ASD, CTR and ADHD are now found.
Fig 2.
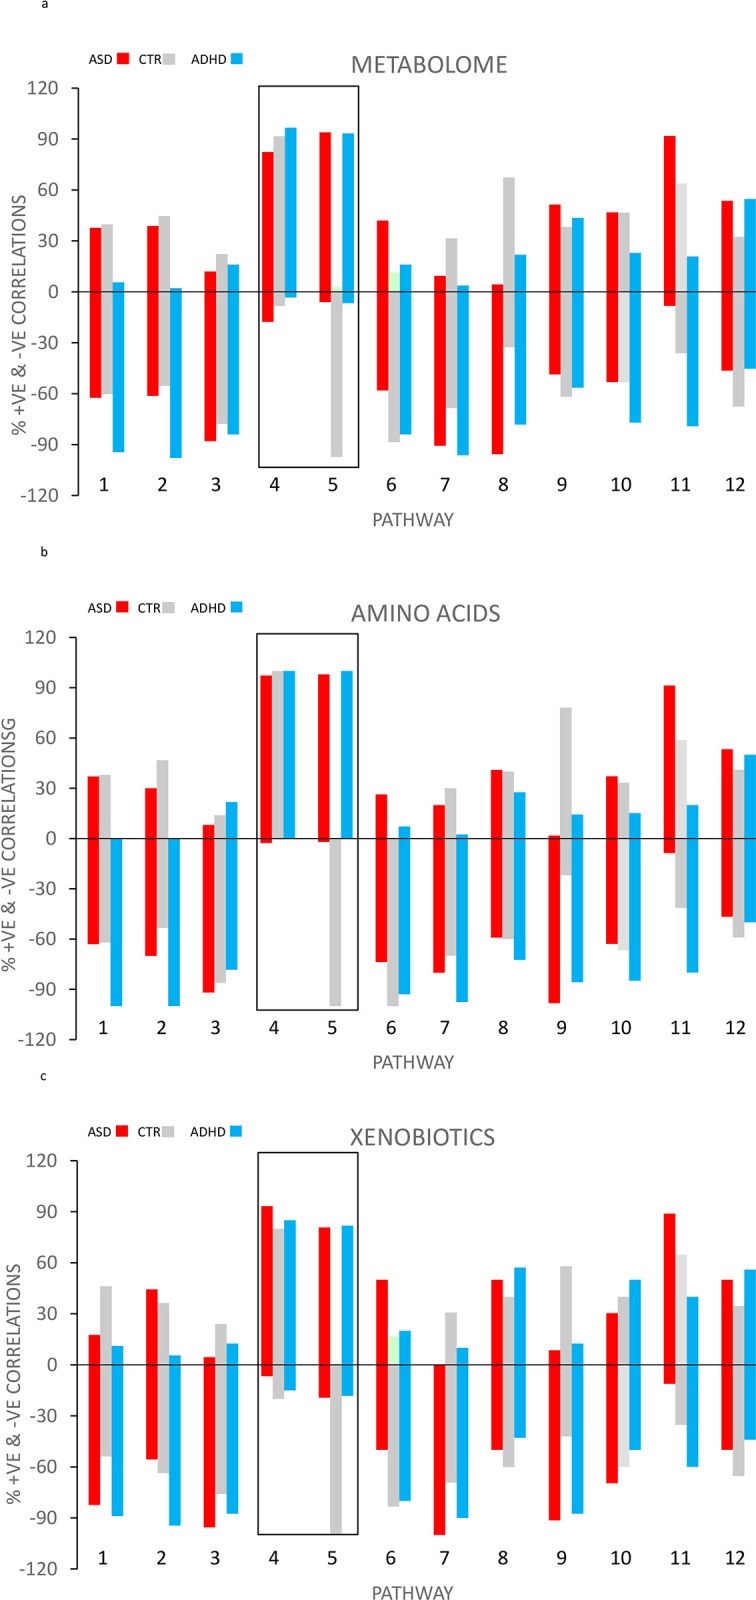
a. % of total number Spearman correlations from Fig 1A–1C either positive or negative by glucuronidation pathway for the total Metabolome (Fig 2a), amino acids (Fig 1C) and Xenobiotic super-families. 1 = 5-OXO MEHP, 2 = 5-X MEHP, 3 = 5-OH 4 = MEHP, 5 = BPA, 6 = GLYCOCHOLATE, 7 = GLYCODEOXYCHOLATE, 8 = CORTISOL, 9 = α-CEHC, 10 = γ-CEHC, 11 = NARINGNIN, 12 = SALYCYLATE.
Although the three figures are very similar, the differences between ASD, CTR and ADHD are most clearly seen in the amino acids plot. In contrast to the 9 of the other 10 pathways, virtually no negative correlations were found with ASD and ADHD for the BPA and MEHP pathways. Nearly all the correlations were positive for ASD and ADHD with BPA and MEHP.
However, ASD and ADHD differed in their relation to the control group. For the MEHP pathway there was no difference from the control group for either negative or positive correlations (Fig 2A–2C). For the BPA pathway the control group showed almost exclusively negative correlations in contrast to the MEHP pathway which showed a preponderance of positive control correlations. The figures confirm that the BPA and MEHP pathways are similar in some ways and different in other ways and both are different from the other 10 glucuronidation pathways.
We then examined the metabolome to determine whether any of the individual positive and negative correlations were common between the groups of children. ASD and ADHD had the most in common had the most in common (n = 23) and the control group the least, 13 for CTR and ASD, 4 for CTR vs ADHD. Of the 23 in common between ASD and ADHD, the majority were with the amino acids grouping (Table 7). This is further evident that at the metabolic level, the three groups of children are different but the two groups of children with neurodevelopmental disorders have commonalities not shared with healthy control children.
Table 7. Commonality.
| SUPER-PATHWAY | PATHWAY | COMPOUND NAME |
|---|---|---|
| Amino Acid | Alanine and Aspartate Metabolism | N-acetylalanine |
| Amino Acid | Glutathione Metabolism | 5-oxoproline |
| Amino Acid | Histidine Metabolism | 1-methylhistamine |
| Amino Acid | Leucine, Isoleucine and Valine Metabolism | 2-methylbutyrylglycine |
| Amino Acid | Leucine, Isoleucine and Valine Metabolism | isoleucine |
| Amino Acid | Leucine, Isoleucine and Valine Metabolism | methylsuccinate |
| Amino Acid | Leucine, Isoleucine and Valine Metabolism | N-acetylleucine |
| Amino Acid | Lysine Metabolism | N2,N6-diacetyllysine |
| Amino Acid | Polyamine Metabolism | (N(1) + N(8))-acetylspermidine |
| Amino Acid | Polyamine Metabolism | N1,N12-diacetylspermine |
| Amino Acid | Tryptophan Metabolism | C-glycosyltryptophan |
| Amino Acid | Tyrosine Metabolism | homovanillate (HVA) |
| Amino Acid | Tyrosine Metabolism | vanillactate |
| Carbohydrate | Pentose Metabolism | arabitol/xylitol |
| Lipid | Fatty Acid Metabolism(Acyl Glycine) | 2-butenoylglycine |
| Lipid | Fatty Acid, Dicarboxylate | adipate (C6-DC) |
| Lipid | Fatty Acid, Dicarboxylate | azelate (C9-DC) |
| Lipid | Fatty Acid, Dicarboxylate | pimelate (C7-DC) |
| Lipid | Fatty Acid, Dicarboxylate | suberate (C8-DC) |
| Nucleotide | Purine Metabolism, Adenine containing | N6-succinyladenosine |
| Nucleotide | Purine Metabolism, Guanine containing | 2’-deoxyguanosine |
| Nucleotide | Pyrimidine Metabolism, Uracil containing | N3-methyluridine |
| Xenobiotics | Food Component/Plant | erythritol |
Detailed list of all compounds correlating with both ASD and ADHD
Discussion
There is an extensive body of epidemiological evidence for a relationship between neurodevelopmental disorders and environmental pollutants such as plasticizers [34, 38]. Beyond showing that plasticizers function as wide-acting endocrine disruptors there is little data on the metabolic processes linking plasticizer exposure to neurodevelopmental disease in humans. Ultimately the effects of both genetics and Xenobiotics are expressed through metabolic processes.
In the present study, two semi-independent approaches were used for analyzing the data to demonstrate a linkage between plasticizer metabolism and neurodevelopmental disorders. We use the term semi-independent rather than independent because both approaches share a dependence on the value for glucuronidation efficiency for the 12 pathways. Approach #1 uses only the glucuronidation efficiency data; approach #2 uses the interaction between the 12 pathways and the metabolome. Genetic factors are likely to be important factors in determining the efficiency of glucuronidation.
Table 6 summarizes results of the first approach. The table examines the relationship of the efficiency of the 12 glucuronidation pathways to ASD and ADHD. As expected from our earlier study [30], ASD showed a correlation to a decrease in BPA glucuronidation efficiency. Unexpectedly the ADHD group also showed a correlation with the BPA pathway. The control group showed no relationship to any of the pathways. The two neurodevelopmental disorders shared a common association with a decreased ability to detoxify BPA.
Like the BPA pathway, the MEHP pathway, the primary and most abundant metabolite of the actual plasticizer DEHP, showed a non-significant trend towards an association with both ASD and ADHD. None of the other glucuronidation pathways showed any signs of a relationship to either ASD or ADHD. BPA and DEHP are chemically similar so some overlap in the efficiency of glucuronidation pathways, even if not always statistically significant is not surprising. Approach #1 shows that there is a unique association between compromised detoxification of the plasticizers, BPA and MEHP to neurodevelopmental disorders. Approach #2 confirms this finding.
The figures present a second, visual approach for understanding a wealth of metabolomic data addressing the same. This time instead of only comparing the 12 glucuronidation pathways against each other for evidence of a relationship to disorders, we examined the relationship of the 12 glucuronidation pathways to the metabolome and whether those relationships were associated with clinical diagnosis. Again, interaction between ASD and ADHD parallel each other and show a pattern not shown by any of the other pathways. Specifically, 90+% of the significant pss in the ASD and ADHD groups were positive for the BPA and MEHP pathways.
The metabolome reflects metabolism within the body. Its relationship to plasticizer exposure should be the same for all three groups of children. For BPA the difference from the control children is particularly striking; the correlations for control children go in the opposite direction than the children with neurodevelopmental disorder. For MEHP the figure differs in one important way, this time nearly all the control correlations go in the same direction as ASD and ADHD. For ADHD and ASD there is an association between disease and compromised plasticizer detoxification. Based on what is known about the etiology of the two neuro-developmental disorders, the simplest and most direct pathway for BPA and DEHP to lead to neurodevelopmental disorder is the scheme outlined in Fig 3.
Fig 3. Suggested pathway between BPA and MEHP exposure and ASD/ADHD.

It is generally accepted that the etiology of ASD is multifactorial and the most likely mechanism involves environmental toxicants acting upon genetically susceptible individuals [1–7]. We are proposing that the link between steps 2 and 4, step 3 is the compromised glucuronidation of plasticizers in children with ASD and ADHD.
This does occur in humans. A particularly relevant example is a study by Luo et on the relationship between UGT polymorphisms and environmental endocrine disruptors (including BPA) levels in Polycystic Ovary Syndrome (PCOS, [49]). The glucuronidation of BPA is known to be mediated mainly by UGT2B15, with other UGTs (UGT1A1, UGT1A3, UGT1A9, UGT2B4 andUGT2B7) contributing to a lesser extent [49, 50]. Luo at al. found PCOS to be associated with a different distribution of UGT’s and one SNP in particular to be associated with an increased risk of PCOS. Many genes have been found to associated with ASD. Amongst them are the above mentioned UGT’s [51].
The metabolic consequence of this greater residence time in the body of the active forms of the two plasticizers is more exposure to the tissues of the two plasticizers. Elevated blood levels of BPA and MEHP for children with ASD and ADHD have been reported [6, 52–55]. However while consistent with, it does not necessarily follow that this is due to decreased glucuronidation efficiency although elevated blood concentrations are consistent with the impaired glucuronidation hypothesis because the expected result is higher blood concentrations.
This is not likely to be without consequence. Numerous studies have shown both function as endocrine disruptors [17–20]. Endocrine disruption is a very broad term that can encompass multiple metabolic processes ranging from altered gene expression to altered oxidative stress. In rodent models MEHP and BPA impede fetal growth, development, and behavior [56–60]. For ADHD there is direct evidence of a systemic difference in metabolism from control children. The whole body protein synthesis and breakdown rates (turnover) and amino acid flux are elevated in children with ADHD [61] and the BMR is increased [62]. Protein turnover is a systemic process accounting for about 20% of the BMR and directly related to energy expenditure as well as nucleotide metabolism. A difference in the whole-body protein synthesis rate will reflect underlying differences in a significant proportion of the numerous metabolic processes that lead to the synthesis and degradation of proteins. There is no analogous kinetic whole-body data available for ASD even though there is a very extensive literature on the association of multiple specific differences in intermediary metabolism with neurodevelopment disease which is consistent with a systemic response [5–7, 63].
Almost certainly there are other pathways that lead to ASD and ADHD. The scheme presented in Fig 3 applies only to the plasticizer associated pathway. How important plasticizer originated neurodevelopmental disorder is in the overall occurrence of these disorders is not known, but it must account for a significant proportion or would not have been so easy to detect in a metabolic study of moderate size such as this study.
Strengths of this study
The strengths of this study are: (i) Provides biochemical data independent of epidemiology confirm prior epidemiological studies of associations between the common plasticizers and two common neurodevelopmental diseases. (ii) Fills a gap in present understanding by ‘identifying’ a plausible link (compromised glucuronidation) between genetics, plasticizer exposure and endocrine disruption. (iii) Supports this identification by two semi-independent methods. Firstly, by showing that compromised glucuronidation of BPA is associated with both ASD and ADHD. MEHP showed a non-significant trend. Secondly, documenting a unique relationship between glucuronidation efficiency and the metabolome. Finally, there is nothing new about the efficiency of glucuronidation affecting metabolism and being associated with disease, what is new is that we show this is also a plausible mechanism for ASD and ADHD.
Limitations of this study
Children with ASD and ADHD are clinically and biologically diverse. The diagnosis for this study was made on the basis of behavioral criteria. Medication intake could potentially impact upon the regulation of the glucuronidation pathway(s). Despite this confounder, ASD and ADHD groups had significantly reduced capacity in glucuronidation of BPA, which reinforces the salient results present here. Future studies with stricter inclusion criteria are required to confirm the present findings.
The principal measured parameter in this study was the % of the total compound that is glucuronidated at the time the urine specimen is collected. We equate this as also being a measure of the efficiency of glucuronidation over time from the urine collection for analysis and the immediate prior specimen.
The number of subjects is relatively small and measured at only one point in time. However it was adequate to obtain interpretable statistically significant data.
The glucuronidation pathway is the major route for xenobiotic elimination, whereas sulfation is a minor pathway accounting for <10% [22–25]. We have no data on how neurodevelopmental disease affects the sulfation pathway.
We have no reliable measurement of exposure to plasticizers. However, there is no reason to suspect any major differences between the three groups of children. The children were all drawn from a common environment, the 24 hr. dietary recall data did not reveal any gross differences and the effect sizes in this study were large. Plots of urine total plasticizer amounts against the efficiency of glucuronidation showed no correlations.
It is possible that the causative agents are not BPA and MEHP. Rather BPA and MEHP serve as markers for other unknown compound(s) that are metabolized by the same BPA and MEHP pathways.
Conclusion
The two major neurodevelopmental disorders in children are ASD and ADHD. The two disorders are clinically and metabolically different from control children but share an association with compromised detoxification pathways for the plasticizers, BPA and MEHP.
Supporting information
(XLSX)
Abbreviations
- ASD
Autism Spectrum Disorders
- CTR
Control
- ADHD
Attention Deficit/Hyperactivity Disorder
- BPA
Bisphenol-A
- DEHP
Diethylhexyl Phthalate
- MEHP
Methyl ethylhexyl Phthalate
- 5-oxo MEHP
mono-(2-ethyl-5-oxohexyl) phthalate
- 5-OH MEHP
mono-(2-ethyl-5-hydroxyhexyl) phthalate
- 5-CX MEPP
mono-(2-ethyl-5-carboxypentyl phthalate
- GCA
Glycocholic acid
- GCDA
Glycodeoxycholic acid
- α-CEHC
2,5,7,8-tetramethyl-2-(2’-carboxyethyl)-6-hydroxychroman
- γ- CEHC
7,8-Trimethyl-2-(beta-carboxyethyl)-6-hydroxychroman
- UDPGA
Uridine-5′-diphospho-α-D-glucuronic acid
- UGTs
Uridine 5′-diphospho-glucuronosyltransferases
Data Availability
All relevant data are within the paper and its Supporting Information Excel file.
Funding Statement
The project was supported by grants CAUT13APL016 from the NJ Governor’s Council for Medical Research and Treatment of Autism and NIH grant #RES015316A. No funding was received from our institutions. The funders had no role in study design, data collection and analysis, decision to publish, or preparation of the manuscript.
References
- 1.Herbert MR. Contributions of the environment and environmentally vulnerable physiology to autism spectrum disorders. Current Opinion in Neurology. 2010;23(2):103–10. doi: 10.1097/WCO.0b013e328336a01f [DOI] [PubMed] [Google Scholar]
- 2.Landrigan PJ. What causes autism? Exploring the environmental contribution. Current Opinion in Pediatrics. 2010;22(2):219–25. doi: 10.1097/MOP.0b013e328336eb9a [DOI] [PubMed] [Google Scholar]
- 3.Muhle R, Trentacoste SV, Rapin I. The genetics of autism. Pediatrics. 2004;113(5):e472–86. doi: 10.1542/peds.113.5.e472 [DOI] [PubMed] [Google Scholar]
- 4.Institute of Medicine WP. Autism and the Environment. Washington, D.C.: National Academy Press; 2008. doi: 10.1542/peds.113.5.e472 [DOI] [Google Scholar]
- 5.Zigman T, Petkovic Ramadza D, Simic G, Baric I. Inborn Errors of Metabolism Associated With Autism Spectrum Disorders: Approaches to Intervention. Frontiers in Neuroscience. 2021;15:673600. doi: 10.1186/s40246-022-00427-7 [DOI] [PMC free article] [PubMed] [Google Scholar]
- 6.Chen WX, Liu B, Zhou L, Xiong X, Fu J, Huang ZF, et al. De novo mutations within metabolism networks of amino acid/protein/energy in Chinese autistic children with intellectual disability. Human Genomics. 2022;16(1):52. doi: 10.1186/s40246-022-00427-7 [DOI] [PMC free article] [PubMed] [Google Scholar]
- 7.Minatoya M, Kishi R. A Review of Recent Studies on Bisphenol A and Phthalate Exposures and Child Neurodevelopment. International Journal of Environmental Research & Public Health [Electronic Resource]. 2021;18(7):30. doi: 10.3390/ijerph18073585 [DOI] [PMC free article] [PubMed] [Google Scholar]
- 8.Pessah IN, Lein PJ. Evidence for environmental susceptbility in autism: what we need to know about gene x environment interations. In: Zimmerman A, editor. Autism: current theories and evidence. New York: Humana Press; 2008. p. 406–64. [Google Scholar]
- 9.Center for Disease Control. Fourth National Report on Human Exposure to Environmental Chemicals. Washington, DC: CDC, DHSS; 2021. doi: 10.15620/cdc75822 [DOI] [Google Scholar]
- 10.Naaz A, M N, Heine PA. Effect of ovariectomy on adipose tissue of mice in the absence of estrogen receptor alpha: a potential role for estrogen. Horm Metab Res. 2002;34:758–63. doi: 10.1055/s-2002-38259 [DOI] [PubMed] [Google Scholar]
- 11.NTP-CERHR. Expert panel report on the reproductive and developmental toxicity of BPA. Washington, DC: CDC, DHSS; 2007. doi: 10.1055/s-2002-38259 [DOI] [PubMed] [Google Scholar]
- 12.Moore S, Paalanen L, Melymuk L, Katsonouri A, Kolossa-Gehring M, Tolonen H. The Association between ADHD and Environmental Chemicals-A Scoping Review. International Journal of Environmental Research & Public Health [Electronic Resource]. 2022;19(5):01. doi: 10.3390/ijerph19052849 [DOI] [PMC free article] [PubMed] [Google Scholar]
- 13.National toxicology Program. Fifteenth Edition. Washington, DC: U.S. Department of Health and Human Services Public Health Service National Toxicology Program; 2011. https://Doi.org/10.22427/NTP-OTHER-1003
- 14.Makris KC, Andra SS, Jia A, Herrick L, Christophi CA, Snyder SA, et al. Association between water consumption from polycarbonate containers and bisphenol A intake during harsh environmental conditions in summer. Environmental science & technology. 2013;47(7):3333–43. doi: 10.1021/es304038k [DOI] [PubMed] [Google Scholar]
- 15.Hauser R, Calafat AM. Phthalates and human health. Occupational & Environmental Medicine. 2005;62(11):806–18. doi: 10.1136/oem.2004.017590 [DOI] [PMC free article] [PubMed] [Google Scholar]
- 16.Hahladakis JN, Velis CA, Weber R, Iacovidou E, Purnell P. An overview of chemical additives present in plastics: Migration, release, fate and environmental impact during their use, disposal and recycling. Journal of Hazardous Materials. 2018;344:179–99. doi: 10.1016/j.jhazmat.2017.10.014 [DOI] [PubMed] [Google Scholar]
- 17.Flaws J DP, Patisaul HB, Gore A, Raetzman L, Vandenberg LN. A guide for public interest and policy-makers on endocrine disrupting chemicals and plastics. Endocrine Society. 2020. https://www.endocrine.org/-/media/endocrine/files/topics/edc_guide_2020_v1_6bhqen.pdf [Google Scholar]
- 18.MacKay H, Abizaid A. A plurality of molecular targets: The receptor ecosystem for bisphenol-A (BPA). Hormones & Behavior. 2018;101:59–67. doi: 10.1016/j.yhbeh.2017.11.001 [DOI] [PubMed] [Google Scholar]
- 19.Rubin AM, Seebacher F. Bisphenols impact hormone levels in animals: A meta-analysis. Science of the Total Environment. 2022;828:154533. doi: 10.1016/j.scitotenv.2022.154533 [DOI] [PubMed] [Google Scholar]
- 20.Gow PJ, Ghabrial H, Smallwood RA, Morgan DJ, Ching MS. Neonatal hepatic drug elimination. Pharmacology & toxicology. 2001;88(1):3–15.). doi: 10.1034/j.1600-0773.2001.088001003.x [DOI] [PubMed] [Google Scholar]
- 21.Welch C, Mulligan K. Does Bisphenol A Confer Risk of Neurodevelopmental Disorders? What We Have Learned from Developmental Neurotoxicity Studies in Animal Models. International Journal of Molecular Sciences. 2022;23(5):07.). doi: 10.3390/ijms23052894 [DOI] [PMC free article] [PubMed] [Google Scholar]
- 22.Liao C, Kannan K. Determination of free and conjugated forms of bisphenol A in human urine and serum by liquid chromatography-tandem mass spectrometry. Environmental science & technology.46(9):5003–9. doi: 10.1021/es300115a [DOI] [PubMed] [Google Scholar]
- 23.Volkel W, Bittner N, Dekant W. Quantitation of bisphenol A and bisphenol A glucuronide in biological samples by high performance liquid chromatography-tandem mass spectrometry. Drug Metabolism & Disposition. 2005;33(11):1748–57. doi: 10.1124/dmd.105.005454 [DOI] [PubMed] [Google Scholar]
- 24.Koch HM. Exposure assessment to phthalates by human biomonitoring. PVC Plasticizers 2010; Brussels: Crain Communications; 2010. p. 15:, 1–7. [Google Scholar]
- 25.Koch HM, Bolt HM, Preuss R, Angerer J. New metabolites of di(2-ethylhexyl)phthalate (DEHP) in human urine and serum after single oral doses of deuterium-labelled DEHP. Archives of Toxicology. 2005;79(7):367–76. doi: 10.1007/s00204-004-0642-4 [DOI] [PubMed] [Google Scholar]
- 26.Wells PG, Mackenzie PI, Chowdhury JR, Guillemette C, Gregory PA, Ishii Y, et al. Glucuronidation and the UDP-glucuronosyltransferases in health and disease. Drug Metabolism & Disposition. 2004;32(3):281–90. doi: 10.1124/dmd.32.3.281 [DOI] [PubMed] [Google Scholar]
- 27.Meech R, Hu DG, McKinnon RA, Mubarokah SN, Haines AZ, Nair PC, et al. The UDP-Glycosyltransferase (UGT) Superfamily: New Members, New Functions, and Novel Paradigms. Physiological Reviews.99(2):1153–222. doi: 10.1152/physrev.00058.2017 [DOI] [PubMed] [Google Scholar]
- 28.Stingl JC, Bartels H, Viviani R, Lehmann ML, Brockmoller J. Relevance of UDP-glucuronosyltransferase polymorphisms for drug dosing: A quantitative systematic review. Pharmacology & Therapeutics.141(1):92–116. doi: 10.1016/j.pharmthera.2013.09.002 [DOI] [PubMed] [Google Scholar]
- 29.Kasteel EEJ, Darney K, Kramer NI, Dorne J, Lautz LS. Human variability in isoform-specific UDP-glucuronosyltransferases: markers of acute and chronic exposure, polymorphisms and uncertainty factors. Archives of Toxicology.94(8):2637–61. doi: 10.1007/s00204-020-02765-8 [DOI] [PMC free article] [PubMed] [Google Scholar]
- 30.Stein TP, Schluter MD, Steer RA, Guo L, Ming X. Bisphenol A Exposure in Children With Autism Spectrum Disorders. Autism Research. 2015;8(3):272–83. doi: 10.1002/aur.1444 [DOI] [PMC free article] [PubMed] [Google Scholar]
- 31.Baranova A, Wang J, Cao H, Chen JH, Chen J, Chen M, et al. Shared genetics between autism spectrum disorder and attention-deficit/hyperactivity disorder and their association with extraversion. Psychiatry Research. 2022;314:114679. doi: 10.1016/j.psychres.2022.114679 [DOI] [PubMed] [Google Scholar]
- 32.Rebolledo-Solleiro D, Castillo Flores LY, Solleiro-Villavicencio H. Impact of BPA on behavior, neurodevelopment and neurodegeneration. Front Biosci. 2021;26(2):363–400. doi: 10.2741/4898 [DOI] [PubMed] [Google Scholar]
- 33.American Academy of Pediarics. Clinical practice guideline: diagnosis and evaluation of the child with attention-deficit/hyperactivity disorder. Pediatrics. 2000;105:1158–70. doi: 10.1542/peds.105.5.1158 [DOI] [PubMed] [Google Scholar]
- 34.Wolraich ML, Chan E, Froehlich T, Lynch RL, Bax A, Redwine ST, et al. ADHD Diagnosis and Treatment Guidelines: A Historical Perspective. Pediatrics. 2019;144(4):10. doi: 10.1542/peds.2019-1682 [DOI] [PubMed] [Google Scholar]
- 35.Praveena SM, Munisvaradass R, Masiran R, Rajendran RK, Lin CC, Kumar S. Phthalates exposure and attention-deficit/hyperactivity disorder in children: a systematic review of epidemiological literature. Environmental Science & Pollution Research. 2020;27(36):44757–70. doi: 10.1007/s11356-020-10652-z [DOI] [PubMed] [Google Scholar]
- 36.Tewar S, Auinger P, Braun JM, Lanphear B, Yolton K, Epstein JN, et al. Association of Bisphenol A exposure and Attention-Deficit/Hyperactivity Disorder in a national sample of U.S. children. Environmental research. 2016;150:112–8. doi: 10.1016/j.envres.2016.05.040 [DOI] [PMC free article] [PubMed] [Google Scholar]
- 37.Shoaff JR, Coull B, Weuve J, Bellinger DC, Calafat AM, Schantz SL, et al. Association of Exposure to Endocrine-Disrupting Chemicals During Adolescence With Attention-Deficit/Hyperactivity Disorder-Related Behaviors. JAMA Network Open. 2020;3(8):e2015041. doi: 10.1001/jamanetworkopen.2020.15041 [DOI] [PMC free article] [PubMed] [Google Scholar]
- 38.Posner J, Polanczyk GV, Sonuga-Barke E. Attention-deficit hyperactivity disorder. Lancet. 2020;395(10222):450–62. doi: 10.1016/S0140-6736(19)33004-1 [DOI] [PMC free article] [PubMed] [Google Scholar]
- 39.Ming X, Stein TP, Barnes V, Rhodes N, Guo L. Metabolic perturbance in autism spectrum disorders: a metabolomics study. Journal of proteome research. 2012;11(12):5856–62. doi: 10.1021/pr300910n [DOI] [PubMed] [Google Scholar]
- 40.Stein TP, Schluter MD, Steer RA, Ming X. Autism and Phthalate Metabolite Glucuronidation. J Autism and Dev Disorders. 2013;43:2677–85. doi: 10.1007/s10803-013-1822-y [DOI] [PMC free article] [PubMed] [Google Scholar]
- 41.Ming X, Brimacombe M, Malek J, Jani N, Wagner GC. Autism Spectrum Disorders and Identified toxic Land Fills: Co-Occurence Across States. Environmental Health Insights. 2008;2:55–9. doi: 10.1177/EHI.S830 [DOI] [PMC free article] [PubMed] [Google Scholar]
- 42.Koch HM, Rossbach B, Drexler H, Angerer J. Internal exposure of the general population to DEHP and other phthalates—determination of secondary and primary phthalate monoester metabolites in urine. Environmental research. 2003;93(2):177–85. doi: 10.1016/s0013-9351(03)00083-5 [DOI] [PubMed] [Google Scholar]
- 43.Eales J, Bethel A, Galloway T, Hopkinson P, Morrissey K, Short RE, et al. Human health impacts of exposure to phthalate plasticizers: An overview of reviews. Environment international. 2022;158:106903.). doi: 10.1016/j.envint.2021.106903 [DOI] [PubMed] [Google Scholar]
- 44.Needham LL, Calafat AM, Barr DB. Uses and issues of biomonitoring. International Journal of Hygiene & Environmental Health. 2006;210(3–4):229–38. doi: 10.1016/j.ijheh.2006.11.002 [DOI] [PubMed] [Google Scholar]
- 45.de Winter JC, Gosling SD, Potter J. Comparing the Pearson and Spearman correlation coefficients across distributions and sample sizes: A tutorial using simulations and empirical data. Psychological Methods. 2016;21(3):273–90.). doi: 10.1037/met0000079 [DOI] [PubMed] [Google Scholar]
- 46.Hong D, Li XW, Lian QQ, Lamba P, Bernard DJ, Hardy DO, et al. Mono-(2-ethylhexyl) phthalate (MEHP) regulates glucocorticoid metabolism through 11beta-hydroxysteroid dehydrogenase 2 in murine gonadotrope cells. Biochemical & Biophysical Research Communications. 2009;389(2):305–9. doi: 10.1016/j.bbrc.2009.08.134 [DOI] [PubMed] [Google Scholar]
- 47.Huber WW, Grasl-Kraupp B, Schulte-Hermann R. Hepatocarcinogenic potential of di(2-ethylhexyl)phthalate in rodents and its implications on human risk. Critical reviews in toxicology.26(4):365–481. doi: 10.3109/10408449609048302 [DOI] [PubMed] [Google Scholar]
- 48.Baio J, Wiggins L, Christensen DL, Maenner MJ, Daniels J, Warren Z, et al. Prevalence of Autism Spectrum Disorders—Autism and Developmental Disabilities Monitoring Network, 14 Sites, United States, 2008. Surveillance Summaries. Morbidity and Mortality Weekly Report (MMWR). 2012;61(3):1–19. [PubMed] [Google Scholar]
- 49.Luo Y, Nie Y, Tang L, Xu CC, Xu L. The correlation between UDP-glucuronosyltransferase polymorphisms and environmental endocrine disruptors levels in polycystic ovary syndrome patients. Medicine.99(11):e19444. doi: 10.1097/MD.0000000000019444 [DOI] [PMC free article] [PubMed] [Google Scholar]
- 50.Hanioka N, Naito T, Narimatsu S. Human UDP-glucuronosyltransferase isoforms involved in bisphenol A glucuronidation. Chemosphere. 2008;74(1):33–6. doi: 10.1016/j.chemosphere.2008.09.053 [DOI] [PubMed] [Google Scholar]
- 51.Santos JX, Rasga C, Marques AR, Martiniano H, Asif M, Vilela J, et al. A Role for Gene-Environment Interactions in Autism Spectrum Disorder Is Supported by Variants in Genes Regulating the Effects of Exposure to Xenobiotics. Frontiers in Neuroscience.16:862315. doi: 10.3389/fnins.2022.862315 [DOI] [PMC free article] [PubMed] [Google Scholar]
- 52.Kardas F, Bayram AK, Demirci E, Akin L, Ozmen S, Kendirci M, et al. Increased Serum Phthalates (MEHP, DEHP) and Bisphenol A Concentrations in Children With Autism Spectrum Disorder: The Role of Endocrine Disruptors in Autism Etiopathogenesis. Journal of Child Neurology. 2016;31(5):629–35. doi: 10.1177/0883073815609150 [DOI] [PubMed] [Google Scholar]
- 53.Kondolot M, Ozmert EN, Asci A, Erkekoglu P, Oztop DB, Gumus H, et al. Plasma phthalate and bisphenol a levels and oxidant-antioxidant status in autistic children. Environ Toxicol Pharmacol. 2016;43:149–58. doi: 10.1016/j.etap.2016.03.006 [DOI] [PubMed] [Google Scholar]
- 54.Rahbar MH, Swingle HM, Christian MA, Hessabi M, Lee M, Pitcher MR, et al. Environmental Exposure to Dioxins, Dibenzofurans, Bisphenol A, and Phthalates in Children with and without Autism Spectrum Disorder Living near the Gulf of Mexico. International Journal of Environmental Research & Public Health [Electronic Resource]. 2017;14(11):21. doi: 10.3390/ijerph14111425 [DOI] [PMC free article] [PubMed] [Google Scholar]
- 55.Verstraete S, Vanhorebeek I, Covaci A, Guiza F, Malarvannan G, Jorens PG, et al. Circulating phthalates during critical illness in children are associated with long-term attention deficit: a study of a development and a validation cohort. Intensive Care Medicine. 2016;42(3):379–92.). doi: 10.1007/s00134-015-4159-5 [DOI] [PubMed] [Google Scholar]
- 56.Borrell B. Toxicology: The big test for bisphenol A. Nature. 2010;464(7292):1122–4. doi: 10.1038/4641122a [DOI] [PubMed] [Google Scholar]
- 57.Hajszan T, Leranth C. Bisphenol A interferes with synaptic remodeling. Frontiers in Neuroendocrinology. 2010;31(4):519–30.). doi: 10.1016/j.yfrne.2010.06.004 [DOI] [PMC free article] [PubMed] [Google Scholar]
- 58.Leranth C, Hajszan T, Szigeti-Buck K, Bober J, MacLusky NJ. Bisphenol A prevents the synaptogenic response to estradiol in hippocampus and prefrontal cortex of ovariectomized nonhuman primates. Proceedings of the National Academy of Sciences of the United States of America. 2008;105(37):14187–91.) doi: 10.1073/pnas.0806139105 [DOI] [PMC free article] [PubMed] [Google Scholar]
- 59.Jones DC, Miller GW. The effects of environmental neurotoxicants on the dopaminergic system: A possible role in drug addiction. Biochemical Pharmacology. 2008;76(5):569–81. doi: 10.1016/j.bcp.2008.05.010 [DOI] [PubMed] [Google Scholar]
- 60.Yeo M, Berglund K, Hanna M, Guo JU, Kittur J, Torres MD, et al. Bisphenol A delays the perinatal chloride shift in cortical neurons by epigenetic effects on the Kcc2 promoter. Proceedings of the National Academy of Sciences of the United States of America. 2013;110(11):4315–20. doi: 10.1073/pnas.1300959110 [DOI] [PMC free article] [PubMed] [Google Scholar]
- 61.Stein TP, Sammaritano AM. Nitrogen metabolism in normal and hyperkinetic boys. American Journal of Clinical Nutrition.39(4):520–4. doi: 10.1093/ajcn/39.4.520 [DOI] [PubMed] [Google Scholar]
- 62.Mueller TF, Brielmaier S, Domsch H, Luyckx VA, Ehlers T, Krowatschek D. Increased resting energy expenditure in children with attention-deficit-hyperactivity disorder. Eating & Weight Disorders: EWD. 2010;15(3):e144–51. doi: 10.3275/6888 [DOI] [PubMed] [Google Scholar]
- 63.Schug TT, Blawas AM, Gray K, Heindel JJ, Lawler CP. Elucidating the links between endocrine disruptors and neurodevelopment. Endocrinology.156(6):1941–51. doi: 10.1210/en.2014-1734 [DOI] [PMC free article] [PubMed] [Google Scholar]
Associated Data
This section collects any data citations, data availability statements, or supplementary materials included in this article.
Supplementary Materials
(XLSX)
Data Availability Statement
All relevant data are within the paper and its Supporting Information Excel file.