

Abstract
Emotional dysfunction is a core feature of bipolar I disorder (BD). Behavioral data suggest that emotional processing may differ based on history of psychosis, but physiological studies frequently disregard this differentiating feature. Face processing studies indicate that emotion-related components of event-related potentials (ERPs) are abnormal in BD, but fMRI data using emotional scenes are mixed. The current study used ERPs to examine emotional scene perception in BD with and without a history of psychosis (BDP, BDNP). 386 participants from the PARDIP consortium (HC = 181, BDP = 130, BDNP = 75) viewed neutral, pleasant, and unpleasant scenes from the International Affective Picture System (IAPS) during continuous EEG recording. The early posterior negativity (EPN) and late positive potential (LPP) were examined for group and stimulus effects. Analyses were conducted for groups on and off medications to examine associations between medication status, psychosis, and ERP response. Group differences were found between HC and BD in emotional modulation of the EPN and between HC and BDP in the LPP to pleasant images. There was a significant interaction between psychosis history and anticonvulsant status in the EPN, but no other medication associations were found. The relationship between neural/self-reported emotional responses and clinical symptoms were examined with canonical correlations, but no significant associations were found. Results from this large well characterized sample indicate mild deviations in neural reactivity related to medication, mood, and psychosis history. However, processing of emotional scenes appears mostly intact in individuals with BD regardless of symptom severity.
Keywords: Bipolar disorders, psychosis, emotional processing, electroencephalography
Introduction
Bipolar I disorder (BD) is a highly heterogeneous syndrome characterized by episodes of mania. Emotion dysfunction, which likely arises from fronto-limbic abnormalities, is a core feature of the disorder (Strakowski et al., 2012; Townsend and Altshuler, 2012), but could be affected by history of psychosis and medication status. Flattened and inappropriate affect occur frequently in psychosis, suggesting that emotional processing may be uniquely disturbed in psychosis syndromes. While behavioral studies support this hypothesis (Ruocco et al., 2014; Thaler et al., 2013a, 2013b), differences between BD with psychosis (BDP) and without (BDNP) are understudied in the neuroimaging literature. Additionally, medication status and mood state may affect neuroimaging findings, but previous results are inconsistent and use small sample sizes (Phillips et al., 2008; Townsend and Altshuler, 2012). Emotional perception and behavior encompass a wide breadth of research areas (for an overview: Lane and Nadel, 2000), one being the emotional scene response. This topic has not yet been studied using EEG in BD, so findings would add to our understanding of emotion deficits in mood and psychosis syndromes. The current study employs a large sample to examine electrophysiological measures of emotional scene processing in BD, compares BD with and without a history of psychosis, and analyzes associations with medication status and symptomology.
Emotion processing is linked to social cognition and functional outcomes in BD (Ibáñez et al., 2014; Rheenen and Rossell, 2013), so the neural processing of emotional stimuli could underlie deficits in social functioning. During emotional stimulus processing, individuals with BD have mood-dependent amygdala activation, hypoactivation of the prefrontal cortex, and reduced connectivity between the dorsolateral prefrontal cortex and amygdala (Radaelli et al., 2015; Townsend and Altshuler, 2012). While many studies use emotional stimuli, most rely on socio-communicative faces as stimuli. Evidence shows that emotional faces and naturalistic scenes activate distinct regions of the brain (Sabatinelli et al., 2011), and are associated with differing ERP components (Thom et al., 2014), so more research is needed using complex scenes in BD. A few fMRI studies have employed emotional scenes and found mixed results. One study reported that during emotional scene viewing, individuals at high risk for BD displayed increased activation to negative images in the amygdala (Heissler et al., 2014), but other fMRI studies report no such differences from healthy comparisons (Hägele et al., 2016; Kanske et al., 2015). No studies to date have examined the temporal dynamics of the emotional scene response in BD using EEG, but findings from the face processing literature suggest reduced amplitude in emotion-sensitive visual ERP components.
One ERP component that indexes the electrophysiological response to emotional scenes is the late positive potential (LPP). The LPP is a slow-wave ERP modulated by the emotional intensity of affective stimuli (Cuthbert et al., 2000) and is associated with the motivational significance of the stimulus, with pleasant stimuli prompting appetitive motivation and unpleasant stimuli prompting defensive motivation (Löw et al., 2008). The LPP is topographically localized along the midline at central and parietal recording sites beginning roughly 400 ms after stimulus onset (Hajcak et al., 2010; Schupp et al., 2000). Correlations with the BOLD response indicate that the LPP likely originates from widespread activity across lateral occipital, inferotemporal, and parietal cortex, as well as the amygdala, ventral striatum, nucleus accumbens, anterior cingulate, and anterior insula (Liu et al., 2012; Mini et al., 1996; Sabatinelli et al., 2013).
Studies of LPP-like responses using emotional face paradigms find decreased amplitudes in BD (Ryu et al., 2010; Sokhadze et al., 2011) and associations between amplitude reduction and increased symptom severity (Culbreth et al., 2018). One study investigating responses to motivational cues reported abnormal patterns of cue response in BD, and larger parietal LPPs in those with psychosis (Horan et al., 2016). Given that the LPP is partially driven by amygdala activations, these ERP differences could result from mood-dependent activation of the amygdala and hypoconnectivity with the prefrontal cortex (Radaelli et al., 2015; Townsend and Altshuler, 2012).
Whereas the LPP indexes elaborative processing of emotional scene content (Schupp et al., 2006), the early posterior negativity (EPN) is an emotion-sensitive component reflecting the initial encoding of visual stimuli. This component is apparent from approximately 150–300 ms after cue onset at occipito-temporal sensor locations (Junghöfer et al., 2001; Schupp et al., 2004). Early and mid-latency face processing components, such as the N170, display reductions in BD relative to healthy (Degabriele et al., 2011; Ibáñez et al., 2014; Sokhadze et al., 2011), but the role of psychosis has not been investigated.
A history of psychotic features could significantly impact emotional and neural processing in BD. There is evidence for differentially impaired emotion perception and social/emotional processing in BD with and without psychosis (Thaler et al., 2013a, 2013b). More than half of bipolar cases manifest with psychosis in their course of illness (Goodwin and Jamison, 2007; Keck et al., 2003), so distinguishing individuals based on psychosis could clarify how emotional processing is disrupted in BD. Additionally, greater P3b reductions in auditory oddball tasks have been found in BDP than BDNP (Lundin et al., 2018), suggesting that BDP and BDNP have distinct underlying neurobiological features related to motivation and attention.
In the present study, we examine electrocortical reactivity to emotional and neutral scenes using the LPP and EPN. Neural response to emotional and neutral scenes at these components will be compared between healthy, BDP, and BDNP groups. We hypothesize that reduced responses to emotional scenes in BD will be evident in early stimulus processing, reflected in ERP amplitude reductions and reduced differentiation between emotional and neutral scenes. We expect the largest differences to be found between HC and BDP, with intermediate effects in BDNP. Additionally, we conduct exploratory analyses to examine associations between response amplitudes, medication status, and symptomology. Medication analyses are conducted within the BD groups for individuals on and off lithium, anticonvulsants, second generation antipsychotics, and SSRIs. A canonical correlation analysis is used to examine multivariate relationships between emotional responses and symptoms. Reduced LPP and EPN amplitudes in response to visual emotional stimuli or reduced discrepancy between emotional and neutral images could potentially contribute to social cognitive deficits in BD or the negative symptoms of psychosis. This novel study examining the neural correlates of emotional scene processing will add to our understanding of emotional processes in BD.
Materials and Methods
Participants
Combined across three Psychosis and Affective Research Domains and Intermediate Phenotypes (PARDIP) sites and five Bipolar-Schizophrenia Network for Intermediate Phenotype (B-SNIP2) sites (three of which were also PARDIP sites), we recruited 130 participants with BDP, 75 with BDNP, and 181 healthy participants. Detailed group demographics are reported in Table 1. Clinical groups were similarly medicated other than second-generation antipsychotics, given the lack of psychotic features in BDNP (Tables S2–S5).
Table 1.
Demographics
| HC | BDP | BDNP | Statistic | p | |
|---|---|---|---|---|---|
|
| |||||
| N | 181 | 130 | 75 | ||
| Mean age | 39.31 | 39.35 | 41 | F(2,383) = 1.17 | .31 |
| Age SD | 12.06 | 11.46 | 12.52 | ||
|
| |||||
| Sex (% F) | 54 | 55 | 71 | χ2(2) = 6.88* | .03 |
|
| |||||
| Site (%) | |||||
|
| |||||
| Dallas | 18 | 29 | 36 | ||
| Boston | 20 | 15 | 12 | ||
| Hartford | 29 | 22 | 49 | χ2(8) = 59.07*** | <.001 |
| Chicago | 18 | 30 | 0 | ||
| Georgia | 16 | 5 | 3 | ||
|
| |||||
| GAF | F(2,334) = 257.25*** F(1,189) = 2.82 |
< .001 .09 |
|||
|
| |||||
| N | 146 | 124 | 67 | HC > BDP/BDNP*** | |
| M | 82.52 | 55.49 | 58.64 | ||
| SD | 7.17 | 12.85 | 11.44 | ||
|
| |||||
| Birchwood Social Functioning Scale | F(2,365) = 60.35*** F(1,194) = .13 |
< .001 .72 |
|||
|
| |||||
| N | 172 | 126 | 70 | HC > BDP/BDNP*** | |
| M | 154.16 | 129.39 | 130.67 | ||
| SD | 18.096 | 25.34 | 20.07 | ||
|
| |||||
| PANSS Positive | F(1,190) = 4.76 | .03 | |||
|
| |||||
| N | N/A | 121 | 71 | BDP > BDNP* | |
| M | N/A | 14.66 | 12.89 | ||
| SD | N/A | 6.24 | 3.68 | ||
|
| |||||
| PANSS Negative | F(1,190) = .25 | .62 | |||
|
| |||||
| N | N/A | 121 | 71 | ||
| M | N/A | 14.40 | 14.90 | ||
| SD | N/A | 6.78 | 6.33 | ||
|
| |||||
| PANSS General | F(1,190) = .00 | .99 | |||
|
| |||||
| N | N/A | 121 | 71 | ||
| M | N/A | 31.94 | 31.93 | ||
| SD | N/A | 11.08 | 8.86 | ||
|
| |||||
| PANSS Total | F(1,190) = .18 | .67 | |||
|
| |||||
| N | N/A | 121 | 71 | ||
| M | N/A | 61.01 | 59.72 | ||
| SD | N/A | 22.11 | 16.26 | ||
|
| |||||
| MADRS | F(1,192) = .27 | .61 | |||
|
| |||||
| N | N/A | 122 | 72 | ||
| M | N/A | 15.87 | 15.00 | ||
| SD | N/A | 12.26 | 9.60 | ||
|
| |||||
| YMRS | F(1,192) = .27 | .60 | |||
|
| |||||
| N | N/A | 122 | 72 | ||
| M | N/A | 9.82 | 9.19 | ||
| SD | N/A | 8.64 | 7.12 | ||
|
| |||||
| CAS | F(1,192) = .10 | .75 | |||
|
| |||||
| N | N/A | 122 | 72 | ||
| M | N/A | 6.61 | 6.35 | ||
| SD | N/A | 5.77 | 5.43 | ||
|
| |||||
| BIS | F(1,201) = .21 | .65 | |||
|
| |||||
| N | N/A | 129 | 74 | ||
| M | N/A | 72.39 | 71.46 | ||
| SD | N/A | 14.80 | 11.80 | ||
Note.
p < .05
p < .01
p < .001.
Tukey’s tests were used for post-hoc analyses.
GAF = Global Assessment of Functioning; Birchwood Social Functioning Scale; PANSS = Positive and Negative Syndrome Scale; MADRS = Montgomery-Asberg Depression Rating Scale; YMRS = Young Mania Rating Scale; CAS = Clinical Anxiety Scale; BIS = Barratt Impulsiveness Scale. SD = standard deviation.
Trained masters- or doctoral-level clinicians diagnosed participants with bipolar I disorder according the Structured Clinical Interview for DSM-IV-TR disorders (SCID; First et al., 2002). Clinical features were assessed using a wide range of clinical scales documented in Tamminga et al., 2013. Group scores on these scales are reported in Table 1.
Healthy subjects were free of any lifetime psychotic or mood disorders and had no first-degree relatives with a history of psychotic or bipolar disorders according to the Family History Research Diagnostic Criteria (Endicott, 1978). Exclusion criteria for all subjects included current illegal drug use (established by a urine toxicology screening), substance abuse within one month of testing, substance dependence within three months, extensive past substance use, presence of a major neurological disorder (including loss of consciousness for greater than 30 minutes), and a major medical disorder affecting the central nervous system (other than a psychiatric condition for the bipolar groups). For more detailed information about recruitment and procedures, see Tamminga et al., 2013.
All subjects provided informed consent prior to inclusion after receiving a full description of the study. The institutional review board approved this project at all participating sites, and procedures were in accordance with the Declaration of Helsinki 2013.
Procedures
Across all sites, stimulus presentation and recording equipment were identical, and testing conditions were similar. Researchers were trained and monitored to guarantee uniform data collection procedures.
Emotional stimuli.
Stimuli consisted of 60 pseudorandomly ordered scenes from the International Affective Picture System (IAPS; Lang et al., 1997) including 20 unpleasant (UP), 20 pleasant (P), and 20 neutral (N) stimuli. Stimuli included human threat, animal threat, erotica, romantic couples, people, families, and landscapes. Participants viewed each scene three times during the experimental session. Scenes were presented in grayscale and balanced to be statistically equivalent (p > .20) in luminance and 90% quality JPEG file size, as a rough index of complexity.
Data collection.
Participants wore a 64 EEG sensor net with mastoid and CB 1/2 sensors, with nose reference and forehead ground (QuikCap, Compumedrics Neuroscan, El Paso, Texas). Individual sensor impedances were kept below 10 kΩ, and data were sampled at 1000 Hz with a bandpass filter of direct current (DC) to 100 Hz. During data recording, participants viewed a fixation cross, then an IAPS image for 1000 ms, followed by 3.5 seconds of a black screen. After the EEG recording, participants rated each scene according to experienced arousal and valence using the Self-Assessment Manikin (Bradley and Lang, 1994).
EEG data processing.
Raw data were inspected for bad sensor recordings, and bad electrode recordings (no more than 5% for any subject) were interpolated using a spherical spline method in BESA® (MEGIS Software, Gräfelfing, Germany). Data were transformed to an average reference and digitally filtered from 0.1 (12 dB/oct, zero phase) to 50 (48 dB/oct, zero phase) Hz. Eye blink, cardiac, and muscle artifacts were identified using the Independent Component Analysis (ICA) toolbox in EEGLAB (Delorme and Makeig, 2004) under Matlab (MathWorks, Natick, Mass). To minimize these artifacts, researchers removed no more than 5 ICA components (out of a possible 64; including eye blinks, heart beats, and muscle tension) from continuous data per participant. Data were downsampled to 500 Hz. Epochs containing activity greater than 120 μV at any sensor were not included, and no less than 25 trials were included in each subject’s ERP waveform average, per scene content. An average of 57 trials were included in each waveform average (SD = 3.70), which did not significantly differ between groups or scene types (details in Supplementary Methods).
Data reduction
The EPN and LPP were selected to index emotional processing. Sensors representing each component were chosen based on emotional difference topographies (Figure 1). To represent the EPN, sensors P7, P8, PO7, PO8, CB1, and CB2 were averaged over 150–250 ms. For the LPP, sensors FCz, C1, Cz, C2, and CPz were averaged over 400–900 ms (ERPs shown in Figure 2). These values were then adjusted for effects of age by calculating age regression coefficients in the healthy group, and removing these age-related effects from all groups’ data, as documented in Dukart et al., 2011 (age effects reported in Supplementary Methods).
Figure 1.
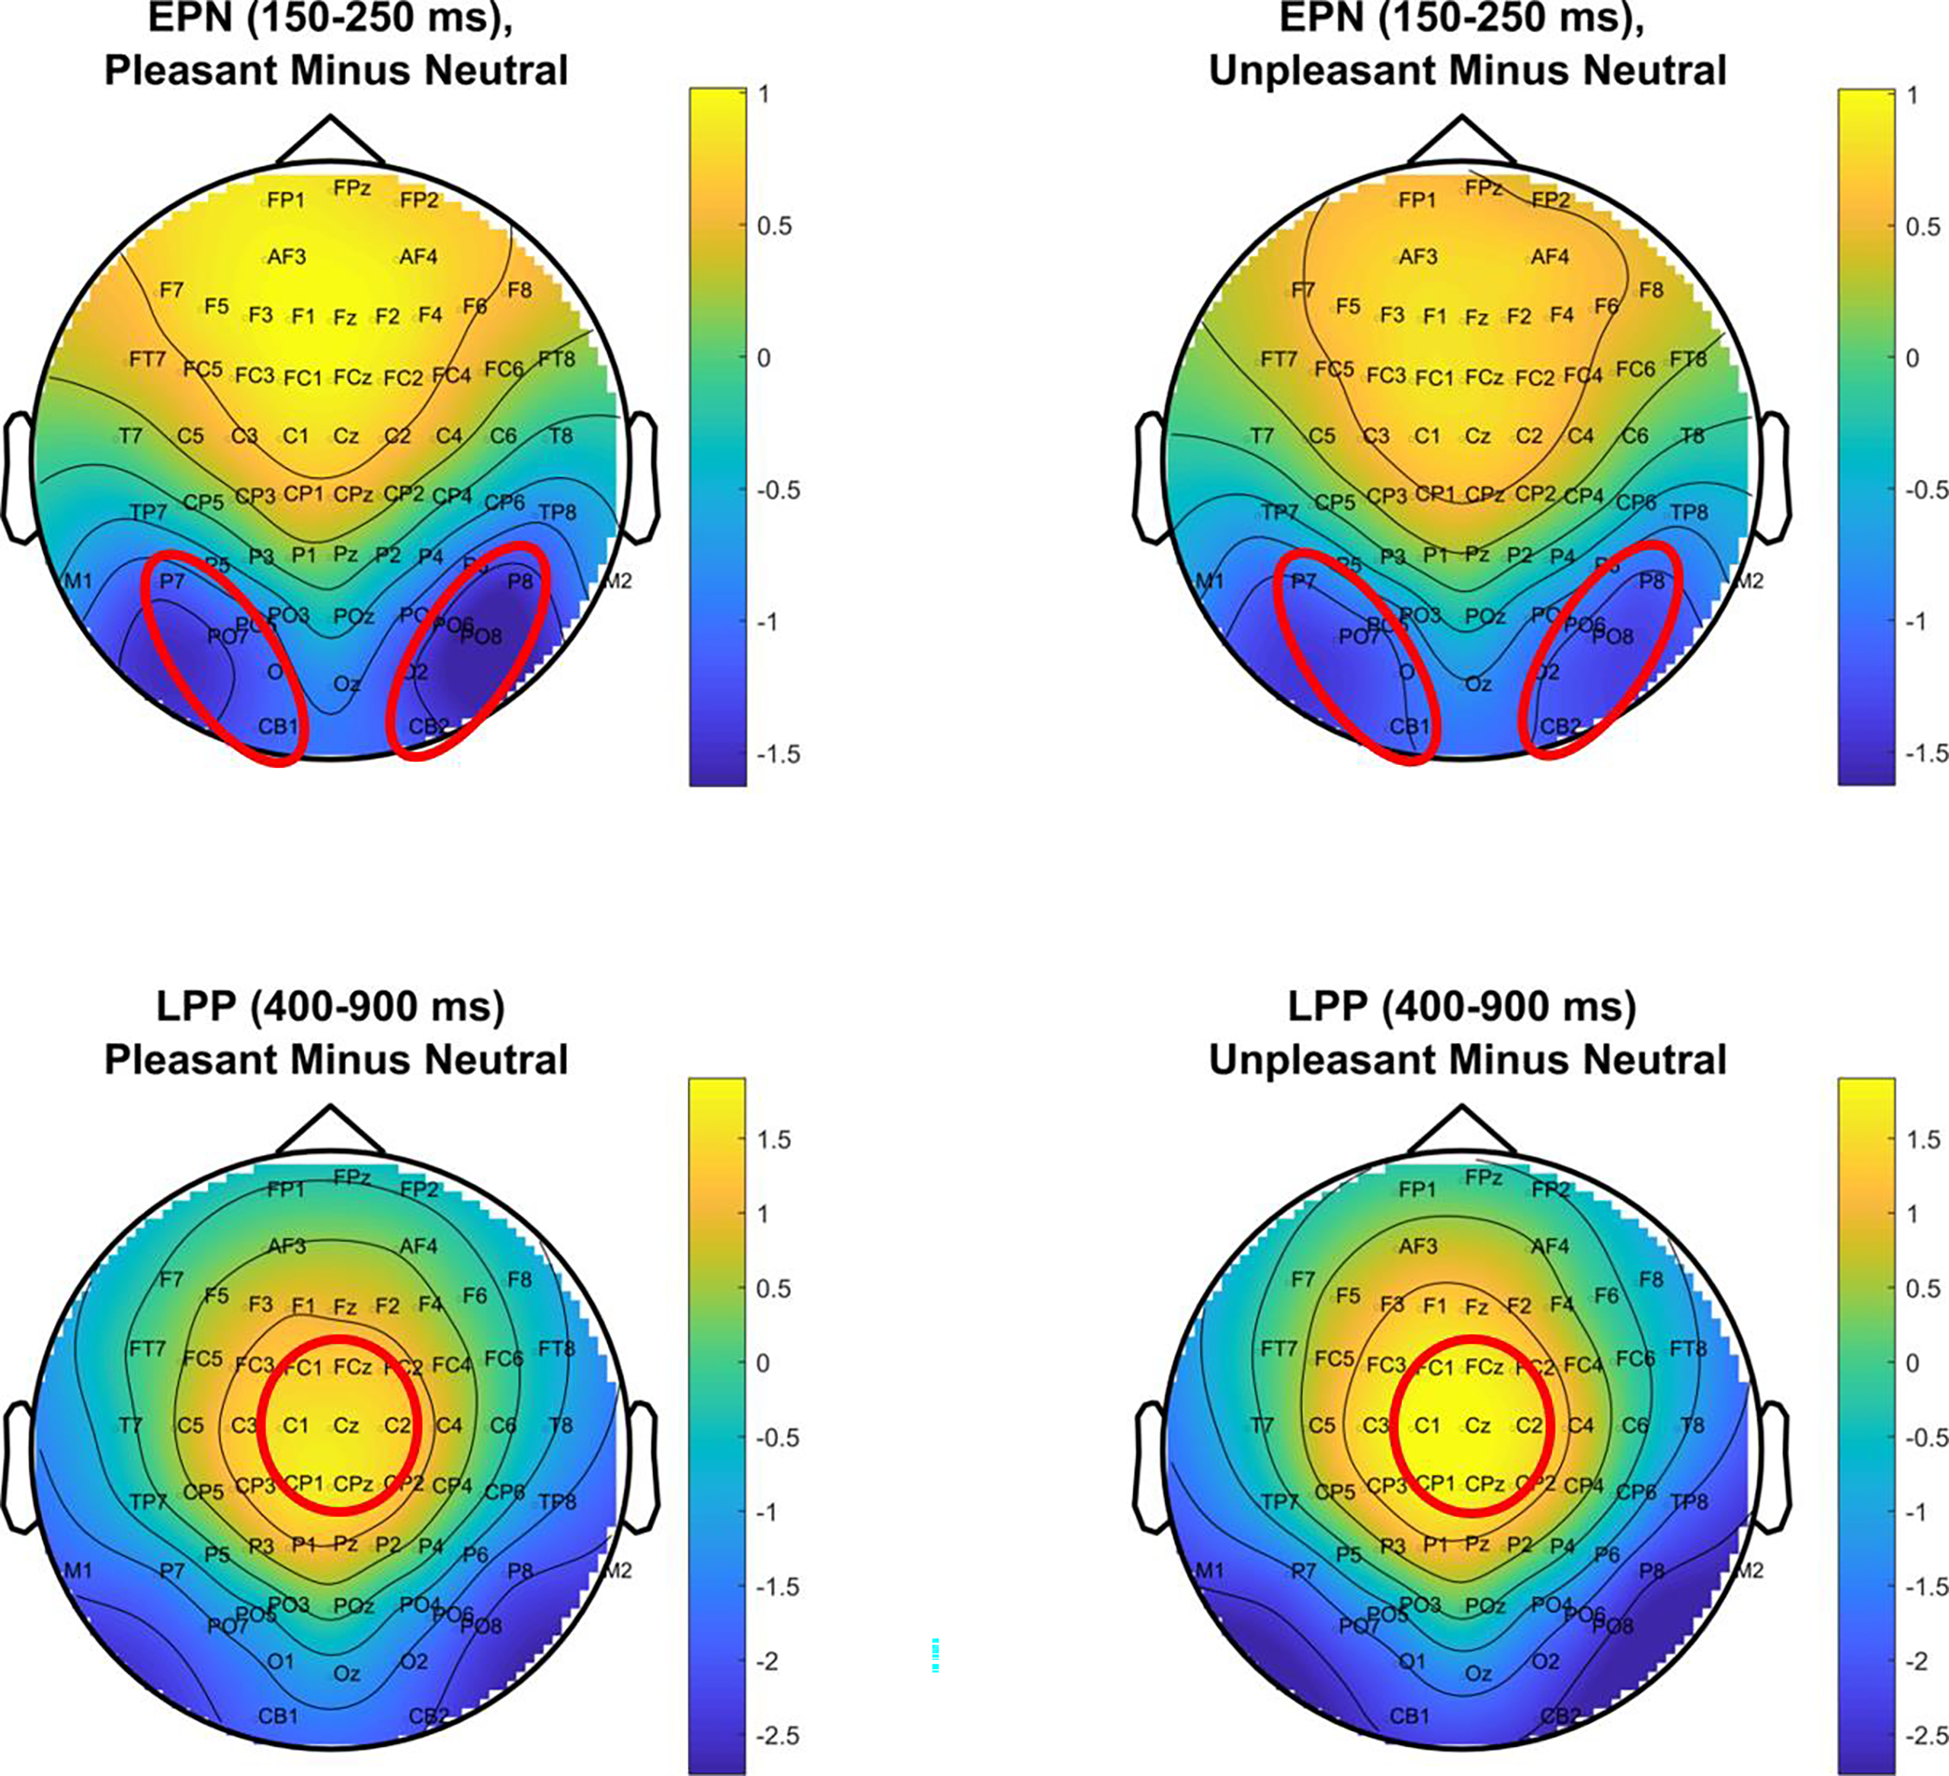
Topographies of the emotional difference (response to pleasant and unpleasant minus neutral) at the EPN and LPP time ranges. Circled sensors were averaged over to quantify the EPN and LPP.
Figure 2.
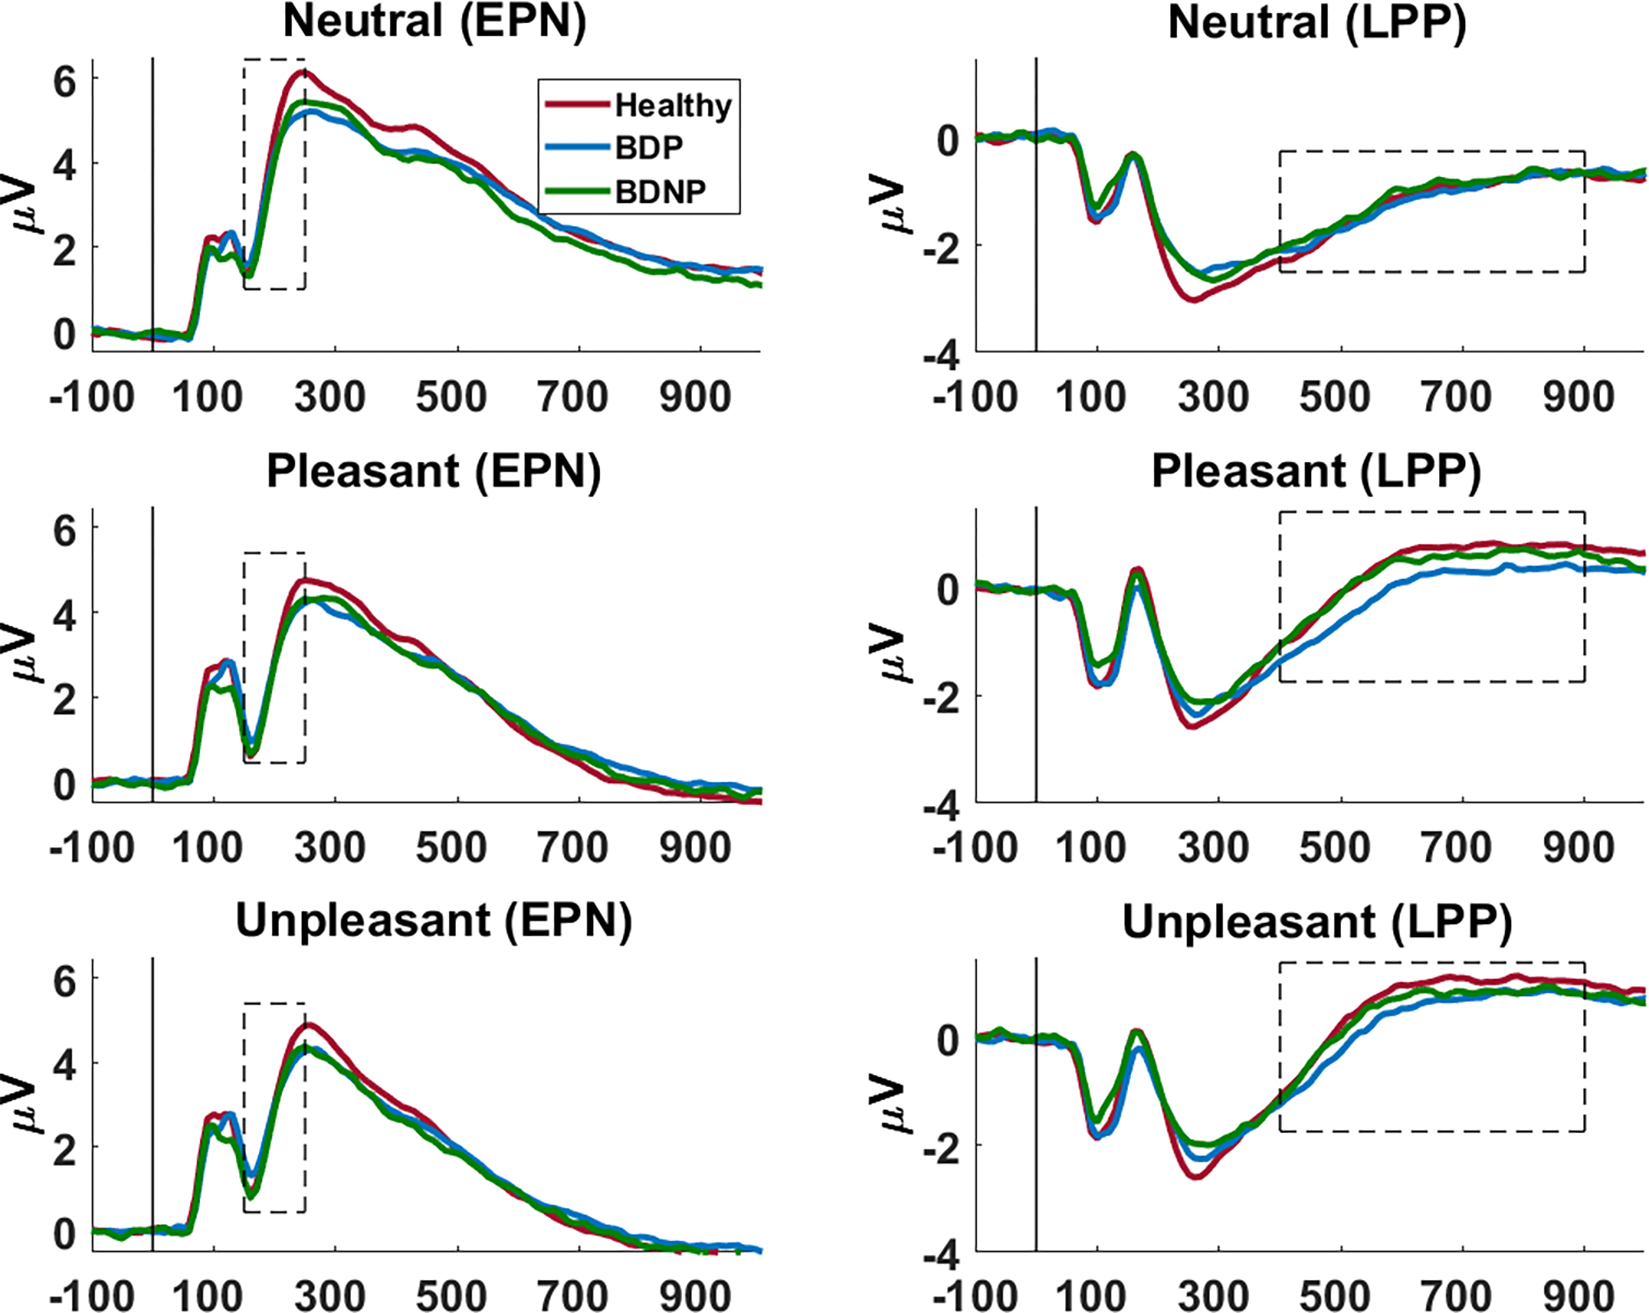
ERPs across time at the chosen sensor clusters (EPN cluster: left; LPP cluster: right). Chosen time ranges are outlined. ERPs are shown for healthy (red), BDP (blue), and BDNP (green) for neutral, pleasant, and unpleasant images (descending).
Data Analysis
All statistics were performed in SPSS (IBM, Version 6). For tests that violated Mauchley’s Test of Sphericity, Greenhouse-Geisser corrections were used. Original degrees of freedom are reported in the text.
Self-report analyses.
Ratings were examined for group and stimulus differences in self-reported pleasantness and arousal. Only 371 (HC: N=175, BDP: N=125, BDNP: N=71) out of the total 386 subjects completed at least 75% of the items on each scale, so this subset was used for statistical analysis of emotional ratings. Mixed-design ANOVAs were conducted with a 3 (scene valence: N/P/UP) X 3 (group: HC/BDP/BDNP) design. Group effects were not significant, but effects of valence were examined using paired-samples t-tests with a Bonferroni correction (α = .016).
Effects of bipolar disorder and psychosis.
Mixed design ANOVAs using a 3 (scene valence: N/P/UP) X 3 (group: HC/BDP/BDNP) design were carried out on these values. Follow-up planned contrasts were conducted examining 1) the difference between HC and BD (irrespective of psychosis history) to determine if emotional scene processing is abnormal in bipolar disorder, and 2) the difference between BDP and BDNP, to examine if history of psychotic features affects processing. Effect sizes (ES) were calculated using Glass’ delta.
Effects of medication status and dose in bipolar disorder.
To examine how medication status may impact neural correlates of emotional scene processing, exploratory medication analyses were performed on the EPN and LPP. Only medications with an adequate sample size (all cells n ≥ 20) for these analyses were included (second generation antipsychotics, SSRIs, lithium, and anticonvulsants). Number of participants on and off these and other medications are reported in Table S2. Mixed design ANOVAs were conducted using a 3 (scene valence) X 2 (psychosis history: BDP/BDNP) X 2 (medication status: on/off) model. Follow-up t-tests were conducted as appropriate. Holm-Bonferroni corrections were implemented on omnibus ANOVAs for multiple comparisons. Effect sizes were calculated using Glass’ delta.
Lithium doses and CPZ equivalents (calculated using the Andreasen method; Andreasen, Pressler, Nopoulos, Miller, & Ho, 2010) were available for analysis. Pearson correlations with lithium and CPZ dosage were conducted separately in BDP and BDNP on EPN and LPP amplitudes for each stimulus valence. No correlations were significant, so corrections for multiple comparisons were not needed. Average dosage for each group can be found in Tables S4–5.
Canonical correlations for relationship with clinical measures.
To assess the relationships between measures of emotional processing and clinical symptoms, such as mood state and psychosis intensity, canonical correlations (CCAs) were conducted using each neural measure (6 measures: LPP and EPN amplitudes for each scene valence) and self-report measure (6 measures: pleasantness and arousal for each scene valence) as the first set and clinical measures (Table 1, details in Supplemental Methods; see Table 3 for included variables) as the second. Two CCAs were conducted: one to assess relationships between neural and clinical measures, and one to assess relationships between self-report and clinical measures.
Table 3.
Canonical correlation variate pairs and loadings
| EEG correlation | Self-report correlation | ||
|---|---|---|---|
|
|
|
||
| Set 1 | Loading | Set 1 | Loading |
|
|
|
||
| EPN, neutral | .55 | Pleasantness, neutral | −.20 |
| EPN, pleasant | .64 | Pleasantness, pleasant | −.12 |
| EPN, unpleasant | .40 | Pleasantness, unpleasant | −.37 |
| LPP, neutral | −.41 | Arousal, neutral | .08 |
| LPP, pleasant | −.64 | Arousal, pleasant | −.26 |
| LPP, unpleasant | −.42 | Arousal, unpleasant | −.75 |
|
|
|
||
| Set 2 | Loading | Set 2 | Loading |
|
|
|
||
| Global functioning (GAF) | .22 | GAF | .17 |
| Social functioning (SFS) | .68 | SFS | .65 |
| Positive symptoms (PANSS) | −.45 | PANSS Positive | .02 |
| Negative symptoms (PANSS) | −.32 | PANSS Negative | −.69 |
| General symptoms (PANSS) | −.75 | PANSS General | −.48 |
| Depression (MADRS) | −.50 | MADRS | −.47 |
| Mania (YMRS) | −.35 | YMRS | −.07 |
| Anxiety (CAS) | −.64 | CAS | −.39 |
| Impulsiveness (BIS) | −.44 | BIS | −.14 |
Note. Canonical correlations were not significant.
CCA identifies the relationship between two sets of variables by forming linear combinations of each set that maximize the correlation between sets, in this case the two sets are 1) emotional measures and 2) clinical measures. Assessing dimensional measures of symptomology is more statistically powerful than categorical distinctions of current mood, psychosis, and functional status. For information about each group’s current symptom state, see Table 1. Additionally, CCA is particularly suitable when variable sets have high intercorrelations, as resulting variate pairs are independent and maximally correlated (Levine, 1977; Rodrigue et al., 2018).
Results
Self-report data
Analysis of self-reported scene ratings yielded a significant main effect of scene content for pleasantness [F(2,736) = 927.64, p < .001] and arousal [F(2,736) = 133.15, p < .001]. Pleasantness ratings followed the expected pattern of pleasant (P) < neutral (N) < unpleasant (UP; all p < .001), with lower ratings indicating more perceived pleasantness. Arousal ratings followed the pattern of UP < P < N (all p < .01), with lower ratings indicating more perceived arousal.
There was not a main effect of group [pleasantness: F(2,368) = .15, p = .88, arousal: F(2,368) = 1.63, p = .63] or group by valence interaction [pleasantness: F(4,736) = 1.07, p = .36, arousal: F(4,736) = 1.54, p = .20], so scene ratings did not statistically differ between groups.
EPN – Bipolar versus Healthy
The EPN showed the expected main effect of valence [F(2,766) = 252.64, p < .001], with enhanced voltage negativity to emotional scenes than N (both p < .001), and no difference between P and UP (p = .93). There was not a significant main effect of group [F(2,383), p = .75], but there was a significant group by valence interaction [F(4,766) = 1.94, p = .03]. This was not explained by contrast tests for any single scene content (Figure 3; statistics reported in Table 2), but contrasts on the emotional difference scores (difference between neutral and emotional scene response) accounted for the interaction. HC had a significantly larger emotional difference score than BD [t(383) = −2.68, p = .008; ES = .28], but scores were similar in BDP and BDNP [t(383) = −.65, p = .52; ES = −.09].
Figure 3.
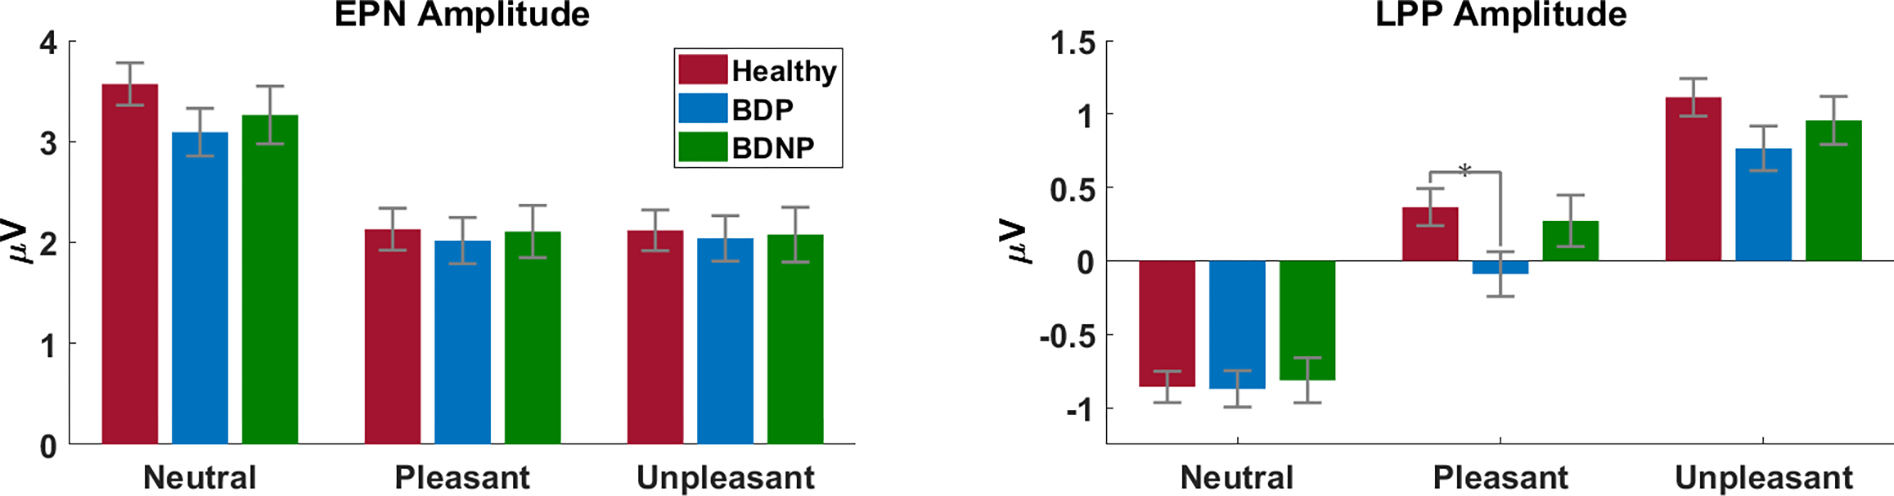
Average EPN (left) and LPP (right) amplitudes for each stimulus valence (x axes) and group (HC: red; BDP: blue; BDNP: green). The LPP displays a difference between HC and BDP for pleasant images.
Table 2.
Contrast tests
| Contrast Value | t | df | p | |
|---|---|---|---|---|
|
| ||||
| EPN- Neutral | ||||
|
| ||||
| HC / BD | .78 | 1.40 | 343 | .16 |
| BDP / BDNP | −.17 | −.46 | 165 | .65 |
|
| ||||
| EPN- Pleasant | ||||
|
| ||||
| HC / BD | .14 | .25 | 345 | .80 |
| BDP / BDNP | −.09 | −.26 | 174 | .80 |
|
| ||||
| EPN- Unpleasant | ||||
|
| ||||
| HC / BD | .12 | .23 | 343 | .82 |
| BDP / BDNP | −.04 | −.10 | 166 | .92 |
|
| ||||
| LPP- Neutral | ||||
|
| ||||
| HC / BD | −.03 | −.11 | 342 | .91 |
| BDP / BDNP | −.06 | −.30 | 163 | .77 |
|
| ||||
| LPP- Pleasant | ||||
|
| ||||
| HC / BD | .55 | 1.60 | 351 | .11 |
| BDP / BDNP | −.36 | −1.57 | 172 | .12 |
|
| ||||
| LPP- Unpleasant | ||||
|
| ||||
| HC / BD | .51 | 1.49 | 354 | .14 |
| BDP / BDNP | −.19 | −.85 | 180 | .40 |
Note. Degrees of freedom are adjusted to not assume equal variances
EPN – Medication Analyses within Bipolar Groups
There were no main effects of second generation antipsychotic or SSRI status, medication by psychosis interactions, or interactions with scene valence. The main effect of lithium status, psychosis by lithium interaction, and interactions with valence did not survive corrections for multiple comparisons (statistics reported in Table S6). There was a significant anticonvulsant by psychosis interaction [F(1,201) = 7.45, p = .007], but not a main effect of anticonvulsant status, or any interactions with valence (Table S6). Amplitudes were significantly higher in BDP on anticonvulsants than off [t(128) = 2.10, p = .038; ES = −.33], and there was a trend towards lower amplitudes in BDNP on anticonvulsants than off [t(73) = −1.93, p = .057; ES = .49].
For medication dosage, neither CPZ dose equivalents nor lithium dose significantly correlated with EPN amplitude for any scene valence (all p > .38).
LPP – Bipolar versus Healthy
The LPP also displayed the expected main effect of valence [F(2,766) = 403.53, p < .001], with significantly enhanced voltage positivity to emotional images than to N (both p < .001). Additionally, response amplitudes for UP scenes were significantly higher than those for P (p < .001). There was not a main effect of group [F(2,383) = 1.38, p = .25], but there was a significant group by valence interaction [F(4,766) = 3.10, p = .02]. This interaction was not accounted for by a difference in response amplitude between HC and BD or between BDP and BDNP for any single scene content (Table 2), but t-tests show a significant difference in response amplitude to P scenes between HC and BDP [t(309) = 2.31, p = .02; ES = −.27]. There were no significant differences for any other scene content (both p >.08) or between any other groups (all p > .11; Figure 3).
LPP - Medication Analyses within Bipolar Groups
There were no main effects of second generation antipsychotic or SSRI status, medication by psychosis interaction, or any interactions with scene valence that survived corrections for multiple comparisons. There were no main effects of lithium or anticonvulsant status, medication by psychosis interactions, or any interactions with scene valence on the LPP (Table S6).
For medication dosage, CPZ equivalent and lithium dosage did not significantly correlate with LPP amplitude for any scene valence (all p > .79).
Relationship between clinical symptoms and emotion measures
For neural emotion processing measures (EPN, LPP) and self-report measures (pleasantness, arousal), the canonical correlation analyses were not significant (neural pair 1: r = .34, F(54) = 1.13, p = .26; self-report pair 1: r = .43, F(54) = 1.14, p = .23; Table 3), so there was not evidence for associations between measured clinical symptoms of BD and emotional scene perception.
Discussion
This study provided a comprehensive evaluation of emotional scene processing in bipolar disorder. We leveraged data from a large sample and took into consideration psychosis history, medication status, and clinical symptoms. Bipolar groups displayed modestly lower sensitivity to emotional scenes at the EPN, and we found a small difference between HC and BDP in the LPP response to pleasant scenes. Despite minor differences in neural reactivity between bipolar groups, analyses did not provide evidence for deviations between BD and healthy on self-reported measures of the emotional scene response or multivariate relationships with symptoms. Effects of medication status were minimal, with some evidence for diverging associations between anticonvulsants and EPN amplitude in those with and without psychosis. In general, it thus appears that the motivational systems engaged by evocative scene stimuli remain essentially intact in BD.
As hypothesized, and expected based on considerable previous data, we observed robust effects of emotional scene content on the electrocortical response using an emotional scene perception paradigm, with enhanced activity to emotional relative to neutral content. It should be noted that we also observed an overall difference between pleasant and unpleasant scene response in the LPP, though most other studies using the IAPS find no such difference. This effect may be due to the set of pleasant scenes used, as participants rated pleasant scenes as significantly less arousing than unpleasant, and intensity of the ERP response is closely linked with rated arousal (Bradley et al., 2003).
Bipolar groups did not significantly differ from healthy in their self-reports of pleasantness and arousal, replicating results of another large study on self-reported emotion in the IAPS (Aminoff et al., 2011). Other syndromes on the schizo-bipolar spectrum have shown larger deviations from healthy on behavioral measures of emotion, but impairments generally follow a stair-step pattern progressing from bipolar disorder to non-affective schizophrenia (Aminoff et al., 2011; Ruocco et al., 2014; Thaler et al., 2013a). Therefore, future examinations of the emotional response may benefit from using a dimensional approach to examine the wider psychosis spectrum (Keshavan et al., 2011).
In this study, the EPN displayed a modest reduction in emotional modulation for the bipolar group. This finding is consistent with literature on emotional face processing in BD, which documents amplitude reductions in early and mid-latency ERP components (Degabriele et al., 2011; Ibáñez et al., 2014; Sokhadze et al., 2011). Additionally, there was a significant interaction between anticonvulsant status and psychosis in the EPN. Effects were moderate in size and differing in direction between BDP and BDNP. While this result should be interpreted with caution, it suggests that people with and without psychosis could have differing neural responsivity to these medications.
The LPP showed a modest reduction in response amplitude for pleasant scenes in BDP, suggesting lower responsivity to appetitive stimuli in bipolar disorder with psychosis, though the response is mostly intact. While the LPP as a whole does not display sizable deviations from healthy, this slow-wave can be broken into multiple subcomponents (Foti et al., 2009). The possibility of abnormalities in BD during subcomponents or at other scalp regions should not be disregarded, although they were not apparent here.
Neurocognitive heterogeneity within bipolar disorder, as identified by the B-SNIP consortium, could mask some differences from healthy comparisons. In Clementz et al., 2016, researchers used a clustering algorithm on composite biomarkers to identify subtypes of individuals with psychosis (collapsed across affective and non-affective psychoses) based on their neurophysiological and cognitive features. These Biotypes display larger between-group differences in structural and functional brain characteristics than DSM diagnoses. Given the relationship between social cognition and emotional perception, Biotypes with higher levels of cognitive and social impairments might demonstrate lower discrimination between emotional and neutral scenes in EEG. Researchers have not yet identified Biotypes of non-psychotic disorders, such as BDNP, or used a neural emotional paradigm such as the IAPS to examine Biotypes, so future studies might usefully employ this task to characterize emotional scene processing deficits in these biologically distinct groups.
Limitations
This study used a cross-sectional sample, so participants had varying lengths and severity of illness, and most participants were on a variety of medications, which could have interacting neural effects. While these factors limit applicability of findings in some groups, such as unmedicated and first-episode psychosis, our wide-ranging sample is highly representative of the heterogeneity seen in community populations with bipolar disorder.
Another limitation is the range of mood states and psychosis severity in the current sample, which could explain null findings in the symptom analysis. While our sample did include individuals in manic, depressed, and euthymic states, the majority of participants were clinically stable. Future symptom analyses could focus on inpatient populations experiencing more profound symptoms.
Conclusion
This study addressed problems of clinical heterogeneity within bipolar disorder with self-reported and neural measures of emotional scene processing, finding little evidence for abnormalities in emotional scene perception. Self-reported measures did not differ from healthy, and neural measures displayed only small deviations. While prior research supports abnormalities in the emotional face response, this study suggests these neural and behavioral differences do not fully generalize to scenes, indicating that non-social emotional responding may be intact in these patients. Additionally, psychosis history, medication status, and clinical symptoms did not have consistent effects on these measures. Future research on this topic should focus on neurocognitive subtypes of mood and psychotic disorders, as well as other domains of emotional responding and behavior.
Supplementary Material
References
- Aminoff SR, Jensen J, Lagerberg TV, Andreassen OA, Melle I, 2011. Decreased self-reported arousal in schizophrenia during aversive picture viewing compared to bipolar disorder and healthy controls. Psychiatry Res. 185, 309–314. 10.1016/j.psychres.2010.07.026 [DOI] [PubMed] [Google Scholar]
- Andreasen NC, Pressler M, Nopoulos P, Miller D, Ho B-C, 2010. Antipsychotic dose equivalents and dose-years: A standardized method for comparing exposure to different drugs. Biol. Psychiatry 67, 255–262. 10.1016/j.biopsych.2009.08.040 [DOI] [PMC free article] [PubMed] [Google Scholar]
- Bradley MM, Lang PJ, 1994. Measuring emotion: The Self-Assessment Manikin and the semantic differential. J. Behav. Ther. Exp. Psychiatry 25, 49–59. [DOI] [PubMed] [Google Scholar]
- Bradley MM, Sabatinelli D, Lang PJ, Fitzsimmons JR, King W, Desai P, 2003. Activation of the visual cortex in motivated attention. Behav. Neurosci. 117, 369–380. 10.1037/0735-7044.117.2.369 [DOI] [PubMed] [Google Scholar]
- Clementz BA, Sweeney JA, Hamm JP, Ivleva EI, Ethridge LE, Pearlson GD, Keshavan MS, Tamminga CA, 2016. Identification of distinct psychosis biotypes using brain-based biomarkers. Am. J. Psychiatry 173, 373–384. 10.1176/appi.ajp.2015.14091200 [DOI] [PMC free article] [PubMed] [Google Scholar]
- Culbreth AJ, Foti D, Barch DM, Hajcak G, Kotov R, 2018. Electrocortical responses to emotional stimuli in psychotic disorders: Comparing schizophrenia spectrum disorders and affective psychosis. Front. Psychiatry 9, 1–9. 10.3389/fpsyt.2018.00586 [DOI] [PMC free article] [PubMed] [Google Scholar]
- Cuthbert BN, Schupp HT, Bradley MM, Birbaumer N, Lang PJ, 2000. Brain potentials in affective picture processing: Covariation with autonomic arousal and affective report. Biol. Psychol. 52, 95–111. [DOI] [PubMed] [Google Scholar]
- Degabriele R, Lagopoulos J, Malhi G, 2011. Neural correlates of emotional face processing in bipolar disorder: An event-related potential study. J. Affect. Disord. 133, 212–220. 10.1016/j.jad.2011.03.033 [DOI] [PubMed] [Google Scholar]
- Delorme A, Makeig S, 2004. EEGLAB: an open source toolbox for analysis of single-trial EEG dynamics. J. Neurosci. Methods 134, 9–21. 10.1016/j.jneumeth.2003.10.009 [DOI] [PubMed] [Google Scholar]
- Dukart J, Schroeter ML, Mueller K, The Alzheimer’s Disease Neuroimaging Initiative, 2011. Age correction in dementia - Matching to a healthy brain. PLoS One 6, 1–9. 10.1371/journal.pone.0022193 [DOI] [PMC free article] [PubMed] [Google Scholar]
- Endicott J, 1978. Family History: Research Diagnostic Criteria (FH-RDC). [Google Scholar]
- First MB, Spitzer RL, Gibbon M, Williams JB, 2002. Structured Clinical Interview for DSM-IV-TR Axis I Disorders, Research Version, Patient Edition (SCID-I/P). [Google Scholar]
- Foti D, Hajcak G, Dien J, 2009. Differentiating neural responses to emotional pictures: evidence from temporal-spatial PCA. Psychophysiology 46, 521–530. 10.1111/j.1469-8986.2009.00796.x [DOI] [PubMed] [Google Scholar]
- Goodwin FK, Jamison KR, 2007. Manic-depressive illness: Bipolar disorders and recurrent depression. Oxford University Press, New York. [Google Scholar]
- Hägele C, Friedel E, Schlagenhauf F, Sterzer P, Beck A, Bermpohl F, Stoy M, Held-Poschardt D, Wittmann A, Ströhle A, Heinz A, 2016. Affective responses across psychiatric disorders- A dimensional approach. Neurosci. Lett. 623, 71–78. 10.1016/j.neulet.2016.04.037 [DOI] [PubMed] [Google Scholar]
- Hajcak G, Macnamara A, Olvet DM, 2010. Event-related potentials, emotion, and emotion regulation: An integrative review. Dev. Neuropsychol. 35, 129–155. 10.1080/87565640903526504 [DOI] [PubMed] [Google Scholar]
- Heissler J, Kanske P, Schönfelder S, Wessa M, 2014. Inefficiency of emotion regulation as vulnerability marker for bipolar disorder: Evidence from healthy individuals with hypomanic personality. J. Affect. Disord. 152, 83–90. 10.1016/j.jad.2013.05.001 [DOI] [PubMed] [Google Scholar]
- Horan WP, Wynn JK, Hajcak G, Altshuler L, Green MF, 2016. Distinct patterns of dysfuntional appetitive and aversive motivation in bipolar disorder versus schizophrenia: An event related potential study. J. Abnorm. Psychol. 125, 576–587. 10.1037/abn0000142 [DOI] [PMC free article] [PubMed] [Google Scholar]
- Ibáñez A, Aguado J, Baez S, Huepe D, Lopez V, Ortega R, Sigman M, Mikulan E, Lischinsky A, Torrente F, Cetkovich M, Torralva T, Bekinschtein T, Manes F, 2014. From neural signatures of emotional modulation to social cognition: Individual differences in healthy volunteers and psychiatric participants. Soc. Cogn. Affect. Neurosci. 9, 939–950. 10.1093/scan/nst067 [DOI] [PMC free article] [PubMed] [Google Scholar]
- Junghöfer M, Bradley MM, Elbert TR, Lang PJ, 2001. Fleeting images: A new look at early emotion discrimination. Psychophysiology 38, 175–178. [PubMed] [Google Scholar]
- Kanske P, Schönfelder S, Forneck J, Wessa M, 2015. Impaired regulation of emotion: Neural correlates of reappraisal and distraction in bipolar disorder and unaffected relatives. Transl. Psychiatry 5, e497. 10.1038/tp.2014.137 [DOI] [PMC free article] [PubMed] [Google Scholar]
- Keck PE, McElroy SL, Havens JR, Altshuler LL, Nolen WA, Frye MA, Suppes T, Denicoff KD, Kupka R, Leverich GS, Rush AJ, Post RM, 2003. Psychosis in bipolar disorder: Phenomenology and impact on morbidity and course of illness. Compr. Psychiatry 44, 263–269. 10.1016/S0010-440X(03)00089-0 [DOI] [PubMed] [Google Scholar]
- Keshavan MS, Morris DW, Sweeney JA, Thaker G, Seidman LJ, Eack SM, Tamminga C, 2011. A dimensional approach to the psychosis spectrum between bipolar disorder and schizophrenia: The Schizo-Bipolar Scale. Schizophr. Res. 133, 250–254. 10.1016/j.schres.2011.09.005 [DOI] [PMC free article] [PubMed] [Google Scholar]
- Lane RD, Nadel L. (Eds.), 2000. Cognitive neuroscience of emotion, 1st ed. Oxford University Press, New York, NY. [Google Scholar]
- Lang PJ, Bradley MM, Cuthbert BN, 1997. International Affective Picture System (IAPS): Technical manual and affective ratings. NIMH Cent. Study Emot. Atten. [Google Scholar]
- Levine MS, 1977. Canonical Analysis and Factor Comparison, 6th ed. Sage, Newbury Park, CA. [Google Scholar]
- Liu Y, Huang H, McGinnis-Deweese M, Keil A, Ding M, 2012. Neural substrate of the late positive potential in emotional processing. J. Neurosci. 32, 14563–14572. 10.1523/jneurosci.3109-12.2012 [DOI] [PMC free article] [PubMed] [Google Scholar]
- Löw A, Lang PJ, Smith JC, Bradley MM, 2008. Both predator and prey: Emotional arousal in threat and reward. Psychol. Sci. 19, 865–873. 10.1111/j.1467-9280.2008.02170.x [DOI] [PMC free article] [PubMed] [Google Scholar]
- Lundin NB, Bartolomeo LA, O’Donnell BF, Hetrick WP, 2018. Reduced electroencephalogram responses to standard and target auditory stimuli in bipolar disorder and the impact of psychotic features: Analysis of event-related potentials, spectral power, and inter-trial coherence. Bipolar Disord. 20, 49–59. 10.1111/bdi.12561 [DOI] [PMC free article] [PubMed] [Google Scholar]
- Mini A, Palomba D, Angrilli A, Bravi S, 1996. Emotional information processing and visual evoked brain potentials. Percept. Mot. Skills 83, 143–152. [DOI] [PubMed] [Google Scholar]
- Phillips ML, Travis MJ, Fagiolini A, Kupfer DJ, 2008. Medication effects in neuroimaging studies of bipolar disorder. Am. J. Psychiatry 165, 313–320. [DOI] [PMC free article] [PubMed] [Google Scholar]
- Radaelli D, Sferrazza Papa G, Vai B, Poletti S, Smeraldi E, Colombo C, Benedetti F, 2015. Fronto-limbic disconnection in bipolar disorder. Eur. Psychiatry 30, 82–88. 10.1016/j.eurpsy.2014.04.001 [DOI] [PubMed] [Google Scholar]
- Rheenen T.E. Van, Rossell SL, 2013. Genetic and neurocognitive foundations of emotion abnormalities in bipolar disorder. Cogn. Neuropsychiatry 18, 168–207. 10.1080/13546805.2012.690938 [DOI] [PubMed] [Google Scholar]
- Rodrigue AL, McDowell JE, Tandon N, Keshavan MS, Tamminga CA, Pearlson GD, Sweeney JA, Gibbons RD, Clementz BA, 2018. Multivariate relationships between cognition and brain anatomy across the psychosis spectrum. Biol. Psychiatry Cogn. Neurosci. Neuroimaging 3, 992–1002. 10.1016/j.bpsc.2018.03.012 [DOI] [PMC free article] [PubMed] [Google Scholar]
- Ruocco AC, Reilly JL, Rubin LH, Daros AR, Gershon ES, Tamminga CA, Pearlson GD, Hill SK, Keshavan MS, Gur RC, Sweeney JA, 2014. Emotion recognition deficits in schizophrenia-spectrum disorders and psychotic bipolar disorder: Findings from the Bipolar-Schizophrenia Network on Intermediate Phenotypes (B-SNIP) study. Schizophr. Res. 158, 105–112. 10.1016/j.schres.2014.07.001 [DOI] [PMC free article] [PubMed] [Google Scholar]
- Ryu V, An SK, Jo HH, Cho HS, 2010. Decreased P3 amplitudes elicited by negative facial emotion in manic patients: Selective deficits in emotional processing. Neurosci. Lett. 481, 92–96. 10.1016/j.neulet.2010.06.059 [DOI] [PubMed] [Google Scholar]
- Sabatinelli D, Fortune EE, Li Q, Siddiqui A, Krafft C, Oliver WT, Beck S, Jeffries J, 2011. Emotional perception: Meta-analyses of face and natural scene processing. Neuroimage 54, 2524–2533. 10.1016/j.neuroimage.2010.10.011 [DOI] [PubMed] [Google Scholar]
- Sabatinelli D, Keil A, Frank DW, Lang PJ, 2013. Emotional perception: Correspondence of early and late event-related potentials with cortical and subcortical functional MRI. Biol. Psychol. 92, 513–519. 10.1016/j.biopsycho.2012.04.005 [DOI] [PMC free article] [PubMed] [Google Scholar]
- Schupp HT, Cacioppo JT, Ito T, Lang PJ, Bradley MM, Cuthbert BN, 2000. Affective picture processing: The late positive potential is modulated by motivational relevance. Psychophysiology 37, 257–261. 10.1111/1469-8986.3720257 [DOI] [PubMed] [Google Scholar]
- Schupp HT, Flaisch T, Stockburger J, Junghofer M, 2006. Emotion and attention: event-related brain potential studies. Prog. Brain Res. 156, 31–51. 10.1016/S0079-6123(06)56002-9 [DOI] [PubMed] [Google Scholar]
- Schupp HT, Junghöfer M, Weike AI, Hamm AO, 2004. The selective processing of briefly presented affective pictures: An ERP analysis. Psychophysiology 41, 441–449. 10.1111/j.1469-8986.2004.00174.x [DOI] [PubMed] [Google Scholar]
- Sokhadze EM, Tasman A, Tamas R, El-Mallakh RS, 2011. Event-related potential study of the effects of emotional facial expressions on task performance in euthymic bipolar patients. Appl. Psychophysiol. Biofeedback 36, 1–13. 10.1007/s10484-010-9140-z [DOI] [PubMed] [Google Scholar]
- Strakowski SM, Adler CM, Almeida J, Altshuler LL, Blumberg HP, Chang KD, Delbello MP, Frangou S, McIntosh A, Phillips ML, Sussman JE, Townsend JD, 2012. The functional neuroanatomy of bipolar disorder: A consensus model. Bipolar Disord. 14, 313–325. 10.1111/j.1399-5618.2012.01022.x [DOI] [PMC free article] [PubMed] [Google Scholar]
- Tamminga CA, Ivleva EI, Keshavan MS, Pearlson GD, Clementz BA, Witte B, Morris DW, Bishop J, Thaker GK, Sweeney JA, 2013. Clinical Phenotypes of psychosis in the Bipolar-Schizophrenia Network on Intermediate Phenotypes (B-SNIP). Am. J. Psychiatry 170, 1263–1274. 10.1176/appi.ajp.2013.12101339 [DOI] [PubMed] [Google Scholar]
- Thaler NS, Allen DN, Sutton GP, Vertinski M, Ringdahl EN, 2013a. Differential impairment of social cognition factors in bipolar disorder with and without psychotic features and schizophrenia. J. Psychiatr. Res. 47, 2004–2010. 10.1016/j.jpsychires.2013.09.010 [DOI] [PubMed] [Google Scholar]
- Thaler NS, Strauss GP, Sutton GP, Vertinski M, Ringdahl EN, Snyder JS, Allen DN, 2013b. Emotion perception abnormalities across sensory modalities in bipolar disorder with psychotic features and schizophrenia. Schizophr. Res. 147, 287–292. 10.1016/j.schres.2013.04.001 [DOI] [PubMed] [Google Scholar]
- Thom N, Knight J, Dishman R, Sabatinelli D, Johnson DC, Clementz B, 2014. Emotional scenes elicit more pronounced self-reported emotional experience and greater EPN and LPP modulation when compared to emotional faces. Cogn. Affect. Behav. Neurosci. 14, 849–860. 10.3758/s13415-013-0225-z [DOI] [PubMed] [Google Scholar]
- Townsend J, Altshuler LL, 2012. Emotion processing and regulation in bipolar disorder: a review. Bipolar Disord. 14, 326–339. 10.1111/j.1399-5618.2012.01021.x [DOI] [PubMed] [Google Scholar]
Associated Data
This section collects any data citations, data availability statements, or supplementary materials included in this article.