

Abstract
Syncytialization, the fusion of cytotrophoblasts into an epithelial barrier that constitutes the maternal–fetal interface, is a crucial event of placentation. This process is characterized by distinct changes to amino acid and energy metabolism. A metabolite of the industrial solvent trichloroethylene (TCE), S-(1,2-dichlorovinyl)-l-cysteine (DCVC), modifies energy metabolism and amino acid abundance in HTR-8/SVneo extravillous trophoblasts. In the current study, we investigated DCVC-induced changes to energy metabolism and amino acids during forskolin-stimulated syncytialization in BeWo cells, a human villous trophoblastic cell line that models syncytialization in vitro. BeWo cells were exposed to forskolin at 100 μM for 48 h to stimulate syncytialization. During syncytialization, BeWo cells were also treated with DCVC at 0 (control), 10, or 20 μM. Following treatment, the targeted metabolomics platform, “Tricarboxylic Acid Plus”, was used to identify changes in energy metabolism and amino acids. DCVC treatment during syncytialization decreased oleic acid, aspartate, proline, uridine diphosphate (UDP), UDP-d-glucose, uridine monophosphate, and cytidine monophosphate relative to forskolin-only treatment controls, but did not increase any measured metabolite. Notable changes stimulated by syncytialization in the absence of DCVC included increased adenosine monophosphate and guanosine monophosphate, as well as decreased aspartate and glutamate. Pathway analysis revealed multiple pathways in amino acid and sugar metabolisms that were altered with forskolin-stimulated syncytialization alone and DCVC treatment during syncytialization. Analysis of ratios of metabolites within the pathways revealed that DCVC exposure during syncytialization changed metabolite ratios in the same or different direction compared to syncytialization alone. Building off our oleic acid findings, we found that extracellular matrix metalloproteinase-2, which is downstream in oleic acid signaling, underwent the same changes as oleic acid. Together, the metabolic changes stimulated by DCVC treatment during syncytialization suggest changes in energy metabolism and amino acid abundance as potential mechanisms by which DCVC could impact syncytialization and pregnancy.
Graphical Abstract

INTRODUCTION
In the placenta, the differentiation of cytotrophoblasts into syncytiotrophoblasts is a process known as syncytialization and is crucial for a healthy pregnancy.1–3 Multinucleation and cell fusion occur as cytotrophoblasts differentiate into syncytiotrophoblasts,1 which become the outermost layer of the villous tree of the fetal side of the placenta and hence the maternal–fetal interface.1,4,5 These syncytiotrophoblasts are the cells responsible for the transport of nutrients, gas, and waste between mother and fetus.1,2 As such, abnormalities of syncytialization or syncytiotrophoblast function could impair fetal growth and development.
The BeWo human placental trophoblast cell line is a popular in vitro model for studying syncytialization.6 BeWo cells are villous trophoblasts that can be stimulated by forskolin to syncytialize,3,7 producing a cell phenotype that is similar to syncytialization as it occurs in vivo.3 An appropriate treatment used to syncytialize the cytotrophoblastic BeWo cells is exposure to 100 μM forskolin for 48 h.3,8–10
Trichloroethylene (TCE) is a chemical used as a metal degreaser and in the synthesis of various chemicals.11 Because of past improper disposal, TCE is an environmental pollutant commonly found in Superfund sites.11 Exposure to TCE is associated with adverse pregnancy outcomes, including low birth weight and small for gestational age.12–14 We have recently shown that exposure to S-(1,2-dichlorovinyl)-l-cystine (DCVC), a metabolite of TCE through its glutathione conjugation pathway,15 stimulates apoptosis in BeWo cells, regardless if BeWo cells were unsyncytialized, undergoing forskolin-stimulated syncytialization, or syncytialized.9 In addition, in HTR-8/SVneo extravillous placental cells,16 DCVC stimulates apoptosis, reactive oxygen species (ROS) generation, pro-inflammatory response, mitochondrial dysfunction, and modifications in intracellular quantities of energy metabolites and amino acids.17–20 Furthermore, TCE modifies oxidative stress markers and amniotic fluid levels of energy metabolites, cofactors, and amino acids in timed-pregnant Wistar rats, in which TCE exposure decreases fetal weight.21–23 Importantly, TCE metabolites from its cytochrome P450-dependent oxidation pathways, trichloroacetic acid and dichloroacetic acid,15 are nontoxic to HTR-8/SVneo or BeWo cells.24 Because prior studies show that DCVC targets mitochondrial processes in the liver and kidney,25–31 it is plausible that many of the TCE and DCVC-induced changes in the placenta and amniotic fluid originate from local mitochondria by which ROS is produced.
In addition to the role of apoptosis, ROS, and energy metabolism in TCE/DCVC reproductive toxicity,9,17–23 proper regulation of apoptosis, ROS, and energy metabolism is critical to the physiology of syncytialization, as well. First, an increase in antiapoptotic BCL2 is observed during syncytialization of BeWo cells9,32 and primary human cytotrophoblasts.32 This phenomenon is thought to protect against excessive cell death during syncytialization32,33 and is attenuated by DCVC exposure.9 In contrast, pro-apoptotic caspase-3 activation contributes to apoptosis in villous cytotrophoblasts and is associated with intrauterine growth restriction.34,35 A comprehensive overview of the positive association of apoptosis of villous cytotrophoblasts, syncytiotrophoblasts, and other trophoblasts with adverse pregnancy outcomes, such as preeclampsia and intrauterine growth restriction, has been reviewed by Sharp et al.36 Second, BeWo cell syncytialization alters expression of antioxidant enzymes, including peroxiredoxin 2,37 which is necessary for BeWo cell syncytialization.38 Syncytin-1, a biomarker of syncytialization,39 is regulated by redox-sensitive proteins such as p38 and protein kinase A.40 Third, syncytialization itself alters amino acid phosphorylation and collagen metabolic process in BeWo cells.32 Taken together, similarities exist between the regulation of DCVC toxicity and syncytialization.
Although similarities between the regulation of DCVC toxicity and syncytialization exist, the premise that DCVC impacts syncytialization has not been previously investigated aside from apoptotic mechanisms.9 In the present study, we investigated modifications to intracellular energy metabolism and amino acids stimulated by exposure to DCVC during syncytialization using targeted metabolomics via the Tricarboxylic Acid (TCA) Plus Platform that measures intermediates in the TCA cycle, other energy metabolites, and amino acids.41 Because energy metabolites, such as adenosine triphosphate (ATP), are critical for the sustainment of pregnancy,42,43 energy metabolism continues to be a critical topic of investigation in the context of pregnancy health and DCVC exposure. We hypothesized that DCVC exposure during syncytialization would decrease energy metabolite and amino acid supply that would oppose the increases in these metabolites during syncytialization. Furthermore, we hypothesized that the DCVC-stimulated metabolite changes would reflect DCVC disruption of proper redox and apoptotic protection during syncytialization.
MATERIALS AND METHODS
BeWo Cell Line.
The BeWo human placental villous cytotrophoblastic cell line6 was obtained through the American Type Culture Collection (ATCC CCL-98) and verified by a short tandem repeat profile with fragment analysis on the ABI 3730XL DNA Analyzer from Applied Biosystems (Waltham, MA) at the University of Michigan DNA Sequencing Core. The cells were maintained in F12-K Nutrient Mixture Kaighn’s Modification medium with (+) l-glutamine (Gibco, Grand Island, NY). For cell treatments, Dulbecco’s modified Eagle’s medium (DMEM)/F12 Nutrient Mixture medium (Gibco, Grand Island, NY) was used so that the exposure media were without phenol red. All media were supplemented with 10% (v/v) heat-inactivated fetal bovine serum (HI-FBS) and 1% (v/v) penicillin/streptomycin (P/S) (Gibco, Grand Island, NY). Three washes of phosphate-buffered saline (PBS) (Invitrogen Life Technologies, Carlsbad, CA) were performed prior to detaching the cells with 0.25% trypsin–ethylenediaminetetraacetic acid (EDTA) (Invitrogen Life Technologies, Carlsbad, CA) during subculture. All cells were kept in a 5% CO2, 37 °C controlled and humidified incubator. For regular subculture, cells were plated at 100,000 cells/mL in 25 mL in 175 cm2 flasks (Corning Inc., Corning, NY) and passaged at about 70–80% confluence. This work with human cell cultures was approved by the University of Michigan Institutional Biosafety Committee (IBCA00000100).
Exposures.
To prepare for the metabolomics experiments, cells were plated in 10-cm tissue culture dishes (Corning Inc., product 430167) at a density of 800,000 cells per dish in 8 mL volume. After 24 h, we applied 100 μM forskolin exposure for 48 h to promote BeWo cell syncytialization, consistent with prior reports3,8,10 and verified by us.9 Forskolin (Sigma-Aldrich, St. Louis, MO) was first dissolved at 100 mM in dimethyl sulfoxide (DMSO) (Tocris Bioscience, Bristol, U.K.) and then diluted 1:1000 in medium to create the 100 μM solution; hence, the vehicle control for any experiments using forskolin was 0.1% (v/v) DMSO. The TCE metabolite S-(1,2-dichlorovinyl)-l-cysteine (DCVC) was synthesized by the University of Michigan Medicinal Chemistry Core via published methods.44 The chemical identity of DCVC was verified through proton nuclear magnetic resonance (NMR) spectroscopy and determined to be 98.7% pure by high-performance liquid chromatography (HPLC). DCVC was added to cultures at 10 and 20 μM concentrations as co-treatments with forskolin during syncytialization. These DCVC concentrations were chosen based on prior findings of metabolic changes in a different placental cell line.20 Moreover, the DCVC concentration range is similar to the average concentration of S-(1,2-dichlorovinyl)glutathione (DCVG) (13.4 μM), a precursor of DCVC,15 found in the blood of women exposed to occupationally relevant doses of TCE.11,45 The cell treatments are summarized in Figure 1.
Figure 1.
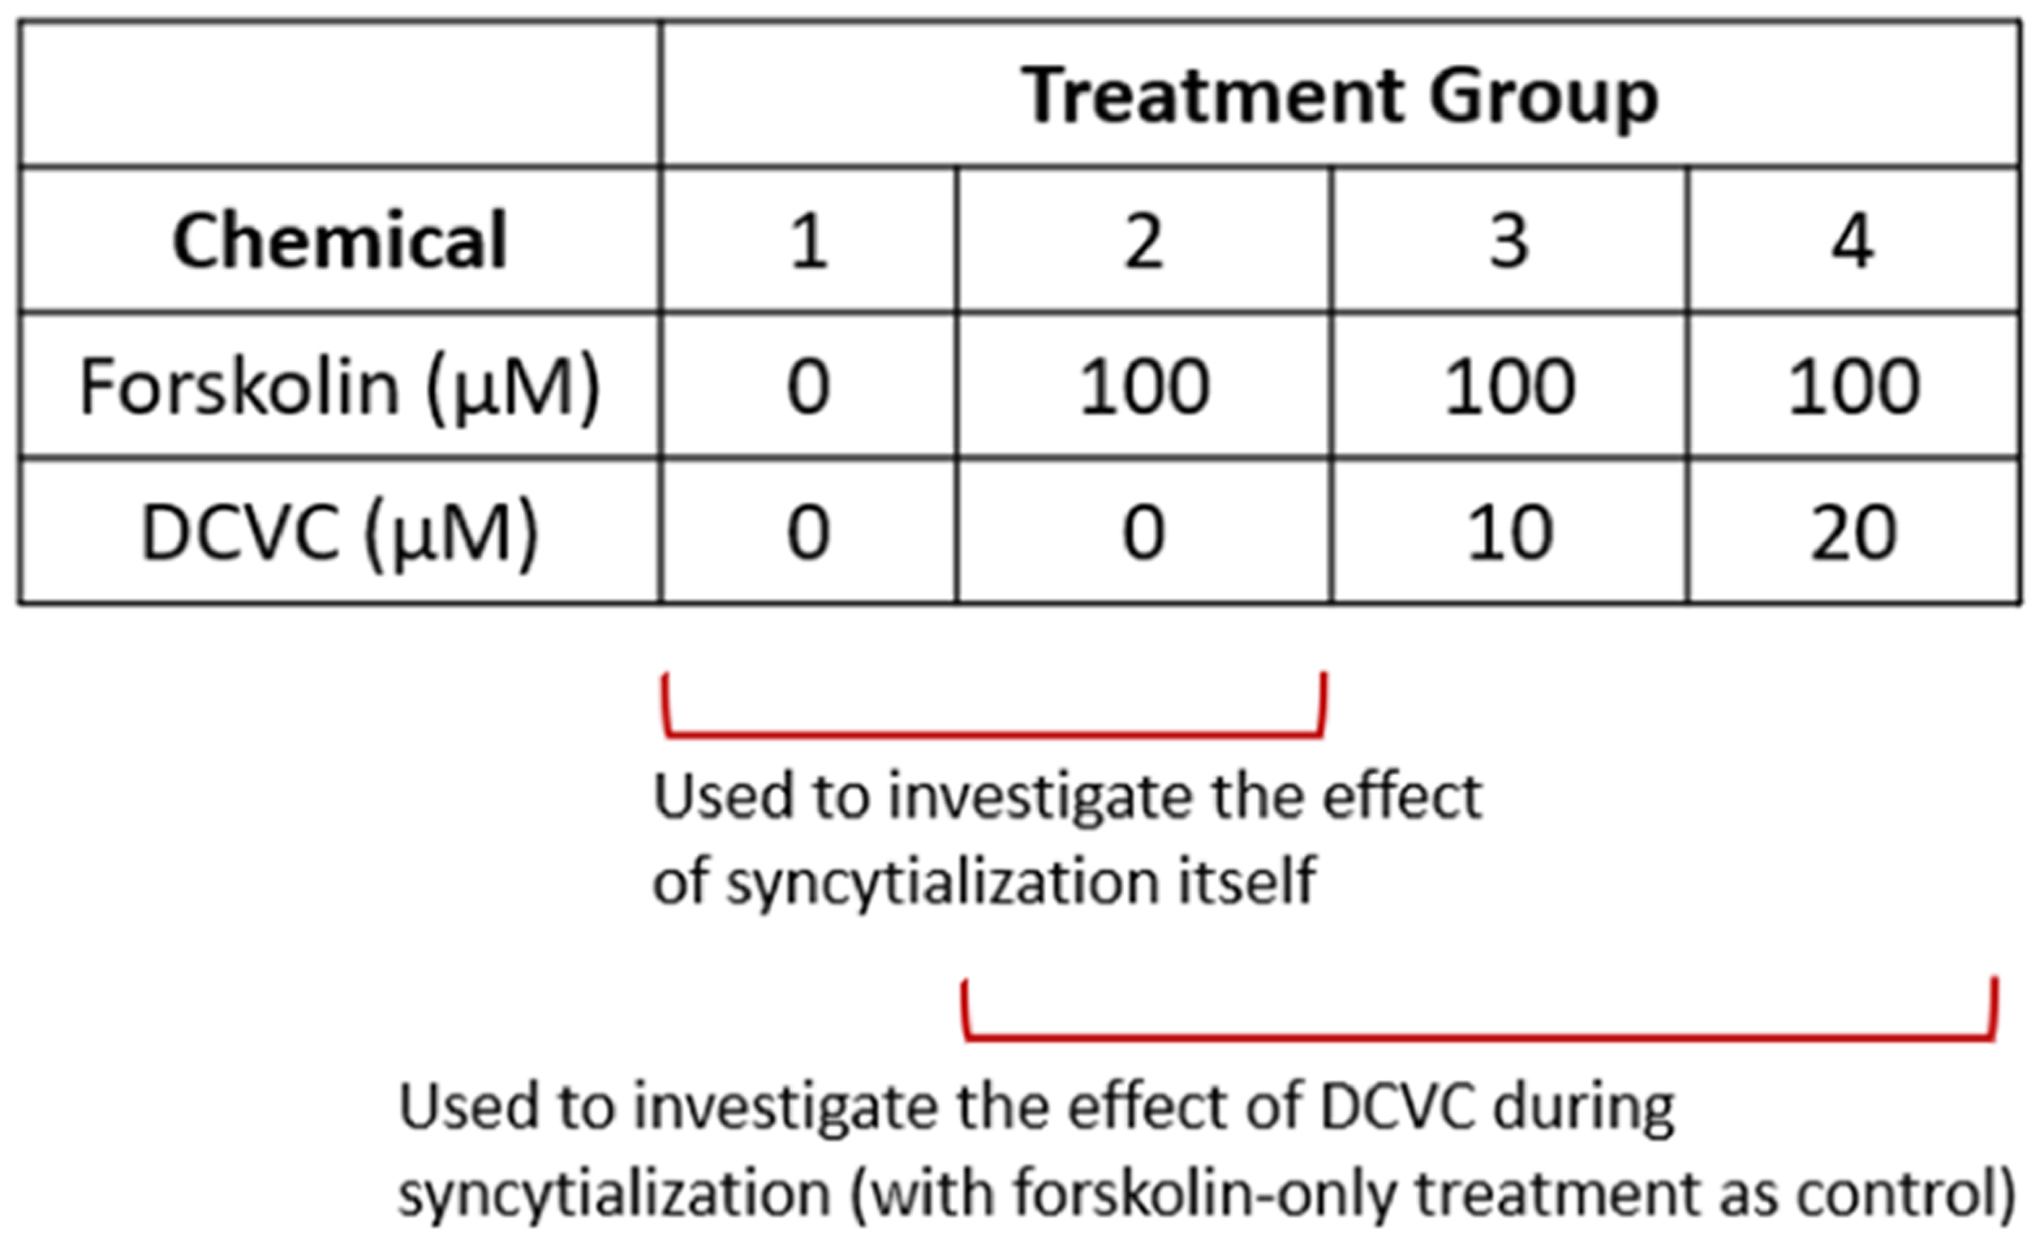
Summary and purposes of treatment groups used in the metabolomics study design. Comparison of the first two treatment groups, groups 1 and 2, test the effect of syncytialization on metabolomics outcomes. Comparison of groups 2, 3, and 4 investigate the effect of DCVC treatment on forskolin-stimulated syncytialization. Group 1 is the vehicle control group exposed to 0.1% (v/v) dimethyl sulfoxide (DMSO).
Sample Preparation for Metabolomics Analysis.
After the 48-h treatment, the medium was removed from the cells, and a gentle, quick wash with 150 mM ammonium acetate was performed. Following the ammonium acetate wash, liquid nitrogen was poured over the cells and allowed to evaporate from the dishes. Cell dishes were then stored at −80 °C until delivery to the University of Michigan Metabolomics Core on dry ice for analysis using the Tricarboxylic Acid (TCA) Plus Platform. Metabolites detected through the TCA Plus Platform included metabolites in energy utilization (e.g., metabolites in glycolysis, TCA cycle, pentose phosphate pathway) and amino acids.41 At the core, cell culture dishes were removed from −80 °C storage and maintained on wet ice throughout processing. To each 10-cm dish, a 1.5-mL mixture of methanol, chloroform, and water (8:1:1) containing isotope-labeled internal standards was added. Dishes were gently agitated to release cells and then scraped to collect the cells. The resulting cell mixtures were transferred to microtubes. Microtubes were mixed on a vortex mixer and allowed to incubate at 4 °C for 10 min to complete metabolite extraction. Samples were mixed a second time and then centrifuged at 14,000 rpm for 10 min at 4 °C. From each sample, an aliquot of 100 μL of the extraction solvent was transferred to an autosampler vial for liquid chromatography-mass spectrometry (LC-MS) analysis. A volume of 10 μL of each sample was removed and pooled in a separate autosampler vial for a separate run for quality control purposes.
Liquid Chromatography-Mass Spectrometry (LC-MS) Analysis.
Analysis of metabolites in the glycolysis, tricarboxylic acid, and pentose phosphate pathways and additional analytes were performed on an Agilent system consisting of a 1290 UPLC coupled with a 6520 Quadrupole-Time-of-flight (QTOF) mass spectrometer (Agilent Technologies, Santa Clara, CA). Metabolites were separated on a 150 × 1 mm Luna NH2 Hilic column (Phenomenex, Torrance, CA) using 10 mM ammonium acetate in water, adjusted to pH 9.9 with ammonium hydroxide, as mobile phase A. Acetonitrile was used as mobile phase B. The flow rate was 0.075 mL/min, and the gradient was linear from 20 to 100% mobile phase A over 15 min, followed by isocratic elution at 100% mobile phase A for 5 min. The system was returned to starting conditions (20% mobile phase A) and held there for 10 min to allow for column re-equilibration before injecting another sample. The mass spectrometer was operated in electrospray ionization (ESI) negative mode according to previously published conditions.41
Data Processing.
Data were processed using MassHunter Quantitative analysis version B.07.00. Metabolites in the glycolysis, tricarboxylic acid, and pentose phosphate pathways were normalized to the nearest isotope-labeled internal standard and quantitated using two replicated injections of five standards to create a linear calibration curve with high accuracy for each standard. The locally estimated scatterplot smoothing (LOESS) method46,47 was used as a signal and drift correction method using Metabodrift.46 Because of the presence of internal standards, quantities arising from this method are reported in absolute concentrations. These absolute concentrations were normalized to protein mass to arrive at a reporting unit of pmol metabolite per μg protein and used in data analyses. Other compounds in the analysis were normalized to the nearest internal standard, and the peak areas were used for differential analysis between groups. The LOESS method using Metabodrift46,47 was also utilized as a signal and drift correction method for these data. Data from this method of processing were reported in the unit of relative responses (RR) and were used in data analyses.
Some metabolites were detected more than once. Guanosine monophosphate (GMP) and phosphoenolpyruvate (PEP) were detected as both absolute concentrations and relative responses: in both cases, the values from the absolute concentrations were used because of the decreased total variance (for each metabolite, defined as the aggregate of the variance from each experimental group). Also, 3-phosphoserine was detected twice using the method with the relative response with similar values within each treatment group: the second set of values, which had lower variance within each treatment group, was used in the current study.
Pathway Analysis.
Pathway analysis was performed using Metaboanalyst 4.048,49 and selecting Homo sapiens (Kyoto Encyclopedia of Genes and Genomes (KEGG)) within the pathway library. Metaboanalyst 4.0 uses data on detected metabolites in two ways. The first way scores the cumulative importance of detected metabolites to a particular pathway to ultimately derive a pathway impact score ranging from 0 to 1 (x-axis of graphs). The second way uses the p-values derived from individual metabolites of a particular pathway to determine a p-value on the pathway (y-axis of graphs).48,49 Because pathway analysis could only be performed for comparison of two groups, four sets of comparisons were made: (1) vehicle control (0.1% DMSO) versus forskolin (control), (2) forskolin versus forskolin + 10 μM DCVC, (3) forskolin versus forskolin + 20 μM DCVC, and (4) forskolin + 10 μM DCVC versus forskolin + 20 μM DCVC. Because of the non-Gaussian distribution of the processed data, data were generalized log-transformed prior to analysis. Other choices made within the program include pathway enrichment analysis (global test as opposed to global ANCOVA); and pathway topology analysis (relative betweenness centrality as opposed to outdegree centrality).
Statistical Analysis of Metabolomics Results.
The sample size from all experiments in the current study is five independent biological replicates across all experimental groups. Differential analysis was conducted using unpaired two-tailed t-tests in the case of the forskolin treatment to vehicle (0.1% v/v DMSO) comparison to investigate the impact of syncytialization. To test for DCVC effects, the forskolin alone (control), forskolin + 10 μM DCVC, and forskolin + 20 μM DCVC treatment groups were analyzed using one-way analysis of variance (ANOVA) followed by Tukey’s post-hoc multiple comparisons of means. The data from the same forskolin group was used in all analyses. We also performed statistical analyses using multiple unpaired two-tailed t-tests to obtain p-values adjusted for multiple comparisons using the Holm–Sidak method with α set to 0.05 for both forskolin-stimulated syncytialization and DCVC impact on syncytialization. Results from the first set of analyses (not involving Holm–Sidak adjustment) were most consistent in p-value magnitude with the results obtained via Metaboanalyst 4.0 pathway analyses and were used to create the main figures. All processed metabolomics data were generalized log-transformed prior to any statistical analysis because of non-Gaussian distribution, with the exception of ratio data (fold-change data and data of ratios between two metabolites), which used the processed but not generalized log-transformed data in order to obtain accurate ratios. Statistical analysis on metabolite ratio data was performed using unpaired two-tailed t-tests or one-way ANOVA followed by Tukey’s post-hoc multiple comparisons of means. With the exception of the pathway analyses from Metaboanalyst 4.0, which automatically computed p-values, statistical analyses were performed using GraphPad Prism 7 (GraphPad Software Inc.; San Diego, CA). p-Values computed by Metaboanalyst 4.0 pathway analyses were unadjusted for multiple comparisons.49
Detection of Matrix Metalloproteinases (MMP)-1, MMP-2, MMP-3, and MMP-9 in Media.
BeWo cells were plated at a 200,000 cells/well density in 2 mL/well of six-well tissue culture plates (Corning, Corning, NY) and allowed to adhere for 24 h before treatment. To gain a more comprehensive concentration–response of DCVC, DCVC concentrations spanning 10–50 μM were included. Upon completion of 48-h treatment, the medium was collected and stored at −80 °C until further processing. Protein was collected in a lysis buffer featuring 0.5% (v/v) IGEPAL CA-630 (Sigma-Aldrich, St. Louis, MO), 250 mM NaCl (Sigma-Aldrich, St. Louis, MO), and 5% (v/v) of Tris–HCl (1 M, pH 7.4). Protein concentration was measured using the Pierce bicinchoninic acid (BCA) protein assay kit (Thermo Fischer Scientific, Waltham, MA) according to the manufacturer’s protocol to allow for analyte concentration normalization to the mass of protein. Directly prior to delivery, the media samples were thawed and pipetted into round-bottom 96-well plates and then submitted to the University of Michigan Immunologic Monitoring Core. The Immunologic Monitoring Core performed enzyme-linked immunosorbent assays to detect the analytes of interest using Duoset (R&D Systems, Minneapolis, MN) according to the manufacturer’s recommended protocol. Statistical analysis inclusive of all experimental groups was performed using one-way ANOVA followed by Tukey’s post-hoc multiple comparisons of means.
RESULTS
Quantity of Metabolites Measured.
A total of 54 metabolites were measured from the BeWo cells using the TCA Plus metabolomics platform, and concentrations or relative responses are listed in Table S1. Each of the following sets of metabolites was detected as an aggregate (i.e., within the set, it was not possible to distinguish one metabolite from another): (1) citrate and isocitrate, (2) fructose 6-phosphate and glucose 6-phosphate, (3) ribose 5-phosphate and xylulose 5-phosphate, (4) leucine and isoleucine, and (5) hexose (glucose, etc.). Each of these sets was considered as one metabolite in the counting of the total. Additionally, these aforementioned sets were excluded from pathway analyses because those analyses could not assign an aggregate of metabolites to a specific compound. Three metabolites were counted more than once, as discussed in the methods subsection “Data Processing” along with what set of values was used; these metabolites were not double-counted in the total number (54) of detected metabolites.
Metabolites Altered by Forskolin-Stimulated Syncytialization.
The effect of forskolin-stimulated syncytialization on metabolites was assessed by comparing forskolin-only treatment to vehicle control (Figure 2A). Forskolin treatment significantly altered the abundance of 9 of the 54 detected metabolites (Figure 3 and Table S2). Five out of the nine metabolites were decreased, and four out of the nine metabolites were increased. Interestingly, two of the increased metabolites were nucleotide monophosphates: adenosine monophosphate (AMP) and guanosine monophosphate (GMP). Analysis of fold-change versus p-value in response to forskolin treatment revealed that 32 metabolites had a fold-change of less than 1 but that 8 metabolites had a fold-change greater than 2. When conducting analysis of multiple t-tests to obtain p-values adjusted for multiple comparisons using the Holm–Sidak method, no p-values were statistically significant (Table S3). These effects of forskolin-stimulated syncytialization serve as a reference for DCVC treatment effect analysis.
Figure 2.

Volcano plots displaying the negative [log10(p-value)] as a function of the log2(fold-change) for each individual metabolite displayed as dots for four different comparisons. Graphs show four different comparisons, corresponding to the effect of: (A) syncytialization, comparing forskolin-only treatment to vehicle control; (B) 10 μM DCVC during syncytialization, comparing 10 μM DCVC treatment during syncytialization to forskolin-only treatment; (C) 20 μM DCVC during syncytialization, comparing 20 μM DCVC treatment during syncytialization to forskolin-only treatment, and (D) DCVC concentration–response, comparing 20 μM DCVC during syncytialization versus 10 μM DCVC during syncytialization. Individual points correspond to individual metabolites detected. The horizontal dashed gold lines correspond to the threshold of p = 0.05. Axes ranges differ among the graphs to clearly show metabolites. Results from this figure are based on the analyses in Table S2. Abbreviations: AMP, adenosine monophosphate; Asp, aspartate; ATP, adenosine triphosphate; CMP, cytidine monophosphate; Glu, glutamate; GMP, guanosine monophosphate; GSSG, glutathione disulfide; Pro, proline; Suc, succinate; UDP, uracil diphosphate; and UMP, uracil monophosphate.
Figure 3.
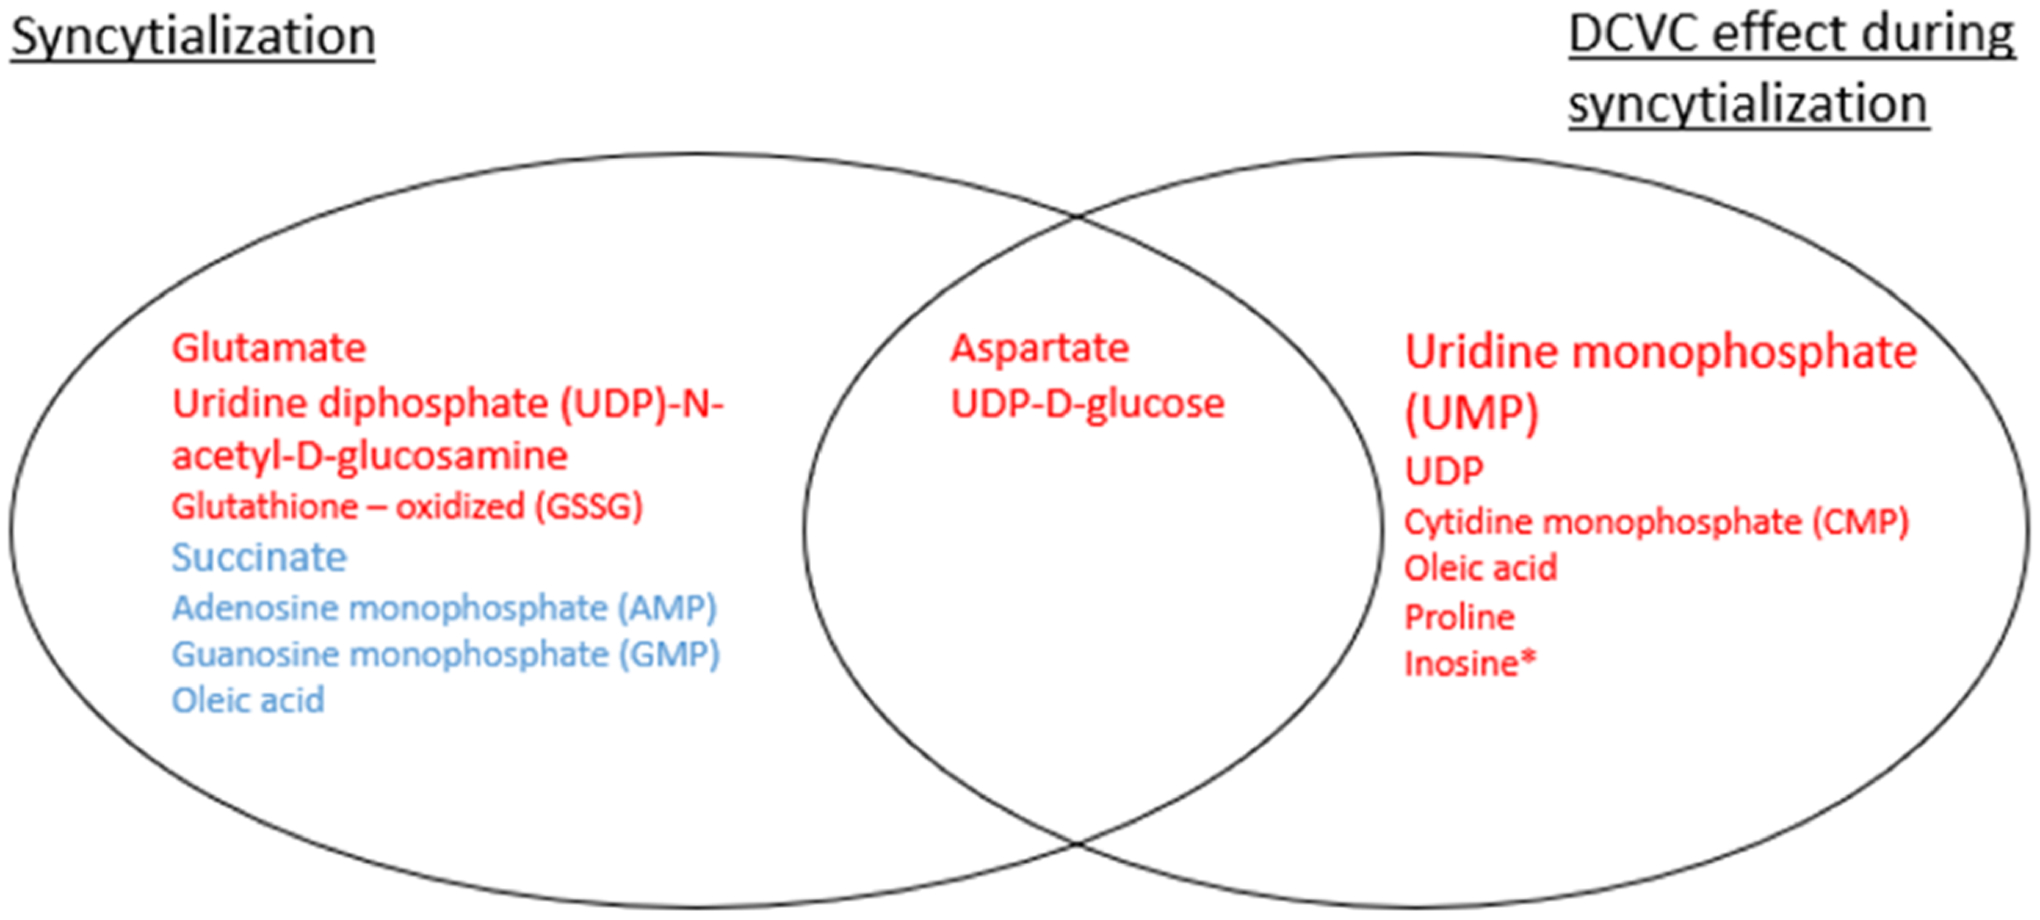
Summary of specific metabolites altered by syncytialization or DCVC treatment during syncytialization. Metabolites highlighted in blue or red indicate metabolites increased or decreased, respectively, in response to forskolin-stimulated syncytialization and/or DCVC treatment during syncytialization. The metabolites in the smallest, moderate, and largest text sizes were significantly different at p < 0.05, p < 0.01, and p < 0.001, respectively. In the case of the DCVC effect during syncytialization, a metabolite was listed if it changed with at least 20 μM DCVC treatment, with the exception of inosine (marked with an asterisk), which was decreased in the 20 μM DCVC group compared to the 10 μM DCVC group. Results from this figure are based on the analyses in Table S2.
Metabolites Altered by DCVC Treatment during Forskolin-Stimulated Syncytialization.
To investigate if DCVC exposure altered metabolites during forskolin-stimulated syncytialization, treatment with 10 or 20 μM DCVC was compared with forskolin-only treatment controls. Exposure to 10 μM DCVC during forskolin-stimulated syncytialization decreased two metabolites, proline and UDP, and 37 of 54 metabolites had a fold-change of less than 1 (Figure 2B and Table S2). Exposure to 20 μM DCVC during forskolin-stimulated syncytialization decreased seven metabolites, including proline and UDP, with 37 of the 54 metabolites exhibiting a fold-change of less than 1 (Figure 2C and Table S2). Comparison of the 20 μM DCVC group to the 10 μM DCVC group revealed concentration-dependent decreases of UMP and inosine for DCVC exposure during forskolin-stimulated syncytialization. In the latter comparison, 20 of 54 metabolites had a fold-change of less than 1 (Figure 2D and Table S2). Interestingly, inosine was changed in the 20 μM DCVC versus 10 μM DCVC comparison but was not part of the seven metabolites changed in the 20 μM DCVC to forskolin-only treatment comparison (Table S2). When conducting analysis of multiple t-tests to obtain p-values adjusted for multiple comparisons using the Holm–Sidak method, statistical significance was detected for proline, CMP, and UMP, which were changed by 20 μM DCVC relative to forskolin-only treatment control (p = 0.0050, 0.0464, and 0.0017, respectively) (Table S3).
Association of Metabolites Changed by Syncytialization versus Metabolites Changed by DCVC Treatment during Syncytialization.
Among the metabolites significantly altered by syncytialization (comparing forskolin-only and vehicle control groups), three metabolites (oleic acid, aspartate, and uridine diphosphate d-glucose) were also significantly altered by DCVC treatment during syncytialization (Figure 3). Oleic acid decreased by 40.5% with 20 μM DCVC (p = 0.0344), whereas a 69.2% increase was seen with syncytialization (forskolin-only treatment) (p = 0.0152) (Table S2). Aspartate and uridine diphosphate d-glucose were decreased by 20 μM DCVC by 40.2 and 44.2%, respectively (p = 0.0310 and 0.0255, respectively), as well as by syncytialization itself (forskolin-only treatment) (decrease of 38.5 and 57.3%, respectively; p = 0.0068 and 0.0060, respectively) (Table S2). We next visualized associations between metabolite fold changes across different comparisons to assess changes associated with syncytialization versus changes associated with DCVC treatment during syncytialization. Correlation analysis detected a significant association between metabolite fold changes following 10 μM DCVC treatment during syncytialization versus 20 μM DCVC treatment during syncytialization (Spearman correlation p < 0.0001) (Figure 4A), indicating that changes stimulated by 10 μM DCVC treatment during syncytialization are similar to changes stimulated by 20 μM DCVC treatment during syncytialization. Neither comparison of 10 or 20 μM DCVC treatment to syncytialization by itself was statistically significant (p = 0.1182 and 0.9893 for Spearman correlation, respectively) (Figure 4B,C), suggesting that metabolites that were changed by DCVC during syncytialization did not move in the same direction or were dissimilar to those changed by syncytialization itself.
Figure 4.
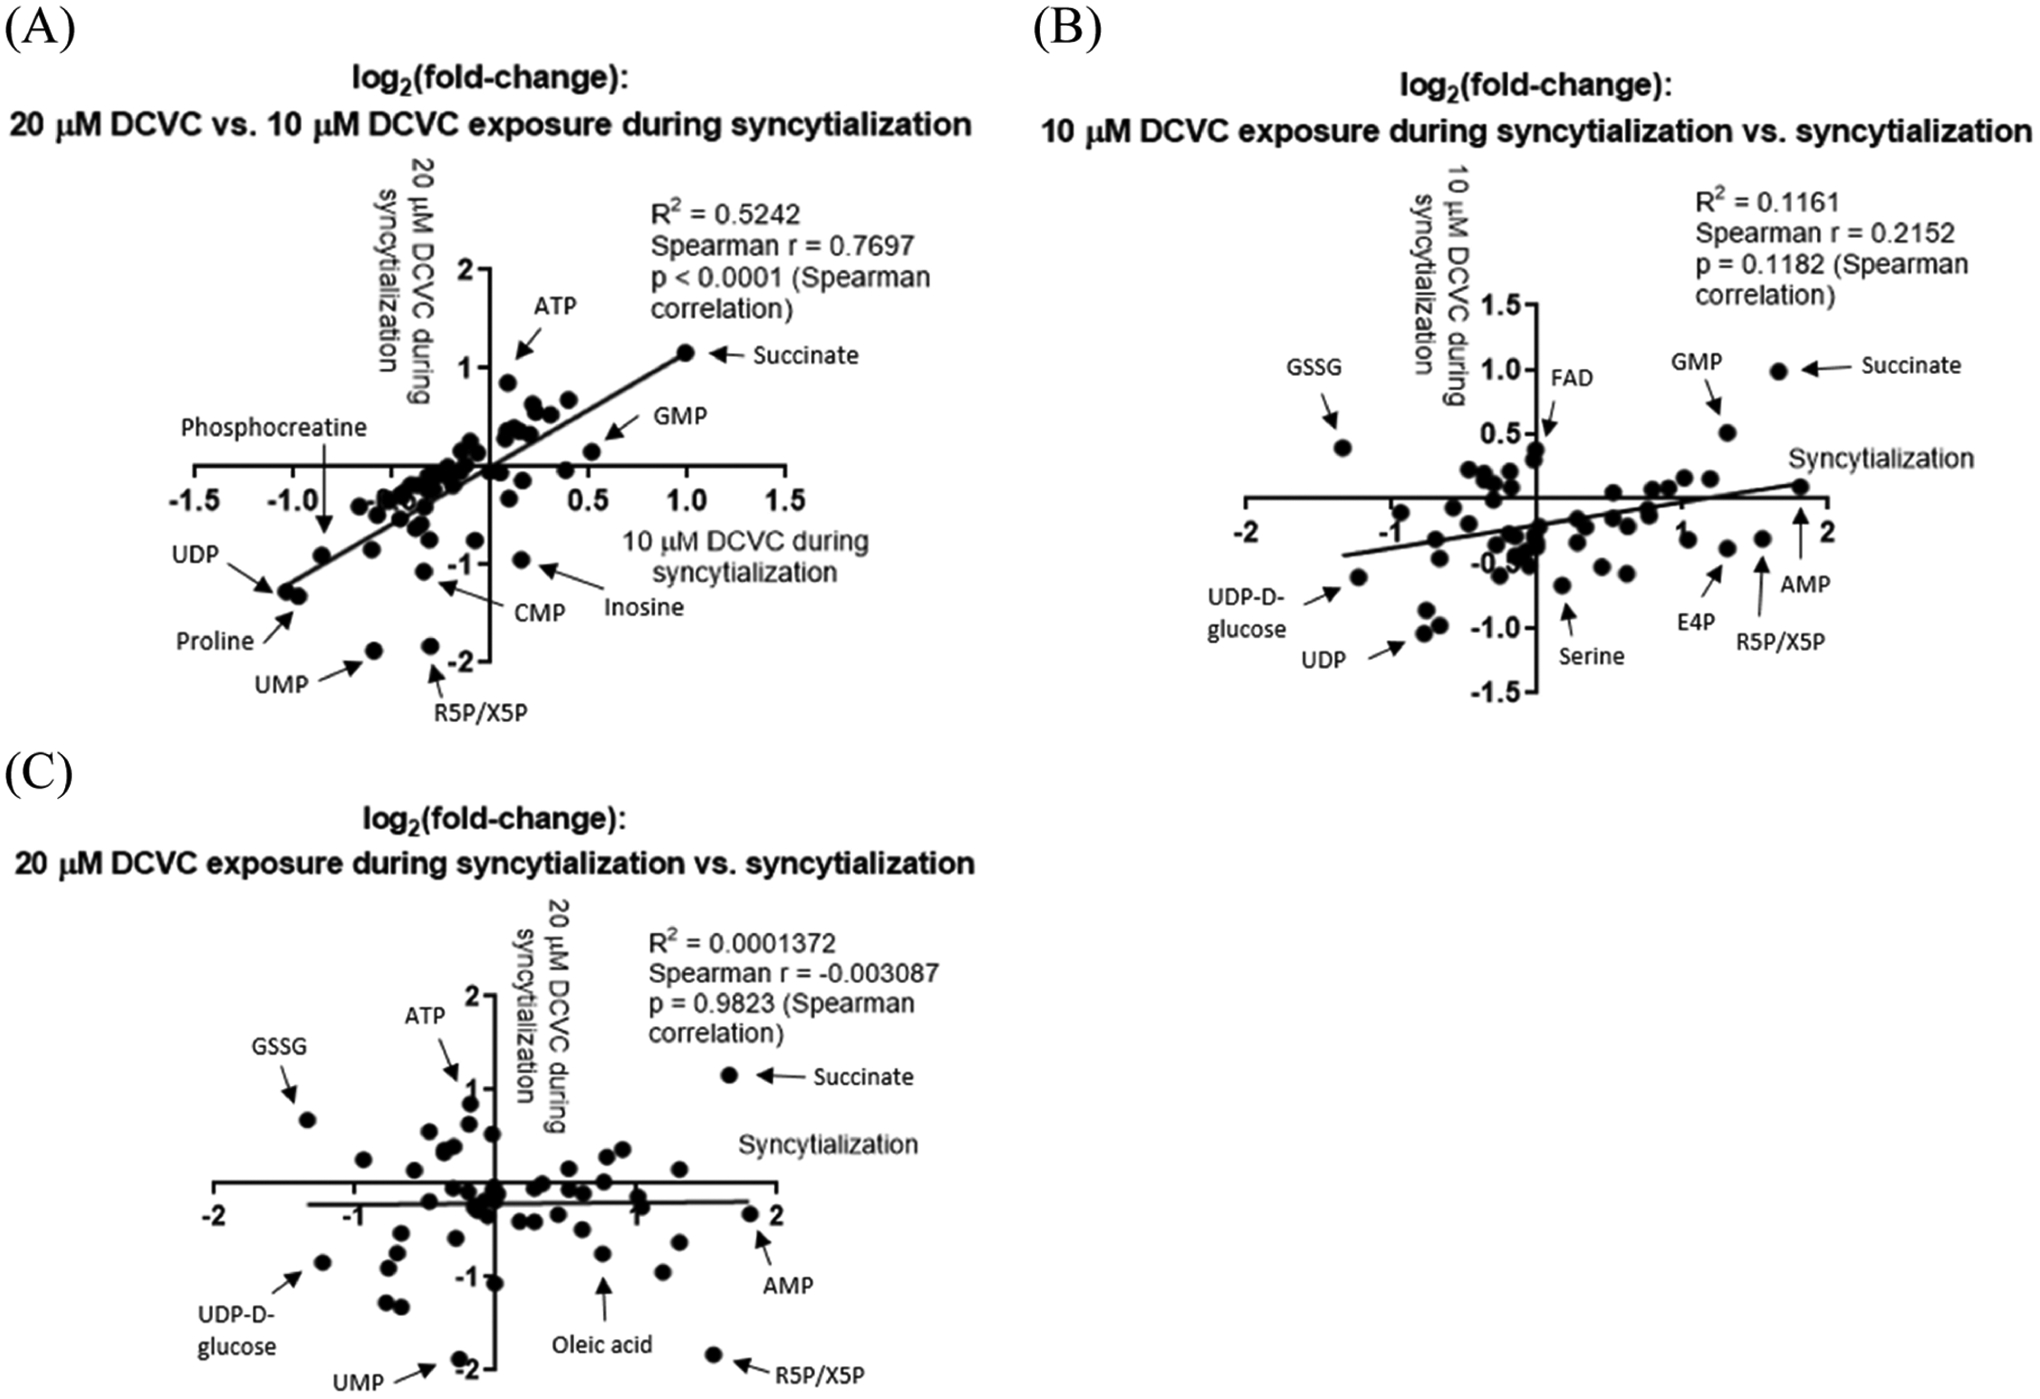
Scatterplots showing associations between metabolite fold changes across different comparisons to visualize changes associated with syncytialization versus changes associated with DCVC treatment during syncytialization. Comparisons displayed correspond to (A) the 20 μM DCVC treatment during syncytialization versus 10 μM DCVC treatment during syncytialization comparison, (B) the 10 μM DCVC treatment during syncytialization versus syncytialization alone comparison, and (C) the 20 μM DCVC treatment during syncytialization versus syncytialization alone comparison. X and Y axes are in units of log2(fold-change), and individual data points represent individual metabolites detected in the cells. Results from this figure are based on the analyses in Table S2. Abbreviations: AMP, adenosine monophosphate; ATP, adenosine triphosphate; CMP, cytidine monophosphate; E4P, erythrose 4-phosphate; FAD, flavin adenine dinucleotide; GMP, guanosine monophosphate; GSSG, glutathione disulfide; R5P/X5P, ribose 5-phosphate/xylulose 5-phosphate; UDP, uracil diphosphate; and UMP, uracil monophosphate.
KEGG Pathway Analysis.
Metaboanalyst 4.0 identified 47 analyzable pathways from our input data. Of these, 13 pathways were statistically altered in response to forskolin treatment to induce syncytialization (p < 0.05) (Figure 5A). Four of these 13 pathways had a pathway impact score above 0.1, indicating that the measured metabolites had importance to those pathways. Impacted pathways included histidine metabolism (p = 0.0038; pathway impact = 0.2213), ascorbate and aldarate metabolism (p = 0.0120; pathway impact = 0.5), pentose and glucuronate interconversions (p = 0.0120; pathway impact = 0.2031), and amino sugar and nucleotide sugar metabolism (p = 0.0120; pathway impact = 0.1031). Six of the 13 statistically altered pathways had a pathway impact score of 0, which indicates that metabolites detected in the pathway were unimportant to the pathway itself.
Figure 5.
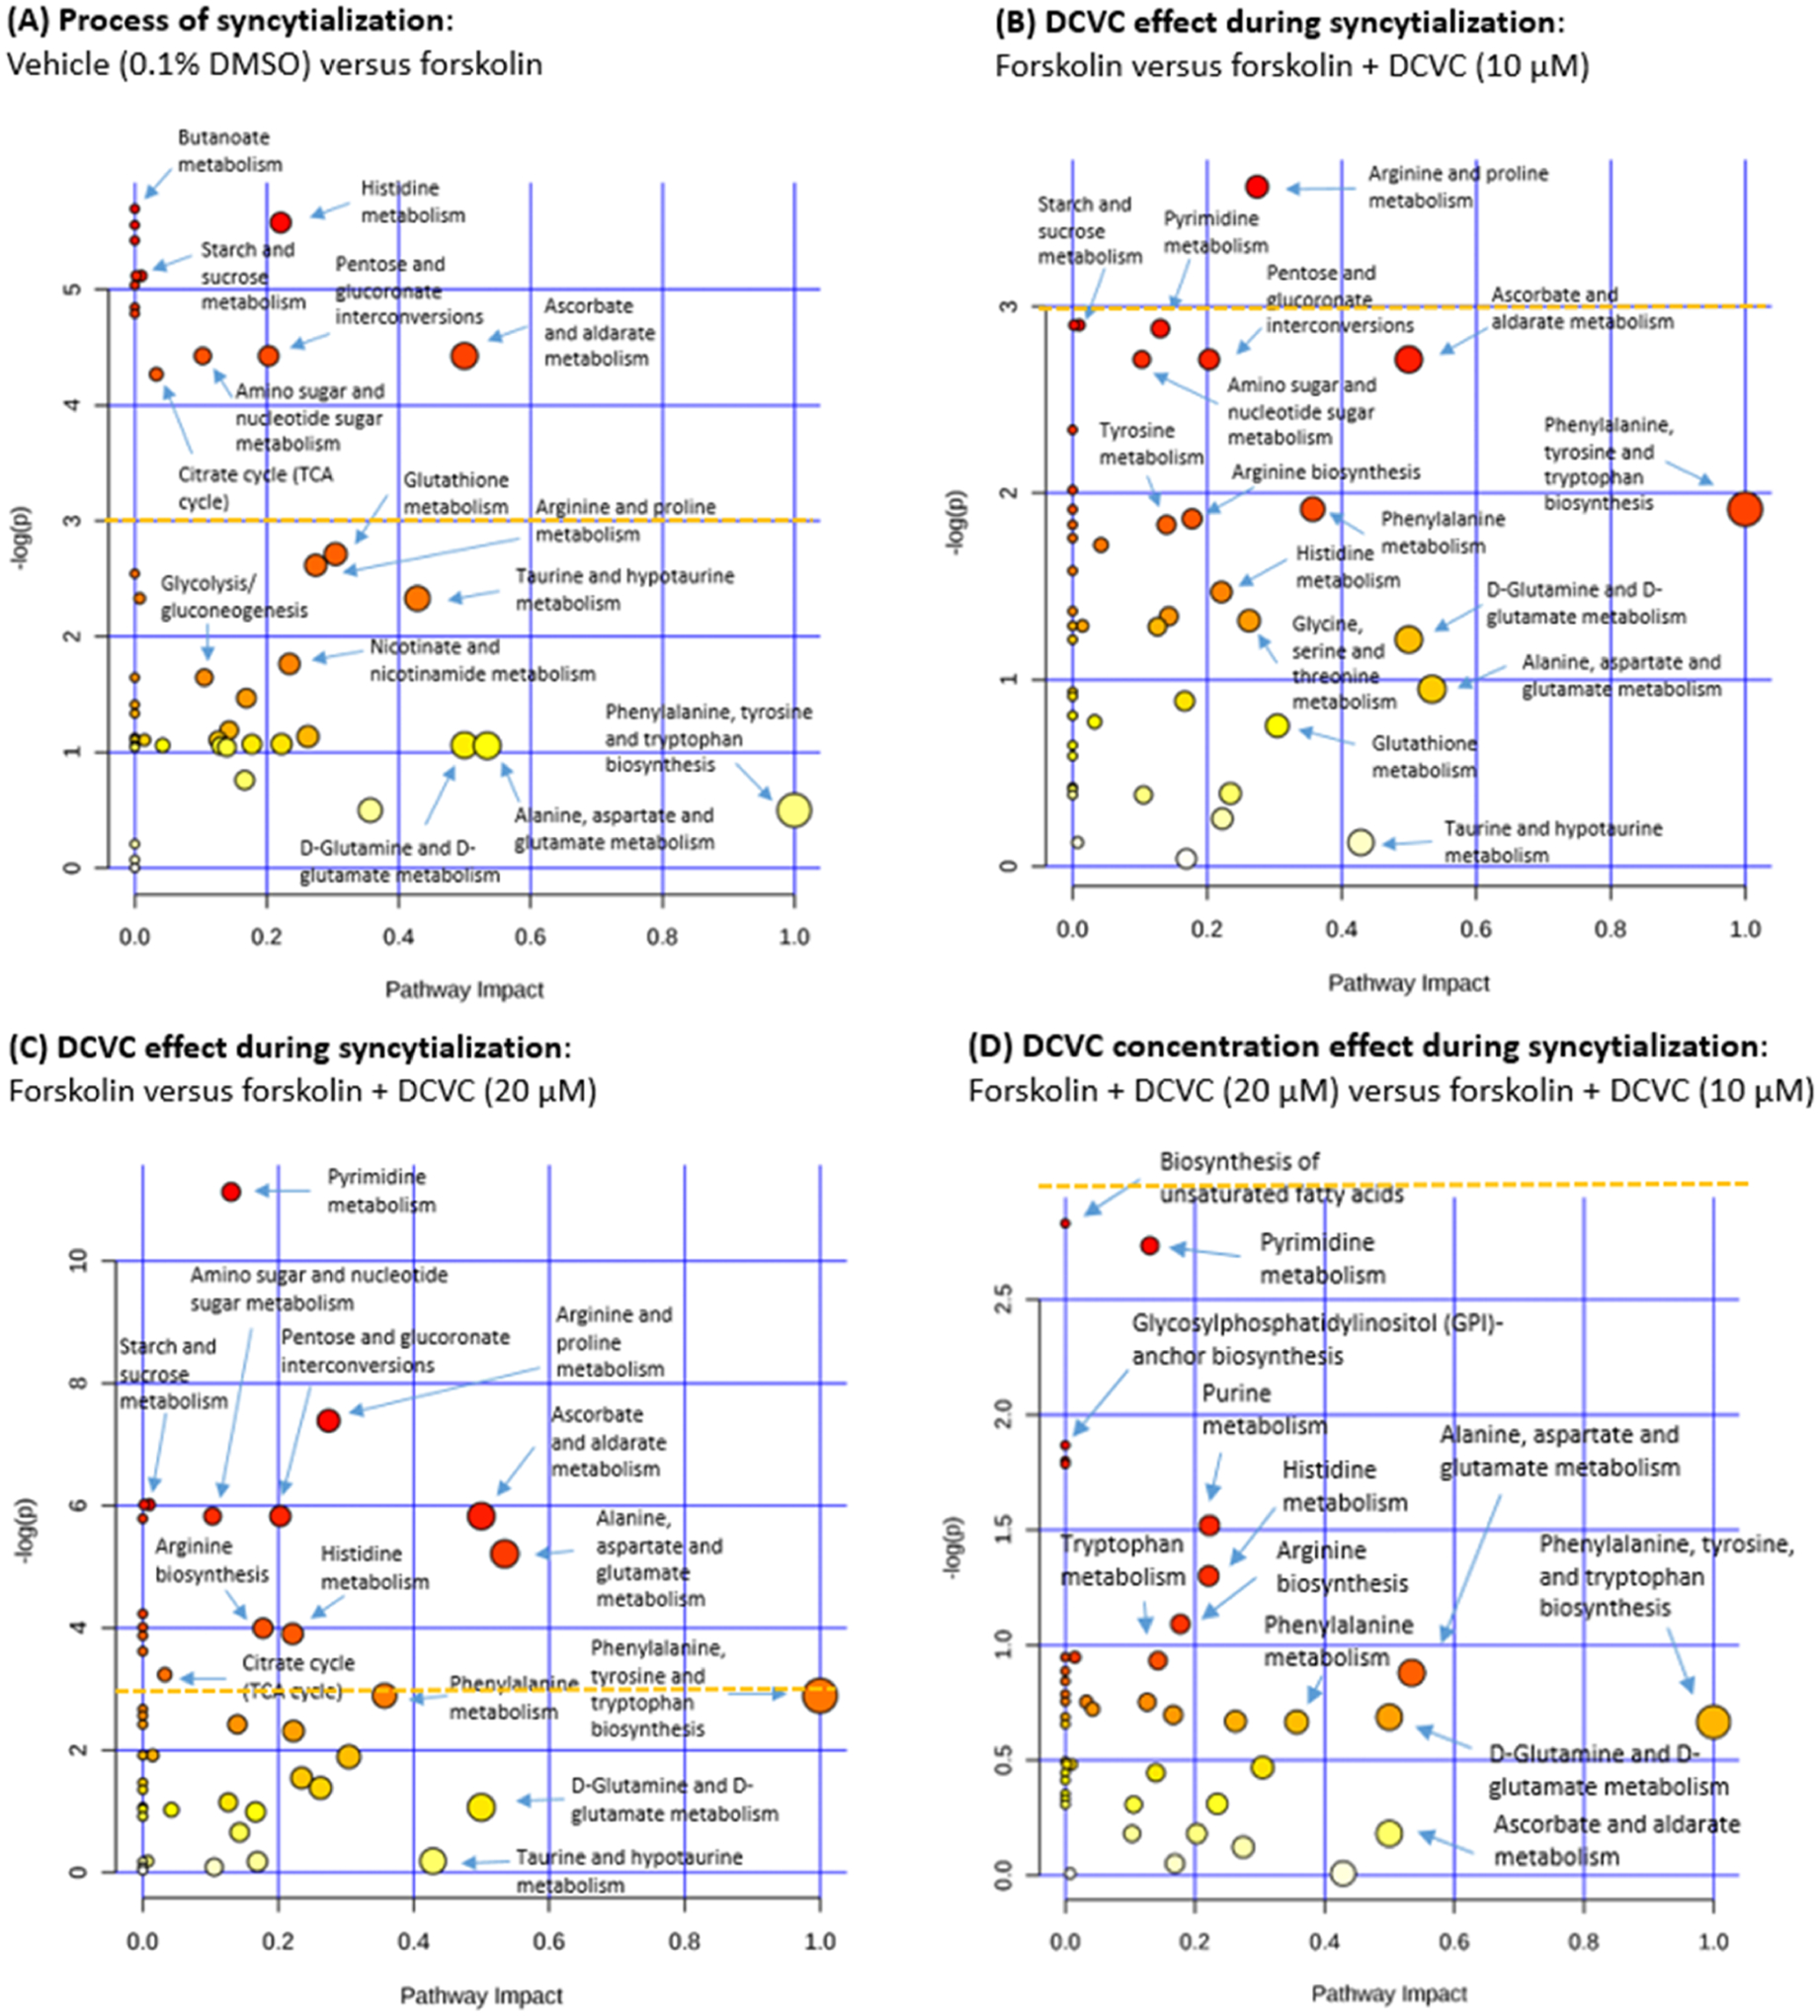
Pathway analysis performed by Metaboanalyst 4.0 to reveal changes in KEGG pathways altered by forskolin-stimulated syncytialization or DCVC treatment during syncytialization. Individual figures represent the effect of (A) syncytialization, comparing forskolin-only treatment to vehicle control; (B) 10 μM DCVC during syncytialization, comparing 10 μM DCVC treatment during syncytialization to forskolin-only treatment; (C) 20 μM DCVC during syncytialization, comparing 20 μM DCVC treatment during syncytialization to forskolin-only treatment, and (D) DCVC concentration–response, comparing 20 μM DCVC during syncytialization versus 10 μM DCVC during syncytialization. Pathway analysis (specific for H. sapiens) was performed by Metaboanalyst 4.0 on the data (generalized log-transformed). Individual circles represent different KEGG pathways. The circle color corresponds to the significance of the pathway (white to red in order of increasing significance), whereas the circle size corresponds to pathway impact, which is calculated as the matched metabolites as a cumulative percentage contributing to total pathway importance. A horizontal yellow dashed line indicates negative (log(p)) = 3, which corresponds to a p = 0.05 under the loge (or ln) scale used in this analysis. Axes ranges differ among the graphs to clearly label pathways.
Three pairwise comparisons were undertaken to assess the effects of DCVC treatment during syncytialization using Metaboanalyst 4.0 pathway analysis. Exposure to 10 μM DCVC significantly increased the arginine and proline metabolism pathway compared to forskolin-only treatment controls (p = 0.0262, pathway impact = 0.2744). Three additional pathways (starch and sucrose metabolism, galactose metabolism, and pyrimidine metabolism) had nonsignificant p-values between 0.05 and 0.06 comparing the 10 μM DCVC and forskolin-only controls (Figure 5B).
Following treatment with 20 μM DCVC during syncytialization, 16 pathways were statistically significantly altered in comparison with forskolin-only treatment controls. Eight out of the 16 pathways had a pathway impact score above 0.1: (1) pyrimidine metabolism (p = 1.50 × 10⁻⁵; pathway impact = 0.1305), (2) arginine and proline metabolism (p = 0.0006; pathway impact = 0.2744), (3) ascorbate and aldarate metabolism (p = 0.0029; pathway impact = 0.5000), (4) pentose and glucuronate interconversions (p = 0.0029; pathway impact = 0.2031), (5) amino sugar and nucleotide sugar metabolism (p = 0.0029; pathway impact = 0.1031), (6) alanine, aspartate, and glutamate metabolism (p = 0.0055; pathway impact = 0.5345), (7) arginine biosynthesis (p = 0.0184; pathway impact = 0.1777), and (8) histidine metabolism (p = 0.0202; pathway impact = 0.2213). Five of the 16 identified pathways had a pathway impact score of 0 (metabolites analyzed in the pathway were unimportant to the pathway itself). For the third comparison of 10 μM DCVC versus 20 μM DCVC during syncytialization, none of the 54 pathways achieved statistical significance. The lowest p-value for that comparison was 0.05904 in the case of fatty acid biosynthesis (pathway impact = 0), and the next lowest was for pyrimidine metabolism (p = 0.0650; pathway impact = 0.1305).
Analysis of Metabolite Ratios within KEGG Pathways (Totality).
We assessed ratios of consecutive metabolites in KEGG pathways and other ratios of biological importance, such as ratios of metabolites near the beginning and end of a KEGG pathway. The 48 metabolite ratios analyzed are listed in Tables S4–S8, along with their treatment-dependent fold changes and p-values. Details within specific pathways are presented in subsequent sections. In total, forskolin-stimulated syncytialization (forskolin-only treatment) significantly changed 16 of 48 ratios analyzed (p < 0.05). Treatment with 20 μM DCVC during syncytialization significantly changed 18 of the 48 ratios (p < 0.05). Both 10 and 20 μM DCVC changed five of the 18 ratios relative to forskolin-only treatment. A comparison of 20 μM DCVC treatment versus 10 μM DCVC treatment during syncytialization identified 8 of the 18 ratios significantly altered with one additional change that was not observed in the 20 μM DCVC treatment comparison to forskolin-only treatment. Of the ratios changed by forskolin or any comparison involving DCVC co-treatment, nine (adenosine triphosphate (ATP) to adenosine diphosphate (ADP), ADP to adenosine monophosphate (AMP), citrate and isocitrate to succinate, phosphoenolpyruvate to succinate, ornithine to proline, histidine to aspartate, phenylalanine to succinate, oleic acid to palmitic acid, and uridine diphosphate (UDP)-d-glucose to uridine monophosphate (UMP)) were in common to each other. DCVC treatment at 10 and/or 20 μM during forskolin-stimulated syncytialization augmented the following metabolite ratios in the same direction as produced by syncytialization itself (forskolin-only treatment): citrate and isocitrate to succinate, phosphoenolpyruvate to succinate, histidine to aspartate, phenylalanine to succinate, and ornithine to proline. Ratios of ATP to ADP, ADP to AMP, UDP-d-glucose to UMP, and oleic acid to palmitic acid changed in opposite directions following DCVC treatment during syncytialization at 10 and/or 20 μM compared with syncytialization itself (forskolin-only treatment).
Analysis of Metabolite Ratios within the Purine and Pyrimidine Metabolism Pathway.
Metabolite ratios altered within the purine and pyrimidine metabolism pathways are shown in Figures 6 and S1, respectively, and in Table S4. Compared with vehicle control (0.1% DMSO), forskolin-only treatment to stimulate syncytialization decreased the following ratios: ATP to ADP by 56.6% (p = 0.0410), ADP to AMP by 50.8% (p = 0.0051), GDP to GMP by 57.0% (p = 0.0096), and UDP to CMP by 42.1% (p = 0.0218) (Figures 6B,C,E and S1C, respectively). Treatment with 20 μM DCVC during syncytialization altered the following ratios relative to forskolin-only treatment control: ATP to ADP (51.4% increase, p = 0.0142), ADP to AMP (72.8% increase, p = 0.0049), ATP to AMP (167% increase, p = 0.0086), UMP to cytidine monophosphate (CMP) (42.6% decrease, p < 0.0001), and glutamine to UMP (243% increase, p < 0.0001) (Figures 6B–D and S1B,D, respectively). Metabolite ratio analysis comparing 20 μM DCVC versus 10 μM DCVC treatment during syncytialization revealed the following differences: ADP to AMP (65.8% increase, p = 0.0074), ATP to AMP (117% increase, p = 0.0209), UMP to CMP (31.3% decrease, p < 0.0001), glutamine to UMP (137% increase; p = 0.0001), and inosine to hypoxanthine (55.6% decrease, p = 0.0484) (Figures 6C,D, S1B,D, and 6F, respectively). DCVC treatment at 10 μM during syncytialization decreased the UMP to CMP ratio relative to forskolin-only treatment control by 16.5% (p = 0.0010) (Figure S1B).
Figure 6.
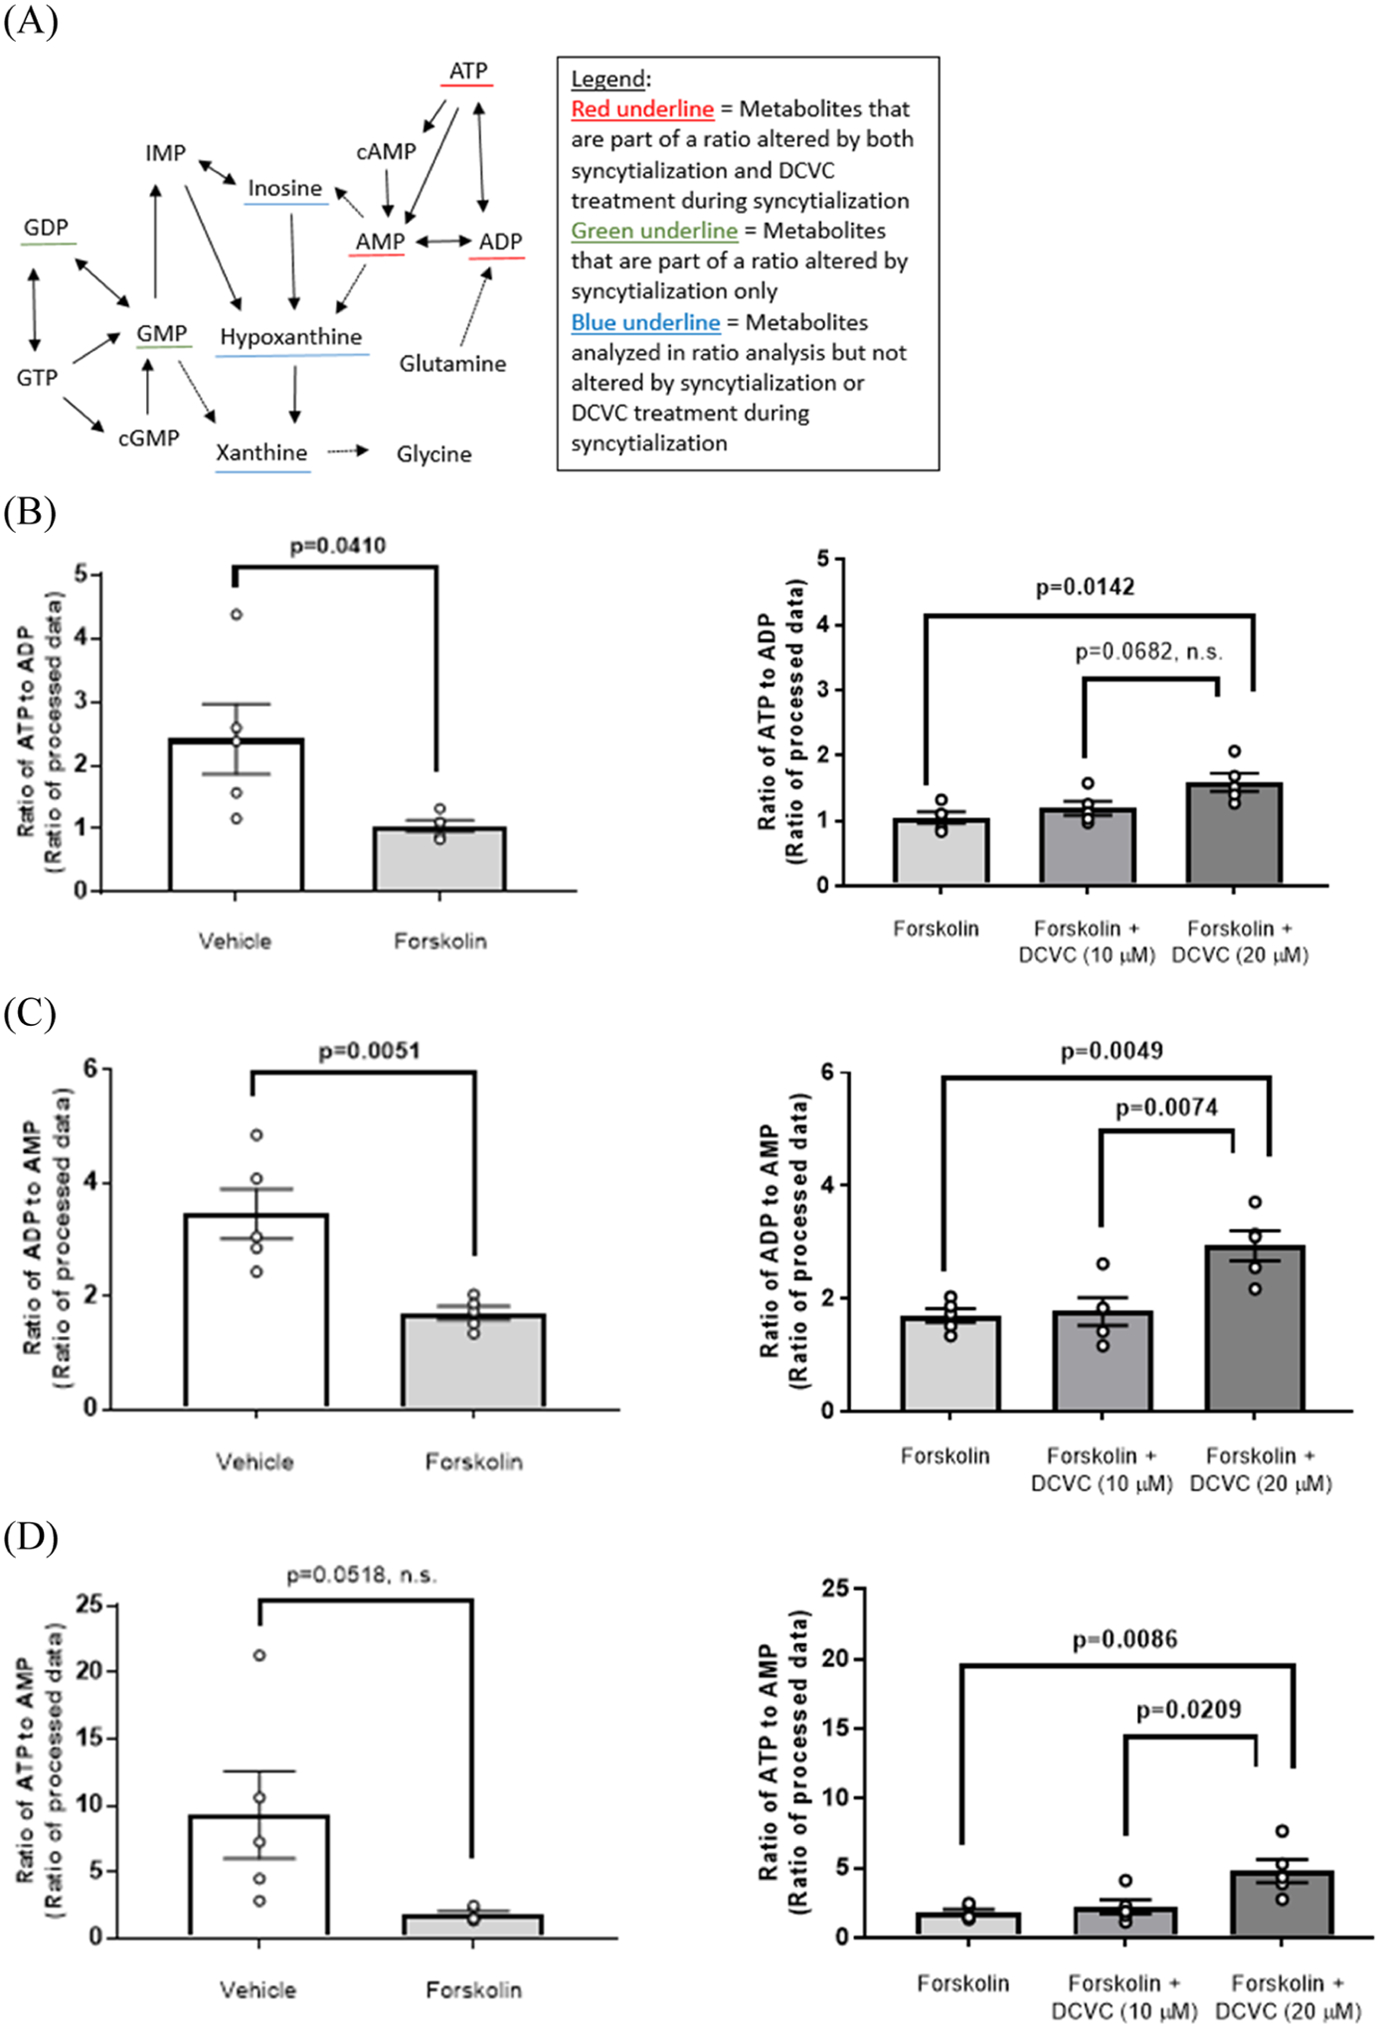
Purine metabolism as modified by syncytialization and DCVC treatment during syncytialization. (A) Simplified depiction of the purine metabolism KEGG pathway in H. sapiens. Specific metabolite ratios changed by syncytialization or DCVC treatment during syncytialization are shown for (B) the ATP to ADP ratio; (C) the ADP to AMP ratio; (D) the ATP to AMP ratio; (E) the GDP to GMP ratio; and (F) the inosine to hypoxanthine ratio. The inosine to hypoxanthine ratio was indicated as nonsignificant in (A) because of the lack of statistical significance compared to the control (forskolin-only treatment). In the graphs, error bars represent the mean ± standard error of the mean (SEM). N = 5 independent experiments. Abbreviations: ATP, adenosine triphosphate; ADP, adenosine diphosphate; AMP, adenosine monophosphate; cAMP, cyclic AMP; GTP, guanosine triphosphate; GDP, guanosine diphosphate; GMP, guanosine monophosphate; cGMP, cyclic GMP; and IMP, inosine monophosphate.
Analysis of Metabolite Ratios within the Glycolysis, Tricarboxylic Acid (TCA) Cycle, and Pentose Phosphate Pathways.
Ratios analyzed within glycolysis, the TCA cycle, and the pentose phosphate pathway are in Figures S2–S4 and Table S5. Metabolite ratios specific to glycolysis that were changed only included a decrease in the fructose 1,6-bisphosphate to phosphoenolpyruvate ratio in the case of forskolin-only treatment (syncytialization) relative to its untreated control (0.1% DMSO) (48.7% decrease, p = 0.0024) (Figure S2B). Although a change in response to forskolin treatment occurred within a specific portion of the glycolysis pathway, to understand if glycolysis as a whole was impacted, the ratio of glucose 6-phosphate and fructose 6-phosphate (early in glycolysis) to phosphoenolpyruvate (late in glycolysis) for each sample was analyzed. This ratio was not changed in response to forskolin exposure (p = 0.4974) (Table S5). Relative to forskolin-only treatment control, no DCVC treatment during syncytialization changed this ratio (the lowest p-value was 0.8680 in the case of the 10 μM DCVC versus 20 μM DCVC treatment during syncytialization comparison) (Table S5).
Within the TCA cycle, the citrate/isocitrate to succinate ratio was decreased in response to forskolin-only treatment (syncytialization) (54.1% decrease, p = 0.0061) and when 10 μM DCVC treatment during syncytialization and 20 μM DCVC treatment during syncytialization were each compared to forskolin-only treatment control (49.3 and 47.1% decrease, respectively; p = 0.0011 and 0.0015, respectively) (Figure S3B). The phosphoenolpyruvate to succinate ratio was decreased by forskolin-only treatment (50.2% decrease, p = 0.0007) and 20 μM DCVC treatment during syncytialization compared to forskolin-only treatment control (55.8% decrease, p = 0.0103) (Figure S3C). Forskolin-only treatment did not change any of the ratios we calculated for the pentose phosphate pathway. However, two of the ratios for the pentose phosphate pathway, ribose 5-phosphate and xylulose 5-phosphate to 6-phosphogluconate and ribose 5-phosphate and xylulose 5-phosphate to sedoheptulose 7-phosphate, were decreased by 20 μM DCVC treatment during syncytialization compared to forskolin-only treatment control (75.1 and 68.7% decrease, respectively; p = 0.0455 and 0.0090, respectively) (Figure S4B,C, respectively).
Analysis of Metabolite Ratios within Amino Acid Metabolism Pathways.
Analysis of amino acid metabolism pathways is included in Figures S5–S8 and Table S6. Forskolin-only treatment (syncytialization) changed the following three metabolite ratios: glutamate to succinate (73.6% decrease, p = 0.0029), histidine to aspartate (63.1% increase, p = 0.0046), ornithine to proline (42.6% increase, p = 0.0030), phenylalanine to succinate (68.8% decrease, p = 0.0053), and taurine to alanine (34.4% decrease, p = 0.0138) (Figures S5C, S6C, S7B, S8B, and Table S6, respectively). The asparagine to aspartate ratio was increased in the 20 μM DCVC treatment during syncytialization group compared to the forskolin-only treatment control and the 10 μM DCVC treatment during syncytialization groups (61.7 and 63.5% increase, respectively; p = 0.0366 and 0.0335, respectively) (Figure S5B). The ornithine to proline ratio was increased by 10 μM DCVC and 20 μM DCVC treatments during syncytialization each relative to the forskolin-only treatment control (65.1 and 110% increase, respectively; p = 0.0091 and 0.0001, respectively) (Figure S7B). The histidine to aspartate ratio was increased by 20 μM DCVC treatment during syncytialization compared to the forskolin-only treatment control and the 10 μM DCVC treatment during syncytialization groups (61.4 and 51.1% increase, respectively; p = 0.0195 and 0.0369, respectively) (Figure S6C). The phenylalanine to succinate ratio was decreased in the 10 μM DCVC and 20 μM DCVC treatments during syncytialization groups relative to the forskolin-only treatment control group (54.3 and 63.7% decrease, respectively; p = 0.0152 and 0.0054, respectively) (Figure S8B).
Analysis of Metabolite Ratios within Glutathione Metabolism.
Analysis of glutathione metabolism is included in Figure S9 and Table S7. Only one calculated ratio for glutathione (GSH) metabolism was altered: glutathione disulfide to nicotinamide adenine dinucleotide phosphate (NADP). This ratio was decreased with forskolin-only treatment (syncytialization) (57.9% decrease, p = 0.0487), and none of the comparisons with DCVC treatment during syncytialization resulted in alteration of this ratio (Figure S9B).
Analysis of Other Metabolite Ratios of Interest.
Additional analysis of metabolite ratios as they relate to pathways is included in Figure S10 and Table S8. Other metabolite ratios altered by forskolin-only treatment (syncytialization) included the following: oleic acid to palmitic acid (99.8% increase, p = 0.0104), UDP-d-glucose to UDP-d-glucuronate (31.7% decrease, p = 0.0272), and UDP-d-glucose to UMP (58.1% decrease, p = 0.0266) (Table S8). A few other metabolite ratios were altered in comparisons involving DCVC treatment during syncytialization. DCVC treatment at 20 μM during syncytialization altered the following ratios relative to forskolin-only treatment control: phosphocreatine to ATP (82.4% decrease, p = 0.0074) (Figure S10B), phosphocreatine to ADP (72.0% decrease, p = 0.00126) (Figure S10C), stearic acid to oleic acid (117% increase, p = 0.0072) (Table S8), oleic acid to palmitic acid (53.5% decrease, p = 0.0148) (Table S8), and UDP-d-glucose to UMP (101% increase, p = 0.0091) (Table S8). DCVC treatment at 10 μM during syncytialization decreased the phosphocreatine to ATP ratio relative to forskolin-only treatment control (59.7% decrease, p = 0.0465) (Figure S10B). DCVC treatment at 20 μM during syncytialization altered the following ratios relative to DCVC treatment at 10 μM during syncytialization: stearic acid to oleic acid (72.0% increase, p = 0.0324) and UDP-d-glucose to UMP (84.1% increase, p = 0.0163) (Table S8). It is noteworthy that both of the ratios consisting of phosphocreatine were only altered when performing the comparisons involving DCVC treatment compared to forskolin-only treatment and not when investigating forskolin-only treatment compared to vehicle (0.1% DMSO).
Effects of DCVC during Syncytialization on Media Concentrations of Selected Matrix Metalloproteinases (MMPs).
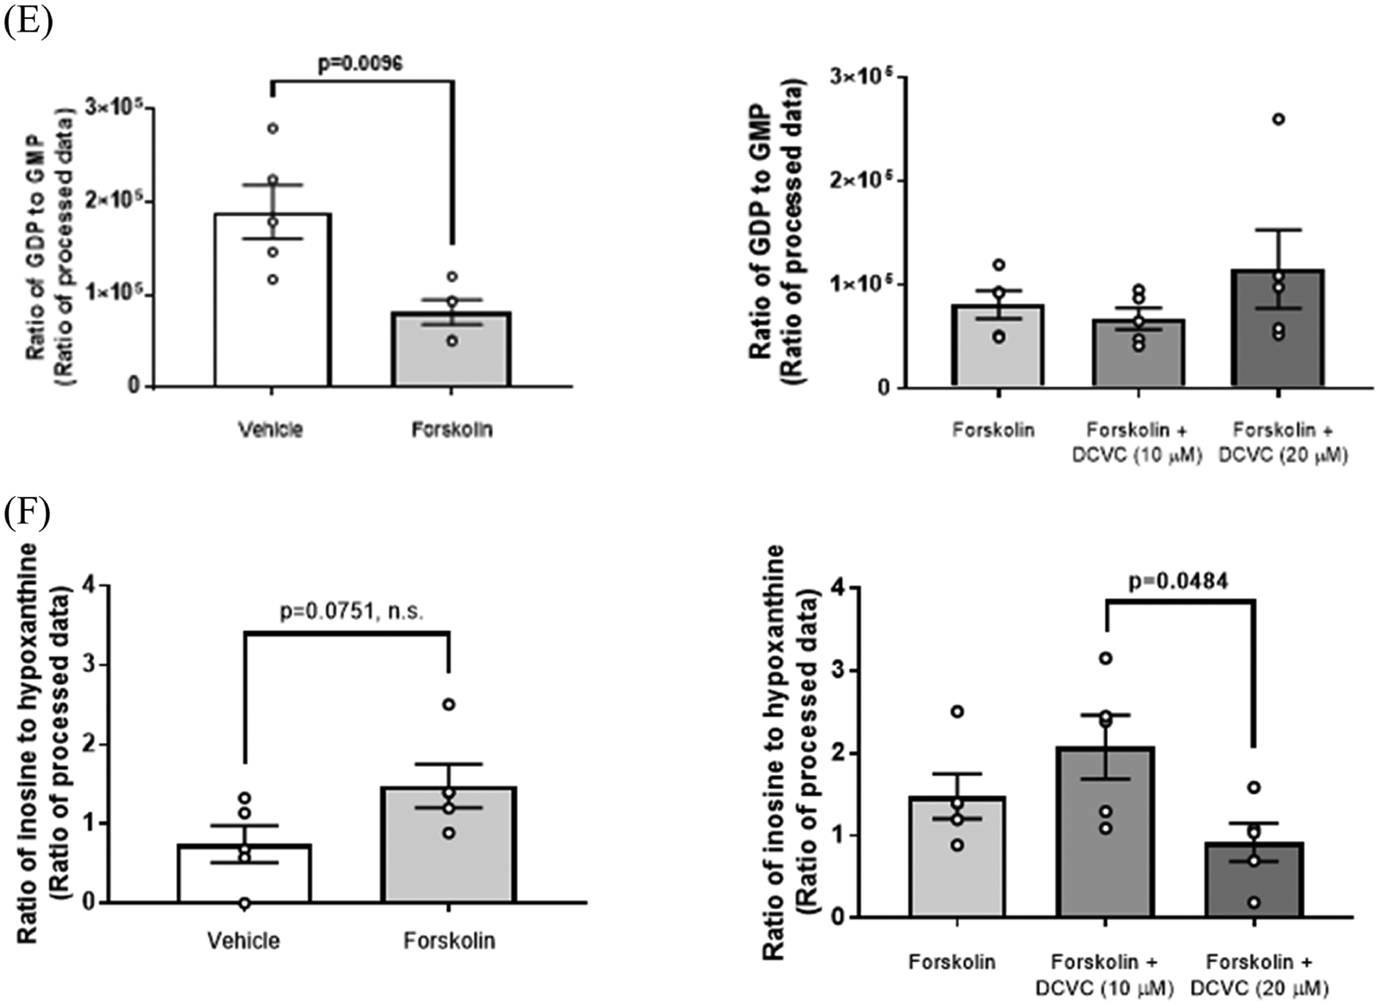
Oleic acid was one of the few metabolites increased by forskolin-stimulated syncytialization but decreased by DCVC treatment during syncytialization in our study. Because several matrix metalloproteinases (MMPs) are downstream of oleic acid signaling,50,51 we investigated DCVC-stimulated changes in media concentrations of the matrix metalloproteinases MMP-1, MMP-2, MMP-3, and MMP-9 (Figure 7). Forskolin-only treatment (syncytialization) increased MMP-2 by 380% (p = 0.0001), an effect that was reduced by DCVC treatment at 20 and 50 μM during syncytialization relative to forskolin-only treatment (44.2 and 68.6% decrease, respectively; p = 0.0351 and 0.0007, respectively) (Figure 7B). Treatment with 50 μM DCVC during syncytialization increased MMP-1 relative to control (forskolin-only treatment) by 341% (p = 0.0299) (Figure 7A). Neither syncytialization itself nor DCVC treatment during syncytialization significantly changed MMP-3 or MMP-9 (Figure 7C,D, respectively). Combining the data from Figure 7A–D and the oleic acid data in the current study, Figure 7E shows a proposed model by which syncytialization and DCVC treatment during syncytialization could impact MMPs and oleic acid.
Figure 7.
Effect of syncytialization and DCVC treatment during syncytialization on matrix metalloproteinase (MMP) concentrations in BeWo cell media. Effect on (A) MMP-1, (B) MMP-2, (C) MMP-3, and (D) MMP-9. Statistical significance is denoted by non-overlapping letters (p ≤ 0.0351). Error bars represent the mean ± SEM. N = 5 independent experiments. (E) Proposed mechanism by which DCVC co-treatment may act to stimulate adverse pregnancy outcomes involving oleic acid and MMPs. Solid lines indicate relationships confirmed by the current study to date. Dotted lines indicate relationships inferred by the previous literature. Dotted lines with a question mark above indicate relationships untested previously. A high likelihood exists that the relationships are also mediated by tissue inhibitors of metalloproteinases (TIMPs) and a disintegrin and metalloproteinases (ADAMs).
DISCUSSION
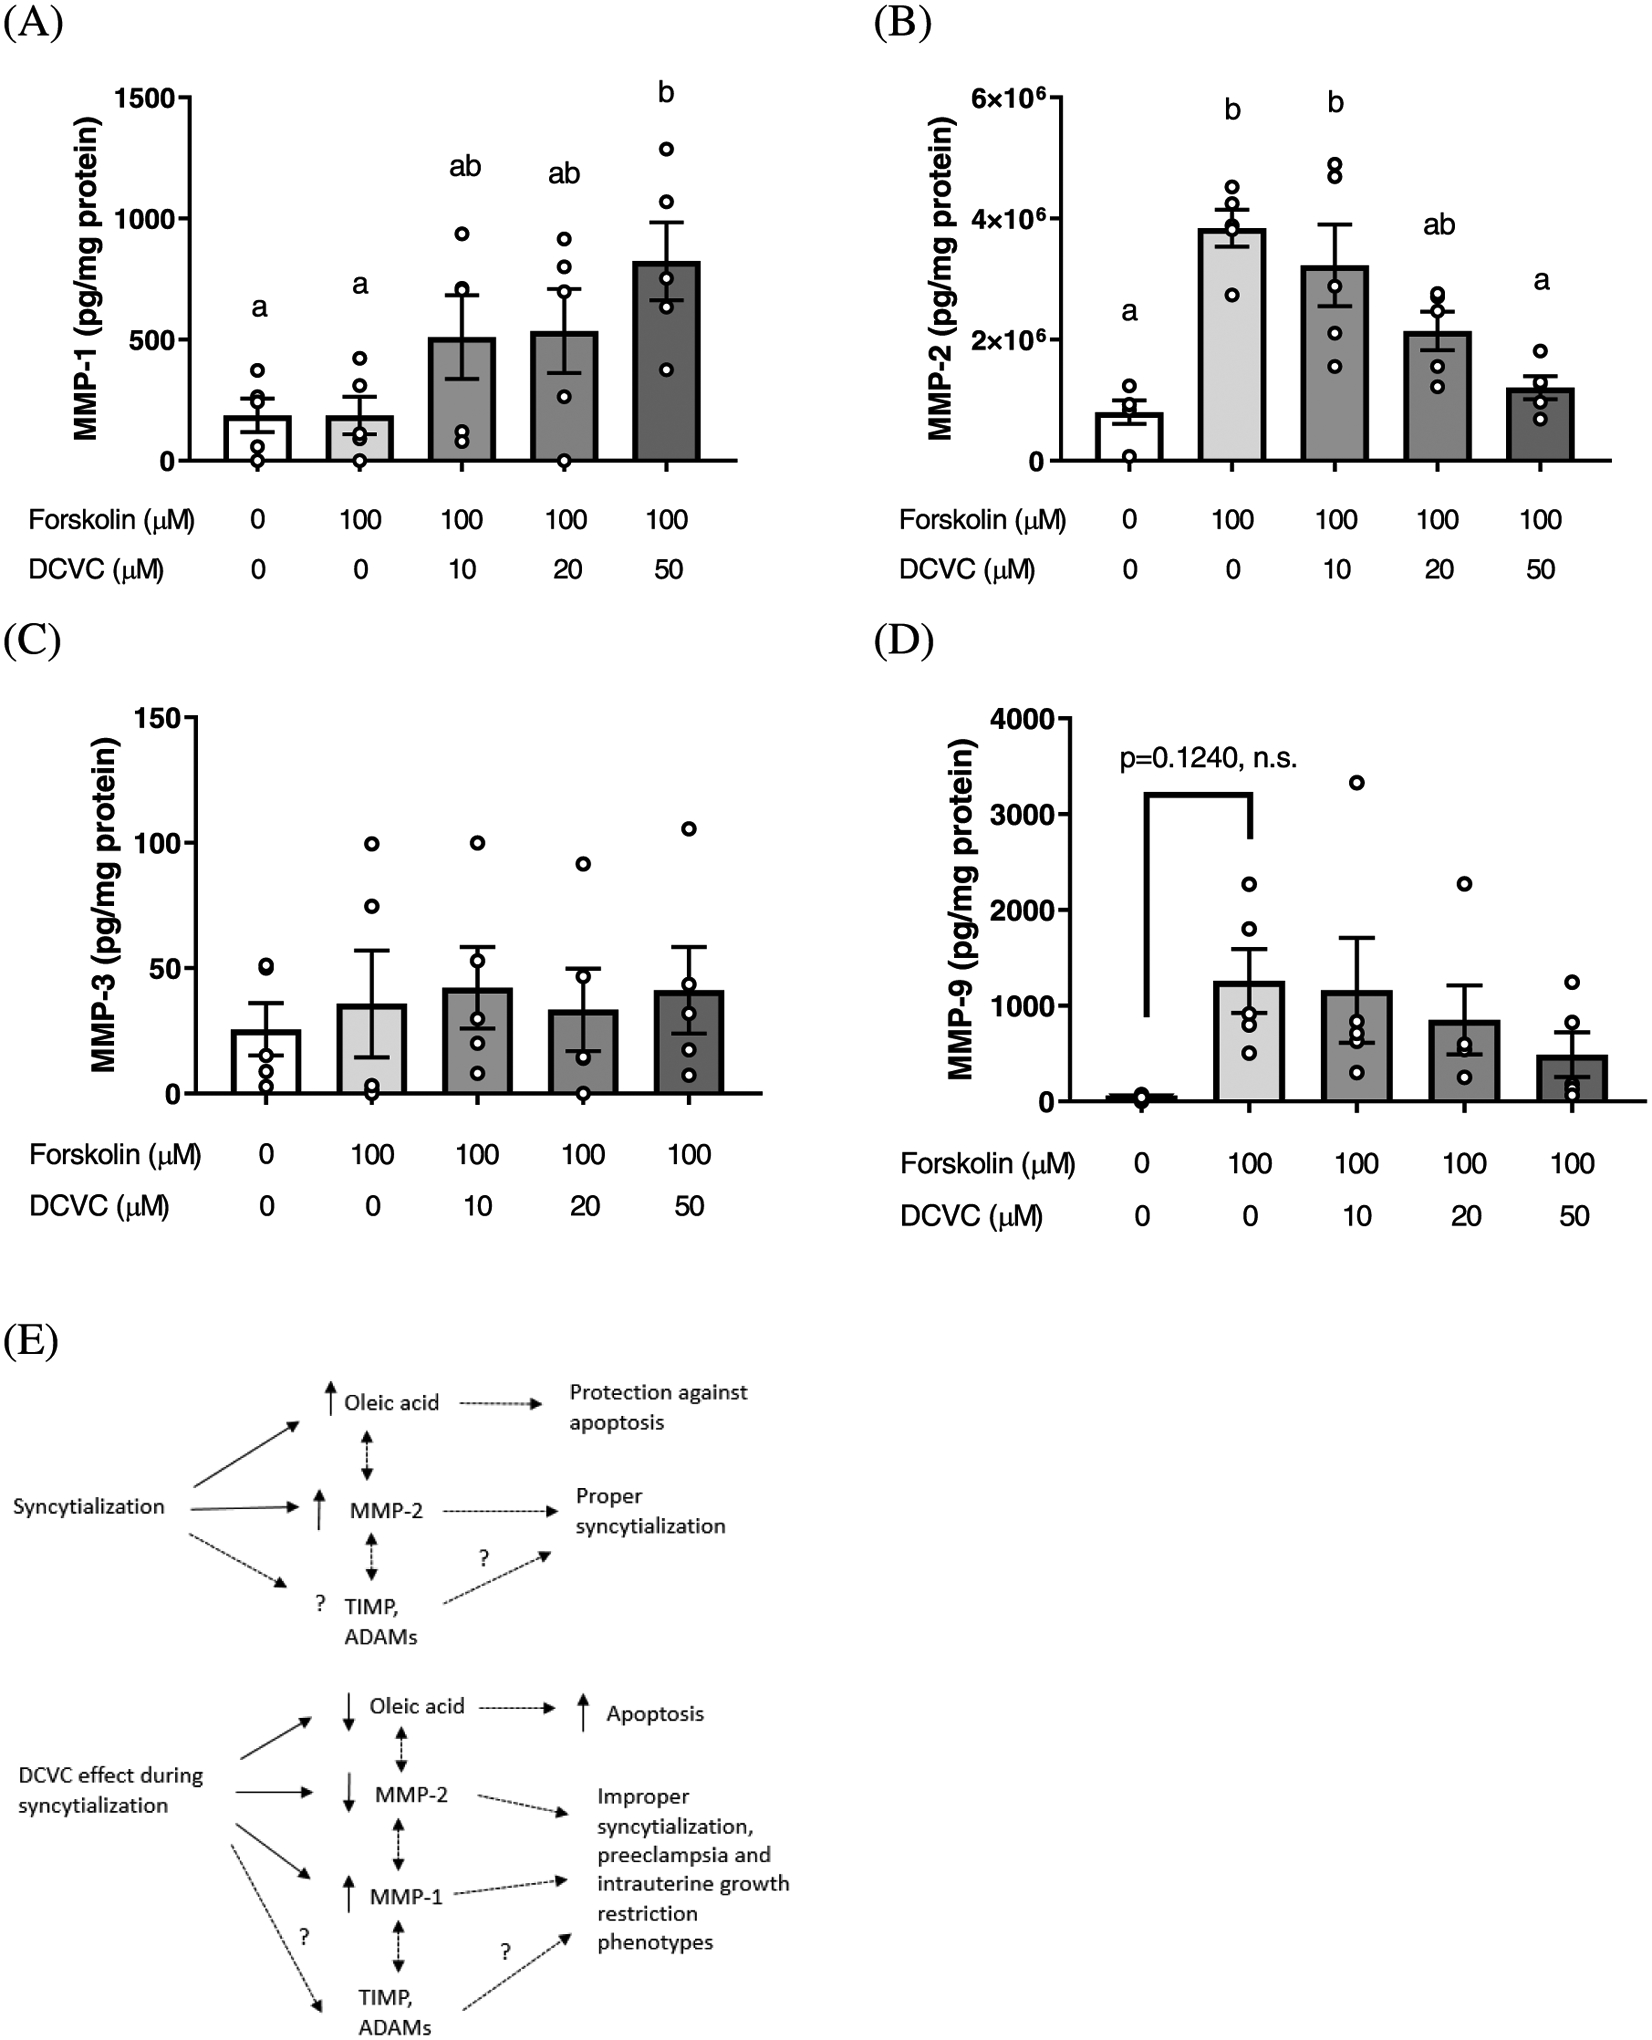
This metabolomics study provides novel information regarding energy metabolism and amino acids in placental cells exposed to the TCE metabolite DCVC while undergoing syncytialization, as summarized in Figure 8. Importantly, Figure 8 also depicts multiple KEGG pathway regions that warrant further investigation, such as arginine biosynthesis. DCVC treatment during syncytialization affected multiple endpoints that were modified by syncytialization itself, especially prominent for the pathway and metabolite ratio analyses.
Figure 8.
Effect of syncytialization or DCVC treatment during syncytialization on a simplified depiction portraying relationships among KEGG metabolism pathways. Boxed names are individual KEGG pathways, and unboxed names are critical metabolites that connect the pathways. Metabolite concentrations or relative responses and Metaboanalyst 4.0 pathway analysis results were used in determining metabolite and pathway significance, respectively. Dashed arrows indicate multistep processes. Abbreviations: aCoA, acetyl coenzyme A; OAA, oxaloacetate; d-G1P, α-d-glucose 1-phosphate; UDP-Glu, uridine diphosphate-glucose; R5P, d-ribulose 5-phosphate; PRPP, phosphoribosyl pyrophosphate; FUM, fumarate; CP, carbamoyl phosphate, Gly-3P, glycerate 3-phosphate; Gly-2P, glycerate 2-phosphate; d-Glyal-3P, d-glyceraldehyde 3-phosphate; d-G6P, α-d-glucose 6-phosphate; 5-PRA, 5-phosphoribosylamine; Fru-6P, fructose 6-phosphate; and GTP, guanosine triphosphate.
Metabolites Altered.
Our findings of altered energy metabolites and amino acids with forskolin-only treatment to stimulate syncytialization and DCVC treatment during syncytialization provide insight into specific metabolites and classes of metabolites changed by DCVC in the context of syncytialization. Forskolin-stimulated syncytialization decreased the abundance of cellular acidic amino acids (e.g., glutamate and aspartate) and increased the abundance of purine monophosphates (adenosine monophosphate (AMP) and guanosine monophosphate (GMP)). Similar to our findings of the lack of the effect of forskolin on neutral amino acids, forskolin does not affect amino acid system transporter A (SysA), which mediates the transport of neutral amino acids.52 Changes in energy metabolites in BeWo cells undergoing syncytialization are consistent with energy utilization and amino acid turnover observed in the multinucleation of slime molds.53,54 However, the impact of syncytialization on the transport of acidic and basic amino acids has not been investigated previously, and a decrease of intracellular acidic amino acids by syncytialization may suggest that syncytialization hinders intracellular transport of acidic amino acids. Investigations of amino acid transport during syncytialization would be informative for advancing knowledge on the biology of syncytialization to improve pregnancy health. On the other hand, DCVC treatment during syncytialization decreased pyrimidine phosphates (uridine diphosphate (UDP), uridine monophosphate (UMP), and cytidine monophosphate (CMP)) and altered the abundance of other metabolites not part of a specific energy metabolite group. These results support findings that DCVC modifies energy metabolism and amino acids in HTR-8/SVneo placental cells20 but do not support that acidic amino acids are a target of DCVC.
The impact of DCVC treatment on energy metabolites and amino acids during forskolin-stimulated syncytialization is generally consistent with prior reports of DCVC effects on placental cells while contributing new information about possible mechanisms of action. The finding that DCVC altered pyrimidine phosphates (UDP, UMP, and CMP) has not been previously reported. Because oleic acid is protective against apoptosis in syncytiotrophoblasts,55 the oleic acid decrease we observed might have a role in the DCVC-stimulated apoptosis in HTR-8/SVneo placental cells18 and BeWo cells.9 Additionally, proline and aspartate, both decreased by DCVC treatment during syncytialization, have important roles in pregnancy. Proline is crucial for polyamine synthesis during pregnancy and has been suggested to ameliorate intrauterine growth restriction.56,57 Aspartate is also decreased in cases of early-onset preeclampsia58 and, in addition to glutamate, preferentially located in the placenta as opposed to maternal or fetal circulation.59
From prior studies, it is known that forskolin activates adenylate cyclase to increase intracellular cyclic AMP (cAMP).3,7 Although we did not measure cAMP directly, it is plausible that our data on increased AMP is a consequence of the increased cAMP breakdown by cyclic nucleotide phosphodiesterase into AMP.60,61 Whether phosphodiesterase activity increases more than that of other enzymes stimulated by cAMP is not presently clear, however. Our data showing increased GMP following forskolin-stimulated syncytialization could be a consequence of increased phosphodiesterase activity, perhaps by cAMP stimulation, in converting cyclic GMP (cGMP) to GMP. However, the role of forskolin on GMP or cGMP has not been previously studied in BeWo cells.
Of three metabolites altered by both forskolin-stimulated syncytialization and DCVC treatment during syncytialization, the change produced by DCVC treatment was an exacerbation of suppression by syncytialization for two metabolites (aspartate and UDP-d-glucose) and decrease of augmentation by syncytialization for one metabolite (oleic acid). These findings highlight that the effects of DCVC exposure during syncytialization were not identical to those of syncytialization itself and that the direction of change could either be an exacerbation or reversal of the syncytialization effect. In support of this observation, our correlation analysis indicated that changes stimulated by syncytialization did not correlate well with changes stimulated by DCVC treatment during syncytialization and that changes stimulated by different concentrations of DCVC correlated well with each other.
Purine and Pyrimidine Metabolism.
Ratio analysis within the purine metabolism pathway revealed that forskolin-stimulated syncytialization decreased the formation of ATP relative to ADP, as well as the formation of ADP relative to AMP. DCVC treatment during syncytialization reversed all of those forskolin-stimulated changes. Although the decreased ADP relative to AMP stimulated by syncytialization was expected given that forskolin increases intracellular cAMP,3,7 the finding that DCVC treatment during syncytialization reversed this hallmark of forskolin-stimulated syncytialization is novel. However, the finding that DCVC treatment during syncytialization increased the ATP to ADP ratio is unexpected because DCVC decreases intracellular ATP in kidney cells.28,29,31 It may be possible that syncytialization itself suppressed the ATP to ADP ratio enough such that no further suppression could have occurred or that DCVC has an opposing effect to syncytialization on enzymes in the conversion of adenosine phosphates. Regardless, because extracellular ATP is known to be vasoconstrictive and pro-inflammatory during pregnancy42 and causes albuminuria with a pro-inflammatory response in rats,62 it is plausible that the DCVC-stimulated effect would be detrimental for pregnancy. Future directions can serve to further characterize pregnancyrelated outcomes resulting from DCVC exposure during pregnancy, understand how extracellular ATP is manifest in intracellular ATP, and investigate the relationship between DCVC and enzymes involved in conversion between the adenosine phosphates, such as CD39, CD73, and alkaline phosphatase.42 Interestingly, syncytialization also increased GMP relative to GDP, showing that guanosine phosphates may also be relevant to syncytialization. The mechanism linking changes in adenosine phosphates with changes in guanosine phosphates remains unknown in the context of syncytialization.
Ratios analyzed within the pyrimidine metabolism pathway revealed that forskolin-stimulated syncytialization favored the formation of CMP relative to UDP, whereas DCVC treatment during syncytialization favored the formation of CMP and glutamine relative to UMP. We suggest that these changes in pyrimidine metabolism stimulated by DCVC during syncytialization, especially regarding glutamine, could be an adaptive response to improve pregnancy outcomes. In support of this, glutamine has been proposed to improve pregnancy outcomes in mice and other mammals,63,64 reduces alcohol-stimulated maternal hypercapnia during pregnancy,65 and its appropriate levels prevent hypoglycemia during pregnancy.66 However, the roles of UMP, UDP, or CMP in pregnancy remain outstanding questions, and their understanding would be needed to further place these findings in context.
Glycolysis, Tricarboxylic Acid (TCA) Cycle, and Pentose Phosphate Pathways.
Despite the inability of forskolin-stimulated syncytialization or DCVC treatment during syncytialization to affect glycolysis or gluconeogenesis in pathway analysis by Metaboanalyst (p > 0.05), forskolin-stimulated syncytialization altered a few metabolite ratios within glycolysis. Specifically, the ratio of fructose 1,6-bisphosphate to phosphoenolpyruvate was decreased by syncytialization. Although these are not consecutive metabolites in glycolysis, the possibility exists that syncytialization preferentially shifted glycolysis overall to favor the late portion of glycolysis (e.g., phosphoenolpyruvate) as opposed to the earlier portion of glycolysis (e.g., fructose 1,6-bisphosphate). Investigation of additional metabolites in glycolysis would address that possibility. Additionally, the change in the metabolite ratio could be attributable to a substrate that feeds into phosphoenolpyruvate but not fructose 1,6-bisphosphate, such as oxaloacetate and 2-phospho-d-glycerate,67–69 which were not measured in the current study.
For the TCA cycle, ratio analysis indicated that both forskolin-stimulated syncytialization and DCVC treatment during syncytialization favored the production of succinate relative to phosphoenolpyruvate and citrate and isocitrate. Whereas succinate is a direct precursor of succinyl coenzyme A,70,71 isocitrate can be converted to 2-oxoglutarate,72 which can be converted to succinyl coenzyme A.73,74 Because DCVC inhibits 2-oxoacid dehydrogenases with corresponding increased build-up of 2-oxoglutarate and decreased production of citrate,25 DCVC can be expected to decrease succinyl coenzyme A. Succinyl coenzyme A and 2-oxoglutarate were not measured in the current study, and their measurements would be needed to further conclusions about the impact of DCVC on the TCA cycle. The pentose phosphate pathway was a pathway in which DCVC treatment during syncytialization favored the production of 6-phosphogluconate and sedoheptulose 7-phosphate relative to ribose 5-phosphate and xylulose 5-phosphate. Future analysis can consider the role of 6-phosphogluconate dehydrogenase, which converts 6-phosphogluconate into 6-ribulose 5-phosphate,75,76 which can be converted to d-xylulose 5-phosphate by an epimerase.77 Identification of the relationship between DCVC and these enzymes can help inform the mechanism of action of DCVC.
Amino Acid and Glutathione Metabolism.
Forskolin-stimulated syncytialization favored the abundance of (1) histidine relative to aspartate, (2) succinate relative to glutamate, (3) nicotinamide adenine dinucleotide phosphate (NADP) relative to glutathione disulfide (GSSG), (4) succinate relative to phenylalanine, and (5) ornithine relative to proline. In contrast, DCVC treatment during syncytialization favored the abundance of (1) asparagine relative to aspartate, (2) histidine relative to aspartate, (3) succinate relative to phenylalanine, and (4) ornithine relative to proline. With regard to the ornithine to proline ratio (within the arginine metabolism pathway), the direction of change by both syncytialization and DCVC treatment during syncytialization was toward the direction of increased arginine and nitric acid as opposed to proline. Because arginine has been suggested to promote embryonic survival78 and is a treatment for preeclampsia because of its role as a precursor of the vasodilator nitric oxide,79 the current study would have benefitted from actual detection of arginine or other metabolites that are located closer to nitric oxide in the arginine metabolism pathway. These detections could further knowledge about the relationship of syncytialization or DCVC treatment to vasodilation or vasoconstriction during pregnancy.
The finding that DCVC treatment during syncytialization increased aspartate relative to asparagine may be relevant to pregnancy. Asparagine has been implicated to be important in rat fetal growth,80 so it may be possible that the increase in the asparagine to aspartate ratio stimulated by DCVC treatment during syncytialization could be a compensatory change in amino acid supply. Additional metabolite ratios in amino acid metabolism altered in the current study have implications for adverse pregnancy outcomes. These include decreased succinate as associated with preeclampsia, and decreased phenylalanine as also associated with preeclampsia.81,82 Additionally, the finding that DCVC treatment during syncytialization altered three ratios (histidine to aspartate, succinate to phenylalanine, and ornithine to proline) in the same direction as syncytialization but did not alter any ratios the other way around was notable. This suggests that on the level of amino acid metabolism, DCVC treatment during syncytialization could more likely be further promoting syncytialization as opposed to opposing syncytialization.
The finding that forskolin-stimulated syncytialization increased the NADP to GSSG ratio but did not alter the glutathione (GSH) to GSSG ratio is contrary to findings in slime mold, in which multinucleation is accompanied by decreased GSH.83 Possible explanations for the different findings include the different methods used to stimulate multinucleation and differences in methodology used to detect GSH. Nevertheless, the finding of the increased NADP to GSSG ratio by syncytialization raises considerations. The first is whether NADP may have a greater impact than GSH in regulating GSH reductase, which generates GSSG from GSH and NADP.84,85 The second is whether syncytialization is accompanied by GSH reductase inhibition. However, DCVC itself is an inhibitor of GSH reductase.27 Because our study did not see a corresponding decrease in GSH levels by DCVC, it is possible that syncytialization itself decreased GSH reductase activity to low levels such that DCVC could not impact GSH reductase, which supports the second theory.
Oleic Acid and Matrix Metalloproteinases.
Consistent with prior reports that multiple matrix metalloproteinases (MMPs) are downstream signaling molecules of oleic acid,50,51 we found that DCVC treatment during syncytialization decreased MMP-2 and oleic acid, which were both increased by syncytialization. Although MMP-1 increased with DCVC treatment during syncytialization, MMP-3 and MMP-9 were unchanged by syncytialization or DCVC treatment during syncytialization, suggesting that these MMPs as less responsive. Increased extracellular MMP-2 is suggested to have relevance to adverse pregnancy outcomes86,87 and syncytialization.88,89 Although MMP-1 and MMP-2 are classified as a collagenase and a gelatinase, respectively, and cleave different substrates,90 the meaning of these differences, as well as other differences among MMPs, remain unclear in the context of syncytialization. However, our data still suggest that selective regulation of MMPs, possibly attributable to oleic acid, would be plausible mechanisms for DCVC modulation of syncytialization. Interestingly, the downregulation of sirtuin 1 has been suggested to be a mechanism by which oleic acid upregulates secretion of MMP-1 and MMP-3,91 suggesting that sirtuin 1 could be downregulated by forskolin-stimulated syncytialization and upregulated by DCVC during syncytialization. Upregulated sirtuin 1 has also been correlated with decreased senescence of syncytialized BeWo cells,92 suggesting that a link may exist between DCVC and senescence. Additional future directions could also consider the extent by which upstream mechanisms, including AMP-activated protein kinase that enhances MMP-1 and MMP-2 production,93 could be responsible for an MMP effect.
Other Considerations.
An overall limitation in the current study lies with the limited number of metabolites able to be quantified and the different methods for quantification (e.g., relative versus absolute processed and reported values) in the metabolomics analysis. Overcoming these limitations would allow for more specific inferences about pathways and adverse pregnancy outcomes. Additionally, the cells used in the study have limitations. Although forskolin-stimulation of BeWo cells produces features consistent with normal syncytialization,3 results may differ for placental cells in vivo. Nevertheless, forskolin presents benefits compared to other agents that have been proposed to stimulate syncytialization, such as 8-Br-cAMP and dibutyryl-cAMP, which require concentrations up to 1 mM to induce cell fusion.3
CONCLUSIONS
In summary, both forskolin-stimulated syncytialization and DCVC treatment during forskolin-stimulated syncytialization elicited effects on amino acids and metabolites involved in energy metabolism. Notable and novel findings indicate that syncytialization and DCVC treatment during syncytialization provide opposing effects on some metabolite ratios but the same direction effects on other metabolite ratios. Additionally, DCVC decreased acidic amino acids, glutamate and aspartate, and nucleotide monophosphates, supporting that DCVC targets may be confined to specific classes of metabolites. Furthermore, DCVC failed to increase the abundance of any measured metabolite, suggesting that DCVC is generally suppressive on energy metabolites and amino acids. Finally, our work identified a potential role for MMPs in the mechanism of syncytialization that is modifiable by DCVC treatment during syncytialization. The notion of DCVC treatment as not simply a positive or negative regulator of syncytialization is consistent with the idea that syncytialization is a complex process with multiple mechanisms of regulation.40 Important future directions include understanding how changes in specific portions of the pathways have relation to other pathway portions, especially given knowledge of mitochondria as a DCVC target, and use of the discoveries in the current study to inform approaches at DCVC toxicity modulation possibly through targeting of specific enzymes.
Supplementary Material
ACKNOWLEDGMENTS
The authors thank Maureen Kachman, Charles Evans, Angela Wiggins, and Kari Bonds of the University of Michigan Metabolomics Core for targeted metabolomics quantification. The authors also thank Larisa Yeomans for verifying the chemical identity of DCVC through 1H NMR.
Funding
The authors gratefully acknowledge the Michigan Regional Comprehensive Metabolomics Resource Core, supported by U24DK097153 of the National Institutes of Health (NIH) Common Funds Project. This work was supported by the National Institute of Environmental Health Sciences (NIEHS) and the National Institutes of Health (NIH), with a research project to R.K.L.-C. (P42ES017198), training grant fellowship support to A.L.S. (T32ES007062), a research project to J.C. (R01ES028802), and additional project support from the Michigan Center for Lifestage Environmental Exposure and Disease (P30ES017885). Additional training grant fellowship support for A.L.S. was from the Eunice Kennedy Shriver National Institute of Child Health and Human Development (NICHD), NIH (T32HD079342). Support was also gratefully provided by the University of Michigan Rackham Graduate Student Research Grants. The content is solely the responsibility of the authors and does not necessarily represent the official views of the NIEHS, NICHD, NIH, or the University of Michigan.
Footnotes
Author Contributions
CRediT: Anthony L Su conceptualization, data curation, formal analysis, investigation, methodology, writing-original draft, writing-review & editing; Sean M. Harris conceptualization, formal analysis, methodology, writing-review & editing; Elana R. Elkin conceptualization, formal analysis, methodology, writing-review & editing; Alla Karnovsky formal analysis, methodology, supervision, writing-review & editing; Justin Colacino formal analysis, methodology, supervision, writing-review & editing; Rita Karen Loch-Caruso conceptualization, funding acquisition, project administration, resources, supervision, writing-review & editing.
Supporting Information
The Supporting Information is available free of charge at https://pubs.acs.org/doi/10.1021/acs.chemrestox.3c00007.
Metabolite abundances, relative changes in metabolite abundances, summary of statistical results, relative changes in metabolite ratios, and additional KEGG pathways analyzed; metabolite abundance in BeWo cells exposed to DCVC during forskolin-stimulated syncytialization (Table S1); relative change in metabolite abundance in BeWo cells exposed to DCVC during forskolin-stimulated syncytialization (Table S2); summary of statistical findings using the statistical test with applied adjustment for the detection of multiple metabolites (multiple t-tests followed by Holm–Sidak adjustment with α set to 0.05) (Table S3); relative change of metabolite ratios in the purine and pyrimidine metabolism pathways in BeWo cells exposed to DCVC during forskolin-stimulated syncytialization (Table S4); relative change of metabolite ratios in the glycolysis, tricarboxylic acid cycle, and pentose phosphate pathways in BeWo cells exposed to DCVC during forskolin-stimulated syncytialization (Table S5); relative change of metabolite ratios in amino acid metabolism in BeWo cells exposed to DCVC during forskolin-stimulated syncytialization (Table S6); relative change of metabolite ratios in glutathione metabolism in BeWo cells exposed to DCVC during forskolin-stimulated syncytialization (Table S7); relative change of other important metabolite ratios analyzed in BeWo cells exposed to DCVC during forskolin-stimulated syncytialization (Table S8); pyrimidine metabolism as modified by syncytialization and DCVC treatment during syncytialization (Figure S1); glycolysis or gluconeogenesis as modified by syncytialization and DCVC treatment during syncytialization (Figure S2); tricarboxylic acid (TCA) cycle as modified by syncytialization and DCVC treatment during syncytialization (Figure S3); pentose phosphate pathway as modified by syncytialization and DCVC treatment during syncytialization (Figure S4); alanine, aspartate, and glutamate metabolism as modified by syncytialization and DCVC treatment during syncytialization (Figure S5); β-alanine metabolism and histidine metabolism as modified by syncytialization and DCVC treatment during syncytialization (Figure S6); arginine and proline metabolism as modified by syncytialization and DCVC treatment during syncytialization (Figure S7); phenylalanine metabolism as modified by syncytialization and DCVC treatment during syncytialization (Figure S8); glutathione (GSH) metabolism as modified by syncytialization or DCVC treatment during syncytialization (Figure S9); phosphocreatine shuttling as modified by syncytialization and DCVC treatment during syncytialization (Figure S10) (PDF)
Complete contact information is available at: https://pubs.acs.org/10.1021/acs.chemrestox.3c00007
The authors declare no competing financial interest.
REFERENCES
- (1).Wang R; Dang Y-L; Zheng R; Li Y; Li W; Lu X; Wang L-J; Zhu C; Lin H-Y; Wang H Live Cell Imaging of In Vitro Human Trophoblast Syncytialization1. Biol. Reprod 2014, 90, No. 117. [DOI] [PubMed] [Google Scholar]
- (2).Pötgens A; Schmitz U; Bose P; Versmold A; Kaufmann P; Frank H-G Mechanisms of Syncytial Fusion: A Review. Placenta 2002, 23, S107–S113. [DOI] [PubMed] [Google Scholar]
- (3).Wice B; Menton D; Geuze H; Schwartz AL Modulators of Cyclic AMP Metabolism Induce Syncytiotrophoblast Formation in Vitro. Exp. Cell Res 1990, 186, 306–16. [DOI] [PubMed] [Google Scholar]
- (4).Robbins JR; Skrzypczynska KM; Zeldovich VB; Kapidzic M; Bakardjiev AI Placental Syncytiotrophoblast Constitutes a Major Barrier to Vertical Transmission of Listeria Monocytogenes. PLoS Pathog 2010, 6, No. e1000732. [DOI] [PMC free article] [PubMed] [Google Scholar]
- (5).Cantle SJ; Kaufmann P; Luckhardt M; Schweikhart G Interpretation of Syncytial Sprouts and Bridges in the Human Placenta. Placenta 1987, 8, 2212–34. [DOI] [PubMed] [Google Scholar]
- (6).Pattillo RA; Gey GO The Establishment of a Cell Line of Human Hormone-Synthesizing Trophoblastic Cells in Vitro. Cancer Res 1968, 28, 1231–1236. [PubMed] [Google Scholar]
- (7).Daly JW Forskolin, Adenylate Cyclase, and Cell Physiology: An Overview. Adv. Cyclic Nucleotide Protein Phosphorylation Res 1984, 17, 81–89. [PubMed] [Google Scholar]
- (8).Al-Nasiry S; Spitz B; Hanssens M; Luyten C; Pijnenborg R Differential Effects of Inducers of Syncytialization and Apoptosis on BeWo and JEG-3 Choriocarcinoma Cells. Hum. Reprod 2006, 21, 193–201. [DOI] [PubMed] [Google Scholar]
- (9).Su AL; Loch-Caruso R Apoptotic Responses Stimulated by the Trichloroethylene Metabolite S-(1,2-Dichlorovinyl)-L-Cysteine Depend on Cell Differentiation State in BeWo Human Trophoblast Cells. Toxicol. In Vitro 2023, 86, No. 105514. [DOI] [PMC free article] [PubMed] [Google Scholar]
- (10).Inadera H; Tachibana S; Takasaki I; Tatematsu M; Shimomura A Hyperglycemia Perturbs Biochemical Networks in Human Trophoblast BeWo Cells. Endocr. J 2010, 57, 567–577. [DOI] [PubMed] [Google Scholar]
- (11).ATSDR. Toxicological Profile for Trichloroethylene (TCE); Agency for Toxic Substances and Disease Registry (ATSDR): Atlanta, GA, 2019. https://wwwn.cdc.gov/TSP/ToxProfiles/ToxProfiles.aspx?id=173&tid=30. [PubMed] [Google Scholar]
- (12).Rodenbeck SE; Sanderson LM; Rene A Maternal Exposure to Trichloroethylene in Drinking Water and Birth-Weight Outcomes. Arch. Environ. Health: Int. J 2000, 55, 188–194. [DOI] [PubMed] [Google Scholar]
- (13).Forand SP; Lewis-Michl EL; Gomez MI Adverse Birth Outcomes and Maternal Exposure to Trichloroethylene and Tetrachloroethylene through Soil Vapor Intrusion in New York State. Environ. Health Perspect 2012, 120, 616–621. [DOI] [PMC free article] [PubMed] [Google Scholar]
- (14).Ruckart PZ; Bove FJ; Maslia M Evaluation of Contaminated Drinking Water and Preterm Birth, Small for Gestational Age, and Birth Weight at Marine Corps Base Camp Lejeune, North Carolina: A Cross-Sectional Study. Environ. Health 2014, 13, No. 99. [DOI] [PMC free article] [PubMed] [Google Scholar]
- (15).Lash LH; Chiu WA; Guyton KZ; Rusyn I Trichloroethylene Biotransformation and Its Role in Mutagenicity, Carcinogenicity and Target Organ Toxicity. Mutat. Res., Rev. Mutat. Res 2014, 762, 22–36. [DOI] [PMC free article] [PubMed] [Google Scholar]
- (16).Graham CH; Hawley TS; Hawley RC; MacDougall JR; Kerbel RS; Khoo N; Lala PK Establishment and Characterization of First Trimester Human Trophoblast Cells with Extended Lifespan. Exp. Cell Res 1993, 206, 204–211. [DOI] [PubMed] [Google Scholar]
- (17).Hassan I; Kumar AM; Park H-R; Lash LH; Loch-Caruso R Reactive Oxygen Stimulation of Interleukin-6 Release in the Human Trophoblast Cell Line HTR-8/SVneo by the Trichlorethylene Metabolite S-(1,2-Dichloro)-L-Cysteine. Biol. Reprod 2016, 95, 66. [DOI] [PMC free article] [PubMed] [Google Scholar]
- (18).Elkin ER; Harris SM; Loch-Caruso R Trichloroethylene Metabolite S-(1,2-Dichlorovinyl)- l -Cysteine Induces Lipid Peroxidation-Associated Apoptosis via the Intrinsic and Extrinsic Apoptosis Pathways in a First-Trimester Placental Cell Line. Toxicol. Appl. Pharmacol 2018, 338, 30–42. [DOI] [PMC free article] [PubMed] [Google Scholar]
- (19).Elkin ER; Bridges D; Loch-Caruso R The Trichloroethylene Metabolite S-(1,2-Dichlorovinyl)-L-Cysteine Induces Progressive Mitochondrial Dysfunction in HTR-8/SVneo Trophoblasts. Toxicology 2019, 427, No. 152283. [DOI] [PMC free article] [PubMed] [Google Scholar]
- (20).Elkin ER; Bridges D; Harris SM; Loch-Caruso RK Exposure to Trichloroethylene Metabolite S -(1,2-Dichlorovinyl)-L-Cysteine Causes Compensatory Changes to Macronutrient Utilization and Energy Metabolism in Placental HTR-8/SVneo Cells. Chem. Res. Toxicol 2020, 33, 1339–1355. [DOI] [PMC free article] [PubMed] [Google Scholar]
- (21).Su AL; Harris SM; Elkin ER; Karnovsky A; Colacino JA; Loch-Caruso R Trichloroethylene Modifies Energy Metabolites in the Amniotic Fluid of Wistar Rats. Reprod. Toxicol 2022, 109, 80–92. [DOI] [PMC free article] [PubMed] [Google Scholar]
- (22).Su AL; Lash LH; Bergin IL; Bjork F; Loch-Caruso R N-Acetyl-L-Cysteine and Aminooxyacetic Acid Differentially Modulate Trichloroethylene Reproductive Toxicity via Metabolism in Wistar Rats. Arch. Toxicol 2021, 95, 1303–1321. [DOI] [PMC free article] [PubMed] [Google Scholar]
- (23).Loch-Caruso R; Hassan I; Harris SM; Kumar A; Bjork F; Lash LH Trichloroethylene Exposure in Mid-Pregnancy Decreased Fetal Weight and Increased Placental Markers of Oxidative Stress in Rats. Reprod. Toxicol 2019, 83, 38–45. [DOI] [PMC free article] [PubMed] [Google Scholar]
- (24).Elkin ER; Su AL; Kilburn BA; Bakulski KM; Armant DR; Loch-Caruso R Toxicity Assessments of Selected Trichloroethylene and Perchloroethylene Metabolites in Three in Vitro Human Placental Models. Reprod. Toxicol 2022, 109, 109–120. [DOI] [PMC free article] [PubMed] [Google Scholar]
- (25).Stonard MD; Parker VH 2-Oxoacid Dehydrogenases of Rat Liver Mitochondria as the Site of Action of S-(1,2 Dichlorovinyl)-l-Cysteine and S-(1,2 Dichlorovinyl)-3-Mercaptopropionic Acid. Biochem. Pharmacol 1971, 20, 2417–2427. [DOI] [PubMed] [Google Scholar]
- (26).Stonard MD; Parker VH The Metabolism of S-(1,2 Dichlorovinyl)-l-Cysteine by Rat Liver Mitochondria. Biochem. Pharmacol 1971, 20, 2429–2437. [DOI] [PubMed] [Google Scholar]
- (27).Stonard MD Further Studies on the Site and Mechanism of Action of S-(1,2 Dichlorovinyl)-l-Cysteine and s-(1,2 Dichlorovinyl)-3-Mercaptopropionic Acid in Rat Liver. Biochem. Pharmacol 1973, 22, 1329–1335. [DOI] [PubMed] [Google Scholar]
- (28).Lash LH; Anders MW Mechanism of S-(1,2-Dichlorovinyl)-L-Cysteine- and S-(1,2-Dichlorovinyl)-L-Homocysteine-Induced Renal Mitochondrial Toxicity. Mol. Pharmacol 1987, 32, 549–556. [PubMed] [Google Scholar]
- (29).Xu F; Papanayotou I; Putt DA; Wang J; Lash LH Role of Mitochondrial Dysfunction in Cellular Responses to S-(1,2-Dichlorovinyl)-l-Cysteine in Primary Cultures of Human Proximal Tubular Cells. Biochem. Pharmacol 2008, 76, 552–567. [DOI] [PMC free article] [PubMed] [Google Scholar]
- (30).van de Water B; Zoeteweij JP; de Bont HJ; Nagelkerke JF Inhibition of Succinate:Ubiquinone Reductase and Decrease of Ubiquinol in Nephrotoxic Cysteine S-Conjugate-Induced Oxidative Cell Injury. Mol. Pharmacol 1995, 48, 928–937. [PubMed] [Google Scholar]
- (31).Chen Y; Cai J; Anders MW; Stevens JL; Jones DP Role of Mitochondrial Dysfunction in S-(1,2-Dichlorovinyl)-l-Cysteine-Induced Apoptosis. Toxicol. Appl. Pharmacol 2001, 170, 172–180. [DOI] [PubMed] [Google Scholar]
- (32).Zheng R; Li Y; Sun H; Lu X; Sun B-F; Wang R; Cui L; Zhu C; Lin H-Y; Wang H Deep RNA Sequencing Analysis of Syncytialization-Related Genes during BeWo Cell Fusion. Reproduction 2017, 153, 35–48. [DOI] [PubMed] [Google Scholar]
- (33).Huppertz B; Frank H-G; Kingdom JCP; Reister F; Kaufmann P Villous Cytotrophoblast Regulation of the Syncytial Apoptotic Cascade in the Human Placenta. Histochem. Cell Biol 1998, 110, 495. [DOI] [PubMed] [Google Scholar]
- (34).Endo H; Okamoto A; Yamada K; Nikaido T; Tanaka T Frequent Apoptosis in Placental Villi from Pregnancies Complicated with Intrauterine Growth Restriction and without Maternal Symptoms. Int. J. Mol. Med 2005, 16, 79–84. [PubMed] [Google Scholar]
- (35).Huppertz B; Kadyrov M; Kingdom JCP Apoptosis and Its Role in the Trophoblast. Am. J. Obstet. Gynecol 2006, 195, 29–39. [DOI] [PubMed] [Google Scholar]
- (36).Sharp AN; Heazell AEP; Crocker IP; Mor G Placental Apoptosis in Health and Disease. Am. J. Reprod. Immunol 2010, 64, 159–169. [DOI] [PMC free article] [PubMed] [Google Scholar]
- (37).Hu R; Jin H; Zhou S; Yang P; Li X Proteomic Analysis of Hypoxia-Induced Responses in the Syncytialization of Human Placental Cell Line BeWo. Placenta 2007, 28, 399–407. [DOI] [PubMed] [Google Scholar]
- (38).Wu F; Tian F; Zeng W; Liu X; Fan J; Lin Y; Zhang Y Role of Peroxiredoxin2 Downregulation in Recurrent Miscarriage through Regulation of Trophoblast Proliferation and Apoptosis. Cell Death Dis 2017, 8, No. e2908. [DOI] [PMC free article] [PubMed] [Google Scholar]
- (39).Vargas A; Moreau J; Landry S; LeBellego F; Toufaily C; Rassart É; Lafond J; Barbeau B Syncytin-2 Plays an Important Role in the Fusion of Human Trophoblast Cells. J. Mol. Biol 2009, 392, 301–318. [DOI] [PubMed] [Google Scholar]
- (40).Gupta SK; Malhotra SS; Malik A; Verma S; Chaudhary P Cell Signaling Pathways Involved During Invasion and Syncytialization of Trophoblast Cells. Am. J. Reprod. Immunol 2016, 75, 361–371. [DOI] [PubMed] [Google Scholar]
- (41).Lorenz MA; Burant CF; Kennedy RT Reducing Time and Increasing Sensitivity in Sample Preparation for Adherent Mammalian Cell Metabolomics. Anal. Chem 2011, 83, 3406–3414. [DOI] [PMC free article] [PubMed] [Google Scholar]
- (42).Spaans F; de Vos P; Bakker WW; van Goor H; Faas MM Danger Signals From ATP and Adenosine in Pregnancy and Preeclampsia. Hypertension 2014, 63, 1154–1160. [DOI] [PubMed] [Google Scholar]
- (43).Sferruzzi-Perri AN; Higgins JS; Vaughan OR; Murray AJ; Fowden AL Placental Mitochondria Adapt Developmentally and in Response to Hypoxia to Support Fetal Growth. Proc. Natl. Acad. Sci. U.S.A 2019, 116, 1621–1626. [DOI] [PMC free article] [PubMed] [Google Scholar]
- (44).McKinney LL; Picken JC; Weakley FB; Eldridge AC; Campbell RE; Cowan JC; Biester HE Possible Toxic Factor of Trichloroethylene-Extracted Soybean Oil Meal 3. J. Am. Chem. Soc 1959, 81, 909–915. [Google Scholar]
- (45).Lash LH Identification of S-(1,2-Dichlorovinyl)Glutathione in the Blood of Human Volunteers Exposed to Trichloroethylene. J. Toxicol. Environ. Health, Part A 1999, 56, 1–21. [DOI] [PubMed] [Google Scholar]
- (46).Thonusin C; IglayReger HB; Soni T; Rothberg AE; Burant CF; Evans CR Evaluation of Intensity Drift Correction Strategies Using MetaboDrift, a Normalization Tool for Multi-Batch Metabolomics Data. J. Chromatogr. A 2017, 1523, 265–274. [DOI] [PMC free article] [PubMed] [Google Scholar]
- (47).Dunn WB; Broadhurst D; Begley P; Zelena E; Francis-McIntyre S; Anderson N; Brown M; Knowles JD; Halsall A; Haselden JN; Nicholls AW; Wilson ID; Kell DB; Goodacre R Procedures for Large-Scale Metabolic Profiling of Serum and Plasma Using Gas Chromatography and Liquid Chromatography Coupled to Mass Spectrometry. Nat. Protoc 2011, 6, 1060–1083. [DOI] [PubMed] [Google Scholar]
- (48).Chong J; Soufan O; Li C; Caraus I; Li S; Bourque G; Wishart DS; Xia J MetaboAnalyst 4.0: Towards More Transparent and Integrative Metabolomics Analysis. Nucleic Acids Res 2018, 46, W486–W494. [DOI] [PMC free article] [PubMed] [Google Scholar]
- (49).Chong J; Wishart DS; Xia J Using MetaboAnalyst 4.0 for Comprehensive and Integrative Metabolomics Data Analysis. Curr. Protoc. Bioinf 2019, 68, No. e86. [DOI] [PubMed] [Google Scholar]
- (50).Yamaguchi T; Nakamura H; Kihara Y; Taguchi M; Yoshikawa H; Otsuki M Long-Term Overexpression of Membrane Type-1 Matrix Metalloproteinase and Matrix Metalloproteinase-2 in Oleic Acid–Induced Pancreatitis in Rats. Pancreas 2002, 24, 348–356. [DOI] [PubMed] [Google Scholar]
- (51).Soto-Guzman A; Navarro-Tito N; Castro-Sanchez L; Martinez-Orozco R; Salazar EP Oleic Acid Promotes MMP-9 Secretion and Invasion in Breast Cancer Cells. Clin. Exp. Metastasis 2010, 27, 505–515. [DOI] [PubMed] [Google Scholar]
- (52).Novak D; Quiggle F; Haafiz A Impact of Forskolin and Amino Acid Depletion upon System A Activity and SNAT Expression in BeWo Cells. Biochimie 2006, 88, 39–44. [DOI] [PubMed] [Google Scholar]
- (53).Wright BE; Anderson ML Biochemical Differentiation in the Slime Mold. Biochim. Biophys. Acta 1959, 31, 310–322. [DOI] [PubMed] [Google Scholar]
- (54).Liddel GU; Wright BE The Effect of Glucose on Respiration of the Differentiating Slime Mold. Dev. Biol 1961, 3, 265–276. [DOI] [PubMed] [Google Scholar]
- (55).Colvin BN; Longtine MS; Chen B; Costa ML; Nelson DM Oleate Attenuates Palmitate-Induced Endoplasmic Reticulum Stress and Apoptosis in Placental Trophoblasts. Reproduction 2017, 153, 369–380. [DOI] [PubMed] [Google Scholar]
- (56).Wu G; Bazer FW; Datta S; Johnson GA; Li P; Satterfield MC; Spencer TE Proline Metabolism in the Conceptus: Implications for Fetal Growth and Development. Amino Acids 2008, 35, 691–702. [DOI] [PubMed] [Google Scholar]
- (57).Wu G; Bazer FW; Hu J; Johnson GA; Spencer TE Polyamine Synthesis from Proline in the Developing Porcine Placenta1. Biol. Reprod 2005, 72, 842–850. [DOI] [PubMed] [Google Scholar]
- (58).Kawasaki K; Kondoh E; Chigusa Y; Kawamura Y; Mogami H; Takeda S; Horie A; Baba T; Matsumura N; Mandai M; Konishi I Metabolomic Profiles of Placenta in Preeclampsia. Hypertension 2019, 73, 671–679. [DOI] [PubMed] [Google Scholar]
- (59).Hoeltzli SD; Kelley LK; Moe AJ; Smith CH Anionic Amino Acid Transport Systems in Isolated Basal Plasma Membrane of Human Placenta. Am. J. Physiol.: Cell Physiol 1990, 259, C47–C55. [DOI] [PubMed] [Google Scholar]
- (60).Nair KG Purification and Properties of 3′,5′-Cyclic Nucleotide Phosphodiesterase from Dog Heart*. Biochemistry 1966, 5, 150–157. [DOI] [PubMed] [Google Scholar]
- (61).Fischer U; Amrhein N Cyclic Nucleotide Phosphodiesterase of Chlamydomonas Reinhardtii. Biochim. Biophys. Acta, Enzymol 1974, 341, 412–420. [DOI] [PubMed] [Google Scholar]
- (62).Faas MM; van der Schaaf G; Borghuis T; Jongman RM; van Pampus MG; de Vos P; van Goor H; Bakker WW Extracellular ATP Induces Albuminuria in Pregnant Rats. Nephrol., Dial., Transplant 2010, 25, 2468–2478. [DOI] [PubMed] [Google Scholar]
- (63).Ren W; Luo W; Wu M; Liu G; Yu X; Fang J; Li T; Yin Y; Wu G Dietary L-Glutamine Supplementation Improves Pregnancy Outcome in Mice Infected with Type-2 Porcine Circovirus. Amino Acids 2013, 45, 479–488. [DOI] [PubMed] [Google Scholar]
- (64).Wu X; Xie C; Zhang Y; Fan Z; Yin Y; Blachier F Glutamate–Glutamine Cycle and Exchange in the Placenta–Fetus Unit during Late Pregnancy. Amino Acids 2015, 47, 45–53. [DOI] [PubMed] [Google Scholar]
- (65).Sawant OB; Ramadoss J; Hankins GD; Wu G; Washburn SE Effects of L-Glutamine Supplementation on Maternal and Fetal Hemodynamics in Gestating Ewes Exposed to Alcohol. Amino Acids 2014, 46, 1981–1996. [DOI] [PMC free article] [PubMed] [Google Scholar]
- (66).Metzger BE; Hare JW; Freinkel N Carbohydrate Metabolism in Pregnancy IX: Plasma Levels of Gluconeogenic Fuels during Fasting in the Rat1. J. Clin. Endocrinol. Metab 1971, 33, 869–872. [DOI] [PubMed] [Google Scholar]
- (67).Holt A; Wold F The Isolation and Characterization of Rabbit Muscle Enolase. J. Biol. Chem 1961, 236, 3227–3231. [PubMed] [Google Scholar]
- (68).Bar-Even A; Flamholz A; Noor E; Milo R Rethinking Glycolysis: On the Biochemical Logic of Metabolic Pathways. Nat. Chem. Biol 2012, 8, 509–517. [DOI] [PubMed] [Google Scholar]
- (69).Chang H-C; Lane MD The Enzymatic Carboxylation of Phosphoenolpyruvate. II. Purification and Properties of Liver Mitochondrial Phosphoenolpyruvate Carboxykinase. J. Biol. Chem 1966, 241, 2413–2420. [PubMed] [Google Scholar]
- (70).Bridger WA 18. Succinyl-Coa Synthetase. Protein Synthesis DNA Synthesis and Repair RNA Synthesis Energy-Linked ATPases Synthetases; Elsevier B.V., 1974; pp 581–606. [Google Scholar]
- (71).Phillips D; Aponte AM; French SA; Chess DJ; Balaban RS Succinyl-CoA Synthetase Is a Phosphate Target for the Activation of Mitochondrial Metabolism. Biochemistry 2009, 48, 7140–7149. [DOI] [PMC free article] [PubMed] [Google Scholar]
- (72).Plaut GW; Sung SC Diphosphopyridine Nucleotide Isocitric Dehydrogenase from Animal Tissues. J. Biol. Chem 1954, 207, 305–314. [PubMed] [Google Scholar]
- (73).Kerscher L; Oesterhelt D Purification and Properties of Two 2-Oxoacid:Ferredoxin Oxidoreductases from Halobacterium Halobium. Eur. J. Biochem 1981, 116, 587–594. [DOI] [PubMed] [Google Scholar]
- (74).Kerscher L; Oesterhelt D The Catalytic Mechanism of 2-Oxoacid: Ferredoxin Oxidoreductases from Halobacterium Halobium. One-Electron Transfer at Two Distinct Steps of the Catalytic Cycle. Eur. J. Biochem 1981, 116, 595–600. [DOI] [PubMed] [Google Scholar]
- (75).Dickens F; Glock GE Direct Oxidation of Glucose-6-Phosphate, 6-Phosphogluconate and Pentose-5-Phosphates by Enzymes of Animal Origin. Biochem. J 1951, 50, 81–95. [DOI] [PMC free article] [PubMed] [Google Scholar]
- (76).Yoon H; Anderson CD; Anderson BM Kinetic Studies of Haemophilus Influenzae 6-Phosphogluconate Dehydrogenase. Biochim. Biophys. Acta, Protein Struct. Mol. Enzymol 1989, 994, 75–80. [DOI] [PubMed] [Google Scholar]
- (77).Dickens F; Williamson DH Pentose Phosphate Isomerase and Epimerase from Animal Tissues. Biochem. J 1956, 64, 567–578. [DOI] [PMC free article] [PubMed] [Google Scholar]
- (78).Zeng X; Wang F; Fan X; Yang W; Zhou B; Li P; Yin Y; Wu G; Wang J Dietary Arginine Supplementation during Early Pregnancy Enhances Embryonic Survival in Rats. J. Nutr 2008, 138, 1421–1425. [DOI] [PubMed] [Google Scholar]
- (79).Aouache R; Biquard L; Vaiman D; Miralles F Oxidative Stress in Preeclampsia and Placental Diseases. Int. J. Mol. Sci 2018, 19, No. 1496. [DOI] [PMC free article] [PubMed] [Google Scholar]
- (80).Newburg DS; Fillios LC A Requirement for Dietary Asparagine in Pregnant Rats. J. Nutr 1979, 109, 2190–2197. [DOI] [PubMed] [Google Scholar]
- (81).Bahado-Singh RO; Akolekar R; Mandal R; Dong E; Xia J; Kruger M; Wishart DS; Nicolaides K Metabolomics and First-Trimester Prediction of Early-Onset Preeclampsia. J. Matern.-Fetal Neonat. Med 2012, 25, 1840–1847. [DOI] [PubMed] [Google Scholar]
- (82).Bahado-Singh RO; Syngelaki A; Akolekar R; Mandal R; Bjondahl TC; Han B; Dong E; Bauer S; Alpay-Savasan Z; Graham S; Turkoglu O; Wishart DS; Nicolaides KH Validation of Metabolomic Models for Prediction of Early-Onset Preeclampsia. Am. J. Obstet. Gynecol 2015, 213, 530.e1–530.e10. [DOI] [PubMed] [Google Scholar]
- (83).Allen RG; Newton RK; Sohal RS; Shipley GL; Nations C Alterations in Superoxide Dismutase, Glutathione, and Peroxides in the Plasmodial Slime Mold Physarum Polycephalum during Differentiation. J. Cell. Physiol 1985, 125, 413–419. [DOI] [PubMed] [Google Scholar]
- (84).Worthington DJ; Rosemeyer MA Glutathione Reductase from Human Erythrocytes. Catalytic Properties and Aggregation. Eur. J. Biochem 1976, 67, 231–238. [DOI] [PubMed] [Google Scholar]
- (85).Böhme CC; Arscott LD; Becker K; Schirmer RH; Williams CH Kinetic Characterization of Glutathione Reductase from the Malarial Parasite Plasmodium Falciparum. J. Biol. Chem 2000, 275, 37317–37323. [DOI] [PubMed] [Google Scholar]
- (86).Palei ACT; Sandrim VC; Amaral LM; Machado JSR; Cavalli RC; Duarte G; Tanus-Santos JE Association between Matrix Metalloproteinase (MMP)-2 Polymorphisms and MMP-2 Levels in Hypertensive Disorders of Pregnancy. Exp. Mol. Pathol 2012, 92, 217–221. [DOI] [PubMed] [Google Scholar]
- (87).Nissi R; Talvensaari-Mattila A; Kotila V; Niinimäki M; Järvelä I; Turpeenniemi-Hujanen T Circulating Matrix Metalloproteinase MMP-9 and MMP-2/TIMP-2 Complex Are Associated with Spontaneous Early Pregnancy Failure. Reprod. Biol. Endocrinol 2013, 11, No. 2. [DOI] [PMC free article] [PubMed] [Google Scholar]
- (88).Sawicki G; Radomski MW; Winkler-Lowen B; Krzymien A; Guilbert LJ Polarized Release of Matrix Metalloproteinase-2 and -9 from Cultured Human Placental Syncytiotrophoblasts. Biol. Reprod 2000, 63, 1390–1395. [DOI] [PubMed] [Google Scholar]
- (89).Xu P; Alfaidy N; Challis JRG Expression of Matrix Metalloproteinase (MMP)-2 and MMP-9 in Human Placenta and Fetal Membranes in Relation to Preterm and Term Labor. J. Clin. Endocrinol. Metab 2002, 87, 1353–1361. [DOI] [PubMed] [Google Scholar]
- (90).Li K; Tay FR; Yiu CKY The Past, Present and Future Perspectives of Matrix Metalloproteinase Inhibitors. Pharmacol. Ther 2020, 207, No. 107465. [DOI] [PubMed] [Google Scholar]
- (91).Chan S-H; Chu P-M; Kao C-L; Cheng Y-H; Hung C-H; Tsai K-L Oleic Acid Activates MMPs Up-Regulation through SIRT1/PPAR-γ Inhibition: A Probable Linkage between Obesity and Coronary Arterial Disease. J. Biochem 2016, 160, 217–225. [DOI] [PubMed] [Google Scholar]
- (92).Wang Y; Zhang Y; Wu Y; He Y; Xiang J; Huang J; Lash GE; Li P SIRT1 Regulates Trophoblast Senescence in Premature Placental Aging in Preeclampsia. Placenta 2022, 122, 56–65. [DOI] [PubMed] [Google Scholar]
- (93).Um T-Y; Lee S-A; Park J-H; Shin J-M; Park I-H; Lee H-M Role of Adenosine Monophosphate-Activated Protein Kinase on Cell Migration, Matrix Contraction, and Matrix Metalloproteinase-1 and Matrix Metalloproteinase-2 Production in Nasal Polyp–Derived Fibroblasts. Am. J. Rhinol. Allergy 2017, 31, 357–363. [DOI] [PubMed] [Google Scholar]
Associated Data
This section collects any data citations, data availability statements, or supplementary materials included in this article.