Abstract
The B cell antigen receptor (BCR) is composed of a membrane-bound class M, D, G, E or A immunoglobulin for antigen recognition1-3 and a disulfide-linked Igα (also known as CD79A) and Igβ (also known as CD79B) heterodimer (Igα/β) that functions as the signalling entity through intracellular immunoreceptor tyrosine-based activation motifs (ITAMs)4,5. The organizing principle of the BCR remains unknown. Here we report cryo-electron microscopy structures of mouse full-length IgM BCR and its Fab-deleted form. At the ectodomain (ECD), the Igα/β heterodimer mainly uses Igα to associate with Cμ3 and Cμ4 domains of one heavy chain (μHC) while leaving the other heavy chain (μHC′) unbound. The transmembrane domain (TMD) helices of μHC and μHC′ interact with those of the Igα/β heterodimer to form a tight four-helix bundle. The asymmetry at the TMD prevents the recruitment of two Igα/β heterodimers. Notably, the connecting peptide between the ECD and TMD of μHC intervenes in between those of Igα and Igβ to guide TMD assembly through charge complementarity. Weaker but distinct density for the Igβ ITAM nestles next to the TMD, suggesting potential autoinhibition of ITAM phosphorylation. Interfacial analyses suggest that all BCR classes utilize a general organizational architecture. Our studies provide a structural platform for understanding B cell signalling and designing rational therapies against BCR-mediated diseases.
B cells can recognize structurally diverse antigens, and their antigen receptors play important roles in B cell development and activation. Upon antigen recognition, B cells can be activated and differentiated into plasma cells that secrete antibodies to neutralize the antigens6-8. Antigen is bound by membrane-bound immunoglobulin (mIg) as part of the BCR on the B cell surface, as well as by secreted immunoglobulin (sIg or antibody), forms that differ only at the C-terminal end as a result of alternative mRNA processing9,10. The different classes or isotypes of mIg and sIg–IgM (μ), IgD (δ), IgG (γ), IgE (ε) and IgA (α)–have different constant regions1-3. IgM is the first isotype expressed on all immature and naive mature B cells11-13. Similar to the basic architecture of an antibody, mIg comprises a symmetric homodimer of a heterodimer of light chain and membrane-bound heavy chain. The BCR signalling components Igα and Igβ each carry an ITAM at their cytosolic tails14-16. Upon antigen recognition, these motifs are phosphorylated by lymphocyte-specific tyrosine kinases, mediating the recruitment of intracellular cofactors to execute the downstream biological effects. In this study, we determined the structural organization of mouse IgM BCR, revealing an implicated mechanism for ITAM autoinhibition.
Structure determination of the IgM BCR
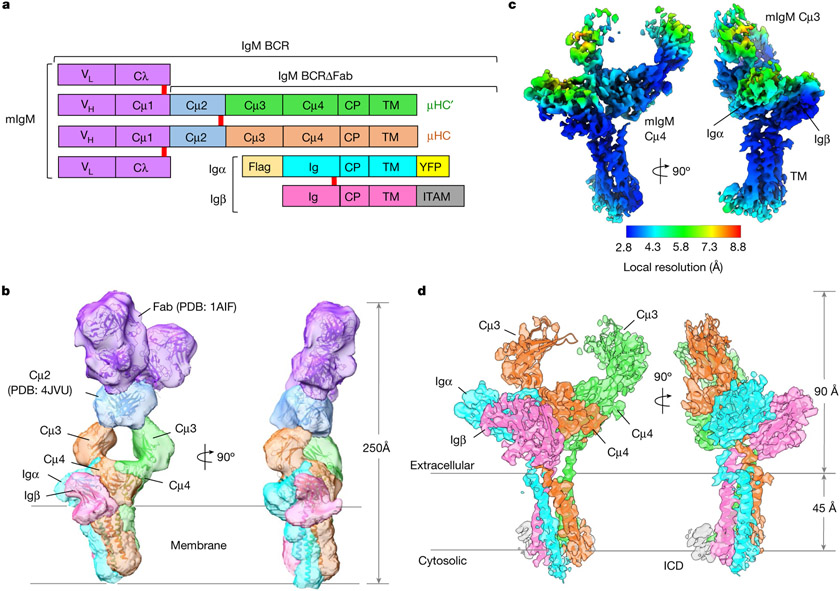
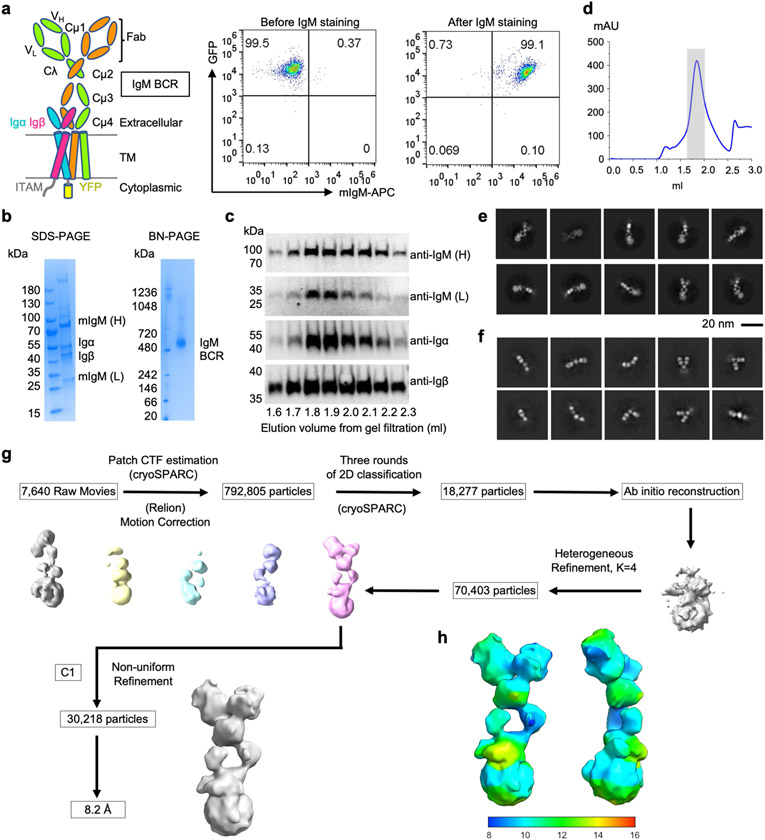
To determine the cryo-electron microscopy (cryo-EM) structure of a BCR, we engineered the mouse myeloma cell line J558L to stably co-express the mIgM heavy chain and a Flag-tagged Igα–YFP fusion, together with endogenous immunoglobulin λ light chain and Igβ (Fig. 1a and Extended Data Fig. 1a). We purified the full-length IgM BCR by anti-Flag affinity and gel filtration chromatography, showing the co-expression of the individual components by SDS–PAGE (Extended Data Fig. 1b-d and Supplementary Fig. 1). Two-dimensional classification (Extended Data Fig. 1e,f) of the cryo-EM data showed large-scale conformational changes at the Fab region owing to the known flexibility at the mIg hinge region17-20. The cryo-EM analysis produced a density map with 8.2 Å resolution (Fig. 1b and Extended Data Fig. 1g,h).
Fig. 1 ∣. Cryo-EM maps of the IgM BCR.
a, Domain organization of the IgM BCR. Disulfide bonds are shown as red rectangles. mIgM heavy chains μHC and μHC′ are proximal and distal to the Igα/β heterodimer, respectively. CP: connecting peptide. b, Cryo-EM map of full-length IgM BCR at 8.2 Å resolution (contour level: 0.5σ) superimposed with the model. c, Local resolution distribution of the IgM BCRΔFab map at 3.3 Å resolution (contour level: 4.0σ). d, Cryo-EM map of IgM BCRΔFab (contour level: 4.0σ) superimposed with the model. The Igβ ICD density is shown in grey.
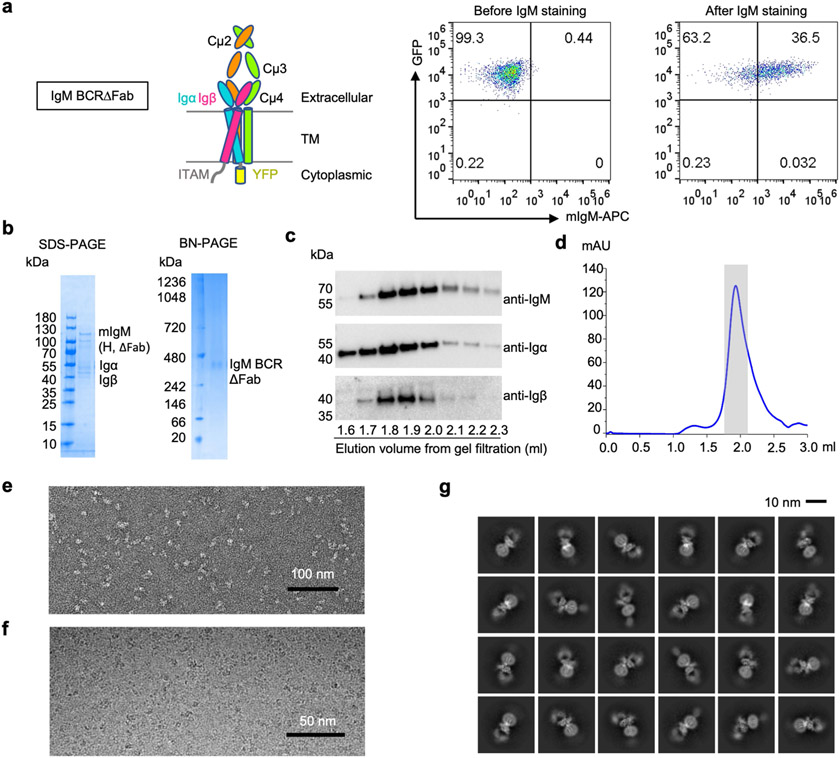
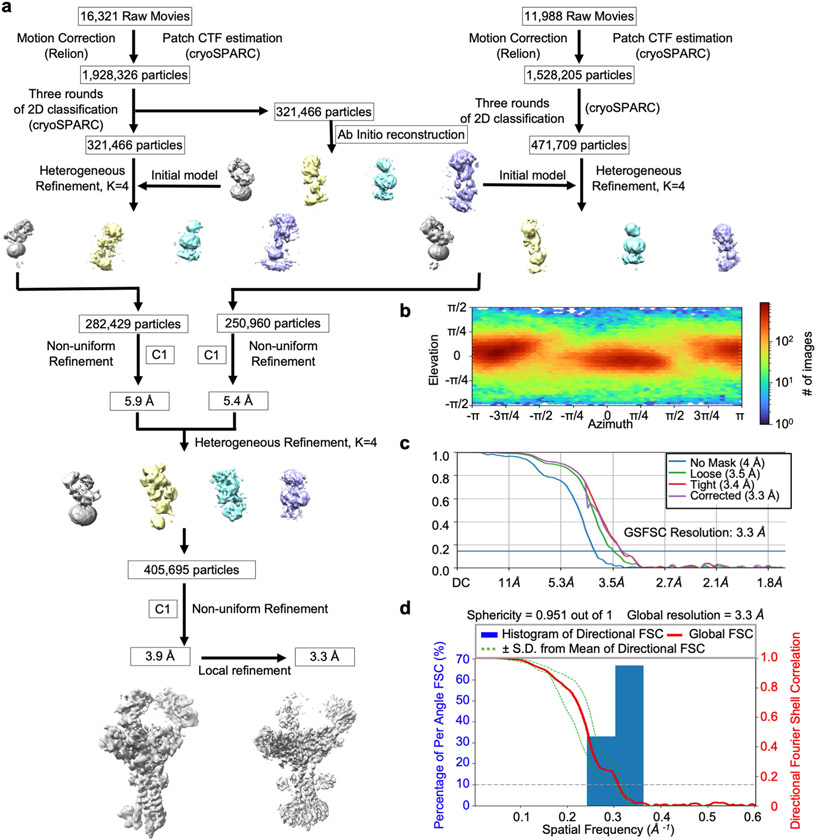
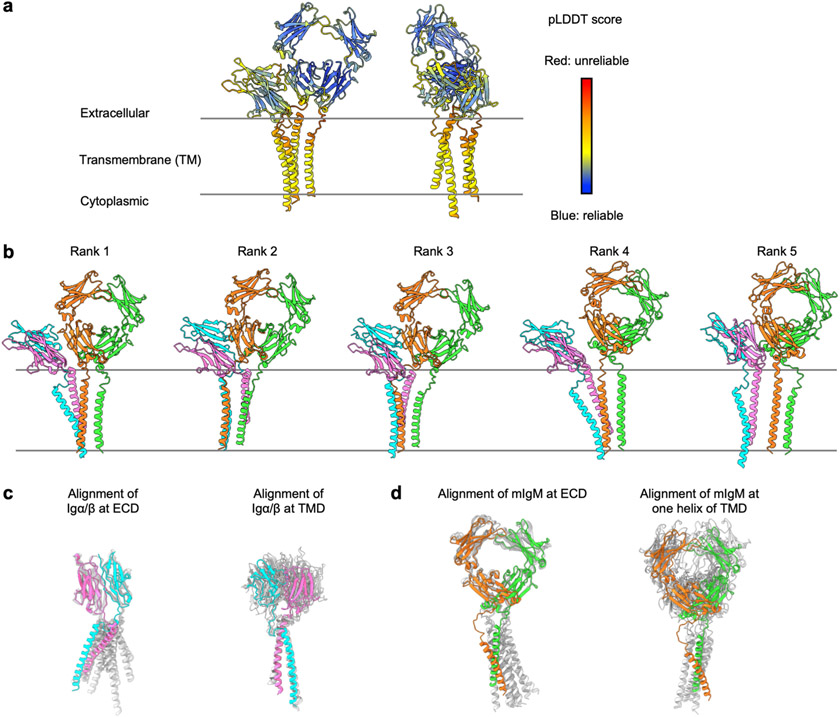
To optimize the overall resolution of the BCR structure, we modified the cell line to express a truncated mIgM lacking the two Fab arms (BCRΔFab), and purified it using the same procedure as for the BCR (Extended Data Fig. 2a-d and Supplementary Fig. 2). Two-dimensional classification of the cryo-EM data revealed clearer structural features at both the ECD and the TMD compared with the full-length BCR structure (Extended Data Fig. 2e-g). After 3D classification and focused refinement, a homogeneous dataset of around 400,000 particles produced a final map at an overall resolution of 3.3 Å, with best densities at Cμ4, the TMD bundle and part of Igα and Igβ (Fig. 1c, Extended Data Fig. 3 and Extended Data Table 1). We used AlphaFold running on ColabFold notebook21,22 to assist with model generation (Extended Data Fig. 4) and density fitting (Extended Data Fig. 5). The final model of BCRΔFab includes regions of mIgM from Cμ3 to the TMD and regions of the Igα/β heterodimer up to the TMD (Fig. 1d). Fitting of the BCRΔFab structure together with the crystal structures of Fab and Cμ2 domains23,24 into the density led to the model of full-length IgM BCR (Fig. 1b), and shows that the Fab deletion did not alter the overall structure of the BCR.
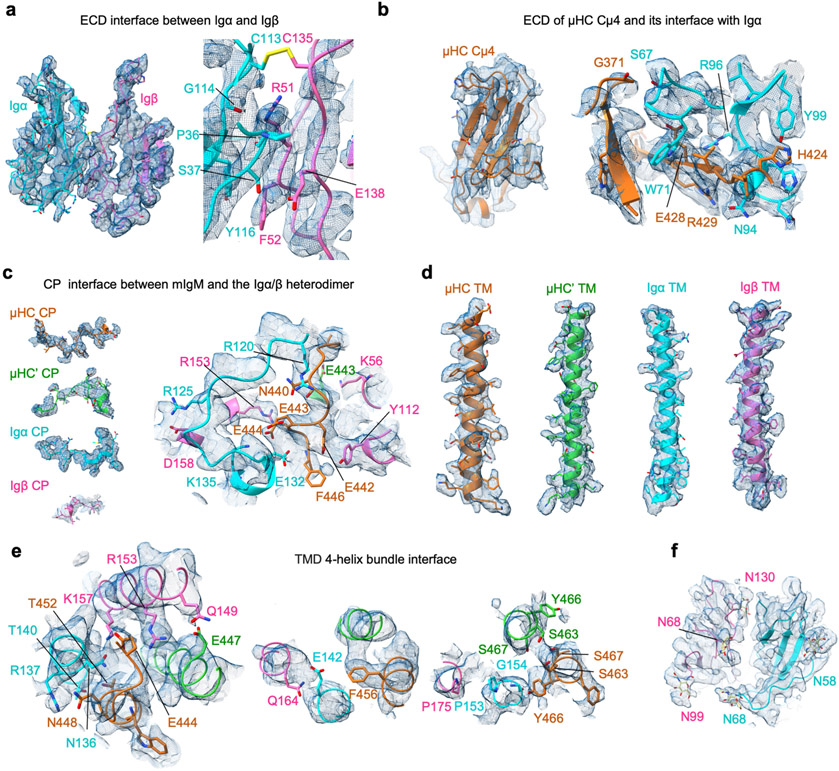
The linkers between the ECD and the TMD in mIgM, Igα and Igβ turned out to be important for the organization of the BCR, and we named these the connecting peptides (CPs), following the domain nomenclature used to describe the T cell antigen receptor25 (TCR). In addition, the 3.3 Å map, as well as an intermediate 3.9 Å map (Extended Data Fig. 3a) also revealed density that we assigned as the ITAM-containing intracellular domain (ICD) of Igβ. Most, but not all side chain densities of the IgM BCRΔFab are well defined (Extended Data Fig. 5). In particular, the disulfide bond between Igα and Igβ has little density, suggesting that the bond has been cleaved by radiation damage during cryo-EM data collection; the sensitivity of disulfide bonds to electron beam damage has been observed previously26.
The ECD interaction within Igα/β
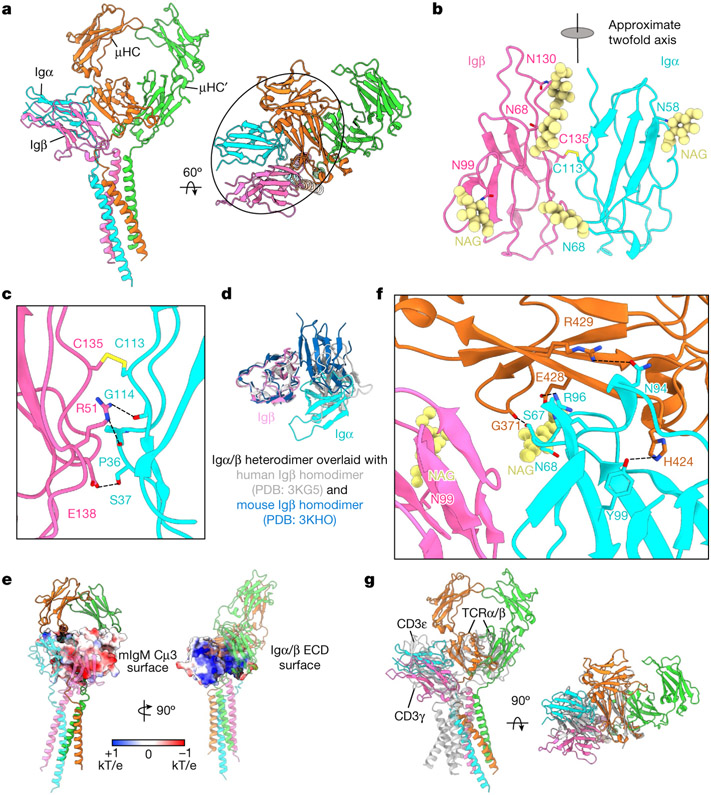
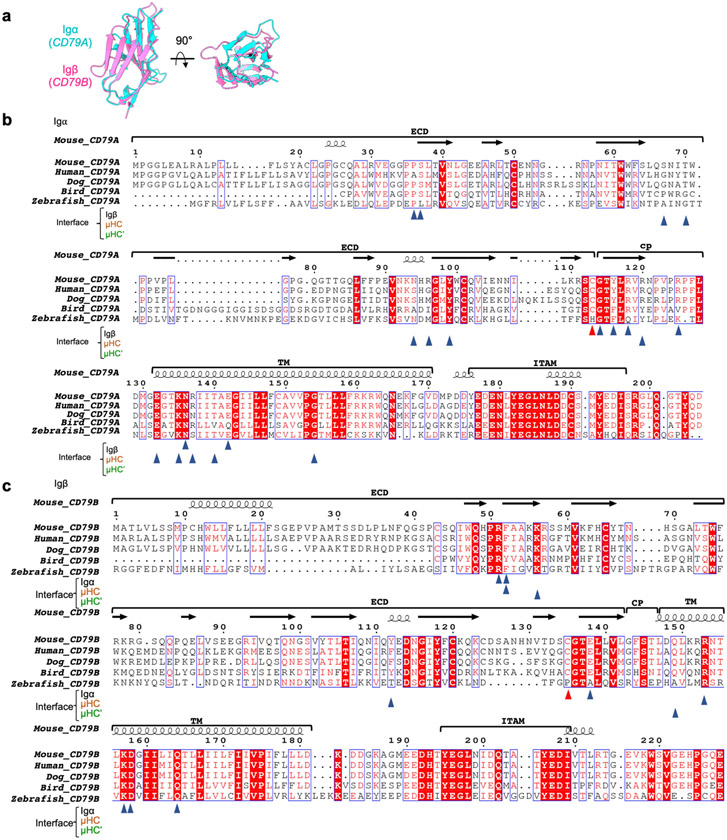
Igα and Igβ ECDs both assume an immunglobulin fold and interact with each other with their β-sandwich domains roughly in parallel (Fig. 2a). Despite the low sequence identity (22%), Igα and Igβ are highly similar in structure, with root mean square deviation of 3.2 Å (Extended Data Fig. 6a). They are related by an approximate two-fold axis (166° in rotation) and linked by a disulfide bond at the interface between two equivalent residues, Igα C113 and Igβ C135 (Fig. 2b,c), which is consistent with a previous prediction27. There are five glycosylation sites on Igα and Igβ, all of which have cryo-EM densities for the first N-acetylglucosamine (NAG) residue in their N-linked glycans (Fig. 2b and Extended Data Fig. 5f). Notably, the glycan on N68 of Igα situates at the interface between Igα, Igβ and mIg, but it is unclear whether it has a role in the assembly of the BCR.
Fig. 2 ∣. ECD Interactions between the Igα/β heterodimer and mIgM.
a, Ribbon diagrams of the IgM BCRΔFab model in different views, with the ECD interactions circled. b, Ribbon diagram of the immunglobulin domains of the Igα/β heterodimer. The intersubunit disulfide bond between Igα C113 and Igβ C135 and the observed N-linked glycans are shown. The immunglobulin domains of Igα and Igβ are related by an approximate twofold axis. c, Detailed interfacial interactions between Igα and Igβ. d, Alignment of the immunglobulin domains of the Igα/β heterodimer with two different crystal structures of the Igβ homodimer, showing marked differences. e, Electrostatic surfaces (−1 to +1 kT/e) of the interacting Cμ4 (left) and the immunglobulin domains of the Igα/β heterodimer (right). f, Detailed interactions between ECD residues of the Igα/β heterodimer and the mIgM molecule. g, Alignment of the Cμ4 domain of IgM BCR with the TCRβ constant domain (grey), showing that the immunglobulin domains of the Igα/β and CD3ε–CD3γ (grey, PDB: 6JXR) heterodimers occupy the similar location relative to mIgM and TCRαβ, respectively.
Igα and Igβ interact extensively at the ECD with a buried surface area of around 500 Å2 each as calculated on the PDBePISA server28. Hydrogen bonds are present between Igβ R51 and the carbonyl oxygen atoms of Igα P36 and G114, and between Igβ E138 and Igα S37 (Fig. 2c and Extended Data Fig. 5a). Of note, the packing of the Igα/β heterodimer is distinct from structures of Igβ–Igβ homodimers, which are also linked by the analogous disulfide bond at Igβ C13527 (Fig. 2d). Residues at the interface between Igα and Igβ are largely conserved across species (Extended Data Fig. 6b,c), suggesting an evolutionarily conserved interaction.
The ECD interaction of Igα/β and mIgM
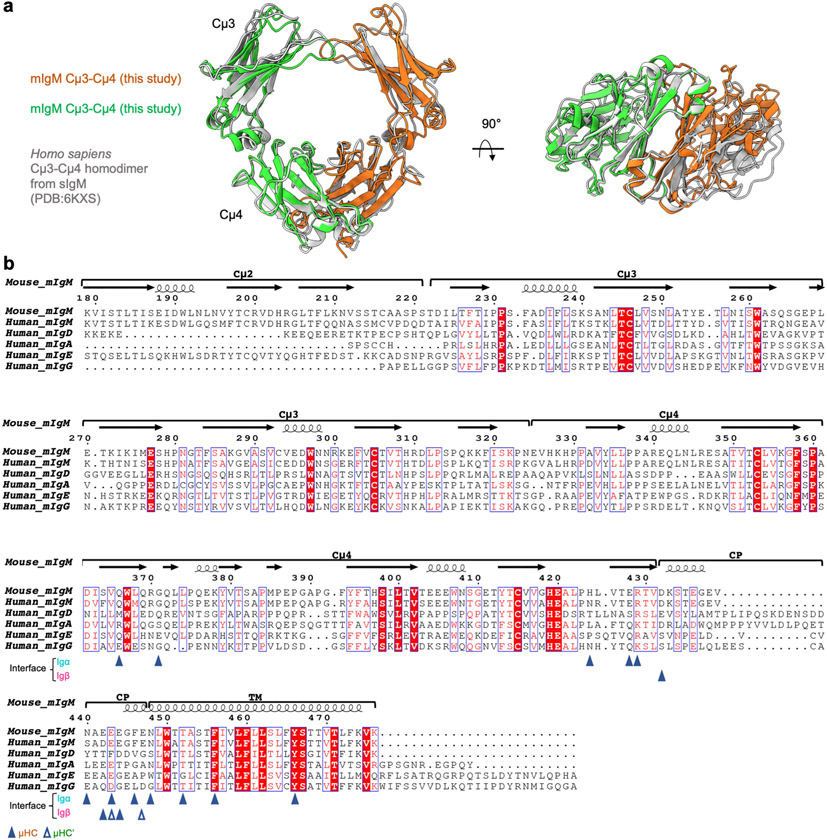
The Igα/β ECD interacts with the ring-shaped and symmetric Cμ3–Cμ4 dimer of mIgM predominantly on one side, creating an asymmetry in the BCR with μHC proximal and μHC′ distal to Igα/β (Fig. 2a). In this interaction, Igα contributes approximately 830 Å2 buried surface area, whereas Igβ contributes approximately 90 Å2. Most of the contacts are with the Cμ4 domain of μHC with around 750 Å2 buried surface area, in contrast to 170 Å2 at Cμ3 (Fig. 2a). The symmetric Cμ3–Cμ4 homodimer aligns well with the cryo-EM structure of sIgM in this region29,30 (Extended Data Fig. 7a). The mutual interaction between the Igα/β heterodimer and mIgM has an electrostatic component, shown by the largely negatively charged surface of the Cμ4 dimer and the largely positively charged surface of the Igα/β complex (Fig. 2e). In particular, Cμ4 E428 forms an ionic pair with Igα R96 (Fig. 2f). Hydrogen bonds are also present between Cμ4 H424 and Igα Y99, between Cμ4 R429 and Igα N94, and between the Cμ4 G371 carbonyl oxygen atom and Igα S67 (Fig. 2f and Extended Data Fig. 5b). When the TCRβ constant immunglobulin domain of the TCR25,31 is aligned with the Cμ4 domain of μHC, the CD3ε–CD3γ signalling component of the TCR is situated at the same region as the Igα/β heterodimer, but the TMD arrangements of the two receptors are different (Fig. 2g).
Sequence alignment of the ECDs of different mIg isotypes shows that the key residues involved in the interactions with the Igα/β heterodimer are poorly conserved (Extended Data Fig. 7b). In line with this observation, the isolated ECD of the Igα/β heterodimer binds strongly to a soluble Cμ3–Cμ4 construct of mIgM but barely to analogous constructs from the other isotypes27. However, as all mIg isotypes interact with the Igα/β heterodimer, their TMDs may have a dominant role in the assembly of the different BCR isotypes.
The CP interaction of mIgM and Igα/β
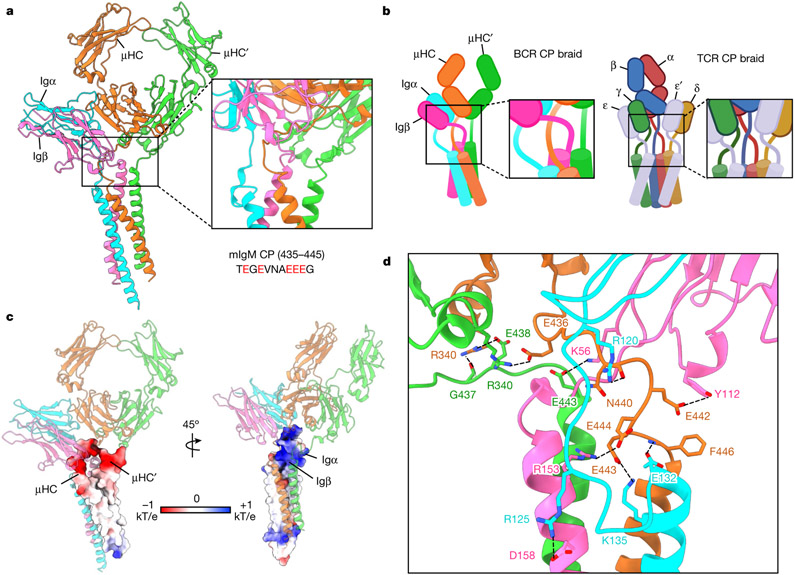
The BCR structure shows that the CPs of μHC, μHC′, Igα and Igβ intertwine in a braid-like manner as they connect to the TMD, and may have important roles in the specificity and energetics of BCR assembly (Fig. 3a). There is an apparent crossover by the CPs of Igα and Igβ, resulting in switching of the positions of their ECDs and TMDs (Fig. 3a,b). Of note, similar ECD-to-TMD crossovers are features of all TCR components, including the CD3ε–CD3γ, CD3ε′–CD3δ and TCRαβ complexes25,31 (Fig. 3b). However, unlike in the TCRαβ complex, the ECDs and TMDs of μHC and μHC′ do not switch positions (Fig. 3a,b). The CP of μHC interacts extensively with Igα/β by intervening between the CPs of Igα and Igβ, whereas the CP of μHC′ interacts only on the outer sides of the CP of Igβ and Cμ4 domain of μHC (Fig. 3b).
Fig. 3 ∣. CP interactions between the Igα/β heterodimer and mIgM.
a, Global view (left) and enlarged view (right) of the CP region of IgM BCR, showing the intertwining in this region. The sequence of mouse mIgM CP (435–445) is shown with acidic residues in red. b, Schematic diagrams for the CP assembly of BCR (left) and TCR (right). c, Electrostatic surfaces (−1 to +1 kT/e) at the CPs of mIgM (left) and the CPs of Igα and Igβ (right). d, Detailed interactions between the charged CP residues of the Igα/β heterodimer and mIgM.
The mIgM CP contains a string of acidic residues (Fig. 3a) and displays strong negative electrostatic potential (Fig. 3c). By contrast, the surrounding region from Igα and Igβ, including the CP of Igα is highly positively charged (Fig. 3c). For the CP of μHC, specific salt bridge or hydrogen-bonding interactions may include E436 with μHC′ R340, E442 with Igβ Y112, E443 with Igα K135, and E444 with Igβ R153 (Fig. 3d). For the CP of μHC′, E438 and the carbonyl oxygen of G437 form specific interactions with μHC R340, and E443 mediates a hydrogen bond with Igβ K56 (Fig. 3d). For the CP of Igα, hydrogen bonds are present between R120 and μHC N440, between R125 and Igβ D158, and between E132 and the amide nitrogen of μHC F446 (Fig. 3d and Extended Data Fig. 5c). Collectively, these data suggest that the CPs braid together largely through electrostatic interactions, and that they may be crucial for guiding the assembly of the four-helix bundle in the TMD.
Sequence alignment showed that the CP residues of mIg involved in interaction with Igα and Igβ are less conserved among different isotypes (Extended Data Fig. 7b), which may indicate a diverse role of the CP in BCR assembly. In addition, the CPs of mIg isotypes differ in their lengths. For example, the CP of mIgD contains eight additional residues, and this may be related to the higher stability of the IgD BCR complex compared with the IgM BCR32.
Assembly of the TMD four-helix bundle
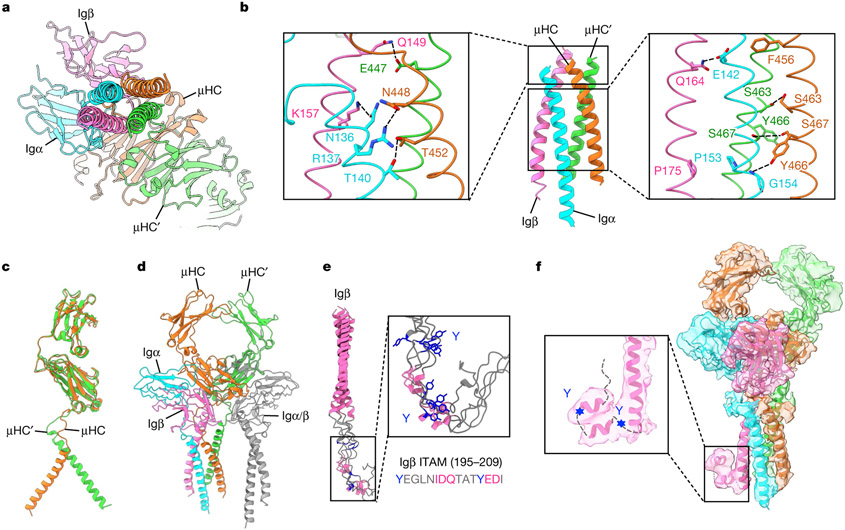
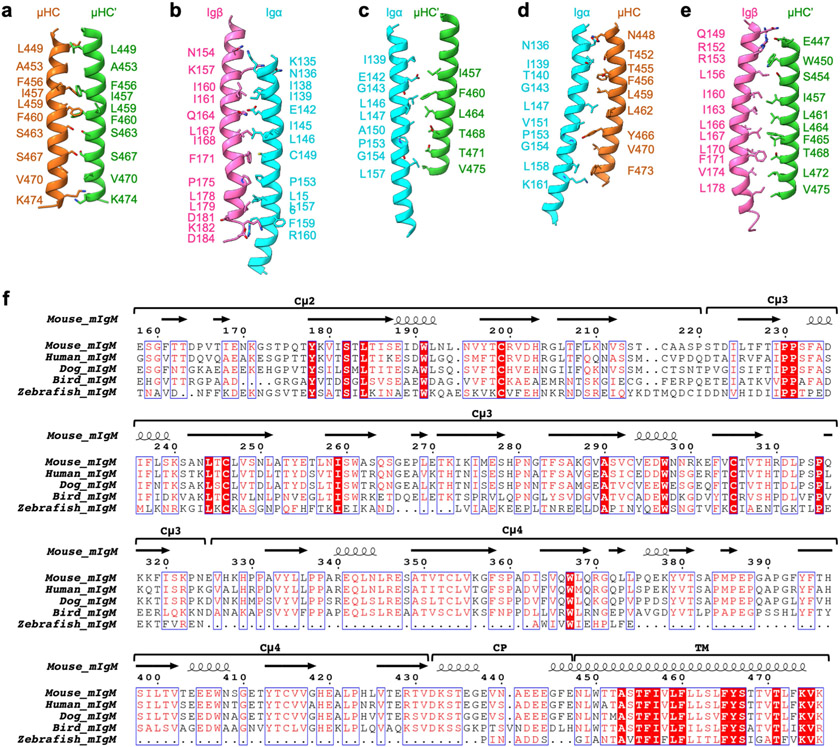
The 4 TMD helices assemble into a tight 4-helix bundle (Fig. 4a and Extended Data Fig. 5d), burying an average of 1,300 Å2 surface area per helix, and thus a massive total surface area of around 5,200 Å. The TMDs of Igα and Igβ differ in their contacts with those of mIgM. Igα contacts TMD helices of both μHC and μHC′, whereas Igβ contacts only that of μHC′ (Fig. 4b). Overall, TMD residues in close proximity with the outer or inner surface of the plasma membrane are often polar or charged, whereas those at the core regions of the helices contain mainly hydrophobic residues (Fig. 4b and Extended Data Fig. 8a-e), consistent with the generic organization of most TMD helices. Charged or polar interactions include those between Igβ Q149 and μHC′ E447, between Igβ K157 and Igα N136, between Igα R137 and μHC N448, and between Igα T140 and μHC T452 (Fig. 4b, left and Extended Data Fig. 5e).
Fig. 4 ∣. TMD assembly of the IgM BCR.
a, Bottom view of the TMD assembly shown in ribbon. b, Key polar interactions at the TMD, including those at the membrane-proximal region (left) and within the membrane including the [E/Q] X10P motif on Igα and Igβ and the YS motif on mIgM (right). c, Structural alignment of μHC and μHC′ in an mIgM dimer, showing the different asymmetric conformation at the TMD. d, Structural alignment of a second Igα/β heterodimer to the empty side of the mIgM Cμ4 dimer showed the lack of interaction with the four-helix bundle of TMD, which may explain why the second Igα/β heterodimer is not recruited to the BCR. e, Ribbon diagrams of five top-ranked models of Igβ TMD and ICD predicted by AlphaFold, shown with a detailed view of the ITAM region. The two tyrosine (Y) residues at the Igβ ITAM (YxxL/lx(6–8)YxxL/I motif) and the two predicted short α-helices are shown in blue and pink, respectively. The short α-helices were also identified by secondary structure prediction37. f, Fitting of an ITAM polyalanine model as an α-helical hairpin into the 3.9 Å intermediate cryo-EM map (contour level, 8.0σ). The hairpin and the foldback onto the Igβ TMD may keep the ITAM in an auto-inhibited form.
However, the cryo-EM structure reveals that there are also charged or polar residues within the core region of the TMD, especially at the [E/Q]X10P motif on Igα and Igβ33 (Fig. 4b, right). Notably, Igα E142 in the motif is largely buried within the four-helix bundle and surrounded by hydrophobic residues. Igα E142 is within hydrogen-bonding distance of the equivalent residue Igβ Q164, which may help to dissipate the charge. E142 may also form an anion–aromatic interaction with the conserved mIg residue F456, as the aromatic ring edge is known to exhibit positive electrostatic potential34,35. In addition, the hydrophobic environment could potentiate protonation of the E142 carboxylate. We hypothesize that these polar interactions within the membrane may help to precisely assemble the TMD, explaining the relative conservation of Igα E142 across species (Extended Data Fig. 6b) and mIg F456 across isotypes and species (Extended Data Figs. 7b and 8f). The conservation of the charged Igα residue within the membrane is reminiscent of the TCR helical bundle in which charged interactions help to bring the TMD helices together at the centre of the membrane.
Another hydrophilic cluster within the membrane involves S463, Y466 and S467 residues of mIgM that include the YS motif36,37 (Fig. 4b). Here, hydrogen bonds are formed between two S463 residues and two S467 residues of μHC and μHC′. The Y466 residues of μHC and μHC′ are distant from each other and only μHC Y466 forms a potential hydrogen bond with the main chain amide of Igα G154, and packs against Igα P153, but not the equivalent Igβ P175 residue (Fig. 4b and Extended Data Fig. 5e). In contrast to the poor conservation among different isotypes of mIg at the ECD interaction with the Igα/β heterodimer, high conservation is observed at the TMD domain interaction (Extended Data Figs. 7b and 8f). The TMD helices of μHC and μHC′ are assembled asymmetrically, as shown by their different positioning when superposed by the ECD (Fig. 4c). Consistently, if we add another Igα/Igβ heterodimer to the empty side of the mIg dimer, the TMD of the heterodimer does not contact the four-helix bundle (Fig. 4d). This lack of interaction at the TMD may explain the 1:1 stoichiometry of the monovalent IgM BCR complex.
ICD density and autoinhibition of ITAM
Since the presumed density for the ICD of Igβ (Fig. 1d) is of low resolution, we used AlphaFold prediction coupled with secondary structure prediction38 to help with the interpretation of the density. Two short helices around the ITAM motifs appeared to be a consensus among the predictions (Fig. 4e and Extended Data Fig. 9a,b). This observation may be important, as two short helices fit well the cryo-EM density (Fig. 4f). We propose that the helical conformation and the potential foldback onto the end of the Igβ TMD could be autoinhibitory towards ITAM phosphorylation.
Discussion
Our cryo-EM structure of the mouse IgM BCR reveals a 1:1 mIgM:Igα/β complex that is in accordance with previous biochemical and fluorescence resonance energy transfer data5,39. The different components of the BCR do not have equal roles in mediating BCR assembly; one of the two mIgM heavy chains (μHC) and Igα have dominant roles in the binding of the Igα/β heterodimer to the mIgM molecule. This explains why the Igα/β heterodimer–but not the previously described Igβ/β homodimer–becomes part of the IgM BCR complex. In addition, the dimeric symmetry of the mIgM ECD is broken by its CPs and TMD. During revision of this Article, cryo-EM structures of human IgM and IgG BCRs were reported40,41. Although human and mouse mIgM (excluding the variable domain), Igα, and Igβ share only 60–70% sequence identity, the human and mouse BCR structures are highly similar, suggesting structural conservation across species. Consistent with the structural conservation, a number of previously existing mutations, mainly in the human IgM and IgG BCR, map to our observed interfaces in the mouse IgM BCR (Supplementary Table 1).
The present structure, but not the previous human IgM and IgG BCR structures40,41, shows density for the ITAM of Igβ, which further suggests a potential auto-inhibited conformation of the ITAM in the resting state. Thus, one potential mechanism for BCR activation may be a conformational change upon antigen binding that overcomes the autoinhibition. However, how antigen binding at the flexibly linked Fab could transmit a conformational change to the ICD remains unknown. A recent structure of the TCR peptide–MHC complex suggested that conformational change of the monomeric TCR complex is an implausible mechanism for TCR activation31. An alternative possibility is that antigen binding alters lateral interactions at the BCR, as suggested by the sequence conservation across species on the exposed surface of the IgM BCR, in particular within its TMD (Extended Data Fig. 9c,d). Some of the conserved residues have been shown to involve in inhibitory BCR oligomerization and their mutation results in receptor activation42. The conserved residues may also be involved in the binding to other interactors, such as the transmembrane phosphatase CD45 that controls the resting state of T and B cells, and CD19, which is found in close proximity to the IgM BCR only on activated B cells43. Our IgM BCR structure provides a starting point for future structural and functional studies that are required to distinguish between different models of BCR activation upon antigen recognition.
Methods
Construct design
The Flag-Igα-YFP construct encodes a chimeric Igα protein with the Flag tag sequence inserted after the leader peptide of Igα. The cytosolic tail of the chimeric Igα is truncated 10 amino acids after the TMD at G169 and fused with YFP through a RSIATRS linker. The cDNA of the Flag–Igα–YFP construct is cloned into the retroviral vector pMOWS. The expression vector for the truncated IgM BCRΔFab (pMS-RL2b) was derived from a pMOWS expressing mouse mIgM heavy chain by replacing the sequence encoding the VH and Cμ1 domains with a Strep tag (WSHPQFEK) connected to the Cμ2 domain via a rigid linker of the sequence A(EAAAK)3A.
Generation of stable cell lines
The mouse J558L cell line expresses endogenous Igβ and λ1 light chain. The cell line J558Lμm15–25 was generated from J558L by stably expressing a mouse mIgM heavy chain with specificity for the hapten 4-hydroxy-5-iodo-3-nitrophenyl acetyl (NIP), and the Flag-Igα-YFP construct. The transfectants were sorted for YFP-positive cells and the expression of a NIP-specific IgM BCR on the cell surface using an allophycocyanin (APC)-coupled 1-NIP peptide and collected by flow cytometry. For the generation of the IgM BCRΔFab expressing cell, we transfected the pMS-RL2b vector into the J558L/Flag-Igα-YFP clone 8A1. Before large-scale expression and purification, stable cell lines were further sorted by flow cytometry to collect cells with the high YFP expression.
Flow cytometry
Flow cytometric analysis was used to measure the co-expression of mIgM and Igα/β in IgM BCR and IgM BCRΔFab cells. Cells were collected and washed once with PBS. Then, the cells were stained for the surface makers with or without the indicated antibodies (IgM–APC). The APC-IgM antibody was diluted 100 times from stock concentration at room temperature for 5 min. The stained cells were washed once with PBS and resuspended in PBS before flow cytometric analysis. Flow cytometry was performed by Attune Flow Cytometers (Thermo). Attune NxT Software was applied for collecting the data and FlowJo was used to analysing the data. Live cells were gated from the FSC/SSC gate for further analysis. Then, the IgM BCR, IgM BCRΔFab cells were gated from GFP and IgM–APC respectively, to show the percentage of the cell populations.
Protein expression and purification
The stable J558L mouse B cell lines were cultured in RPMI 1640 Medium (Gibco, 11875135) with 10% FBS, 100 U ml−1 penicillin/streptomycin, 0.05 mM 2-mercaptoethanol, 10 mM HEPES (pH 7.5) and then supplemented with 1.2 mM xanthine (Sigma Aldrich, X-4002), 0.11 mM hypoxanthine (Sigma Aldrich, H9377) and 1 μg ml−1 mycophenolic acid (Sigma Aldrich, M3536) for selection of double positive expression. The cells were cultured at 37 °C under 5% CO2.
Cell pellets from around 10 l suspension culture were subjected to 20 cycles of Dounce homogenization in a low-salt buffer containing 20 mM HEPES pH 7.5, 5% glycerol, EDTA-free protease inhibitor cocktail (Sigma Aldrich, 04693159001) and benzonase nuclease (Sigma Aldrich, E8263). The cell lysate was centrifuged at 42,000 rpm for 1 h (45 Ti fixed-angle rotor, Beckman) at 4 °C.
The cell membrane was transferred to solubilization buffer A containing 20 mM HEPES at pH 7.5, 150 mM NaCl, 5% glycerol, 0.5% lauryl maltose neopentyl glycol (LMNG) with 0.05% cholesteryl hemisuccinate (CHS) (Anatrace, NG310-CH210), EDTA-free protease inhibitor cocktail, followed by 20 cycles of Dounce homogenization and overnight incubation at 4 °C. Membrane solubilization was followed by centrifugation at 42,000 rpm for 45 min at 4 °C to remove the cell debris and insoluble material. The supernatant was incubated with anti-Flag M2 affinity gel (Sigma, A2220) for 6 h. The beads were washed with 20 column volumes (CV) of buffer B containing 20 mM HEPES at pH 7.5, 150 mM NaCl, 5% glycerol, 0.05% LMNG with 0.005% CHS and eluted by buffer C containing 20 mM HEPES at pH 7.5, 150 mM NaCl, 5% glycerol, 0.005% LMNG with 0.0005% CHS and 100 mg ml−1 3× Flag peptide (ApexBio, A6001).
The elution was concentrated to 1 ml by using Amicon Ultra-15 centrifugal filter unit with 100 kDa cut-off (EMD Millipore, UFC910024) and loaded to a step gradient of 10%, 20%, 30% and 40% glycerol in buffer D containing 20 mM HEPES at pH 7.5, 150 mM NaCl, 5% glycerol, 0.005% LMNG with 0.0005% CHS, followed by centrifugation for 16 h at 40,000 rpm (MLS-50 swinging-bucket rotor, Beckman). Fractions with target protein of 1 ml were manually collected and concentrated to 200 μl by using Amicon Ultra-0.5 centrifugal filter unit with 100 kDa cut-off (EMD Millipore, UFC510024). The protein was fractionated by size-exclusion chromatography (Superose 6 increase 5/150, GE Healthcare) with buffer F (20 mM HEPES at pH 7.5, 150 mM NaCl, 0.004% LMNG and 0.0004% CHS) to remove the glycerol.
The purity and quality of the proteins were characterized at all stages of the purification process using 4%–20% SDS–PAGE (Bio-Rad, 4561096) and 3%–12% Bis-Tris gel (ThermoFisher, BN1003BOX). The blue native PAGE (BN-PAGE) was run at 150 V for 1 h first, followed by 250 V for another 1 h at 4 °C. The BN-PAGE buffer contained native PAGE running buffer (ThermoFisher, BN2001) with the addition of a Coomassie Blue-G250 containing cathode buffer additive (ThermoFisher, BN2002). The SDS–PAGE and BN-PAGE were visualized by Coomassie blue staining (Anatrace, GEN-QC-STAIN). The expression of all the components including IgM, Igα and Igβ were visualized by western blotting using anti-mouse IgM mu chain (Abcam, ab97230), anti-mouse λ light chain (Novus Biologicals, NB7552), anti-Flag (Sigma Aldrich, A8592) and anti-CD79B (Santa Cruz Biotechnology, sc-53210) antibodies, respectively.
Negative staining electron microscopy
The peak fractions from gel filtration chromatography were collected and diluted to a final concentration of 0.01 mg ml−1 for negative staining electron microscopy. Copper grids with carbon support film (Electron Microscopy Sciences, CF150-CU-UL) were glow discharged for 30 s using a Pelco EasyGlow (Ted Pella) instrument. The sample was applied on freshly glow-discharged grids and incubated for 1 min and blotted on filter paper to remove excess buffer. The sample was stained by 6 μl 2% uranyl acetate solution (Electron Microscopy Sciences, 22400-2) twice, each for 30 s and blotted again on filter paper. Negatively stained samples were imaged on a Joel JEM1400 Transmission Electron Microscope at 120 keV.
Cryo-EM data collection
The peak fractions from gel filtration chromatography were concentrated to a final concentration of 0.9 mg ml−1 and crosslinked by 0.4 mM BS(PEG)5 (Thermo Scientific, A35396) on ice for 40 min before cryo-EM sample preparation. 3.3 μl of the protein samples were placed onto glow-discharged Quantifoil R1.2/1.3, gold grids with 400 mesh (Electron Microscopy Sciences, Q4100AR1.3) before being blotted for 3–3.5 s under 100% humidity at 4 °C and plunged into liquid ethane using a Mark IV Vitrobot (ThermoFisher). Before data collection, all the grids were pre-screened and optimized at Pacific Northwest Center for Cryo-EM at Oregon Health and Science University (PNCC), the University of Massachusetts Cryo-EM Core (UMASS) and Harvard Cryo-EM Center for Structural Biology (HMS) to achieve good ice and particle quality.
Final datasets were collected at HMS using a Titan Krios microscope (ThermoFisher) operating at an acceleration voltage of 300 keV equipped with BioQuantum K3 Imaging Filter (Gatan, slit width 20 eV). Data were collected in two separate sessions. The first session was operated in super resolution mode with 105,000× magnification (0.4125 Å per pixel) and a defocus range between −1.0 and −2.0 μm. For each image stack with 50 frames, the total dose was 55.5 electrons per Å2. The second session was operated in super resolution mode with 105,000× magnification (0.415 Å2 per pixel) and a defocus range between −1.0 and −2.0 μm. For each image stack with 60 frames, the total dose was 60.0 electrons per Å2. SerialEM 3.8 was used for fully automated data collection.
Cryo-EM data processing
The computer support and software for data processing support were provided by SBGrid consortium44. For the full-length IgM BCR dataset, raw movies were corrected by gain reference and beam-induced motion by binning twofold with or without dose weighting using the Relion 3.08 implementation of the MotionCor2 algorithm45. The motion-corrected micrographs were imported into cryoSPARC46 to perform blob picking. For the IgM BCRΔFab dataset, raw movies were corrected by gain reference and beam-induced motion in the same way as for the full-length IgM BCR dataset. The motion-corrected micrographs were imported into cryoSPARC46 to perform template picking of 4,496,075 particles using the template generated from the dataset of full-length IgM BCR. Representative 2D classes were then selected as templates for Topaz training47. A total number of 3,456,531 particles were picked from a trained Topaz reference resulting in 0.83 per pixel for the individual dataset from two sessions and extracted. Three rounds of 2D classification were performed followed by selecting good particles from good classes. A total of 321,466 particles were selected and merged for further ab initio reconstruction to generate an initial model. These particles from the two sessions were processed similarly for 3D classification into 4 classes. And then the non-uniform refinement with C1 symmetry resulted in 5.9 and 5.4 Å map for two datasets respectively. two classes of 533,389 particles were combined for the final round of 3D classification into 4 classes. A total of405,695 particles in total were kept for non-uniform refinement. Additional reconstruction using a tight mask led to maps at 3.9 Å resolution. Local refinement on membrane-proximal region achieved a 3.3 Å final map. All reported resolutions were estimated based on the gold-standard Fourier shell correlation (FSC) = 0.143 criterion. All the cryo-EM maps were corrected and sharpened by applying a negative B factor using automated procedures in RELION 3.1. Local resolution estimation of all the cryo-EM maps were estimated using Phenix48.
Model fitting and building
We started map interpretation by first building AlphaFold models using the AlphaFold2 implementation in the ColabFold notebooks running on Google Colaboratory21,22. Default settings were used with Amber relaxation, and sequences were entered in tandem and separated by a semicolon for prediction of complexes. AlphaFold was run once with each of the 5 trained models, which were checked for consistency. AlphaFold computes pLDDT (predicted local distance difference test, 0–100 with 100 being the best) score to indicate the accuracy of a prediction and we plotted per-residue pLDDT as indication of prediction reliability.
Although several structures of BCR components are available23,26, there is no structure for any full-length BCR, in particular the full-length structure of the Igα/β heterodimer. To facilitate density interpretation and model building, we first utilized AI-guided protein structure prediction (AlphaFold running on ColabFold notebook)21,22 to generate models of BCRΔFab. The prediction gave good per-residue pLDDT scores at the ECD but poorer ones at the TMD. While the overall prediction showed variability among the five ranked models, the predicted ECD and the TMD of the Igα/β heterodimer are highly consistent, and fitted well with the density individually. By contrast, the interaction between mIgM and the Igα/β heterodimer at either the ECD or the TM were predicted poorly. Thus, we manually placed the mIgM ECD and TMD helices separately and built de novo the flexible CPs between the ECD and TMD for all chains in COOT49. The quality of the map was sufficient for sequence assignments for most of the IgM BCRΔfab complex. Because Cμ2 domain is not visible due to flexibility, the final model of BCRΔFab includes the full-length Igα/β heterodimer and Cμ3-TMD of mIgM. For building the full-length BCR, we placed the crystal structures of Fab and Cμ2 domain23,24 into the density. The cytosolic tail of Igβ containing the ITAM was built as a polyalanine model with two short helices in COOT. Model fitting was conducted using ChimeraX50. The BCRΔFab structure was refined by real space refinement followed by model validation in Phenix48. Because of the modest resolution, hydrogen bonds and salt bridges in the structure were defined by distance cut-offs of 3.5 Å and 4.5 Å, respectively.
Extended Data
Extended Data Fig. 1 ∣. Protein purification and cryo-EM data processing of full-length IgM BCR.
a, Selection of J558L B cells that expressed IgM BCR. Domain organization of IgM BCR and surface expression of IgM (APC) and Igα (GFP) by flow cytometry are shown. b-c, Purification of IgM BCR shown by SDS-PAGE, Blue-native (BN) PAGE and western blotting using antibodies against the individual subunits. H: heavy chain; L: light chain. d, Gel filtration profiles of IgM BCR. The peak of IgM BCR is shaded in grey. e-f, Representative 2D classes of IgM BCR (e) and specifically at its Fab region (f). g-h, Data processing flow chart (g) and local resolution distribution of IgM BCR (h).
Extended Data Fig. 2 ∣. Protein purification, raw images and 2D classifications of IgM BCRΔFab.
a, Selection of J558L B cells that expressed IgM BCRΔFab. Domain organization of IgM BCRΔFab and surface expression of IgM (APC) and Igα (GFP) by flow cytometry are shown. b-c, Purification of IgM BCRΔFab shown by SDS-PAGE, Blue-native (BN) PAGE and western blotting using antibodies against the individual subunits. H: heavy chain. d, Gel filtration profiles of IgM BCRΔFab. The peak of IgM BCRΔFab is shaded in grey e-f, Representative negative staining EM image (e) and cryo-EM image of IgM BCRΔFab (f). g, Representative 2D classes of IgM BCRΔFab.
Extended Data Fig. 3 ∣. Cryo-EM data processing of IgM BCRΔFab.
a, Cryo-EM data processing flow chart of the 3.9 Å intermediate cryo-EM map and the 3.3 Å final cryo-EM map of IgM BCRΔFab. b, Angular distribution of the particles used for the final reconstruction shown as a heat map. c, Fourier shell correlation (FSC) plots. d, 3D FSC plot.
Extended Data Fig. 4 ∣. AlphaFold predicted models of IgM BCR.
a, The top ranked model of IgM BCR (without Fab and Cμ2) predicted by AlphaFold, coloured by per-residue pLDDT score. b, Five predicted models of IgM BCR. c, Alignment of the five models of the Igα/β heterodimer at ECD (left) and TMD (right), showing consistent prediction of the ECD interaction (left) and the TMD interaction (right) separately. The CPs of the Igα/β heterodimer were not predicted correctly. d, Alignment of the five models of mIgM at ECD (left) and TMD (right) superimposed with IgM BCRΔFab model, showing consistent prediction of the ECD interaction (left) but incorrect prediction of the TMD interaction (right). The CPs of the mIgM dimer were not predicted correctly. In (c) and (d), the experimentally determined subunits of the IgM BCRΔFab model are shown in their model colours and AlphaFold predicted models are shown in grey.
Extended Data Fig. 5 ∣. Model fitting of IgM BCRΔFab in the 3.3 Å cryo-EM map (contour level: 4.0 σ).
a, Ig regions of Igα and Igβ for the Igα/β interaction superimposed with the cryo-EM map. b, Interface between μHC Cμ4 and Igα superimposed with the cryo-EM map. c, Four connecting peptide regions from μHC, μHC’, Igα and Igβ superimposed with the cryo-EM map. Acidic and basic residues are shown and labelled. d-e, TMD helices of μHC, μHC′, Igα and Igβ superimposed with the cryo-EM map (d). Key residues mediating the TMD interaction are shown (e). f, The fitting of five glycosylation sites on the Igα/Igβ heterodimer.
Extended Data Fig. 6 ∣. Structural and sequence alignment of Igα and Igβ.
a, Structural alignment between the Ig domains of Igα and Igβ (3.2 Å RMSD). b-c, Sequence alignment of Igα (b) and Igβ (c) among different species. Residues at the interface of Igα/β with μHC and μHC’ are indicated by triangle symbols. Igα C113 and Igβ C135 are marked by red triangle symbols.
Extended Data Fig. 7 ∣. Structural and sequence alignment of mIg.
a, Structural alignment of the Cμ3-Cμ4 homodimer of IgM BCR with that from the crystal structure of secreted IgM or sIgM (3.1 Å RMSD, PDB: 6KXS). b, Sequence alignment of mIg among different isotypes. Residues at the interface of μHC and μHC’ with Igα/β are indicated by solid and hollow triangle symbols respectively.
Extended Data Fig. 8 ∣. Interaction at TMD and sequence alignment of mIgM.
a–e, The interactions between pairs of helices of TMD. f, Sequence alignment of mIgM among different species.
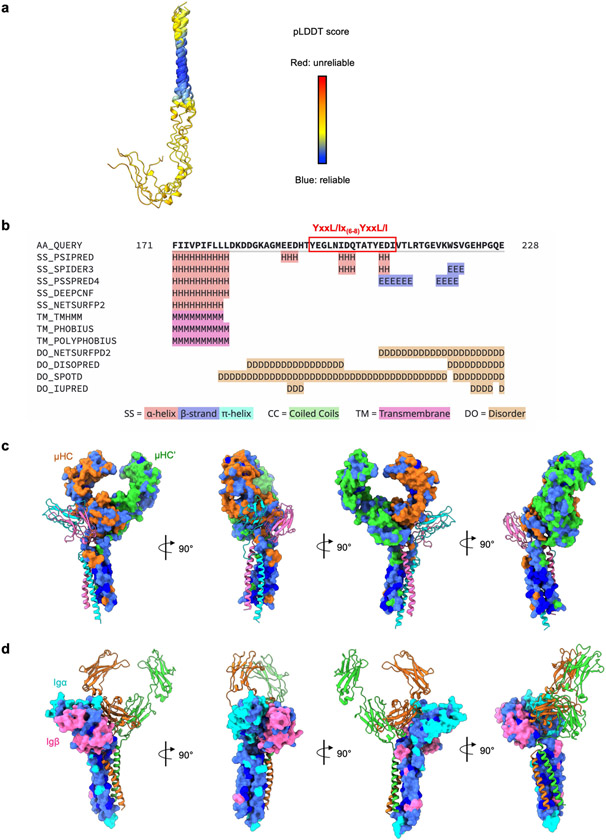
Extended Data Fig. 9 ∣. AlphaFold prediction and secondary structure prediction of Igβ, and sequence conservation mapping on the IgM-BCR surface.
a, AlphaFold prediction of Igβ. The TMD and ICD of Igβ were predicted, showing the pLDDT scores. b, Secondary structure prediction of Igβ (residue 171–228). The ITAM consensus motif is highlighted by red rectangle. c-d, Conserved residue distribution on the Cμ3-Cμ4 homodimer surface (c) and the Igα/Igβ heterodimer surface (d) according to sequence alignment among species. The most conserved residues are shown in dark blue, less conserved residues in light blue, and the remaining residues in their chain colours are defined in Fig. 1d.
Extended Data Table 1 ∣.
Data collection, processing, refinement, and validation statistics
| Data Collection and Processing | |
|---|---|
| Microscope | Titan Krios |
| Voltage (keV) | 300 |
| Camera | K3 |
| Magnification | 105,000 |
| Pixel size at detector (Å/pixel) | 0.83 |
| Total electron exposure (e−/Å2) | ~60 |
| Exposure rate (e−/pixel/sec) | 12.7 |
| Number of frames collected during exposure | 60 |
| Defocus range (μm) | −1.0 to −2.0 |
| Automation software | SerialEM 3.8 |
| Energy filter slit width (eV) | 20 |
| Micrographs collected (no.) | 28,309 |
| Micrographs used (no.) | 28,309 |
| Total extracted particles (no.) | 793,175 |
| Refinement | |
| Refined particles (no.) / Final particles (no.) | 533,389 / 405,695 |
| Symmetry parameters | C1 |
| Map resolution (Å) | 3.3 |
| FSC 0.143 (unmasked / masked) | 4.0 / 3.3 |
| Resolution range (Å) | 2.8 to 8.8 |
| Resolution range due to anisotropy (Å) | 2.8 to 3.1 |
| Map sharpening B factor range (Å2) | −141 |
| Map sharpening methods | LocalDeblur |
| Model composition | With / without Cμ3 |
| Chains | 4 |
| Protein residues | 805 / 580 |
| Validation | |
| Model-Map scores | |
| CC (correlation coefficients) | 0.60 / 0.65 |
| Average FSC (0 / 0.143 / 0.5) | (2.6/3.1/7.0) / (2.6/3.1/4.0) |
| R.m.s. deviations from ideal values | |
| Bond lengths (Å) | 0.005 / 0.005 |
| Bond angles (°) | 1.10 / 0.806 |
| MolProbity score | 1.90 / 2.11 |
| CaBLAM outliers | 3.46 / 4.61 |
| Clashscore | 7.22 / 7.84 |
| Poor rotamers (%) | 1.41 / 1.94 |
| C-beta outliers (%) | 0.00 / 0.00 |
| Ramachandran plot | |
| Favoured (%) | 94.33 / 92.66 |
| Allowed (%) | 5.53 / 7.17 |
| Outliers (%) | 0.13 / 0.17 |
Supplementary Material
Acknowledgements
We thank members of the Wu laboratory, especially Y. Zheng, for helpful discussions; R. Walsh, S. Sterling. M. Mayer and S. Rawson at the Harvard Cryo-EM Center for Structural Biology for cryo-EM training and data collection; K. Song at the University of Massachusetts Cryo-EM Core for screening and preliminary dataset collection; and J. Myers, V. Rayaprolu and the Pacific Northwest Center for Cryo-EM at Oregon Health and Science University for preliminary dataset collection, under the NIH grant U24GM129547 and accessed through EMSL (grid.436923.9), a DOE Office of Science User Facility sponsored by the Office of Biological and Environmental Research. We thank SBGrid for software and computing support. Research reported in this publication was supported by the National Institutes of Health through RO1 grant AI145656 (to M.R.), the DFG through TRR130-P02 (to M.R.), Germany’s Excellence Strategy (CIBSS-EXC-2189, Project ID390939984) and the Charles A. King Trust postdoctoral research fellowship (to Y.D.).
Footnotes
Online content
Any methods, additional references, Nature Portfolio reporting summaries, source data, extended data, supplementary information, acknowledgements, peer review information; details of author contributions and competing interests; and statements of data and code availability are available at https://doi.org/10.1038/s41586-022-05412-7.
Reporting summary
Further information on research design is available in the Nature Portfolio Reporting Summary linked to this article.
Competing interests The authors declare no competing interests.
Supplementary information The online version contains supplementary material available at https://doi.org/10.1038/s41586-022-05412-7.
Data availability
All data and materials reported in the main and supplementary data are available upon reasonable request. The electron density maps of 8.2 Å full-length IgM BCR, 3.3 Å IgM BCRΔfab and 3.9 Å IgM BCRΔfab have been deposited in the Electron Microscopy Data Bank (EMDB) with accession codes EMD-27848, EMD-27888 and EMD-28030, respectively. The atomic coordinates for IgM BCRΔfab and full-length IgM BCR have been deposited in the Protein Data Bank with the accession code of 8E4C and 8EMA.
References
- 1.Venkitaraman AR, Williams GT, Dariavach P & Neuberger MS The B-cell antigen receptor of the five immunoglobulin classes. Nature 352, 777–781 (1991). [DOI] [PubMed] [Google Scholar]
- 2.Alber G, Flaswinkel H, Kim K-M, Weiser P & Reth M in Progress in Immunology Vol. VIII (eds Gergely J et al. ) 27–33 (Springer, 1993). [Google Scholar]
- 3.Hombach J, Tsubata T, Leclercq L, Stappert H & Reth M Molecular components of the B-cell antigen receptor complex of the lgM class. Nature 343, 760–762 (1990). [DOI] [PubMed] [Google Scholar]
- 4.Campbell KS & Cambier JC B lymphocyte antigen receptors (mIg) are non-covalently associated with a disulfide linked, inducibly phosphorylated glycoprotein complex. EMBO J. 9, 441–448 (1990). [DOI] [PMC free article] [PubMed] [Google Scholar]
- 5.Schamel WWA & Reth M Monomeric and oligomeric complexes of the B cell antigen receptor. Immunity 13, 5–14 (2000). [DOI] [PubMed] [Google Scholar]
- 6.McHeyzer-Williams LJ & McHeyzer-Williams MG Antigen-specific memory B cell development. Annu. Rev. Immunol 23, 487–513 (2005). [DOI] [PubMed] [Google Scholar]
- 7.Reth M & Wienands J Initiation and processing of signals from the B cell antigen receptor. Annu. Rev. Immunol 15, 453–479 (1997). [DOI] [PubMed] [Google Scholar]
- 8.Reth M. Antigen receptors on B lymphocytes. Annu. Rev. Immunol 10, 97–121 (1992). [DOI] [PubMed] [Google Scholar]
- 9.Alt FW & Bothwell LM Synthesis of secreted and membrane-bound immunoglobulin mu heavy chains is directed by mRNAs that differ at their 3′ ends. Cell 20, 293–301 (1992). [DOI] [PubMed] [Google Scholar]
- 10.Early P. et al. Two mRNAs can be produced from a single immunoglobulin p gene by alternative RNA processing pathways. Cell 20, 313–3197 (1980). [DOI] [PubMed] [Google Scholar]
- 11.Stavnezer J & Schrader CE Ig heavy chain class switch recombination: mechanism and regulation. J. Immunol 193, 5370–5378 (2014). [DOI] [PMC free article] [PubMed] [Google Scholar]
- 12.Stavnezer J, Guikema JEJ & Schrader CE Mechanism and regulation of class switch recombination. Annu. Rev. Immunol 26, 261–292 (2008). [DOI] [PMC free article] [PubMed] [Google Scholar]
- 13.Esser C. Immunoglobulin class switching: molecular and cellular analysis. Annu. Rev. Immunol 8, 717–735 (1990). [DOI] [PubMed] [Google Scholar]
- 14.Reth M. Antigen receptor tail clue. Nature 338, 383–384 (1989). [PubMed] [Google Scholar]
- 15.Samelson LE & Klausner RD Tyrosine kinases and tyrosine-based activation motifs. Current research on activation via the T cell antigen receptor. J. Biol. Chem 267, 24913–24916 (1992). [PubMed] [Google Scholar]
- 16.Flaswinkel H & Reth M Dual role of the tyrosine activation motif of the Ig-alpha protein during signal transduction via the B cell antigen receptor. EMBO J. 13, 83–89 (1994). [DOI] [PMC free article] [PubMed] [Google Scholar]
- 17.Roux KH, Strelets L, Brekke OH, Sandlie I & Michaelsen TE Comparisons of the ability of human IgG3 hinge mutants, IgM, IgE, and IgA2, to form small immune complexes: a role for flexibility and geometry. J. Immunol 161, 4083–4090 (1998). [PubMed] [Google Scholar]
- 18.Adlersberg JB The immunoglobulin hinge (interdomain) region. Ric. Clin. Lab 6, 191 (1976). [PubMed] [Google Scholar]
- 19.Sandin S, Öfverstedt L-G, Wikström A-C, Wrange Ö & Skoglund U Structure and flexibility of individual immunoglobulin G molecules in solution. Structure 12, 409–415 (2004). [DOI] [PubMed] [Google Scholar]
- 20.Wurzburg BA, Garman SC & Jardetzky TS Structure of the human IgE–Fc Cε3–Cε4 reveals conformational flexibility in the antibody effector domains. Immunity 13, 375–385 (2000). [DOI] [PubMed] [Google Scholar]
- 21.Mirdita M. et al. ColabFold—Making protein folding accessible to all. Nat. Methods 19, 679–682 (2022). [DOI] [PMC free article] [PubMed] [Google Scholar]
- 22.Jumper J. et al. Highly accurate protein structure prediction with AlphaFold. Nature 596, 583–589 (2021). [DOI] [PMC free article] [PubMed] [Google Scholar]
- 23.Müller R. et al. High-resolution structures of the IgM Fc domains reveal principles of its hexamer formation. Proc. Natl Acad. Sci. USA 110, 10183–10188 (2013). [DOI] [PMC free article] [PubMed] [Google Scholar]
- 24.Ban N. et al. Structure of an anti-idiotypic Fab against feline peritonitis virus-neutralizing antibody and a comparison with the complexed Fab. FASEB J. 9, 107–114 (1995). [DOI] [PubMed] [Google Scholar]
- 25.Dong D. et al. Structural basis of assembly of the human T cell receptor–CD3 complex. Nature 573, 546–552 (2019). [DOI] [PubMed] [Google Scholar]
- 26.Kato K. et al. High-resolution cryo-EM structure of photosystem II reveals damage from high-dose electron beams. Commun. Biol 4, 382 (2021). [DOI] [PMC free article] [PubMed] [Google Scholar]
- 27.Radaev S. et al. Structural and functional studies of Igαβ and its assembly with the B Cell antigen receptor. Structure 18, 934–943 (2010). [DOI] [PMC free article] [PubMed] [Google Scholar]
- 28.Krissinel E & Henrick K Inference of macromolecular assemblies from crystalline state. J. Mol. Biol 372, 774–797 (2007). [DOI] [PubMed] [Google Scholar]
- 29.Li Y. et al. Structural insights into immunoglobulin M. Science 367, 1014–1017 (2020). [DOI] [PubMed] [Google Scholar]
- 30.Hiramoto E. et al. The IgM pentamer is an asymmetric pentagon with an open groove that binds the AIM protein. Sci. Adv 4, eaau1199 (2018). [DOI] [PMC free article] [PubMed] [Google Scholar]
- 31.Sušac L. et al. Structure of a fully assembled tumor-specific T cell receptor ligated by pMHC. Cell 185, 3201–3213.e19 (2022). [DOI] [PMC free article] [PubMed] [Google Scholar]
- 32.Schamel WWA & Reth M Stability of the B cell antigen receptor complex. Mol. Immunol 37, 253–259 (2000). [DOI] [PubMed] [Google Scholar]
- 33.Gottwick C. et al. A symmetric geometry of transmembrane domains inside the B cell antigen receptor complex. Proc. Natl Acad. Sci. USA 116, 13468–13473 (2019). [DOI] [PMC free article] [PubMed] [Google Scholar]
- 34.Schwans JP et al. Use of anion–aromatic interactions to position the general base in the ketosteroid isomerase active site. Proc. Natl Acad. Sci. USA 110, 11308–11313 (2013). [DOI] [PMC free article] [PubMed] [Google Scholar]
- 35.Kwong PD et al. Structure of an HIV gp120 envelope glycoprotein in complex with the CD4 receptor and a neutralizing human antibody. Nature 393, 648–659 (1998). [DOI] [PMC free article] [PubMed] [Google Scholar]
- 36.Parikh VS et al. Differential structure–function requirements of the transmembrane domain of the B cell antigen receptor. J. Exp. Med 176, 1025–1031 (1992). [DOI] [PMC free article] [PubMed] [Google Scholar]
- 37.Shaw C, Mitchell N, Weaver YK & Abbas AK Mutations of immunoglobulin transmembrane and cytoplasmic domains: effects on intracellular signaling and antigen presentation. Cell 63, 381–392 (1990). [DOI] [PubMed] [Google Scholar]
- 38.Zimmermann L. et al. A completely reimplemented MPI bioinformatics toolkit with a new HHpred server at its core. J. Mol. Biol 430, 2237–2243 (2018). [DOI] [PubMed] [Google Scholar]
- 39.Tolar P, Sohn HW & Pierce SK The initiation of antigen-induced B cell antigen receptor signaling viewed in living cells by fluorescence resonance energy transfer. Nat. Immunol 6, 1168–1176 (2005). [DOI] [PubMed] [Google Scholar]
- 40.Su Q. et al. Cryo-EM structure of the human IgM B cell receptor. Science 337, 875–880 (2022). [DOI] [PubMed] [Google Scholar]
- 41.Ma X. et al. Cryo-EM structures of two human B cell receptor isotypes. Science 377, 880–885 (2022). [DOI] [PubMed] [Google Scholar]
- 42.Yang J & Reth M Oligomeric organization of the B-cell antigen receptor on resting cells. Nature 467, 465–469 (2010). [DOI] [PubMed] [Google Scholar]
- 43.Gold MR & Reth MG Antigen receptor function in the context of the nanoscale organization of the B cell membrane. Annu. Rev. Immunol 37, 97–123 (2019). [DOI] [PubMed] [Google Scholar]
- 44.Morin A. et al. Collaboration gets the most out of software. eLife 2, e01456 (2013). [DOI] [PMC free article] [PubMed] [Google Scholar]
- 45.Zheng SQ et al. MotionCor2 - anisotropic correction of beam-induced motion for improved cryo-electron microscopy. Nat. Methods 14, 331–332 (2017). [DOI] [PMC free article] [PubMed] [Google Scholar]
- 46.Punjani A, Rubinstein JL, Fleet DJ & Brubaker MA cryoSPARC: algorithms for rapid unsupervised cryo-EM structure determination. Nat. Methods 14, 290–296 (2017). [DOI] [PubMed] [Google Scholar]
- 47.Bepler T. et al. Positive-unlabeled convolutional neural networks for particle picking in cryo-electron micrographs. Nat. Methods 16, 1153–1160 (2019). [DOI] [PMC free article] [PubMed] [Google Scholar]
- 48.Adams PD et al. PHENIX: a comprehensive Python-based system for macromolecular structure solution. Acta Crystallogr. D 66, 213–221 (2010). [DOI] [PMC free article] [PubMed] [Google Scholar]
- 49.Emsley P & Cowtan K Coot: model-building tools for molecular graphics. Acta Crystallogr. D 60, 2126–2132 (2004). [DOI] [PubMed] [Google Scholar]
- 50.Goddard TD et al. UCSF ChimeraX: meeting modern challenges in visualization and analysis. Protein Sci. 27, 14–25 (2018). [DOI] [PMC free article] [PubMed] [Google Scholar]
Associated Data
This section collects any data citations, data availability statements, or supplementary materials included in this article.
Supplementary Materials
Data Availability Statement
All data and materials reported in the main and supplementary data are available upon reasonable request. The electron density maps of 8.2 Å full-length IgM BCR, 3.3 Å IgM BCRΔfab and 3.9 Å IgM BCRΔfab have been deposited in the Electron Microscopy Data Bank (EMDB) with accession codes EMD-27848, EMD-27888 and EMD-28030, respectively. The atomic coordinates for IgM BCRΔfab and full-length IgM BCR have been deposited in the Protein Data Bank with the accession code of 8E4C and 8EMA.


