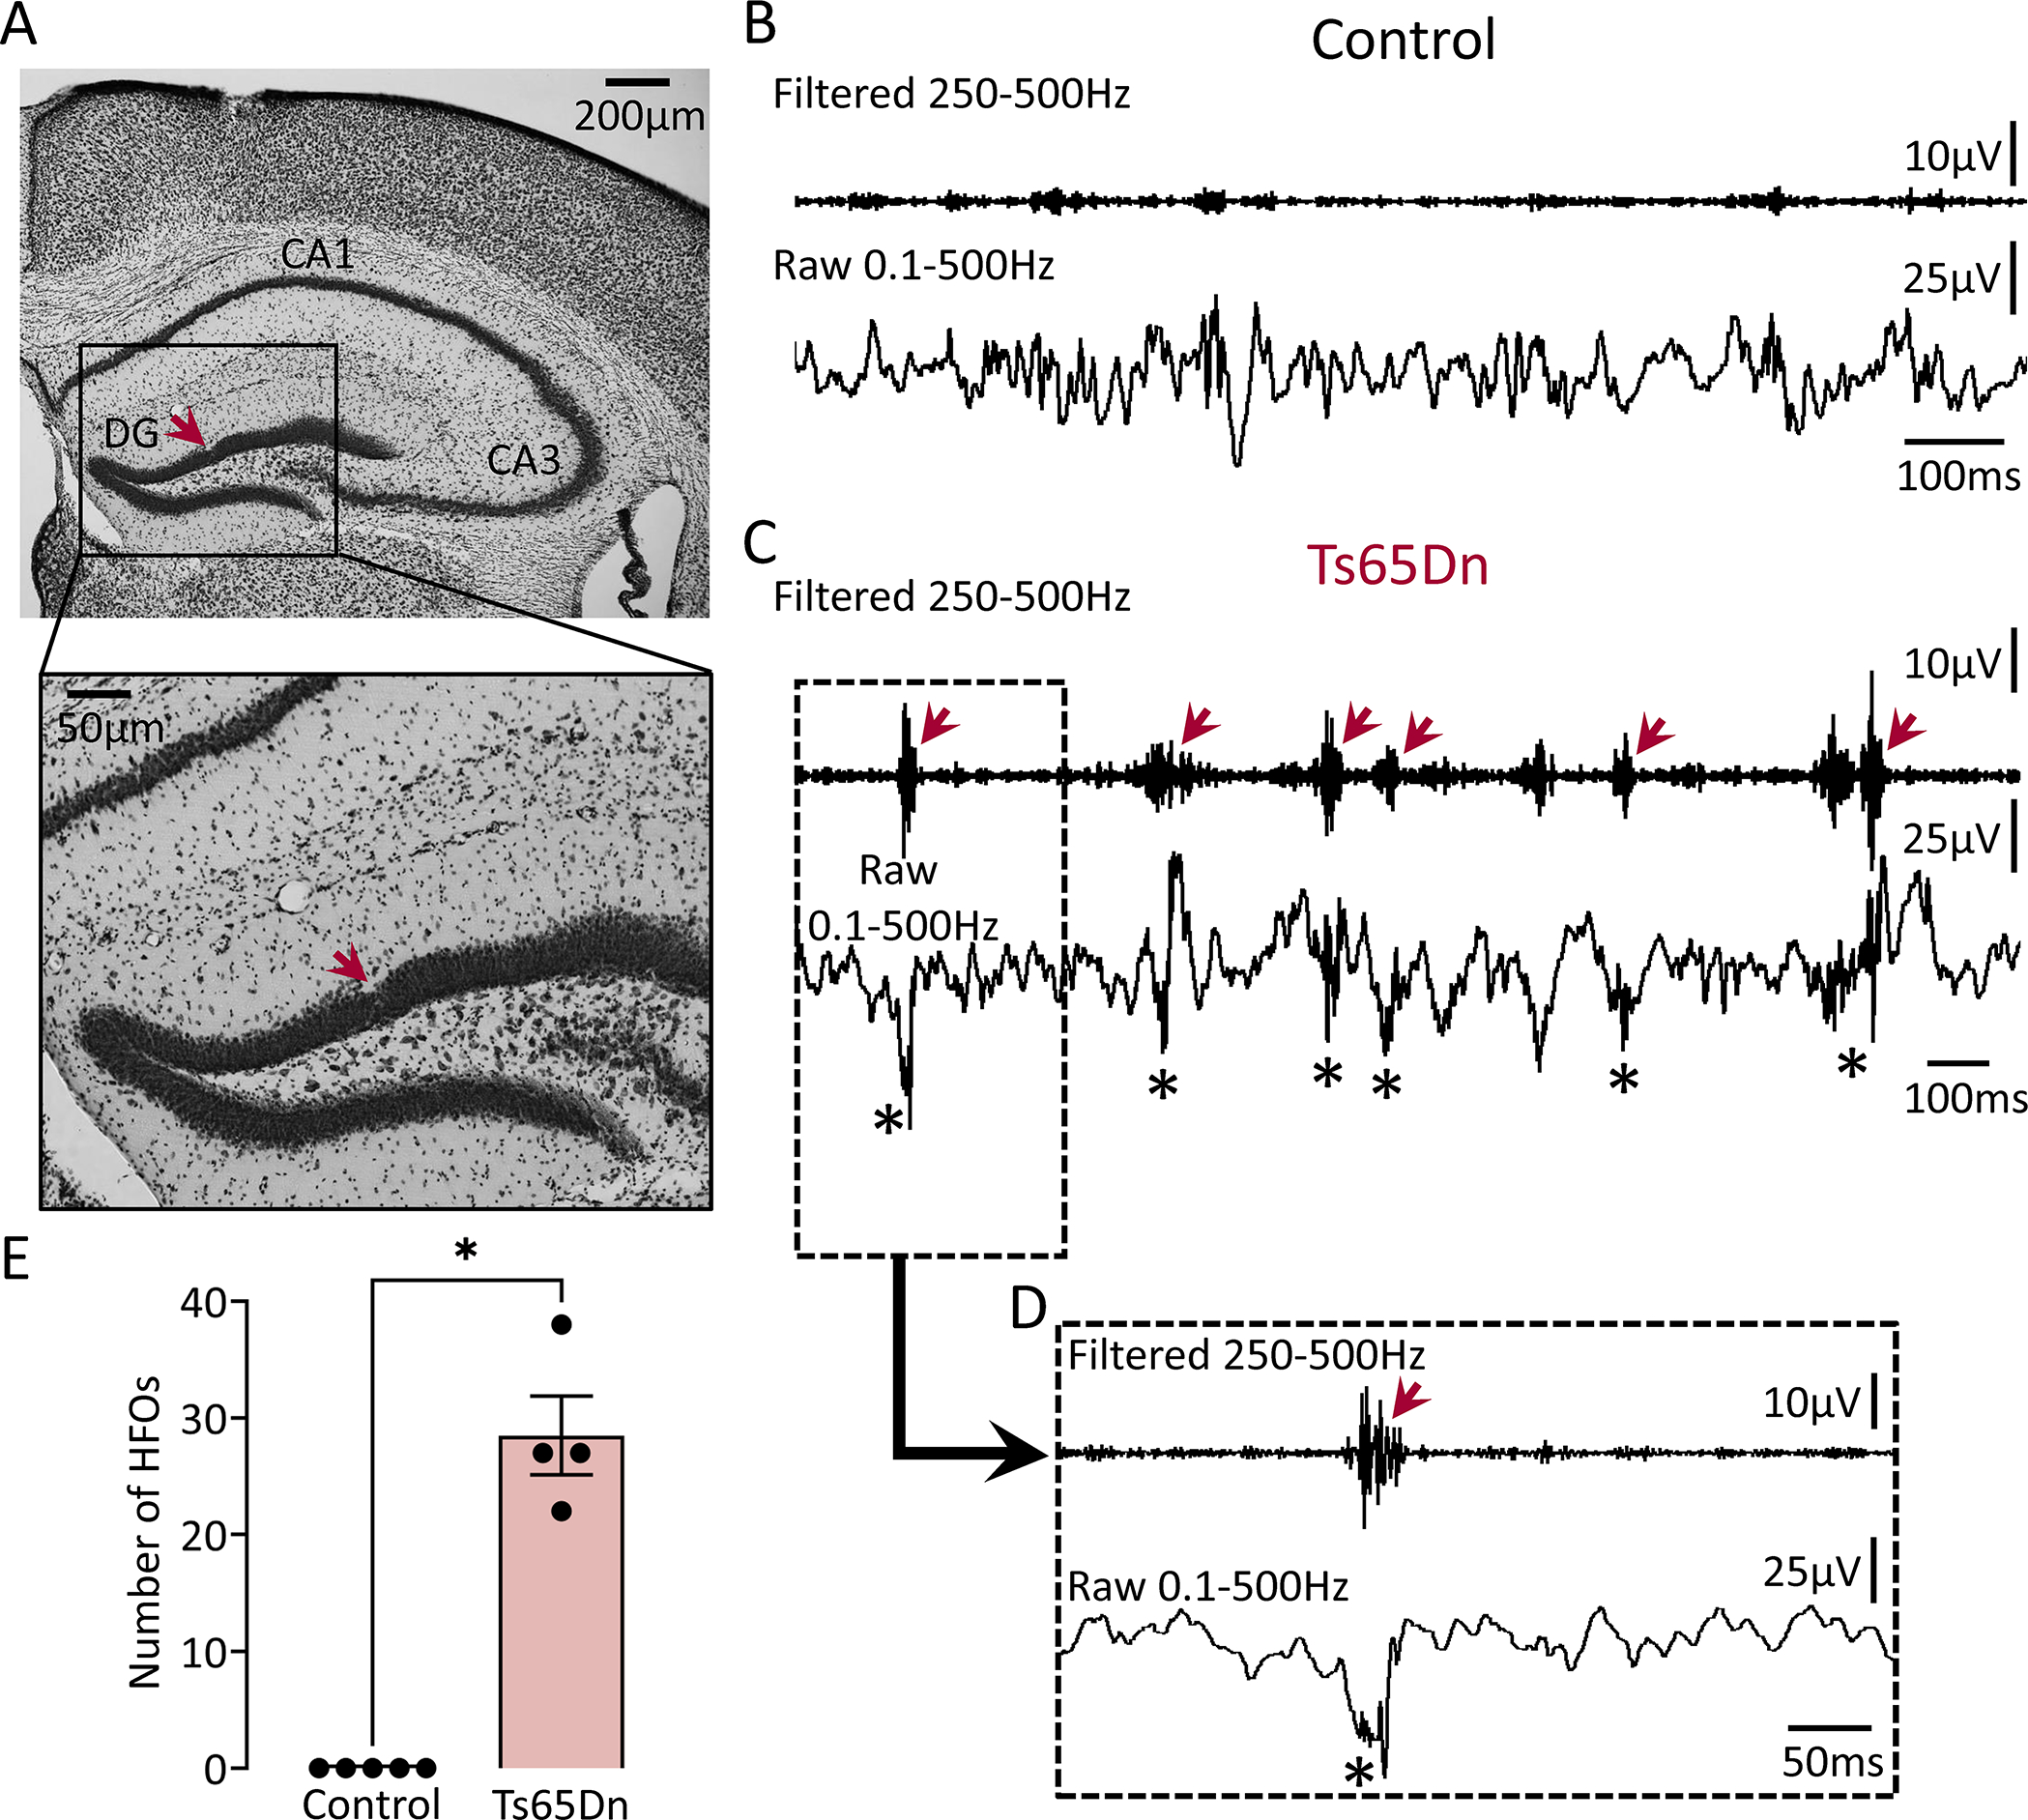
Figure 3: HFOs in the dentate gyrus of a mouse model of Down’s syndrome.

(A) A representative Nissl-stained section confirming electrode placement in the DG (red arrow). Electrode targeting for both the control and transgenic mice is provided in Supplemental figure 4.
(B) A control EEG recording from the DG during SWS is shown. No HFOs were detected.
(C) Same as in B but the mouse was a Ts65Dn transgenic. Note HFOs in filtered (red arrows) and raw (asterisks) traces.
(D) Expanded traces from the inset in C are shown. Note an HFO in the filtered trace (red arrow) which is also visible in the raw trace (asterisk).
(E) Total number of HFOs recorded from control (n=5) and Ts65Dn transgenic (n=4) mice. Data from all behavioral states were pooled. The total number of HFOs was significantly greater in Ts65Dn vs. control mice (Mann-Whitney U-test, U=0, p=0.01).
