Abstract
Segmentation is a crucial step in extracting the medical image features for clinical diagnosis. Though multiple metrics have been proposed to evaluate the segmentation performance, there is no clear study on how or to what extent the segmentation errors will affect the diagnostic related features used in clinical practice. Therefore, we proposed a segmentation robustness plot (SRP) to build the link between segmentation errors and clinical acceptance, where relative area under the curve (R-AUC) was designed to help clinicians to identify the robust diagnostic related image features. In experiments, we first selected representative radiological series from time series (cardiac first-pass perfusion) and spatial series (T2 weighted images on brain tumors) of magnetic resonance images, respectively. Then, dice similarity coefficient (DSC) and Hausdorff distance (HD), as the widely used evaluation metrics, were used to systematically control the degree of the segmentation errors. Finally, the differences between diagnostic related image features extracted from the ground truth and the derived segmentation were analyzed, using the statistical method large sample size T-test to calculate the corresponding p values. The results are denoted in the SRP, where the x-axis indicates the segmentation performance using the aforementioned evaluation metric, and the y-axis shows the severity of the corresponding feature changes, which are expressed in either the p values for a single case or the proportion of patients without significant change. The experimental results in SRP show that when DSC is above 0.95 and HD is below 3 mm, the segmentation errors will not change the features significantly in most cases. However, when segmentation gets worse, additional metrics are required for further analysis. In this way, the proposed SRP indicates the impact of the segmentation errors on the severity of the corresponding feature changes. By using SRP, one could easily define the acceptable segmentation errors in a challenge. Additionally, the R-AUC calculated from SRP provides an objective reference to help the selection of reliable features in image analysis.
Keywords: Medical image segmentation, Evaluation metrics, Segmentation robustness plot
Introduction
Image analysis like radiomics is a rapidly emerging methodology for precision medicine in diagnosis, prognosis, treatment planning, and personalized therapy [1]. Segmentation is often a critical step in extracting the diagnostic related features, e.g., bleeding volume calculation from brain CT and myocardial tissue phenotyping for diagnosis using cardiac MRI [2–4]. With the advances in deep learning in recent years, numerous auto-segmentation algorithms have been proposed to decrease the segmentation variation and improve the efficiency of clinical routine [5]. In most cases, segmentation performance is evaluated with respect to the manual segmentation, called the “gold standard,” conducted by expert clinicians [6]. The pixels that belong to the objects are called positives, while the pixels in the background are called negatives.
To evaluate the performance of the emerging segmentation algorithms, multiple metrics have been designed, including geometric overlap, consuming time, and subjective scoring system [5]. However, those metrics were mainly derived from computer vision missions and evaluated the segmentation performance based on the geometric position information of the targets in images. They did not study how those segmentation errors will affect the diagnostic related features and assess the clinical presentation of the errors. Note that the researchers pushed the segmentation accuracy to an unnecessarily high level, while the conclusions with those metrics were not well correlated with clinically meaningful endpoints. The values of the segmentation evaluation metrics are not predictive of the e clinical presentation of the diagnostic related features, extracted from the segmented areas. In recent times, there has been a rapid development of novel architectures and huge improvement in accuracy in medical imaging domain [7–9] while properties like clinical performance, robustness, et al. are less explored, leaving doubts about advances in model reliability. It is still not clear to what extent of the segmentation errors will affect the diagnostic related features used in the clinical practice [10–12]. Therefore, this paper aims at exploring how the segmentation errors will affect the diagnostic related features and to what extent they will cause significant changes that may affect clinical decisions.
Related Work
This section reviews recent works on the segmentation evaluation metrics and the latest study on the clinical effect of segmentation errors.
Segmentation Evaluation Metrics
With respect to the goal of segmentation, the evaluation metrics can be classified into several types: pair counting-based metrics, information theoretic-based metrics, and spatial information-based metrics [13]. For pair counting-based metrics, the rand index (RI) [14] measures the similarity between two sets of points, which is not based on labels. For information theoretic-based metrics, the mutual information (MI) between two areas measures the amount of information that one pixel has about the other. However, those evaluation metrics treat the segmentation problem as a classification problem, which misses the geometrical information. Spatial information-based metrics measure the segmentation location difference with respect to the ground truth [15], where the overall accuracy is important [16]. Dice similarity coefficient (DSC) [17] and intersection over union (IOU), as statistical metrics, are often used to measure the reproducibility of annotated regions of interest. Hausdorff Distance (HD) is also widely used to assign a scalar score to the similarity between two contours. There is no concrete conclusion about which metric is better, and in most cases, researchers report their results jointly using the aforementioned metrics. Recently, D Müller et al. [18] constructed a library of medical image segmentation evaluation metrics to facilitate researchers to test the designed segmentation algorithms. Note that DSC and HD were often jointly used, e.g., Kaggle BraTS2021 [8], UW-Madison2022 [7], as DSC is more sensitive to the internal padding of the mask, and HD is more sensitive to the segmented boundary. However, since those metrics are mainly derived from the computer vision domain, it lacks an understanding of how the segmentation errors will affect the diagnostic related features extracted from the segmented areas, which would inevitably affect diagnosis accuracy in clinical practice.
The Clinical Effect of Segmentation Errors
In recent years, researchers gradually noticed that superior segmentation performance did not closely correlate with diagnosis accuracy. The reproducibility and robustness of diagnostic related features might be severely affected by the segmentation process [19], while the features utilized in clinical routine needs to be stable. Even though segmentation algorithms have made significant progress due to deep learning, the clinical benefit remains limited [9]. Hsu et al. [20] quantified myocardial blood flow using the extracted MRI image features from the segmentation automatically. Biglands et al. [21] studied relationships between segmentation errors and myocardial blood flow errors but only with a few healthy volunteers. Jathanna et al. [22] assessed the feasibility of applying different automatic methodologies for left ventricular scar identification, but the model evaluation remains heterogeneous. Note that the progression in segmentation for the clinical application requires detailed, transparent, and systematic evaluation. Dominik M et al. [18] suggested combining the optimal segmentation metrics in a standardized evaluation workflow according to the different clinical task requirements. Their approach facilitated the quality of evaluation by including the advantages of various metrics, but still did not consider the link with clinical performance. Saltybaeva et al. [23] emphasized the importance of the diagnostic related features’ robustness and evaluated them in a multi-center study with a view of image normalization methods. However, the aforementioned works still did not gain an intuitive understanding of how or to what extent the segmentation errors will affect clinical decisions. Inspired by the previous works, this paper conducted a systematic analysis of the segmentation evaluation in the medical domain from a clinical perspective. Since the clinical values of diagnostic related features are widely demonstrated in both diagnosis and prognosis process, we explored the effect of segmentation errors on them, which could be regarded as a bridge between the segmentation errors and clinical presentation.
Material and Methods
Material
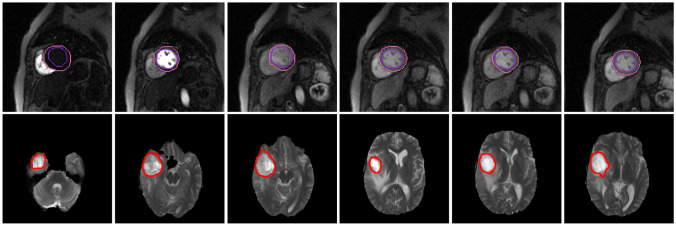
In clinical diagnosis, various sequences are often jointly used, which can be generally divided into time series and spatial series. Time series are used to continuously and dynamically observe the intensity changes in the region of interest. The diagnostically related features are often extracted from the whole series. For spatial series, signal differences in each image slice indicate the different anatomical structures. It is quite often to obtain the diagnostic related features from each slice. Therefore, we choose representative radiological series, i.e., first-pass perfusion cardiac magnetic resonance images (time series) and T2 weighted images on brain tumors (spatial series), respectively. The images used in this work are shown in Fig. 1.
Fig. 1.
The sequences used in the experiments (first row: first-pass perfusion cardiac magnetic resonance images; second row: T2 weighted images on brain tumor)
First-pass Perfusion CMR
This retrospective study was approved by the Ethics Committee of Southwest Hospital (Chongqing, China). The study cohort consisted of 50 patients with hypertrophic cardiomyopathy. For each patient, the first-pass perfusion series of mid-cavity consisted of 50 frames, while the segmentation ground truth was annotated by two experienced radiologists using the off-shelf segmentation software 3D slicer.
T2 Weighted Images on Brain Tumor
For the spatial sequences, we used the publicly available dataset BraTS2017 in our experiments [24, 25]. Each patient was scanned with 4 series, namely T1, T1CE, T2, and FLAIR, and all the images were skull-striped and re-sampled to an isotropic 1 mm3 resolution and co-registered. The ground truth of the tumor was obtained by manual segmentation given by experts. Since all the sequences were co-registered, we utilized the T2 weighted images in our experiment as it highlights the region of the tumor. In our experiment, images from 50 patients were included, and slices with brain tumors were selected from each patient.
Methods
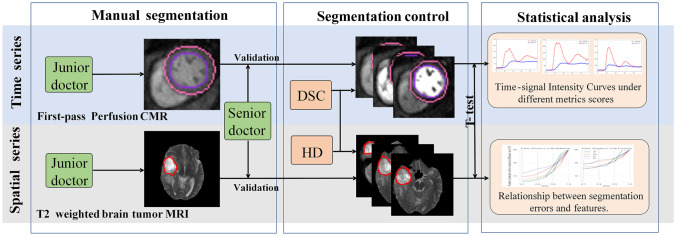
The workflow of this paper is shown in Fig. 2. Firstly, two experts manually segmented the regions of interest, namely myocardium and brain tumor. The junior one annotated the regions of interest (ROIs) in the first round, while the senior expert validated the annotations. Those validated segmentation masks were regarded as ground truth in the following experiments. Then, the degree of the segmentation errors were controlled in a systematic way, according to the widely used metrics DSC and HD. In other words, we perturbed the contours to ensure the DSC or HD between the ground truth and new ROIs meet the pre-defined values. In terms of the clinical requirement, we extracted those diagnostic related features from the ground truth and the derived segmentation, p and calculated the corresponding p values, which were used in the proposed segmentation robustness plot (SRP). The x-axis of SRP indicated the segmentation performance using the aforementioned evaluation metric, and the y-axis showed the severity of the corresponding feature changes, which indicated the correlation between segmentation errors and clinical acceptance.
Fig. 2.
The overall framework of the work (manual segmentation: the junior doctors performed a preliminary ground truth determination and the senior doctors corrected it if necessary using the off-shelf segmentation software 3D slicer; segmentation control: we systematically control the contours of ROI to generate the segmentation errors, in terms of the evaluation metrics DSC and HD; statistical analysis: large sample size T-test was utilized to verify the impact of segmentation errors on diagnostic related features)
Segmentation Metrics
To evaluate the segmentation algorithms, the results were often reported using both DSC and HD in the experiment. This is because DSC is more sensitive to the internal padding of the mask, while HD is more sensitive to the segmented boundary. Jointly using those two metrics could be a good complement to each other in evaluation. Therefore, we also use DSC and HD, but in a separate way, to help control the degree of the segmentation errors.
Dice Similarity Coefficient (DSC)
it is a statistical tool that measures the similarity between two sets of data.
| 1 |
where A is the ground truth of ROI, and is the predicted area of ROI. Hausdorff Distance (HD): it is the maximum distance of a set A to the nearest point in the other set :
| 2 |
| 3 |
| 4 |
where p is the pixel belonging to the ground truth A, and belongs to the predicted ROI .
Diagnostic Related Features
Note that the segmentation variation will inevitably cause changes in the extracted features, which might have a significant impact on clinical decisions. Therefore, it is important to explore how those clinically useful features will be affected by the segmentation errors. In this work, we extracted commonly used image features from ROIs in diagnosis and analyzed the corresponding changes with the segmentation variation. Representative types of radiological series, i.e., first-pass perfusion cardiac magnetic resonance images (time series) and T2 weighted images on brain tumors (spatial series), were utilized, respectively.
First-pass Perfusion CMR
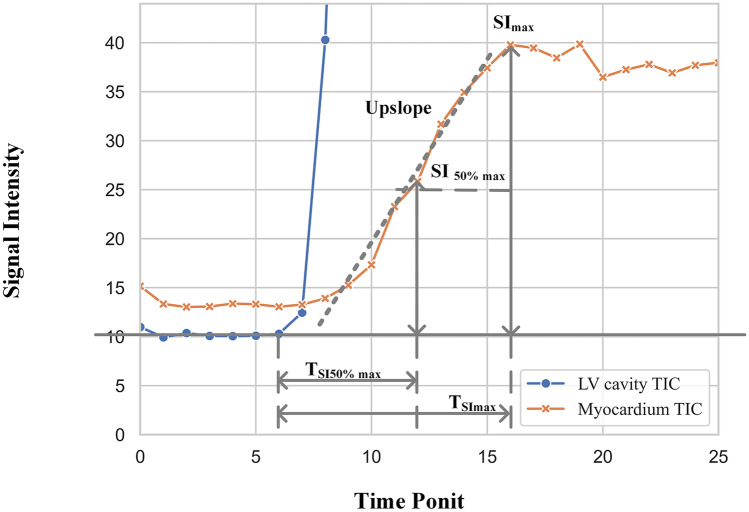
In MRI perfusion imaging, time-signal intensity curve (TIC) is often used to describe the change of signal intensity over time, which could reflect the hemodynamic information [26] and quantifying myocardial blood flow [21]. Therefore, five diagnostic related features [27, 28] derived from TIC were used in this experiment, namely maximal signal intensity, maximal signal intensity, time to maximal signal intensity, time to maximum signal intensity, and upslope (shown in Fig. 3).
Fig. 3.
The diagnostic related features of TIC from first-pass perfusion CMR
Maximal Signal Intensity ()
| 5 |
where represents the mean signal intensity before contrast injection. represents the peak intensity of time-signal intensity curve.
50% Maximal signal intensity ()
represents half of the maximum signal intensity.
Time to Maximal Signal Intensity ()
represents the time to maximum signal intensity.
Time toMaximum Signal Intensity ()
represents the time to maximum signal intensity during the first pass of contrast.
Upslope
the upslope of the myocardial or LV SI time curve, which was determined using the maximum of a linear fit of 5 consecutive images in myocardial curves (3 in the LV curves).
T2 Weighted Images on Brain Tumor
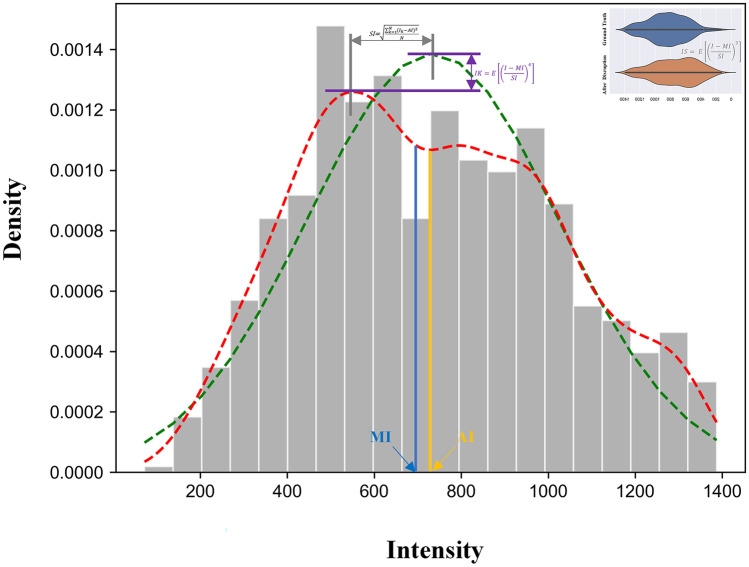
For brain tumor diagnosis, T2 weighted images were often used to extract the features for prognosis analysis [29]. Compared to T1ce and other modalities in the dataset, the signal intensity contrast of T2-weighted images between the tumor and edema is much lower. Therefore, we used this modality in the experiment to simulate the segmentation errors. Note that physicians usually judged the type of brain tumor by observing the signal distribution in the tumor area [30]. Therefore, we extracted five important features from the region of the tumor, excluding the edema, to describe the signal distribution of ROI, namely, average intensity, the standard deviation of intensity, median intensity, intensity skewness, and intensity Kurtis (shown in Fig. 4).
Fig. 4.
The diagnostic related features of T2 weighted images on brain tumor
Average Intensity (AI)
| 6 |
where is the intensity of the pixel k, and N is the number of the pixels in segmented area.
Standard Deviation of Intensity (SI)
| 7 |
Median Intensity (MI)
| 8 |
Intensity Skewness (IS)
| 9 |
where E(.) is expectantion.
Intensity Kurtis (IK)
| 10 |
Segmentation Control
To explore how the segmentation errors will affect the diagnostic related features, this work systematically enlarged or shrank ROI by controlling the contours, morphologically. This was achieved by using dilatation and corrosion algorithms in OpenCV with a 3*3 kernel. When the enlarged mask exceeds the body boundary in the image, the area from the background will be removed by using the contour detection method. The degree of the segmentation errors was produced according to the segmentation metrics, DSC or HD. For DSC between ground truth and derived segmentation, it was preset with 0.7-0.9 (with intervals of 0.1) in each slice to guide the segmentation control. For HD, it was set to 3–15 mm with intervals of 3 mm. Note that enlarging or shrinking ROI might get the same DSC or HD, but they might have different consequences on the diagnosis.
Segmentation Robustness Plot
The differences of the features extracted from the ground truth and the derived segmentation were analyzed, using the statistical method large sample size T-test to calculate the corresponding p value for each patient. Segmentation robustness plot (SRP) was proposed to build the link between evaluation metrics and clinical acceptance, where x-axis was the aforementioned segmentation metric, and y-axis showed the severity of the corresponding feature changes.
For the time series, each patient had only one group of the aforementioned features from the TIC. Therefore, to use the statistical method large sample size T-test, we need to include all the patients, and only one p value could be obtained from the same type of features. For such a situation, the y-axis of SRP showed the p values of the corresponding features calculated from ground truth and the derived segmentation. When the p value is above 0.05, the feature is regarded as robust.
For spatial series, the diagnostic related features could be extracted from each slice, and p values of the corresponding features could be calculated from each patient. Therefore, with all patients included in this experiment, the y-axis of SRP was the proportion of patients their extracted features did not have significant changes (p>0.05) in terms of corresponding segmentation errors. Relative area under curve(R-AUC) was proposed in SRR for spatial series to intuitively discriminate the robustness of the features:
| 11 |
where AUC is the area under the curve, represents the area of the rectangular area enclosed by the coordinate axes. The bigger value indicated the better robustness.
Experimental Results
The experiment was conducted with the representative types of radiological series, i.e., time series (first-pass perfusion cardiac magnetic resonance images) and spatial series (T2 weighted images on brain tumor), respectively.
Time Series: First-pass Perfusion CMR
For CMR segmentation, we control the contours of the epicardium and endocardium in each slice according to the evaluation metrics DSC and HD, respectively.
Control the Contour of the Epicardium
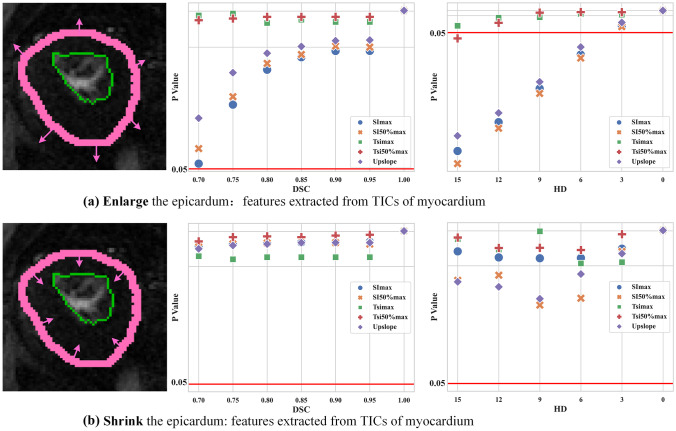
We first dilated the epicardial contours and could find that all diagnostically relevant features were stable when HD was smaller than 3 mm, and DSC was bigger than 0.7 (Fig. 5). However, when HD is bigger than 6 mm, features like , and upslope significantly changed. When shrinking epicardium, all features were relatively robust. From Fig. 5, it is highly recommended to use the features and in clinical practice or ensure the segmentation performance could reach 0.7 in DSC or 3 mm in HD.
Fig. 5.
Control the contour of epicardium: SRP of time series (values below 0.05 indicate the significant difference of the corresponding features extracted from the ground truth and the derived segmentation)
Moreover, the reliability of these features (expressed as p-values) is very sensitive to segmentation metrics like DSC and HD, which means that they will no longer be reliable after a slight decrease in DSC or a slight increase in HD (e.g., HD increases from 3 mm to 6 mm) (Fig. 5a). When the epicardial profile is reduced, the reliability of these features remains within a very safe range regardless of the change in DSC or HD (Fig. 5b).
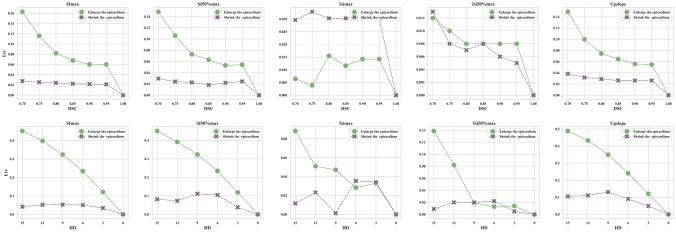
Furthermore, we also showed the relative errors Err caused by segmentation variations in Fig. 6:
| 12 |
where is the feature value obtained from the ground truth, while is the corresponding value extracted from the segmentation.
Fig. 6.
Control the contour of epicardium: the relative errors of different diagnostic related features between the ground truth and the derived segmentation
In Fig. 6, the x-axis denoted the segmentation evaluation metric (DSC or HD), and the y-axis denoted the relative errors. Note that even with the same DSC or HD, the impact of segmentation errors on the diagnosis might be significantly different. Obviously, shrinking the epicardium had less impact on the features compared to enlarging the epicardium. This was because the enlarged epicardium introduced more background information (more false positives), which would inevitably affect the shape of the TIC as a statistical result of the ROI intensity.
Control the Contour of the Endocardium
We also controlled the location of endocardium contour, which is the boundary between the myocardium and left ventricle cavity.
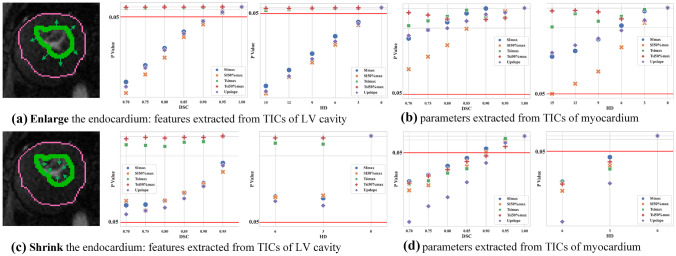
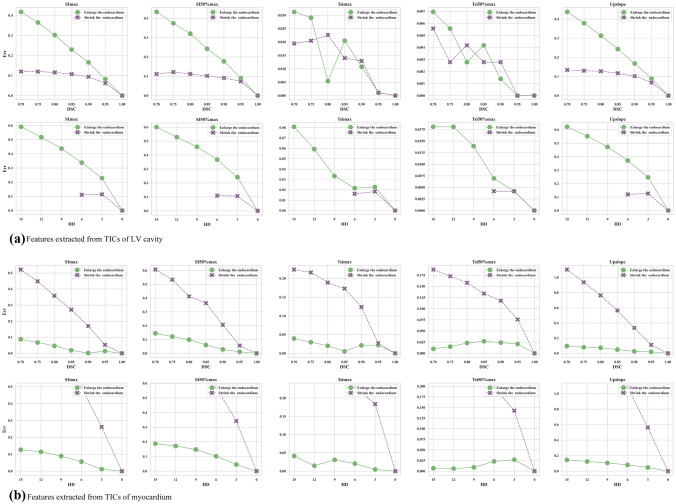
When enlarging the endocardium, the features of the left ventricle cavity changed dramatically when the DSC is smaller than 0.95 or the HD is bigger than 3 mm (Fig. 7a). Different from the features in the left ventricle cavity, the features of the myocardium were relatively robust (Fig. 7b). When shrinking the endocardium, the features of the left ventricle cavity are quite robust (Fig. 7c), but a few features of the myocardium changed significantly. This is because the errors of false positives brought more errors than false negatives (Fig. 7d). In Fig. 8a, enlarging the endocardium brought more false positives into the left ventricle cavity so that the relative errors were bigger than shrinking the endocardium. In contrast, shrinking endocardium brought more false positives into the myocardium so the relative errors were bigger.
Fig. 7.
Control the contour of endocardium: SRP of time series (values below 0.05 indicate the significant difference of the corresponding features extracted from the ground truth and the derived segmentation)
Fig. 8.
Control the contour of endocardium: the relative errors of different diagnostic related features between the ground truth and the derived segmentation
From both Figs. 5 and 7, one could find that using current evaluation metrics, DSC or HD, segmentation performance did not closely correlated with diagnostic accuracy, especially when segmentation got worse (DSC was below 0.95 or HD was larger than 3 mm). Additional information, like error type (false positives or false negatives), was important for a better understanding of how the clinical practice would be affected.
Spatial Series: T2 Weighted Images on Brain Tumor
For each patient, diagnostic related features were extracted from those slices with tumors. With all patients included in this experiment, y-axis of SRP was the proportion of patients that the extracted features did not have significant changes (p>0.05) according to the segmentation errors. From the proposed SRP (Fig. 9), the most robust feature was the one with highest R-AUC, where one could find that feature IK was the most robust feature under all kinds of circumstances. In contrast, feature AI was quite sensitive to segmentation errors, which was highly discouraged to use in clinical practice. In addition, the threshold of acceptable segmentation error can be determined by the pre-set proportion of patients without significant changes.
Fig. 9.
Segmentation robustness plot of spatial series: the proportion of patients without significant changes v.s. evaluation metrics (DSC and HD)
Discussion and Conclusion
With the advancement of deep learning, numerous automatic segmentation algorithms have delivered a good performance in terms of some evaluation metrics [31], such as DSC, IOU, HD, and ASSD et al. Rather than just focusing on the accuracy of the algorithms, some researchers start looking at some other metrics like robustness and uncertainty in the computer vision domain [32]. However, in the medical imaging domain, the association between segmentation performance and clinical acceptance is very important but rarely investigated [33]. Therefore, this paper examined the impact of segmentation errors on diagnosis systematically, where both representative types of radiological images from time and spatial series were utilized.
Note that most of the segmentation metrics were designed mainly for the morphological analysis without considering the impact on the diagnostic related features. However, an ideal segmentation metric should have a good correlation between diagnostic accuracy and the metric values. Segmentation robustness plot (SRP) was proposed to build the link between segmentation errors and clinical acceptance, where relative area under the curve (R-AUC) was designed to help clinicians to identify the robust diagnostic related features for diagnosis. The experimental results show that when DSC was above 0.95 and HD was below 3 mm, segmentation errors would not bring a significant change in most cases. However, when the segmentation got worse, it was important to identify the error type for further analysis. In addition, preliminary results show that first-order features such as average intensity are more affected by segmentation errors than texture and other second-order features such as skewness and Kurtis. This work reveals that graphical representation could visualize the correlation between image feature robustness in clinical practice and segmentation errors, which could inspire the proposal of more clinically relevant metrics for the segmentation tasks in the medical imaging domain. Using SRP, one could easily choose the metric threshold in a challenge to decide whether the segmentation performance is acceptable, objectively. Clinicians could avoid using the diagnostic related features that are severely affected by segmentation errors with the help of SRP.
In the age of deep learning, SRP can help evaluate the performance of a trained model on some specified features, but it cannot supervise the training direction of the model. In other words, SRP does not make the models perform better but only selects the models that perform well. Additionally, SRP is designed to analyze the task of the single lesion segmentation primarily. When dealing with multi-lesion segmentation tasks, the changes in features come from the influence of multiple variables, where the segmentation of different lesions will cause non-linear changes. Therefore, it is hard for the currently designed SRP to deal with such situations. For future research, one could study how segmentation errors with multiple lesions affect the clinical decision.
Author Contributions
All authors contributed to the study conception and design. Zihang Chen was responsible for programming in this work. Jiafei Chen, Jun Zhao, Bowei Liu, and Shuanglong Jiang were responsible for annotation. Dongyue Si and Haiyan Ding raised scientific questions. Yongjian Nian, Xiaochao Yang, and Jingjing Xiao mainly designed the experiment and analyzed the experimental results.
Funding
The present study was supported by National Natural Science Foundation of China (NO. 62076247, NO. 61701506), Independent Research Project of Medical Engineering Laboratory of Chinese PLA General Hospital (2022SYSZZKY07) and and Chongqing science and Technology Bureau (NO.cstc2020jscx-msxm0165).
Declarations
Ethics Approval
This study was performed in line with the principles of the Declaration of Helsinki. Approval was granted by the Ethics Committee of Southwest Hospital (Chongqing, China) (Date July 16, 2021/No.(B) KY2021067).
Consent to Participate
Informed consent was obtained from all individual participants included in the study.
Consent to Publish
The authors affirm that human research participants provided informed consent for publication.
Competing Interests
The authors declare no competing interests.
Footnotes
Publisher's Note
Springer Nature remains neutral with regard to jurisdictional claims in published maps and institutional affiliations.
Zihang Chen, Jiafei Chen and Jun Zhao contributed equally to this work.
Contributor Information
Zihang Chen, Email: zihangchen@cqu.edu.cn.
Jiafei Chen, Email: t2mu.singular@163.com.
Jun Zhao, Email: zhaojun555@aliyun.com.
Bowei Liu, Email: liubw19@mails.tsinghua.edu.cn.
Shuanglong Jiang, Email: 1041977810@qq.com.
Dongyue Si, Email: sdy18@mails.tsinghua.edu.cn.
Haiyan Ding, Email: dinghy@mail.tsinghua.edu.cn.
Yongjian Nian, Email: yjnian@126.com.
Xiaochao Yang, Email: xcyang@tmmu.edu.cn.
Jingjing Xiao, Email: shine636363@sina.com.
References
- 1.Traverso A, Wee L, Dekker A, et al. Repeatability and reproducibility of radiomic features: a systematic review. International Journal of Radiation Oncology Biology Physics. 2018;102(4):1143–1158. doi: 10.1016/j.ijrobp.2018.05.053. [DOI] [PMC free article] [PubMed] [Google Scholar]
- 2.Hesamian MH, Jia W, He X, et al. Deep learning techniques for medical image segmentation: achievements and challenges. Journal of digital imaging. 2019;32(4):582–596. doi: 10.1007/s10278-019-00227-x. [DOI] [PMC free article] [PubMed] [Google Scholar]
- 3.Figtree GA, Lønborg J, Grieve SM, et al (2011) Cardiac magnetic resonance imaging for the interventional cardiologist. JACC: Cardiovascular Interventions 4(2):137–148 [DOI] [PubMed]
- 4.Salerno M, Kramer CM (2013) Advances in parametric mapping with cmr imaging. JACC: Cardiovascular imaging 6(7):806–822 [DOI] [PMC free article] [PubMed]
- 5.Sherer MV, Lin D, Elguindi S, et al. Metrics to evaluate the performance of auto-segmentation for radiation treatment planning: A critical review. Radiotherapy and Oncology. 2021;160:185–191. doi: 10.1016/j.radonc.2021.05.003. [DOI] [PMC free article] [PubMed] [Google Scholar]
- 6.Moccia S, De Momi E, El Hadji S, et al (2018) Blood vessel segmentation algorithms–review of methods, datasets and evaluation metrics. Computer methods and programs in biomedicine 158:71–91 [DOI] [PubMed]
- 7.Cao H, Wang Y, Chen J, et al (2022) Swin-unet: Unet-like pure transformer for medical image segmentation. ECCVW abs/2105.05537
- 8.Chen J, Lu Y, Yu Q, et al (2021) Transunet: Transformers make strong encoders for medical image segmentation. arXiv preprint arXiv:2102.04306
- 9.Kwan AC, Salto G, Cheng S, et al. Artificial intelligence in computer vision: cardiac mri and multimodality imaging segmentation. Current Cardiovascular Risk Reports. 2021;15(9):1–8. doi: 10.1007/s12170-021-00678-4. [DOI] [PMC free article] [PubMed] [Google Scholar]
- 10.Wang K, Zhang X, Zhang X, et al. Eanet: Iterative edge attention network for medical image segmentation. Pattern Recognition. 2022;127:108636. doi: 10.1016/j.patcog.2022.108636. [DOI] [Google Scholar]
- 11.Rees GS, Wright WA, Greenway P (2002) Roc method for the evaluation of multi-class segmentation/classification algorithms with infrared imagery. In: BMVC, pp 1–10
- 12.Shumway-Cook A, Brauer S, Woollacott M. Predicting the probability for falls in community-dwelling older adults using the timed up & go test. Physical therapy. 2000;80(9):896–903. doi: 10.1093/ptj/80.9.896. [DOI] [PubMed] [Google Scholar]
- 13.Taha AA, Hanbury A. Metrics for evaluating 3d medical image segmentation: analysis, selection, and tool. BMC medical imaging. 2015;15(1):1–28. doi: 10.1186/s12880-015-0068-x. [DOI] [PMC free article] [PubMed] [Google Scholar]
- 14.Rand WM. Objective criteria for the evaluation of clustering methods. Journal of the American Statistical association. 1971;66(336):846–850. doi: 10.1080/01621459.1971.10482356. [DOI] [Google Scholar]
- 15.Kellman P, Arai AE (2007) Imaging sequences for first pass perfusion–a review. Journal of Cardiovascular Magnetic Resonance 9(3):525–537 [DOI] [PubMed]
- 16.Fenster A, Chiu B (2006) Evaluation of segmentation algorithms for medical imaging. In: 2005 IEEE Engineering in Medicine and Biology 27th Annual Conference, IEEE, pp 7186–7189 [DOI] [PubMed]
- 17.Dice LR. Measures of the amount of ecologic association between species. Ecology. 1945;26(3):297–302. doi: 10.2307/1932409. [DOI] [Google Scholar]
- 18.Müller D, Soto-Rey I, Kramer F (2022) Towards a guideline for evaluation metrics in medical image segmentation. arXiv preprint arXiv:2202.05273 [DOI] [PMC free article] [PubMed]
- 19.Jang J, Ngo LH, Mancio J, et al (2020) Reproducibility of segmentation-based myocardial radiomic features with cardiac mri. Radiology: Cardiothoracic Imaging 2(3) [DOI] [PMC free article] [PubMed]
- 20.Hsu LY, Jacobs M, Benovoy M, et al (2018) Diagnostic performance of fully automated pixel-wise quantitative myocardial perfusion imaging by cardiovascular magnetic resonance. JACC: Cardiovascular Imaging 11(5):697–707 [DOI] [PMC free article] [PubMed]
- 21.Biglands J, Magee D, Boyle R, et al. Evaluation of the effect of myocardial segmentation errors on myocardial blood flow estimates from dce-mri. Physics in Medicine & Biology. 2011;56(8):2423. doi: 10.1088/0031-9155/56/8/007. [DOI] [PubMed] [Google Scholar]
- 22.Jathanna N, Podlasek A, Sokol A, et al (2021) Diagnostic utility of artificial intelligence for left ventricular scar identification using cardiac magnetic resonance imaging–a systematic review. Cardiovascular digital health journal 2(6):S21–S29 [DOI] [PMC free article] [PubMed]
- 23.Saltybaeva N, Tanadini-Lang S, Vuong D, et al (2022) Robustness of radiomic features in magnetic resonance imaging for patients with glioblastoma: Multi-center study. Physics and imaging in radiation oncology [DOI] [PMC free article] [PubMed]
- 24.Bakas S, Akbari H, Sotiras A, et al (2017) Segmentation labels and radiomic features for the pre-operative scans of the tcga-lgg collection. The cancer imaging archive 286
- 25.Bakas S, Akbari H, Sotiras A, et al (2017) Advancing the cancer genome atlas glioma mri collections with expert segmentation labels and radiomic features. Scientific data 4(1):1–13 [DOI] [PMC free article] [PubMed]
- 26.Klement EP, Pap E, Mesiar R (2000) Trends in logic. netherlands
- 27.Christoph, Klein, Eike, et al (2009) Evaluation of contrast wash-in and peak enhancement in adenosine first pass perfusion in patients post bypass surgery. Journal of Cardiovascular Magnetic Resonance [DOI] [PMC free article] [PubMed]
- 28.Schulz-Menger J, Bluemke DA, Bremerich J, et al (2020) Standardized image interpretation and post-processing in cardiovascular magnetic resonance - 2020 update. Journal of Cardiovascular Magnetic Resonance 22 [DOI] [PMC free article] [PubMed]
- 29.Rugg-Gunn F, Boulby P, Symms M, et al. Whole-brain t2 mapping demonstrates occult abnormalities in focal epilepsy. Neurology. 2005;64(2):318–325. doi: 10.1212/01.WNL.0000149642.93493.F4. [DOI] [PubMed] [Google Scholar]
- 30.Kniep HC, Madesta F, Schneider T, et al. Radiomics of brain mri: utility in prediction of metastatic tumor type. Radiology. 2019;290(2):479–487. doi: 10.1148/radiol.2018180946. [DOI] [PubMed] [Google Scholar]
- 31.Isensee F, Jaeger PF, Kohl S, et al (2020) nnu-net: a self-configuring method for deep learning-based biomedical image segmentation. Nature Methods [DOI] [PubMed]
- 32.de Jorge P, Volpi R, Torr P, et al (2023) Reliability in semantic segmentation: Are we on the right track? CVPR abs/2303.11298
- 33.Zhang Z, Xiao J, Wu S, et al. Deep convolutional radiomic features on diffusion tensor images for classification of glioma grades. Journal of Digital Imaging. 2020;33(4):826–837. doi: 10.1007/s10278-020-00322-4. [DOI] [PMC free article] [PubMed] [Google Scholar]


