

Abstract
The COVID-19 pandemic has been adversely affecting the patient management systems in hospitals around the world. Radiological imaging, especially chest x-ray and lung Computed Tomography (CT) scans, plays a vital role in the severity analysis of hospitalized COVID-19 patients. However, with an increasing number of patients and a lack of skilled radiologists, automated assessment of COVID-19 severity using medical image analysis has become increasingly important. Chest x-ray (CXR) imaging plays a significant role in assessing the severity of pneumonia, especially in low-resource hospitals, and is the most frequently used diagnostic imaging in the world. Previous methods that automatically predict the severity of COVID-19 pneumonia mainly focus on feature pooling from pre-trained CXR models without explicitly considering the underlying human anatomical attributes. This paper proposes an anatomy-aware (AA) deep learning model that learns the generic features from x-ray images considering the underlying anatomical information. Utilizing a pre-trained model and lung segmentation masks, the model generates a feature vector including disease-level features and lung involvement scores. We have used four different open-source datasets, along with an in-house annotated test set for training and evaluation of the proposed method. The proposed method improves the geographical extent score by 11% in terms of mean squared error (MSE) while preserving the benchmark result in lung opacity score. The results demonstrate the effectiveness of the proposed AA model in COVID-19 severity prediction from chest X-ray images. The algorithm can be used in low-resource setting hospitals for COVID-19 severity prediction, especially where there is a lack of skilled radiologists.
Keywords: Chest x-ray analysis, Anatomy-aware modeling, COVID-19 severity prediction
Introduction
The novel Coronavirus (COVID-19) pandemic has become a grave public health concern worldwide. According to the World Health Organization (WHO) [1], there were more than 683 million confirmed COVID-19 cases worldwide and 6.8 million deaths as of now in 2023. With the increasing number of patients, the need for streamlined patient management has become extremely important. Disease severity monitoring can be of significant importance for the timely allocation of hospital resources and predicting which patients may need intensive care unit (ICU) support. Biosensors, Artificial intelligence (AI), and the Internet of Medical Things (IoMT) have paved the pathway of modern COVID-19 diagnostic methods [2]. Chest x-ray imaging is a widely available non-invasive tool used for frequent assessment of COVID-19 severity. Although the High-Resolution and Computer-Aided Computed Tomography methods are best suited for COVID-19 severity assessment [3, 4], CXRs can also be useful for regular monitoring due to their relative speed, low cost, availability, and portability, especially in low-resource settings. With the advent of portable equipment, CXR imaging is more reasonable for critically ill patients who cannot be transported for a CT scan.
During the peak of the pandemic, numerous admitted patients endured additional constraints in terms of medical image interpretation in the hospitals. In high-income countries, high patient volumes may result in a higher workload on the existing radiologists, whereas in low-income countries, there may not be a sufficient number of skilled radiologists to perform the necessary image interpretation. In these circumstances, automated analysis of CXRs for the severity prediction of COVID-19 can be of significant value, as the resulting analysis could be potentially used for making decisions regarding escalation or de-escalation of care and monitoring of treatment efficacy.
In recent times, Artificial intelligence (AI) algorithms, particularly deep learning, have demonstrated remarkable progress in the automated interpretation of medical images. During high workloads and in locations where the number of radiologists is limited, automated CXR analysis can play a vital role in efficient and effective patient management. Previous research already revealed that well-trained AI algorithms could perform at or above the level of third-year radiology residents when it comes to identifying various characteristics on radiographs [5]. Thus, effectively trained AI-based algorithms for automated CXR analysis tools can significantly benefit low-resource hospital systems.
Automatic assessment of COVID-19 using CXR images has been an active area of research since the inception of this pandemic [6–12]. Most previous work focuses on the detection of COVID-19 pneumonia from CXR images. However, in hospital settings, automatic detection of the presence of COVID-19 is not of significant value as most admitted patients are confirmed through RT-PCR tests. Methods for automatic assessment of COVID-19 severity can be more valuable as they can be used for monitoring treatment efficacy, especially in the ICU. Therefore, in this work, we focus on the assessment of COVID-19 severity using an existing dataset [13]. In Cohen et al. [13], a COVID-19 pneumonia severity prediction dataset was released including two different disease severity metrics, (i) the Geographic Extent Score, and (ii) the lung Opacity Score. The geographic extent score represents the extent of lung involvement, whereas opacity score signifies the degree of lung opacity.
The main contributions of this paper are as follows:
We propose a deep learning-based unified model that integrates anatomy information with the feature extraction scheme to increase the performance of the architecture for COVID-19 severity scoring
A regression model that uses the extracted features for COVID-19 severity scoring assesses lung involvement in COVID-19 patients.
Experimental evaluation on an available COVID-19 CXR dataset and validation on an in-house annotated CXR dataset proves the efficiency of this method.
This model can be incorporated into teleradiology platforms to reduce the number of severe COVID-19 patients by providing early predictive severity scores.
Motivation for Anatomy-Aware Analysis
COVID-19 pneumonia mainly increases lung density which is seen as whiteness in the radiography images depending on the severity of the pneumonia. When hazy gray areas partially obscure dark lung markings in CXR, the observation is referred to as the ground-glass opacity. A ground-glass opacity is a hazy increase in attenuation in interstitial and alveolar processes. Linear opacities (Peripheral, coarse, horizontal white lines, bands, or reticular changes) may also be seen along with ground-glass opacity. In severe cases, lung markings are completely lost because of whiteness, which is referred to as consolidation. These changes are more likely to be peripheral and lower zones, but the whole lung can also be affected. Bilateral lung involvement is most commonly observed. The appearance of nodules, pneumothorax, or pleural effusion might be incidental for COVID-19 cases [14]. Since the infected regions are always associated with the lungs, a trained radiologist naturally interprets a COVID-19 CXR image by first outlining the anatomical structure of the lung. Similarly, an anatomy-informed algorithm can analyze the CXR images for a superior analysis and subsequent severity prediction. For example, if the lung regions are pre-identified, the deep learning models can be trained using higher resolution images only of the relevant portion of the images. We refer to this type of method as being anatomy-aware.
This paper proposes a novel COVID-19 severity detection method for chest x-ray images using a lung-annotated anatomy-aware deep learning model. The proposed model integrates the generic x-ray image features with pre-identified anatomical information extracted using an auxiliary segmentation model. The proposed model generates both disease-level features and lung involvement percentage to estimate the severity of pneumonia in COVID-19 patients.
Related Work
Previous work on the automated assessment of CXR images for COVID-19 has focused on disease classification, segmentation, and severity prediction. Transfer learning techniques have proven to be effective ways to classify COVID-19 from CXR images. In [15], ResNet50, InceptionV3, and InceptionResNetV2 architectures are used to classify COVID-19 disease from CXR images, achieving accuracies of about 98.0%, 97.0%, and 87%, respectively. A number of deep learning architectures have been explored to classify COVID-19 disease from CXR images [6–11, 16–22]. Generative Adversarial Network (GAN)-based data augmentation to detect COVID-19 from CXR images has also been studied, and the result surpasses other augmentation methods [23, 24]. A densely attention-based deep network with high accuracy was proposed for automatic COVID-19 recognition [25]. In [26], a majority voting-based classifier ensemble of five benchmark algorithms was shown to provide promising results in detecting COVID-19 from CXR images. In [27], a wavelet-based depthwise convolution network with Grad-CAM visualization is used for the diagnosis of COVID-19. DMFL-Net, a deep learning framework is proposed ensuring latency, energy usage, and privacy of sharing data across hospitals [28]. A reliable COVID-19 detection architecture (ReCovNet) was developed to detect COVID-19 out of 14 different thoracic diseases using CXRs compiling QaTa-COVID-19 dataset of their previous study [29, 30]. DarkCovidNet, a deep learning model was proposed for both multi and binary classification of COVID-19 with an accuracy of 87.02% and 98.08% for multi and binary class, respectively [31]. Several approaches have been explored to reduce redundant input information using different feature extraction approaches [32–39]. In [40], pre-trained BiT models were analyzed, where DenseNet (using an additional Dense layer with 512 perceptrons) performed best with 92% classification efficiency for automatic COVID-19 prediction. However, none of these previous methods consider the analysis of lung anatomical structure for disease localization or classification. On a separate note, although the COVID-19 detection methods using CXR have achieved promising results, the detection method is not suitable for replacing a traditional RT-PCR diagnostic test. Several approaches have been explored to develop an architecture for both CXRs and CT scan images [41, 42]. In [43], a lightweight CNN-tailored deep neural network (DNN) is proposed to detect COVID-19 from both CT scans and CXRs using a small number of images. Transfer learning-based feature extraction with a capsule network has also been used on both CXRs and CT images to improve performance and avoid overfitting [44]. In our experience, radiologists and general physicians are capable of detecting COVID-19 markers from CXR images, so automatic detection of its presence may not provide a significant advantage. However, disease severity analysis may be more valuable in resource-constrained settings.
There has also been a considerable amount of work on COVID-19 diseased region segmentation in recent years. In [45], a deep neural network-based method is used for the detection of COVID-19 symptoms from CXR images, and gradient-guided class activation maps (Grad-CAM++) and layer-wise relevance propagation (LRP) are used to highlight class-discriminating regions. A segmentation-based deep fusion network is used to classify 14 thoracic diseases using a CXR image, where local lung region images are extracted with discriminative features for improved performance [46]. Anatomy-XNet, an anatomy-aware attention-based network incorporating the spatial features guided by the pre-identified anatomy regions proves the efficacy of utilizing the segmentation knowledge to improve the classification of 14 thoracic diseases [47]. Unsupervised clustering techniques are also used to localize the suspected abnormal regions in the lung field of the CXR images [48]. Additionally, integrating an attention gate (AG) into a standard convolutional neural network (CNN) increases the precision and predictive accuracy of automatic segmentation of COVID-19 regions in CT images using minimum computation [49].
Previous work on COVID-19 severity prediction from CXR images has mainly used variants of deep learning architectures for transfer learning [13, 50–53]. However, these methods also do not explicitly use anatomical information to interpret similar to a radiologist.
Methodology
This work proposes a unified framework in which an anatomy-aware (AA) deep learning model performs feature extraction while a regression model performs severity prediction. The overview of the entire architecture is illustrated in Fig. 1.
Fig. 1.

Overview of the proposed Anatomically Aware Network used for COVID-19 severity prediction. We use a Cycle-GAN trained image to the label generator for lung segmentation. The lung information is then incorporated in the original radiographs through the anatomy coding block which performs Eq. 2. This is followed by the Densenet-121 feature extraction and the gating function. In path I, we use Feature Pyramid Attention for improved pixel-level attention and in consequence, generating five diseases (Atelectasis, Consolidation, Edema, Pleural Effusion, and consolidation) level features. On the other hand, path II is used for class-wise heatmap generation with PCAM pooling. The lung involvement score is calculated using the generated heatmaps and lung masks. Finally, disease-level features and lung involvement scores are used for regression
The proposed AA model consists of a pre-processing model and a backbone model. The pre-processing model, named the Anatomy Annotation (ANT) model, infuses the anatomy structure information of CXRs, and the backbone model is used for dense pooling. Then, the feature map is passed through a gating system consisting of two paths. One path utilizes the Feature Pyramid Attention (FPA) module [54, 55] for improved pixel-level attention and extraction of features. This feature map is then pooled to obtain the disease-level features (feat 1). The other path uses Probabilistic Class Activation Map (P-CAM) pooling [55], which is known to have excellent localization ability. We generate disease-wise heatmaps with P-CAM pooling and calculate the lung involvement of each disease in decimal form (feat 2). The disease-level features and the percentage of lungs covered by the heatmaps are used as feature vectors and concatenated to generate the final feature vector. Finally, a linear regression model is applied to this feature vector to obtain the COVID-19 severity scores.
Anatomy Annotation Block
To incorporate the anatomical features in the AA model it is important to emphasize on different anatomical structures, e.g., lungs, heart, ribs, clavicles, diaphragm, etc. In this work, we present a novel pre-processing method termed as Anatomy Informed Annotation.
To perform lung segmentation, we employ a Cycle-GAN-based semi-supervised method that has shown superior performance compared to current methods for this task [56, 57]. The entire architecture is illustrated in Fig. 2. The first generator (), which corresponds to the segmentation network that we want to obtain, learns a mapping from an image to its segmentation labels. The first discriminator () attempts to differentiate these generated labels from real segmentation masks. Conversely, the second generator () learns to map a segmentation mask to its original x-ray image. In our semi-supervised segmentation setting, this generator is only used to improve the training procedure. Similarly, the second discriminator () receives an image as input and predicts whether this image is real or generated. To enforce cycle consistency, the generators are trained such that feeding the labels generated by for an image into provides the same image, and passing back to the image generated by for a segmentation mask gives the same mask. We use the SCR dataset segmentation masks and 200 synthetic segmentation masks obtained from the Stanford Chexpert dataset (generated by a pre-trained U-Net [58]) as labeled chest X-rays. In this way, we generate segmentation masks for the entire Chexpert dataset in a semi-supervised way, using the anatomy-informed annotation.
Fig. 2.

The proposed Cycle-GAN-based architecture for semi-supervised lung segmentation. and are the two generators, where and work as discriminators. These four networks are trained simultaneously
Let be a chest X-ray image and be the generated segmentation mask. The output of the neural network, which performs anatomy-informed segmentation, can be expressed as a function:
| 1 |
where k is the kernel size, s is the stride or subsampling factor, and is the layers of the neural network which is determined by the layer type. The output is used for merging anatomy information in the original CXR image, . We can denote the RGB vector image as three separate column vectors, like, . These column vectors can be denoted as three RGB channel column matrices. We can write as, . Then this data vector is infiltrated by a gray-scale segmentation mask, , which is composed of column vectors generated by the neural network shown in Eq. 1.
| 2 |
We can find the anatomy-informed image using Eq. 2, where is the identity matrix, is a hyper-parameter matrix for controlling the measures of infiltration in a specific RGB channel. In order to keep the actual information of the chest radiographs as much as possible, only the Blue channel has been infiltrated with the anatomical information in a small amount, so the hyper-parameter matrix, can be written as . This anatomy-informed image, , is then fed into the backbone model.
Backbone Model
The backbone model is a traditional deep learning classification network used in transfer learning. In this case, we use Densenet-121 [59] as its dense block has been well-known for its feature-reuse capability during feature extraction. Training this model using the Anatomy-annotated images, , ensures that the model is aware of the chest radiograph anatomy.
Feature Pyramid Attention
To produce improved pixel-level attention, we incorporate a Feature Pyramid Attention (FPA) module [54] into the system. The Pyramid Attention module first fuses features from two different branches: three pyramid scales convolution (n = 3,5,7) and origin features from CNNs going through a convolution. Then, a global average pooling branch feature is added with the output features to select the discriminative multi-resolution feature representation. When these features overlap significantly, final pooling is applied to extract the disease-level features (pre-softmax or pre-sigmoid output).
P-CAM Pooling
We use P-CAM pooling for improved heatmap generation. P-CAM pooling explicitly leverages the excellent localization ability of CAM [60] during training in a probabilistic fashion. The backbone network first processes the input CXR image and generates a feature map. Then, for a particular disease label, such as “Consolidation,” each feature embedding within the feature map goes through a fully connected (FC) layer implemented as a convolutional layer and generates the class activation score that monotonically measures the disease likelihood of each embedding. It is further bounded with the sigmoid function and interpreted as the disease probability of each embedding. Finally, the output probability map is normalized to attention weights of each embedding, following the multiple-instance learning (MIL) framework, which is used to pool the original feature map by weighted average pooling. The pooled embedding goes through the same FC layer introduced above and generates the image-level disease probability for training. During inference time, the probability map is directly used for localization. Then, we apply simple hyper-parameter thresholding to obtain disease regions. Finally, for the disease d, we define its activation score as follows:
| 3 |
where is lung segment (right and left both stacked), is the d region of the disease created from heatmap. The summation is across the segment and region’s height and width. According to Eq. 3, disease activation will be between 0 to 1.
Data Sources
We use four different datasets for the training and evaluation of the proposed COVID-19 severity detection framework. These include chest x-ray image datasets including anatomy segmentation masks and disease labels. The datasets are as follows:
JSRT Dataset
The JSRT dataset [61] consists of 247 images (154 nodule and 93 non-nodule images), with a resolution of . This dataset also includes patients information such as: age, gender, diagnosis (malignant or benign), X and Y coordinates of nodule, simple diagram of nodule location.
SCR Dataset
SCR dataset [62] is a database of posterior-anterior chest radiographs where the manual segmentation of lungs, heart, and clavicles is provided. This dataset includes chest radiographs of 247 subjects where annotations of the anatomical structures of the images of the JSRT database, e.g., left lung, right lung, heart, left clavicle, and right clavicle, are included.
Stanford Chexpert Dataset
The Chexpert dataset [63] is a large public dataset for chest x-ray interpretation. This dataset contains 224, 316 radio-graphic images of 65, 240 patients labeled with 14 observations such as the following: Atelectasis, Cardiomegaly, Consolidation, Edema, Pleural Effusion, Pneumonia, Pneumothorax, Enlarged Cardiom., Lung Lesion, Lung Opacity, Pleural Other, Fracture, Support Devices, No Finding.
COVID-19 Pneumonia Severity
The COVID-19 Pneumonia Severity Dataset [13] is a small dataset with 94 images, where each corresponding image has two severity scores: the geographic extent score and the opacity score. The geographic extent score denotes the extent of lung involvement by ground-glass opacity or consolidation for each lung. Here, 0 = no involvement, 1 = <25% involvement, 2 = 25–50% involvement, 3 = 50–75% involvement, and 4 = >75% involvement. The total extent score ranges from 0 to 8, including both lungs. On the other hand, the opacity score signifies the degree of opacity for each lung. Here, 0 = no opacity, 1 = ground-glass opacity, 2 = consolidation, and 3 = white-out. This score ranges from 0 to 6, accumulating both lungs. The labeling of the geographical extent and opacity scores is shown in Fig. 3.
Fig. 3.
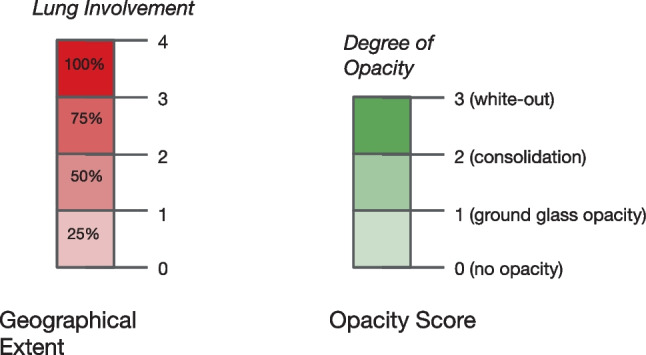
Labeling of geographical extent and opacity score
Dataset Organization
In this work, we only use lung annotations for our experiments. First, a U-Net model is trained on the JSRT dataset using SCR labels for lung segmentation. This U-Net is then applied for initially generating 200 lung masks from the Chexpert dataset. Due to dataset mismatch, the U-Net performance on CheXpert is inferior compared to the JSRT data. However, these particular 200 images and their corresponding lung annotations are selected through manual examination to provide an adequate lung mask. These 200 synthetically labeled images together with SCR clinical ground truth annotations are later used for the lung annotation of the entire Chexpert dataset using the Cycle-GAN-based semi-supervised segmentation approached discussed in the “Anatomy Annotation Block” section. Finally, these lung segments are used for appending anatomical structural information based on Eq. (2) on the original CheXpert images. These anatomy-annotated x-ray images are then used for training the Densnet121-FPA and Densnet121-PCAM models. The datasets utilized in this study are summarized in Table 1.
Table 1.
Datasets required for the training and evaluation of the proposed framework
| Dataset | Number of CXRs |
|---|---|
| JSRT Dataset [61] | 247 CXRs with patients information |
| SCR Dataset [62] | 247 CXRs with annotated anatomical information |
| Stanford Chexpert Dataset [63] | 224,316 CXRs with 14 observations |
| COVID-19 Pneumonia Severity Dataset [13] | 94 images with geographic extent score and opacity score |
| In-house Dataset | 12 independent CXRs annotated by experienced radiologist |
To evaluate the performance of our framework, we use the COVID-19 Pneumonia severity dataset [13]. We perform prediction tasks on a held-out test set using a 5-fold cross-validation scheme. An overall flow diagram describing the data organization and experimental design of this paper is illustrated in Fig. 4.
Fig. 4.

Dataset organization and overall flow diagram in the feature extractor training and regression training/testing phases
Experimental Evaluation
Training Phase
In the training phase, we train a U-net model on the SCR dataset. We infer this U-net model on the 200 selected Stanford Chexpert images and generate lung segmentation masks. These 200 synthetic labels together with SCR ground truth labels are used to train the Cycle-GAN model. Next, we generate the lung segments for the entire Chexpert dataset and incorporate them within the x-ray images using Eq. (2). Afterward, we train our feature vector generation module using these lung-annotated radiographs. The Densenet121-FPA/PCAM model is trained using the following training protocols. Densenet initialization is done by ImageNet weights [64], the batch size is set to 24, images are resized to , and the binary cross-entropy (BCE) loss is used. The training is done for 5 epochs on 3 RTX 2080ti graphics processing units (GPUs). We use this model for feature vector extraction.
Prediction Phase
In the prediction stage, we use two different types of features for the regression analysis. The first type consists of the outputs from the Densenet121-FPA classifier pipeline considering specific lung-related diseases. These diseases include Edema, Consolidation, Atelectasis, and Pleural Effusion. The second type of feature includes the activation values calculated from the disease activation as defined in Eq. (3) considering the same lung-related diseases. In total, we have a maximum of 8 feature parameters that are available for disease severity prediction via regression. During our experiments, we have selected different combinations of these features for linear regression. We report the mean squared error (MSE), mean absolute error (MAE), and correlation coefficient as performance metrics comparing the predicted COVID-19 severity and the ground truth for the geographic extent and opacity scores. The results are summarized in Table 2.
Table 2.
Performance evaluation of the proposed COVID-19 severity prediction architecture compared to existing models. In the table: 3 diseases include: Atelectasis, Edema and Consolidation related features. In 4 diseases features Pleural Effusion related features are added. Also results have been generated with the individual disease and the best one is shown as single class (like in case of Densenet-FPA with AA, Edema has the best correlation with the geographic extent. These results also compared with the baseline scores from Cohen et al. [13])
| Task | Method | Features | MSE | MAE | R2 |
|---|---|---|---|---|---|
| Geographical Extent Score | Densenet-FPA without AA | 3 diseases | |||
| 4 diseases | |||||
| single disease | |||||
| Densenet-FPA with AA | 3 diseases | ||||
| 4 diseases | |||||
| single disease | |||||
| Densenet-FPA with AA and Disease Activation features | 3 diseases | ||||
| 4 diseases | |||||
| single disease | |||||
| Cohen et al. [13] | lung opacity | ||||
| Opacity Score | Densenet-FPA without AA | 3 diseases | |||
| 4 diseases | |||||
| single disease | |||||
| Densenet-FPA with AA | 3 diseases | ||||
| 4 diseases | |||||
| single disease | |||||
| Densenet-FPA with AA and Disease Activation features | 3 diseases | ||||
| 4 diseases | |||||
| single disease | |||||
| Cohen et al. [13] | lung opacity |
Overall Results
Our baseline model using Densenet121-FPA without the proposed anatomy-aware (AA) block provides very similar results as reported in [13]. In terms of geographical extent score, Densenet121-FPA and [13] provide MSE scores of and , respectively (p-value = ). In the case of lung opacity score, Densenet121-FPA and [13] provide MSE scores of and (p-value = ), respectively. Thus, we can conclude that the baseline model consisting of the Densenet121-FPA pipeline is equivalent to [13] in terms of performance and statistical significance. Table 2 also shows that the overall performance improves after including the anatomy-aware block.
The best-performing model is Densenet121-FPA, with the AA block included in geographic extent and opacity scores. In terms of geographical extent score, the MSE improves from to after including the AA block over the baseline architecture. On the other hand, for lung opacity score, the MSE improves from to after including the AA block along with the baseline model. However, Table 2 also shows that including the disease activation score does not provide the best result for the prediction of lung opacity score. Overall, analyzing the results of Table 2 implies that including additional anatomical information to the competitive baseline model further increases the ability of the system for disease severity prediction. In Fig. 5, we show a few example images along with predicted and ground truth COVID-19 severity scores. Figure 6 shows the comparison between our model’s performance with human annotation in a 5-fold cross-validation setup for geographic extent and lung opacity scores, respectively. The plots again indicate a high correlation between the ground truth disease severity and the predicted value.
Fig. 5.

Comparison of predicted (Pred.) and ground truth/actual (Act.) scores of selected x-ray images for geographical extent score (Geo.) and lung opacity score (Op.)
Fig. 6.
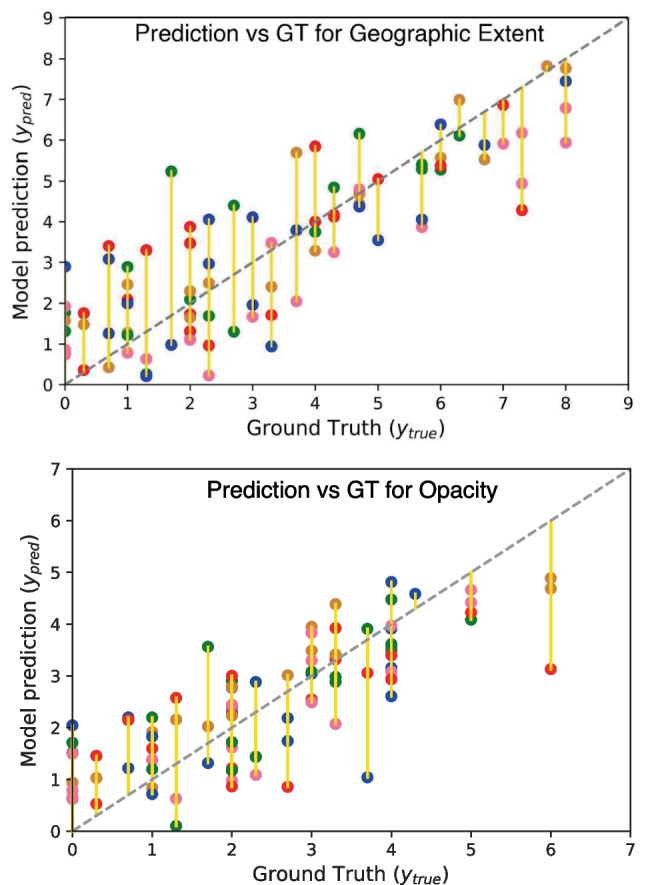
Model’s prediction comparison with ground truth (GT). Here different colored Cartesian coordinates represent different folds in 5-fold cross-validation settings
Evaluation on In-house Annotated Data
In order to validate the performance of the proposed method on an independent test set, we selected a small set of chest x-ray images and performed annotation by an experienced radiologist. In this study, 12 chest x-ray images were selected from a separate COVID-19 dataset. The same severity scoring method used in [13] was followed during the in-house annotation by the experienced radiologist. The geographic extent and lung opacity scores provided by our radiologist and the proposed anatomy-aware model are summarized in Table 3 and Fig. 7. We found significant improvement in the geographic extent score and opacity score (p-value ) compared with [13] using the selected CXRs. As evident from the results, our model shows low MAE values for both geographic extent and lung opacity scores. However, the MSE is found to be lower for lung opacity score compared to that of the geographic extent scores. These results further demonstrate the effectiveness of the proposed method. However, we acknowledge that this independent validation set is small in size. Further evaluation on a larger independent dataset would provide more convincing evidence of the effectiveness of the proposed method.
Table 3.
Evaluation of the proposed COVID-19 severity prediction model on Selected Chest X-ray images annotated by an In-house experienced radiologist
| Scoring Method | MAE | MSE |
|---|---|---|
| Geographical Extent Score | 1.55±0.98 | 3.35 |
| Opacity Score | 0.62 | 0.59 |
Fig. 7.

a Predicted value and ground truth of geographical extent score of selected chest X-ray images annotated by an In-house experienced radiologist, and b Predicted value and ground truth of opacity score of selected chest X-ray images annotated by an In-house experienced radiologist
Discussion
Most of the previous research on chest x-ray image analysis involves traditional deep learning architectures typically used for image classification. There are few studies that are involved with COVID-19 severity prediction. Basically, for severity prediction, these studies are involved with pre-trained models without anatomical information [13]. Additionally, there is a need for a case-by-case comparison to find out the possible causes of error to improve the image analysis architecture [53]. Also, there is a lack of CXRs for performing the segmentation tasks, which sometimes makes it difficult, and there may be anomalies in the findings. However, the existing models are not specifically aware of the anatomical structure present in typical chest x-ray images. In contrast, an experienced radiologist always first identifies the thoracic organs before looking for markers of the disease. Therefore, we hypothesized that adding anatomical information to existing models can help to improve the model’s performance in predicting disease severity. Also, anatomical information can reduce the computational complexity by introducing disease-specific features, which helps the model to learn precisely. The experimental results presented in this work demonstrate that including simple anatomical information, e.g., coloring the x-ray images by lung segmentation masks, can improve the performance of the COVID-19 severity prediction model. Our baseline architecture performs similarly compared to existing models on the COVID-19 pneumonia severity prediction task. We have also included a case-by-case comparison study with the annotated CXRs to quantify the performance of the proposed algorithm. However, the proposed anatomy-informed method yields about and relative improvement in MSE for the geographic extent and lung opacity scores, respectively. For the future perspective of this study, there is a need for further clinical validation on a larger-scale independent dataset and validation in a clinical workflow for effective deployment in low-resource hospital settings.
Conclusion
This paper has proposed a novel anatomy-aware deep learning framework for COVID-19 disease severity prediction from chest X-ray images. While traditional methods generally do not specifically consider anatomical information for medical image analysis, expert radiologists tend to always consider their human anatomy knowledge before making a diagnostic decision. In this work, we have utilized a semi-supervised model for automatically generating lung segmentation masks that are subsequently fused within the chest X-ray images. Our best-performing model has provided a relative improvement of in MSE compared to existing methods when evaluated on a COVID-19 pneumonia severity prediction dataset. Experimental comparisons between systems with and without anatomy information integrated clearly show the effectiveness of the proposed method. Our model also shows promising results on an unseen in-house clinical evaluation dataset that an experienced radiologist has annotated. The experimental evaluations demonstrate the effectiveness of the proposed anatomy-aware architecture for COVID-19 disease severity prediction. Though the COVID-19 transmission rate has significantly surged down, the proposed approach can be incorporated into other AI-based platforms for the severity prediction of other respiratory diseases. In different low-income settings and underprivileged areas, people with comorbid conditions are at risk of severe infections and there is a lack of medical facilities. Chest radiography is among the major radiological diagnostic methods in these regions. Hence, there is a need for computer-aided diagnostic methods to provide healthcare facilities in underserved communities where the proposed method can provide assistance to healthcare professionals. Thus, the extensions of the proposed method can be used for COVID-19 or other respiratory disease severity prediction in low-resource settings.
Author Contribution
Nusrat Binta Nizam: literature review, software/coding, experiments, writing manuscript, editing manuscript, preparing response to review document. Sadi Mohammad Siddiquee: conceptualization, methodology development, software/coding, experiments, writing first draft. Mahbuba Shirin: data collection and annotation. Mohammed Imamul Hassan Bhuiyan: conceptualization, supervision, writing — reviewing and editing. Taufiq Hasan: conceptualization, supervision, writing — reviewing and editing.
Funding
This work was supported by a Special Grant from the Information and Communication Technology (ICT) Division, Bangladesh.
Declarations
Ethics Approval
No human subjects were involved in this research. Existing open-access medical image datasets were used for this work.
Consent to Participate
Not applicable, since no human subjects were involved in this research.
Consent for Publication
Not applicable, since no human subjects were involved in this research.
Competing Interests
The authors declare no competing interests.
Footnotes
Publisher's Note
Springer Nature remains neutral with regard to jurisdictional claims in published maps and institutional affiliations.
References
- 1.W.H.O. (2023) WHO Coronavirus (COVID-19) Dashboard With Vaccination Data, https://covid19.who.int/, (Accessed on 03/16/2021)
- 2.Irkham I, Ibrahim AU, Nwekwo CW, Al-Turjman F, Hartati YW. Current technologies for detection of COVID-19: Biosensors, artificial intelligence and internet of medical things (IOMT) Sensors. 2022;23(1):426. doi: 10.3390/s23010426. [DOI] [PMC free article] [PubMed] [Google Scholar]
- 3.Francone M, Iafrate F, Masci GM, Coco S, Cilia F, Manganaro L, Panebianco V, Andreoli C, Colaiacomo MC, Zingaropoli MA, et al. Chest ct score in COVID-19 patients: correlation with disease severity and short-term prognosis. European Radiology. 2020;30(12):6808–6817. doi: 10.1007/s00330-020-07033-y. [DOI] [PMC free article] [PubMed] [Google Scholar]
- 4.S. Punitha, F. Al-Turjman, T. Stephan, Genetically optimized computer-aided diagnosis for detection and classification of COVID-19, AI-powered IoT for COVID-19 (2020) 105–122.
- 5.Wu JT, Wong KC, Gur Y, Ansari N, Karargyris A, Sharma A, Morris M, Saboury B, Ahmad H, Boyko O, et al. Comparison of chest radiograph interpretations by artificial intelligence algorithm vs radiology residents. JAMA network open. 2020;3(10):e2022779–e2022779. doi: 10.1001/jamanetworkopen.2020.22779. [DOI] [PMC free article] [PubMed] [Google Scholar]
- 6.Hussain E, Hasan M, Rahman MA, Lee I, Tamanna T, Parvez MZ. Corodet: A deep learning based classification for COVID-19 detection using chest x-ray images. Chaos, Solitons & Fractals. 2021;142:110495. doi: 10.1016/j.chaos.2020.110495. [DOI] [PMC free article] [PubMed] [Google Scholar]
- 7.R. A. Al-Falluji, Z. D. Katheeth, B. Alathari, Automatic detection of COVID-19 using chest x-ray images and modified resnet18-based convolution neural networks, Comput. Mater. Contin. (2021) 1301–1313.
- 8.Abbas A, Abdelsamea MM, Gaber MM. Classification of COVID-19 in chest x-ray images using detrac deep convolutional neural network. Appl. Intell. 2021;51(2):854–864. doi: 10.1007/s10489-020-01829-7. [DOI] [PMC free article] [PubMed] [Google Scholar]
- 9.Afifi A, Hafsa NE, Ali MA, Alhumam A, Alsalman S. An ensemble of global and local-attention based convolutional neural networks for COVID-19 diagnosis on chest x-ray images. Symmetry. 2021;13(1):113. doi: 10.3390/sym13010113. [DOI] [Google Scholar]
- 10.M. Umer, I. Ashraf, S. Ullah, A. Mehmood, G. S. Choi, Covinet: a convolutional neural network approach for predicting COVID-19 from chest x-ray images, J. Ambient Intell. Humaniz. Comput. (2021) 1–13. [DOI] [PMC free article] [PubMed]
- 11.G. Wang, X. Liu, J. Shen, C. Wang, Z. Li, L. Ye, X. Wu, T. Chen, K. Wang, X. Zhang, et al., A deep-learning pipeline for the diagnosis and discrimination of viral, non-viral and COVID-19 pneumonia from chest x-ray images, Nature Biomedical Engineering (2021) 1–13. [DOI] [PMC free article] [PubMed]
- 12.X. Wang, Y. Peng, L. Lu, Z. Lu, M. Bagheri, R. M. Summers, Chestx-ray8: Hospital-scale chest x-ray database and benchmarks on weakly-supervised classification and localization of common thorax diseases, in: Proc. IEEE CVPR, 2017, pp. 2097–2106.
- 13.J. P. Cohen, L. Dao, K. Roth, P. Morrison, Y. Bengio, A. F. Abbasi, B. Shen, H. K. Mahsa, M. Ghassemi, H. Li, et al., Predicting COVID-19 pneumonia severity on chest x-ray with deep learning, Cureus 12 (7) (2020). [DOI] [PMC free article] [PubMed]
- 14.Koo HJ, Lim S, Choe J, Choi S-H, Sung H, Do K-H. Radiographic and ct features of viral pneumonia. Radiographics. 2018;38(3):719–739. doi: 10.1148/rg.2018170048. [DOI] [PubMed] [Google Scholar]
- 15.A. Narin, C. Kaya, Z. Pamuk, Automatic detection of coronavirus disease (COVID-19) using x-ray images and deep convolutional neural networks, arXiv preprint arXiv:2003.10849 (2020). [DOI] [PMC free article] [PubMed]
- 16.Ismael AM, Şengür A. Deep learning approaches for COVID-19 detection based on chest x-ray images. Expert Systems with Applications. 2021;164:114054. doi: 10.1016/j.eswa.2020.114054. [DOI] [PMC free article] [PubMed] [Google Scholar]
- 17.A. U. Ibrahim, M. Ozsoz, S. Serte, F. Al-Turjman, P. S. Yakoi, Pneumonia classification using deep learning from chest x-ray images during COVID-19, Cognitive Computation (2021) 1–13. [DOI] [PMC free article] [PubMed]
- 18.Al-Waisy AS, Al-Fahdawi S, Mohammed MA, Abdulkareem KH, Mostafa SA, Maashi MS, Arif M, Garcia-Zapirain B. COVID-chexnet: hybrid deep learning framework for identifying COVID-19 virus in chest x-rays images. Soft computing. 2023;27(5):2657–2672. doi: 10.1007/s00500-020-05424-3. [DOI] [PMC free article] [PubMed] [Google Scholar] [Retracted]
- 19.A. Hamza, M. A. Khan, M. Alhaisoni, A. Al Hejaili, K. A. Shaban, S. Alsubai, A. Alasiry, M. Marzougui, D2bof-covidnet: A framework of deep bayesian optimization and fusion-assisted optimal deep features for COVID-19 classification using chest x-ray and MRI scans, Diagnostics 13 (1) (2023) 101. [DOI] [PMC free article] [PubMed]
- 20.Y. Kaya, E. Gürsoy, A mobilenet-based CNN model with a novel fine-tuning mechanism for COVID-19 infection detection, Soft Computing (2023) 1–15. [DOI] [PMC free article] [PubMed] [Retracted]
- 21.Jyoti K, Sushma S, Yadav S, Kumar P, Pachori RB, Mukherjee S. Automatic diagnosis of COVID-19 with mca-inspired tqwt-based classification of chest x-ray images. Computers in Biology and Medicine. 2023;152:106331. doi: 10.1016/j.compbiomed.2022.106331. [DOI] [PMC free article] [PubMed] [Google Scholar]
- 22.Islam MM, Islam MZ, Asraf A, Al-Rakhami MS, Ding W, Sodhro AH. Diagnosis of COVID-19 from x-rays using combined CNN-RNN architecture with transfer learning. BenchCouncil Transactions on Benchmarks: Standards and Evaluations; 2023. p. 100088. [Google Scholar]
- 23.S. Motamed, P. Rogalla, F. Khalvati, Data augmentation using generative adversarial networks (gans) for gan-based detection of pneumonia and COVID-19 in chest x-ray images, arXiv preprint arXiv:2006.03622 (2021). [DOI] [PMC free article] [PubMed]
- 24.Zebin T, Rezvy S. Covid-19 detection and disease progression visualization: Deep learning on chest x-rays for classification and coarse localization. Appl. Intell. 2021;51(2):1010–1021. doi: 10.1007/s10489-020-01867-1. [DOI] [PMC free article] [PubMed] [Google Scholar]
- 25.Ullah Z, Usman M, Latif S, Gwak J. Densely attention mechanism based network for COVID-19 detection in chest x-rays. Scientific Reports. 2023;13(1):261. doi: 10.1038/s41598-022-27266-9. [DOI] [PMC free article] [PubMed] [Google Scholar]
- 26.Chandra TB, Verma K, Singh BK, Jain D, Netam SS. Coronavirus disease (COVID-19) detection in chest x-ray images using majority voting based classifier ensemble. Expert Syst. Appl. 2021;165:113909. doi: 10.1016/j.eswa.2020.113909. [DOI] [PMC free article] [PubMed] [Google Scholar]
- 27.Singh KK, Singh A. Diagnosis of COVID-19 from chest x-ray images using wavelets-based depthwise convolution network. Big Data Mining and Analytics. 2021;4(2):84–93. doi: 10.26599/BDMA.2020.9020012. [DOI] [Google Scholar]
- 28.Malik H, Naeem A, Naqvi RA, Loh W-K. DMFL\_net: A federated learning-based framework for the classification of COVID-19 from multiple chest diseases using x-rays. Sensors. 2023;23(2):743. doi: 10.3390/s23020743. [DOI] [PMC free article] [PubMed] [Google Scholar]
- 29.A. Degerli, M. Ahishali, S. Kiranyaz, M. E. Chowdhury, M. Gabbouj, Reliable COVID-19 detection using chest x-ray images, in: 2021 IEEE International Conference on Image Processing (ICIP), IEEE, 2021, pp. 185–189.
- 30.Haghanifar A, Majdabadi MM, Choi Y, Deivalakshmi S, Ko S. COVID-CXNET: Detecting COVID-19 in frontal chest x-ray images using deep learning. Multimedia Tools and Applications. 2022;81(21):30615–30645. doi: 10.1007/s11042-022-12156-z. [DOI] [PMC free article] [PubMed] [Google Scholar]
- 31.Ozturk T, Talo M, Yildirim EA, Baloglu UB, Yildirim O, Acharya UR. Automated detection of COVID-19 cases using deep neural networks with x-ray images. Computers in biology and medicine. 2020;121:103792. doi: 10.1016/j.compbiomed.2020.103792. [DOI] [PMC free article] [PubMed] [Google Scholar]
- 32.Khozeimeh F, Sharifrazi D, Izadi NH, Joloudari JH, Shoeibi A, Alizadehsani R, Gorriz JM, Hussain S, Sani ZA, Moosaei H, et al. Combining a convolutional neural network with autoencoders to predict the survival chance of COVID-19 patients. Scientific Reports. 2021;11(1):15343. doi: 10.1038/s41598-021-93543-8. [DOI] [PMC free article] [PubMed] [Google Scholar]
- 33.A. Vaswani, N. Shazeer, N. Parmar, J. Uszkoreit, L. Jones, A. Gomez, Ł. Kaiser, I. Polosukhin, Attention is all you need. in advances in neural information processing systems, in: Proc. NIPS, 2007, pp. 5998–6008.
- 34.K. Li, Z. Wu, K.-C. Peng, J. Ernst, Y. Fu, Tell me where to look: Guided attention inference network, in: Proceedings of the IEEE conference on computer vision and pattern recognition, 2018, pp. 9215–9223.
- 35.J. Hu, L. Shen, G. Sun, Squeeze-and-excitation networks, in: Proceedings of the IEEE conference on computer vision and pattern recognition, 2018, pp. 7132–7141.
- 36.N. Sarafianos, X. Xu, I. A. Kakadiaris, Deep imbalanced attribute classification using visual attention aggregation, in: Proceedings of the European Conference on Computer Vision (ECCV), 2018, pp. 680–697.
- 37.M. Jaderberg, K. Simonyan, A. Zisserman, et al., Spatial transformer networks, Advances in neural information processing systems 28 (2015).
- 38.S. Woo, J. Park, J.-Y. Lee, I. S. Kweon, Cbam: Convolutional block attention module, in: Proceedings of the European conference on computer vision (ECCV), 2018, pp. 3–19.
- 39.J. Fu, J. Liu, H. Tian, Y. Li, Y. Bao, Z. Fang, H. Lu, Dual attention network for scene segmentation, in: Proceedings of the IEEE/CVF conference on computer vision and pattern recognition, 2019, pp. 3146–3154.
- 40.Albahli S, Ayub N, Shiraz M. Coronavirus disease (COVID-19) detection using x-ray images and enhanced densenet. Applied Soft Computing. 2021;110:107645. doi: 10.1016/j.asoc.2021.107645. [DOI] [PMC free article] [PubMed] [Google Scholar]
- 41.G. K. Yenurkar, S. Mal, Effective detection of COVID-19 outbreak in chest x-rays using fusionnet model, The Imaging Science Journal (2023) 1–21.
- 42.Duong LT, Nguyen PT, Iovino L, Flammini M. Automatic detection of COVID-19 from chest x-ray and lung computed tomography images using deep neural networks and transfer learning. Applied Soft Computing. 2023;132:109851. doi: 10.1016/j.asoc.2022.109851. [DOI] [PMC free article] [PubMed] [Google Scholar]
- 43.Mukherjee H, Ghosh S, Dhar A, Obaidullah SM, Santosh K, Roy K. Deep neural network to detect COVID-19: one architecture for both CT scans and chest x-rays. Applied Intelligence. 2021;51:2777–2789. doi: 10.1007/s10489-020-01943-6. [DOI] [PMC free article] [PubMed] [Google Scholar]
- 44.S. Roy, A. K. Das, Deep-cov: An integrated deep learning model to detect COVID-19 using chest x-ray and CT images, Computational Intelligence (2023).
- 45.M. Karim, T. Döhmen, D. Rebholz-Schuhmann, S. Decker, M. Cochez, O. Beyan, et al., DeepCOVIDexplainer: Explainable COVID-19 predictions based on chest x-ray images, arXiv preprint arXiv:2004.04582 (2020).
- 46.Liu H, Wang L, Nan Y, Jin F, Wang Q, Pu J. Sdfn: Segmentation-based deep fusion network for thoracic disease classification in chest x-ray images. Comput. Med. Imaging Graph. 2019;75:66–73. doi: 10.1016/j.compmedimag.2019.05.005. [DOI] [PMC free article] [PubMed] [Google Scholar]
- 47.Kamal U, Zunaed M, Nizam NB, Hasan T. Anatomy-xnet: An anatomy aware convolutional neural network for thoracic disease classification in chest x-rays. IEEE Journal of Biomedical and Health Informatics. 2022;26(11):5518–5528. doi: 10.1109/JBHI.2022.3199594. [DOI] [PubMed] [Google Scholar]
- 48.T. B. Chandra, K. Verma, D. Jain, S. S. Netam, Localization of the suspected abnormal region in chest radiograph images, in: Proc. IEEE ICPC2T, IEEE, 2020, pp. 204–209.
- 49.Budak Ü, Çıbuk M, Cömert Z, Şengür A. Efficient COVID-19 segmentation from CT slices exploiting semantic segmentation with integrated attention mechanism. Journal of Digital Imaging. 2021;34:263–272. doi: 10.1007/s10278-021-00434-5. [DOI] [PMC free article] [PubMed] [Google Scholar]
- 50.Zhu J, Shen B, Abbasi A, Hoshmand-Kochi M, Li H, Duong TQ. Deep transfer learning artificial intelligence accurately stages COVID-19 lung disease severity on portable chest radiographs. PloS one. 2020;15(7):e0236621. doi: 10.1371/journal.pone.0236621. [DOI] [PMC free article] [PubMed] [Google Scholar]
- 51.Jiao Z, Choi JW, Halsey K, Tran TML, Hsieh B, Wang D, Eweje F, Wang R, Chang K, Wu J, et al. Prognostication of patients with COVID-19 using artificial intelligence based on chest x-rays and clinical data: a retrospective study. The Lancet Digital Health. 2021;3(5):e286–e294. doi: 10.1016/S2589-7500(21)00039-X. [DOI] [PMC free article] [PubMed] [Google Scholar]
- 52.S. Park, G. Kim, Y. Oh, J. B. Seo, S. M. Lee, J. H. Kim, S. Moon, J.-K. Lim, J. C. Ye, Vision transformer using low-level chest x-ray feature corpus for COVID-19 diagnosis and severity quantification, arXiv preprint arXiv:2104.07235 (2021). [DOI] [PMC free article] [PubMed]
- 53.Signoroni A, Savardi M, Benini S, Adami N, Leonardi R, Gibellini P, Vaccher F, Ravanelli M, Borghesi A, Maroldi R, et al. BS-Net: Learning COVID-19 pneumonia severity on a large chest X-ray dataset. Med. Image Anal. 2021;71:102046. doi: 10.1016/j.media.2021.102046. [DOI] [PMC free article] [PubMed] [Google Scholar]
- 54.H. Li, P. Xiong, J. An, L. Wang, Pyramid attention network for semantic segmentation. arXiv preprint arXiv:1805.10180 (2018).
- 55.W. Ye, J. Yao, H. Xue, Y. Li, Weakly supervised lesion localization with probabilistic-cam pooling, arXiv preprint arXiv:2005.14480 (2020).
- 56.A. K. Mondal, A. Agarwal, J. Dolz, C. Desrosiers, Revisiting cyclegan for semi-supervised segmentation, arXiv preprint arXiv:1908.11569 (2019).
- 57.J.-Y. Zhu, T. Park, P. Isola, A. A. Efros, Unpaired image-to-image translation using cycle-consistent adversarial networks, in: Proc. IEEE CVPR, 2017, pp. 2223–2232.
- 58.O. Ronneberger, P. Fischer, T. Brox, U-net: Convolutional networks for biomedical image segmentation, in: Proc. MICCAI, Springer, 2015, pp. 234–241.
- 59.G. Huang, Z. Liu, L. Van Der Maaten, K. Q. Weinberger, Densely connected convolutional networks, in: Proc. IEEE CVPR, 2017, pp. 4700–4708.
- 60.B. Zhou, A. Khosla, A. Lapedriza, A. Oliva, A. Torralba, Learning deep features for discriminative localization, in: Proc. IEEE CVPR, 2016, pp. 2921–2929.
- 61.Shiraishi J, Katsuragawa S, Ikezoe J, Matsumoto T, Kobayashi T, Komatsu K-I, Matsui M, Fujita H, Kodera Y, Doi K. Development of a digital image database for chest radiographs with and without a lung nodule: receiver operating characteristic analysis of radiologists’ detection of pulmonary nodules. Am. J. Roentgenol. 2000;174(1):71–74. doi: 10.2214/ajr.174.1.1740071. [DOI] [PubMed] [Google Scholar]
- 62.Van Ginneken B, Stegmann MB, Loog M. Segmentation of anatomical structures in chest radiographs using supervised methods: a comparative study on a public database. Med. Image Anal. 2006;10(1):19–40. doi: 10.1016/j.media.2005.02.002. [DOI] [PubMed] [Google Scholar]
- 63.J. Irvin, P. Rajpurkar, M. Ko, Y. Yu, S. Ciurea-Ilcus, C. Chute, H. Marklund, B. Haghgoo, R. Ball, K. Shpanskaya, et al., Chexpert: A large chest radiograph dataset with uncertainty labels and expert comparison, in: Proc. AAAI Conf. on Artificial Intelligence, Vol. 33, 2019, pp. 590–597.
- 64.J. Deng, W. Dong, R. Socher, L.-J. Li, K. Li, L. Fei-Fei, Imagenet: A large-scale hierarchical image database, in: Proc. IEEE CVPR, Ieee, 2009, pp. 248–255.