

Abstract
The mechanical response of an advanced high strength and corrosion resistant 10 % Cr nanocomposite steel (ASTM A1035CS Grade 120) is measured under uniaxial tension and compression at the strain rates of 10−4 s−1, 10−2 s−1, 100 s−1, 700 s−1, and 3000 s−1. The experiments are performed at 22 °C as well as 80 °C to investigate the material behavior at the expected temperature rise due to adiabatic deformation at 15 % strain. Additionally, different compression-shear hat-shaped specimens are tested at quasi-static and dynamic strain rates to investigate the localization behavior of this material. The material exhibits small strain rate sensitivity (SRS) during quasi-static loading, but a pronounced SRS between quasi-static and dynamic strain rates. Tension-compression asymmetry is also observed at both temperatures. Experiments at 80 °C reveal a decrease in flow stress in both tension and compression indicating the material is sensitive to thermal softening due to adiabatic heating. Load-Unload-Reload (LUR) and strain rate jump experiments are performed to investigate the reasoning behind the approximate rate insensitivity of ASTM A1035CS steel during quasi-static strain rates. A new constitutive model is also developed using a novel rate dependent material model with a modified Hockett-Sherby (MHS) hardening model and incorporating Lode angle dependence to capture the tension-compression asymmetry. The model is also used to predict the LUR and strain rate jump experiments. Finally, reasoning behind the unique rate dependent thermo-mechanical behavior of ASTM A1035CS steel is discussed in regards to adiabatic heating, strain-partitioning, and phase transformation.
Keywords: ChromX, MMFX, ASTM A1035, Adiabatic, Martensite, Austenite, hat-shaped specimen
1. Introduction:
Steel is the material of choice for reinforced concrete because of its combination of strength, ductility, toughness, and cost. Steel improves the tensile strength of concrete and its failure properties under dynamic loads encountered in natural disasters or during impact. Corrosion resistance is highly desirable for rebar to limit the mechanical degradation and “oxide jacking” over time [1]. Often, stainless steel and epoxy coated steels are substitutes for plain carbon rebar steel to reduce the impact of corrosion on infrastructure. However, these materials usually sacrifice strength and are more expensive, and coated steels require special handling to avoid damaging the protective layer. ASTM A1035CS Grade 120 [2] rebar steel has been recently developed to fill in the gap to provide high strength, ductility, corrosion resistance, and potentially lower cost than conventional lower grade rebar steel during its lifespan [3]. The composition contains low carbon and up to 10 % Cr and are thermo-mechanically processed to produce a martensitic steel with nano-sheets of austenite between the lath martensite structure [4–7]. This microstructure provides high strength, and yet, still retains good toughness. These properties help relieve compacted areas of rebar typically produced by lower strength rebar steel (referred to as “rebar congestion”) [3]. In addition, corrosion from microgalvanic cell formation is reduced compared to conventional steel by reducing the amount of carbides in the microstructure, especially at the lath and grain boundaries [1,5]. However, the mechanical behavior at quasi-static and dynamic strain rates must be well investigated to use this material in many structural applications, and to this date, experimental data in literature is limited [8–12].
Steel rebar is often subjected to quasi-static and dynamic strain rates during manufacturing and in normal operating conditions. However, dynamic loading of these structures is often accidental, such as impact loading from collision or from natural disasters. At these high loading rates, plastic deformation causes the temperature to increase because the heat generated by plastic work does not have time to dissipate into the surroundings, a process known as adiabatic heating [13,14]. Experiments at quasi-static strain rates of 100 s−1 and lower are usually assumed to be isothermal because the heat generated has enough time to dissipate. However, some materials such as stainless steel [15–17], steel [18–20], and titanium [21] have been shown to exhibit bulk temperature increase above the strain rate of 10−4 s−1 due to the high strength and/or high work hardening, as well as low thermal diffusivity of these materials. As such, it is imperative to understand not only the effects of strain rate on the strength of ASTM A1035CS steel, but also the effects of temperature up to the levels expected during dynamic testing.
Failure within the rebar of dynamically-loaded concrete is expected to occur via shear localization, therefore, it is important to characterize the shear localization properties of ASTM A1035CS steel over a range of strain rates. Hat-shaped specimens are convenient to understand shear localization behavior of materials by generating a simultaneous compressive-shear loading [13,14,22,23]. The hat-shaped specimen highly constrains the deformation to a specific shear zone, which leads to strain localization and an adiabatic shear band under dynamic loading. However, the limitation of hat-shaped specimens is that the stress and strain states cannot be calculated based on the force and displacement. Detailed simulations are needed to predict the stress and strain state within the compression-shear zone.
To this date, experimental data on ASTM A1035CS Grade 120 steel at different strain rates in tension, compression, and compression-shear is limited. Therefore, the aim of this work is to provide a comprehensive experimental data set on ASTM A1035CS Grade 120 steel under different stress states at quasi-static and dynamic strain rates. The tension and compression experiments were performed at 22 °C and 80 °C. The higher temperature was chosen because it is expected to represent an upper limit of the temperature rise due to adiabatic deformation at 15 % plastic strain. Finally, a constitutive model is developed using a novel rate dependent term, a modified Hockett-Sherby (MHS) model [24] to capture the high hardening response at low strains, and a tension-compression asymmetry term to model the material response of ASTM A1035CS Grade 120 steel.
2. Experimental procedures
ChromX 9120, a steel made in accordance with ASTM A1035CS Grade 120 [2] (referred to as “A1035CS steel” hereafter), was supplied in the machined condition by “Commercial Metals Company (CMC)” in Irving, TX USA from #18 rebar (57 mm nominal diameter). The manufacturer-determined chemical composition (in mass fraction) of the material is C 0.08 %, Cr 9.93 %, Mn 0.57 %, Si 0.17 %, S 0.008 %, P 0.008 %, Cu 0.16 %, Ni 0.1 %, Al 0.001 %, V 0.024 %, and N 0.0226 %. The microstructure of the A1035CS steel consists of untransformed nano-sheets of austenite sandwiched between lath martensite within the prior austenite grain boundaries [4,5,25] as shown in Fig. 1. A1035CS steel was tested at quasi-static and dynamic strain rates in tension, compression, and compression-shear (hat-shaped specimens). Furthermore, load-unload-reload (LUR) and strain rate jump experiments were performed to investigate the role of adiabatic heating and strain-partitioning on the rate sensitivity of A1035CS steel. The details of the experimental procedures are presented in the following subsections.
Fig. 1:

a) Bright field TEM image and b) dark field TEM image of the A1035CS steel microstructure from [4,5,25]. Black arrows in b) indicate the nano-sheets of austenite sandwiched between lath martensite.
2.1. Quasi-static tension and compression experiments
A1035CS steel samples were tested in compression and tension at quasi-static strain rates using an MTS-809 axial/torsion servo-hydraulic system at the nominal strain rates of 10−4 s−1, 10−2 s−1 and 100 s−1. Dog-bone-shaped cylindrical tension specimens were machined along the axial direction of the rebar steel. These specimens were machined with a 50.8 mm gage length and a 12.7 mm gage diameter in accordance with ASTM E8 Standard [26] as shown in Fig. 2. Quasi-static compression specimens were machined with a length-to-diameter ratio of 1.5 with a 19.0 mm gage length and a 12.7 mm diameter. Kyowa high elongation strain gages with a 2 mm gage length (Type: KFEL-2-120-C1) were used for the strain measurements for the room temperature experiments. It is important to note, inhomogeneous deformation, such as lüder bands, can cause a non-representative strain measurement for the gage length of the specimens using a 2 mm strain gage. However, the repeatability of the experiments indicates that the gage section was deforming uniformly. Non-uniform deformation would also cause nonlinear/serrated strain versus time, which was not observe. Therefore, the strain from the 2 mm strain gage is representative of the strain in the gage section during uniform deformation. For higher temperature experiments where the strain gages could not be used, the stroke data was corrected using a “blank experiment” (i.e., without a specimen), which provides the compliance of the machine and anvils. M-K Impex Canada (mk-ws2-ht) high temperature grease was used to reduce friction and maintain uniform stress state for the 22 °C and 80 °C experiments. 80 °C was chosen because it is an estimated upper limit of the temperature rise due to adiabatic deformation at 15 % strain. All 80 °C experiments were performed using a custom convection furnace similar to [27] and controlled using a thermocouple bonded directly on the sample cylindrical surface in the test section. Constant temperature was maintained for 15 min within ±1 °C using a K-Type thermocouple prior to performing each high temperature experiment. Experiments at all quasi-static strain rates and temperature were repeated for reproducibility. See Table 2 and Table 3 for the number of experiments and variation in the standard deviation. All quasi-static curves are an average of two experiments.
Fig. 2:

a) Quasi-static tension specimen geometry (dimensions are in millimeters) b) images of the room temperature and high temperature quasi-static tension specimens, and c) images of the quasi-static and dynamic compression specimens.
Table 2:
True stress and the standard deviation (SD) at 0.2 % yield stress (YS) and at 2.5 %, 5 %, and 10 % true plastic strain in compression at 22 °C and 80 °C.
| Strain Rate | Plastic Strain at 22 °C |
Plastic Strain at 80 °C |
||||||||
|---|---|---|---|---|---|---|---|---|---|---|
| # of Exp | YS | 2.5 % | 5.0 % | 10.0 % | # of Exp | YS | 2.5 % | 5.0 % | 10.0 % | |
| 1/s | ||||||||||
| 0.0001 | 2 | 1008 ± 13 | 1348 ± 9 | 1412 ± 11 | 1461 ± 10 | 2 | 978 ± 2 | 1316 ± 1 | 1373 ± 1 | 1403 ± 1 |
| 0.01 | 2 | 1034 ± 6 | 1354 ± 4 | 1417 ± 3 | 1459 ± 2 | 2 | 990 ± 10 | 1312 ± 1 | 1363 ± 2 | 1385 ± 0 |
| 1 | 2 | 1044 ± 1 | 1367 ± 9 | 1433 ± 8 | 1467 ± 8 | 2 | 1027 ± 23 | 1320 ± 10 | 1375 ± 5 | 1412 ± 8 |
| 700 | 1 | - | 1517 ± - | 1580 ± - | 0 | |||||
| 3000 | 2 | - | 1622 ± 9 | 1658 ± 34 | 1708 ± 33 | 2 | - | 1490 ± 35 | 1544 ± 2 | 1548 ± 30 |
Table 3:
True 0.2 % yield stress (YS), engineering ultimate tensile strength (UTS), and engineering strain at UTS, as well as their standard deviation (SD) in tension at 22 °C and 80 °C.
| Strain Rate | 22 °C |
80 °C |
||||||
|---|---|---|---|---|---|---|---|---|
| # of Exp | True YS | Eng UTS | Eng Strain at UTS | # of Exp | True YS | Eng UTS | Eng Strain at UTS | |
| 1/s | ||||||||
| 0.0001 | 2 | 917 ± 6 | 1267 ± 2 | 0.059 ± 0.002 | 2 | 903 ± 3 | 1241 ± 1 | 0.053 ± 0.002 |
| 0.01 | 2 | 918 ± 6 | 1269 ± 1 | 0.060 ± 0.001 | 2 | 904 ± 3 | 1228 ± 0 | 0.052 ± 0.001 |
| 1 | 2 | 955 ± 2 | 1288 ± 0 | 0.060 ±0.001 | 2 | 948 ± 11 | 1238 ± 2 | 0.055 ± 0.001 |
2.2. Load-unload-reload (LUR) and strain-rate jump experiments
Load-unload-reload (LUR) experiments were performed to investigate the reasoning behind the approximate strain rate insensitivity of A1035CS steel for the quasi-static strain rate experiments. As mentioned in the introduction, one of the mechanisms is deformation induced heating at quasi static strain rates. Other mechanisms are strain partitioning between the different phases and activation of different deformation mechanisms, which will be discussed in detail in the Section 5.
The LUR experiments were loaded in multiple steps. First, the sample was loaded between 4 % and 5 % strain in compression (1 % to 2 % in tension), unloaded, and then left to cool to room temperature. After the cool down period, it was reloaded again to approximately the same strain increment, followed by the unloading and cool down steps. The stress-strain curves obtained for each loading cycle were compared to the monotonic experiments. The LUR experiments were also compared to the model predictions (see Section 4 and 5) to isolate the mechanisms behind the approximate strain rate insensitivity of A1035CS steel for the quasi-static strain rate experiments, as well as strain rate sensitivity of the LUR experiments. Unfortunately, measurement of the temperature increase as a function of plastic strain at quasi-static and dynamic strain rates was not possible due to the bandwidth of the thermocouple measuring device used in this study. Non-contact temperature measurement methods, such as an infrared pyrometer or thermal camera, would be required to measure the temperature increase as a function of strain. This was outside the scope of the current work.
In addition to LUR experiments, a strain rate jump experiment was used as an additional verification of the effect of thermal softening due to an increase in strain rate. The strain rate jump experiment was initially loaded at 10−4 s−1 to a certain plastic strain and then instantaneously changed to 100 s−1 for a certain amount of strain. If strain rate sensitivity is present, a change in stress level will be observed when the strain rate is increased. As stated above, the strain rate 10−4 s−1 is considered isothermal, and therefore, the increase in strength should be from the rate sensitivity of A1035CS steel in the absence of any temperature rise.
2.3. Dynamic compression experiments
The split-Hopkinson pressure bar technique (SHPB), also referred to as the Kolsky bar technique, was used to perform the dynamic compression experiments. Dynamic compression specimens were prepared with a 2.45 mm gage length and a 5.0 mm diameter for the nominal strain rate of 3000 s−1, and a 3.8 mm gage length and a 7.6 mm diameter for the nominal strain rate of 700 s−1.
The compression SHPB was made of 12.7 mm diameter Vascomax C-350. A pulse shaper is placed in between the striker bar and the incident bar is used to smooth the compressive pulse generated by the striker bar impact. Two diametrically opposing strain gages were mounted on the pressure bars, which were used to cancel any bending effects. The gages were positioned such that the incident, reflected and transmitted waves were recorded without any interference among the waves. The nominal stress and strain in the specimen up to any time duration was calculated using the one-wave solution as described in [28]. The dynamic compression data was corrected using an elastic “punch” correction from Safa and Gary [29]. The true stress and true strain are calculated using standard equations [30].
The dynamic compression specimens were sandwiched between the incident and transmitted bars and the interfaces of the bars lubricated with a layer of M-K Impex Canada (mk-ws2-ht) high temperature grease to reduce friction and maintain a uniform stress state during the experiments. High temperature dynamic compression experiments were performed using a small convection furnace to heat the sample and a thermocouple cemented directly on the sample surface for the temperature control. The area adjacent to the heated area of the bars were cooled to prevent any temperature effects on the waves.
2.4. Hat-shaped experiments
In addition to the uniaxial tension and compression experiments, compression-shear experiments using hat-shaped specimens were performed as shown in Fig. 3. The hat-shaped specimen was specifically chosen to induce shear localization. Three different hat-shaped specimen geometries were used to investigate the influence of the shear zone shape on the macroscopic behavior. The 3 different specimen geometries named G1, G2, and G3 are given in Table 1. The fillet radius in all samples was 0.1 mm.
Fig. 3:

a) Schematic of the hat-shaped specimen where the dimensions for the G1, G2, and G3 hat-shaped specimens are in Table 1. b) images of a hat-shaped specimen. The red zone in a) indicates the area of shear-compression stress state.
Table 1:
Dimension of the G1, G2, and G3 hat-shaped specimens from Fig. 3a (dimensions are in mm).
| Specimen ID | ||||||
|---|---|---|---|---|---|---|
| G1 | 2 | 2.1 | 4 | 2 | 3 | 5 |
| G2 | 2 | 2.1 | 4 | 2 | 4 | 6 |
| G3 | 2 | 2.2 | 4 | 2 | 3 | 5 |
The hat-shaped specimens were loaded at a quasi-static rate and at a dynamic rate. The quasi-static tests were tested at 5x10⁻⁵ m/s, and the dynamic tests were tested with a projectile velocity of 5 m/s. For the dynamic tests performed in the SHPB, the total displacement between the top and bottom surface of the specimen was calculated as:
| (1) |
where is the longitudinal wave velocity in the bar and is the reflected strain wave. It is important to note that the strain-state and strain-rate calculation, as well as the shear-strain component, cannot be easily determined because it will vary depending on the location within the deformation zone. Numerical simulations of the experiments are needed to estimate the strain-state, which is outside the scope of the present study. The engineering shear stress in the hat-shaped specimen can be calculated as:
| (2) |
where , and are the elastic modulus of the transmitted bar, area of the transmitted bar, and the transmitted strain wave, respectively. This is not the actual shear stress within the deformation zone. The shear-stress was reported based on Eq. (2) to simplify the comparison between the various specimen geometries.
Interrupted experiments at different displacements were performed on the G1 hat-shaped specimen for ex-situ metallographic analysis of the shear zone. The interrupted experiments were performed with different ring thicknesses round the specimen to limit the displacements, similar to Peirs et al. [22]. The specimens were then sliced, polished, and etched to reveal cracks and the shear band. Fiji [31] was used to analyze and stitch the optical images.
3. Results
The results of the tension, compression, hat-shaped experiments at different strain rates and temperatures for A1035CS steel are presented in the following subsections. Initially, the strain rate experiments in compression and tension are reported in Section 3.1. The results for the LUR experiments and strain rate jump experiment are then reported and compared to the uninterrupted (monotonic) tension and compression experiments in Section 3.2. The fracture tension surfaces and the deformed compression samples at different strain rates are shown and variations among the samples are presented in Section 3.3. Finally, in Section 3.4, the shear stress versus displacement of the hat-shaped specimen for the different geometries are presented at different strain rates. Sectioned, polished, and etched interrupted hat-shaped experiments are also shown in Section 3.4 to reveal the progressive development of the shear band at different displacements.
3.1. Uniaxial tension and compression
Compression stress-strain curves at different quasi-static strain rates at 22 °C are shown in Fig. 4 . Fig. 4 also highlights the elastic modulus, proportional limit, 0.2% offset yield stress (YS), and the high work hardening rate of the material post YS and during the first few percent of strain. The compression stress-strain curves at different strain rates and at 22 °C and 80 °C are shown in Fig. 5a–b. For all of the compression experiments, the samples had to be unloaded before failure due to the load frame capacity and the maximum displacement achievable in the SHPB used in this study. A1035CS steel is approximately rate insensitive in compression up to 100 s−1 at 22 °C and 80 °C. A prominent increase in the strength of the material at 22 °C and 80 °C occurs as the strain rate increases from 100 s−1 to 700 s−1 and 3000 s−1, which is consistent with other on different steels [32,33]. Engineering tensile stress-strain curves at different strain rates and at 22 °C and 80 °C are shown in Fig. 5c–d. Dots in these curves designate the location of the ultimate tensile stress (UTS). Similar to the compression experiments, A1035CS steel in tension is approximately rate insensitive in the quasi-static regime. For experiments in both compression and tension, there is a decrease in the flow stress at 80 °C, which is consistent with others on different steels [17,20,34–37]. Additionally, the flow stress at 10−2 s−1 was slightly lower than 10−4 s−1 at 80 °C for both compression and tension. This is assumed to be from the competition between thermal softening and the increase in stress as the strain rate increases (strain rate hardening). This behavior was predicted using the model developed in Section 4. See Section 4.2 for a comparison between the experiments and model.
Fig. 4:

a) True compressive stress-strain curve at 22 °C indicating the elastic modulus, proportional limit, and 0.2% offset yield stress at different quasi-static strain rates, and b) work hardening rate as a function of true strain.
Fig. 5:

True stress-strain curves at different strain rates in a) compression (Comp) at 22 °C, b) compression (Comp) at 80 °C. Engineering (Eng) stress-strain curves at different strain rates in c) tension at 22 °C, and d) tension at 80 °C. Note, the dots within c) and d) designate the location of the ultimate tensile strain (UTS). The standard deviations (SD) at different levels of strains are shown in Table 2 and Table 3.
Notably, A1035CS steel exhibits tension-compression asymmetry, where the strength of the material in compression is stronger than in tension by approximately 8 % to 10 % at the YS at both temperatures as shown in Fig. 6. This difference in strength between tension and compression was found to be a material effect and not from the differences in geometries or friction in compression. This was verified by loading a tensile specimen in compression up to 2 % strain to minimize the chance of buckling. Almost identical material response was achieved between the compression samples used in this manuscript and the tension sample loaded in compression up to 2 % strain.
Fig. 6:

A comparison between the true stress-strain curves in tension and compression at 22 °C and 80 °C at the strain rate of 10−4 s−1. Note, the dots designate the location of the ultimate tensile stress (UTS).
The average elastic modulus at room temperature in tension was (206.6 ± 3.8) GPa (E ± standard deviation) and in compression was (206.8 ± 1.4) GPa and is represented in Fig. 4 as a dotted line. Average true YS and standard deviations (SD) are reported in Table 2 and Table 3. Additionally, true stresses at 2.5 %, 5 %, and 10 % true plastic strains in compression, and engineering stresses and the strains at UTS in tension are also presented in Table 2 and Table 3. A summary of these Tables is shown in Fig 7a. This figure also highlights the strain rate sensitivity of A1035CS steel. The YS of the material is not reported for the SHPB experiments because the data at low strains is considered to be unreliable because the specimen has not yet reached force equilibrium. Also, the reduction in area after fracture using is reported in Fig 7c. The average reduction in area at both temperatures is ≈ 60 %, which is large when compared to the strain at UTS.
Fig. 7:

a) True stress versus strain rate (logarithmic scale) at 0.2 % yield strength, 5 % true plastic strain and 10 % true plastic strain in compression, b) Engineering stress versus strain rate for 0.2 % yield strength and UTS, and c) reduction in area versus strain rate at 22 °C and 80 °C. The standard deviations (SD) at the yield stress, UTS, and at different levels of strains are shown in Table 2 and Table 3.
3.2. Load-unload-reload (LUR) experiments
LUR compression experiments at the strain rates of 10−2 s−1 and 100 s−1 are shown in Fig. 8a–b, and LUR tension experiments at 100 s−1 are shown in Fig. 8c. The reload strength of the LUR experiments are higher than monotonically loaded experiments. During the subsequent reloading for the each LUR experiment, there is a decrease in stress as strain increases, unlike the continual hardening observed during the monotonic loading. As expected, the LUR experiments at 100 s−1 are greater than at 10−2 s−1. While the LUR experiments indicate that thermal softening is playing a role in the mechanical behavior at 100 s−1 and 10−2 s−1, other effects such as strain partitioning might also be playing a role in the LUR experiments. This is discussed further in Section 5.
Fig. 8:
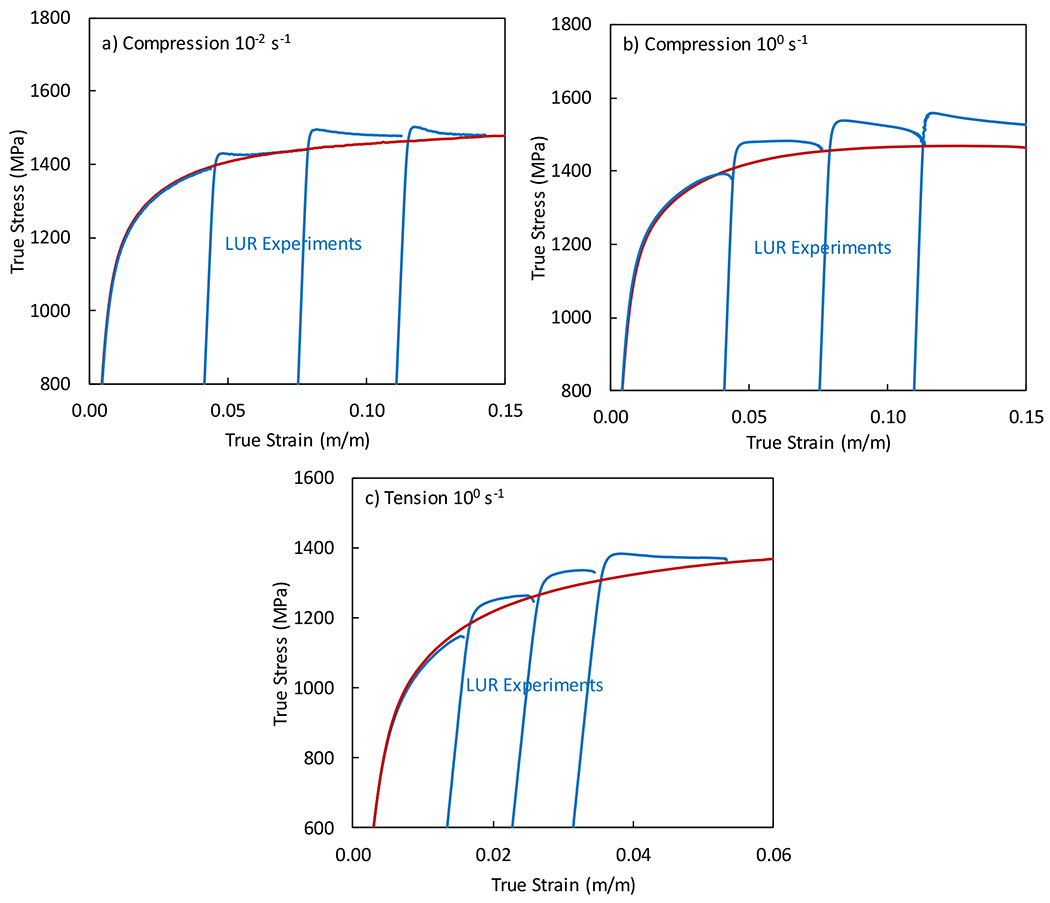
True stress–strain behaviors of the load-unload-reload (LUR) experiments compared to monotonic experiments at 22 °C a) in compression at 10−2 s−1, b) in compression at 100 s−1, and c) in tension at 100 s−1.
A strain rate jump experiment was also performed to verify any strain rates effects in the absence of unloading (Fig. 9a). In the strain rate jump experiment, a specimen was loaded in compressed at 10−4 s−1 to ≈ 3.5 % true strain after which the strain rate is rapidly increased to 100 s−1. The measured response shows the true stress increases immediately in response to the jump in strain rate, but the stress decreases and then the stress starts increasing again as strain increases. This indicates that the strain rate sensitivity observed at quasi-static strain rates is reduced by internal heating or due to the loading history. Further discussion of the LUR and strain rate jump experiments are in Section 4 and 5.
Fig. 9:

a) True stress–strain in compression comparing the strain rate jump experiment, LUR experiments, and the monotonic experiments at 22 °C and at different strain rates. b) True stress–strain behaviors of the LUR experiments at 22 °C in compression at the strain rate of 700 s−1 and a comparison with the experiments in Fig. 8b.
The effect of adiabatic heating on the perceived strain rate sensitivity is expected to be much higher for the dynamic experiments. LUR experiments were also performed at 700 s−1 and are shown in Fig. 9b. Unlike the quasi-static LUR experiments, the dynamic LUR experiments did not show a significant increase in stress during the second loading. Unfortunately, the oscillations present in the dynamic data makes it difficult to identify the subtle influence of adiabatic heating and other effects between the two experiments. Additional experiments would be needed to judge this effect, perhaps using larger plastic strain steps in LUR experiments since the present test was conducted with the first unloading at only ≈ 2 % true strain where the temperature increase is expected to be minimal.
3.3. Fracture surfaces and deformed specimens
The fractured specimens under tension during quasi-static strain rates at 22 °C and 80 °C are shown in Fig. 10. At the strain rate of 10−4 s−1 and 22 °C, the failure surface shows radial cracks in addition to some fibrous zones. This behavior was only observed at 10−4 s−1 and 22 °C. Other authors have observed this behavior for different steels such as 4340 [38,39] and 9Cr–1Mo steel [40]. At 10−2 s−1 and 100 s−1 at 22 °C, the fracture surface becomes a typical cup and cone surface indicative of ductile fracture with a fibrous center and shear lips [30]. The transition from radial cracks to a more ductile fracture surface is assumed to be from the deformation induced heating at higher strain rates. At 80 °C, ductile failure patterns typical of cylindrical specimens are observed at all strain rates.
Fig. 10:

Necked region and fracture surface of tension specimens at 10−4 s−1, 10−2 s−1, and 100 s−1 at 22 °C (left set of images) and 80 °C (right set of images).
The deformed specimens during compression at quasi-static and dynamic strain rates are shown in Fig. 11. These experiments were not loaded to failure because the failure strain will be larger than the strains reached in this study, which would likely be shear dominated failure. Slight barreling can be seen in Fig. 11 at a quasi-static rate. However, this small barreling takes place towards the end of the test and should not play a significant role at strains less than 0.15.
Fig. 11:

a) Top view and b) side view of the deformed quasi-static compression specimen. c) Top view and d) side view of the deformed dynamic compression specimen.
3.4. Hat-shaped experiments
The engineering shear stress as a function of displacement for the different hat-shaped specimens at different strain rates are shown in Fig. 12. Initially, there is an increase in strength from quasi-static to dynamic strain rate for all three hat-shaped specimen geometries, which follows the positive rate sensitivity observed in the uniaxial tension and compression experiments. For the quasi-static strain rate experiments, the axial force continually increases as the displacement increases for all 3 hat-shaped specimen geometries. At the dynamic strain rate, the flow stress increases up to a certain stress, and then decreases for the G1 and G3 specimens, indicating strain localization. This difference in behavior between the quasi-static and dynamic strain rates is expected due to thermal softening from the adiabatic deformation at the dynamic strain rates. The G3 specimen exhibited a similar flow stress response as the G1 specimen, but with an increase in strength. This is also expected because as the ratio increases, there will be a greater compression component (hydrostatic pressure) and a reduced shear component of the compression-shear stress state [22], thus, shear localization will require a larger applied force. The G1 and G2 specimens have the same ratio, but the G2 specimen has a longer shear region. Surprisingly, the G2 specimen did not exhibit a rapid drop in load at dynamic strain rates. Dougherty et al. [8] reported that a minimum strain rate is often required to cause localization. Therefore, this behavior might have to do with the strain rate and the stress-state within the shear zone.
Fig. 12:
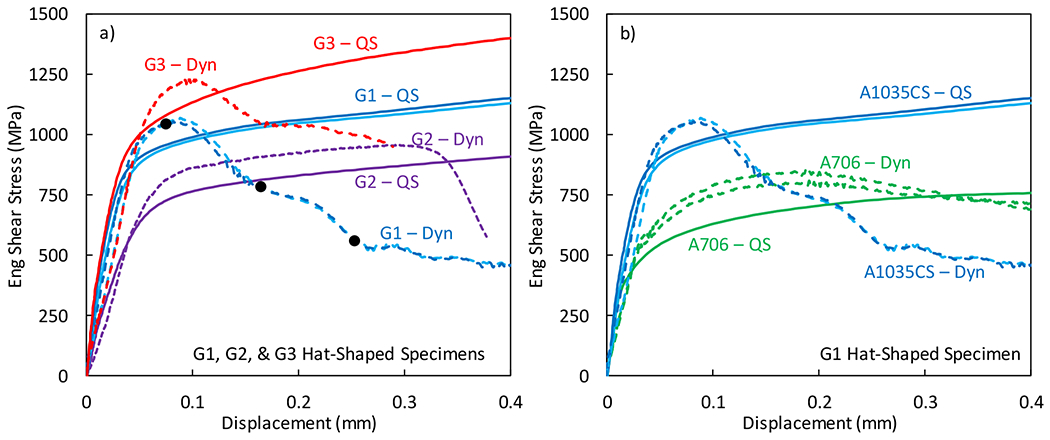
Engineering shear-stress as a function of displacement for a) G1, G2, and G3 hat-shaped specimen for A1035CS steel, and b) comparison between A1035CS from a) and A706 steel for the G1 hat-shaped specimen at quasi-static (QS) and dynamic (Dyn) strain rates. The black dots in a) indicate the locations of the interrupted experiments in Fig. 13.
Unlike comparing uniaxial tension and compression data at different strain rates, comparing the hat-shaped specimens is not as simple because the stress-state and strain-state varies within the shear zone, and they are a function of the applied displacement. As a comparison, conventional A706 Grade 60 [41] rebar steel was also tested using the G1 hat-shaped specimen geometry at quasi-static and dynamic strain rates to provide a reference to the localization behavior of A1035CS steel. As shown in Fig. 12c, the engineering shear-stress versus displacement trend is similar for both materials at quasi-static strain rates, but A706 steel exhibited a lower flow stress. At dynamic strain rates, A1035CS steel exhibits a pronounced localization behavior, while A706 steel shows more hardening up to 0.2 mm of displacement, followed by a gradual decrease in force.
To evaluate the shear evolution of the G1 hat-shaped specimen, 3 different interrupted displacements at a) 76 μm, b) 165 μm, and c) 254 μm were performed, as shown in Fig. 13. These experiments were performed using a ring spacer to limit the deformation, and the uncertainty in the applied displacement measurements is ± 25μm. The interrupted experiments are shown in Fig. 12a with black dots. At the displacement of 76 μm, cracking (white arrows in Fig. 13a) and shear deformation around the corners develop. This is a typical deformation process for a hat-shaped specimen, where deformation is initially localized around the corners of hat-shaped specimen followed by cracks that develop at and inside the corners. Surprisingly, cracking initiate near the maximum load. At the displacement of 165 μm, cracks continue to form and coalesce into larger cracks, as indicated by red arrows. This was also observed by others on Ti-6Al-4V [22] and copper [23]. Additionally, shear localization is present and is diffuse as shown in Fig. 13b with green arrows. Depending on the location, the diffuse shear band has a width of 10-25 μm. Finally, at 254 μm displacement, even larger cracks develop and combine to reach approximately 50 % of the shear region. By this point in the deformation process, a well-defined adiabatic shear band (yellow arrow) is developed within the center of the specimen with a width of ≈ 6.5 μm.
Fig. 13:

Interrupted experiments for the G1 hat-shaped specimen at displacements of a) 76 μm, b) 165 μm, and c) 254 μm. Black arrows in b) indicate the direction of shearing, which are the same for all three specimens. The white, red, green, and yellow arrows indicate cracks, cracks that have/are coalescing, shear band, fine narrow shear band, respectively.
4. Constitutive modeling
A constitutive model was developed to model the hardening, thermal softening, strain rate dependent, and tension-compression asymmetric material response of A1035CS steel. The model was developed using a novel strain rate dependent term, a modified Hockett-Sherby (MHS) model [24], and incorporating Lode angle to capture the tension-compression asymmetry of A1035CS steel. Details of the model formulation and a comparison between the experiments and the model are presented in the following subsections.
4.1. Model formulation
The material model was developed containing multiplicative terms following the widely used Johnson and Cook [42] material model:
| (3) |
Typically, Ludwik strength and hardening model is used, however it is insufficient in capturing the significant hardening in the initial stages of plastic deformation for the A1035CS steel. Therefore, a modified Hockett-Sherby (MHS) model from Noder and Butcher [24], an extension to the original Hockett and Sherby [43] material model, was used to capture the non-linear hardening behavior of this material:
| (4) |
where, is the plastic strain, is the proportional limit, and all other parameters are material constants.
The power law and linear strain rate dependent models [42,44] are insufficient to capture the non-linear strain rate hardening of A1035CS steel. Therefore, a new strain rate dependent term was developed to capture the non-linear strain rate dependence on the flow stress:
| (5) |
where, is the strain rate, is the reference strain rate, and and are constants. The model was developed such that the term reduces to 1 at the reference strain rate. The thermal softening term was adopted from Khan-Huang-Liang (KHL) model [44]:
| (6) |
where , and are the temperature, reference temperature, which is usually chosen to be room temperature, and melting temperature, respectively.
To account for the tension-compression asymmetry, the Lode angle dependent tension-compression parameter from Khan et al. [45] as an additional multiplicative term to Eq. (3) was used:
| (7) |
where and , and are Lode angle and the second and third invariant of the deviatoric stress tensor, respectively. Under uniaxial compression, and under uniaxial tension, .
By combining Eq. (3) - Eq. (7), the final form of the model is:
| (8) |
During adiabatic deformation, the temperature increase of the material was calculated by the following equation:
| (9) |
where and are the fraction of heat dissipation caused by the plastic deformation or Taylor-Quinney coefficient [46], mass density, and specific heat, respectively. The at dynamic strain rates, density, and heat capacity are assumed to be , and , respectively.
The compression data was only used to calibrate Eq. (4) – Eq. (6) because the experimental compression data set is larger by containing dynamic strain rates than in tension. The reference strain rate was chosen to be 10−4 s−1 because the rate of deformation is slow enough that there is approximately no temperature increase. Initially, the constants in Eq. (4) and Eq. (6) were calibrated using 2 experiments: 22 °C at 10−4 s−1 and 80 °C at 10−4 s−1. Once those constants were calibrated, the rate dependent constants from Eq. (5) were calibrated using 100 s−1 and dynamic strain rate experiments at both 22 °C and 80 °C. These experiments were assumed to have a Taylor-Quinney coefficient of 0.9. This topic is further discussed in Section 5.
The uniaxial compression experiments at 10−2 s−1 were not used because the experiments were slow enough that heat dissipation changes the temperature rise and assuming a fully adiabatic condition is invalid. However, the 10−2 s−1 experiments were predicted using an effective , which is an estimated fraction of heat generated from the plastic deformation plus any heat fraction dissipation into the environment. Once the hardening, strain rate, and temperature dependent terms were fitted, the Lode angle dependent tension-compression asymmetry term from Eq. (7) (constant E) was fitted to the tension data at only 10−4 s−1 at both temperatures. The specific calibrated values for the material constants are reported in Table 4.
Table 4:
Material parameters used for the constitutive model
| Parameter | Value | Units |
|---|---|---|
| 700 | MPa | |
| 1335 | MPa | |
| 400 | MPa | |
| 27.81 | ||
| 0.6124 | - | |
| 0.004128 | - | |
| 0.22037 | ||
| 10−4 | 1/s | |
| 1 | - | |
| 0.02783 | ||
| 295 | K | |
| 1773 | K |
4.2. Comparison between the model and experimental data
A comparison between the model and the experimental data are shown in Fig. 14a–d. The model captures most aspects of the uniaxial experimental data presented in this paper, including the estimated tensile curve at 10−2 s−1 assuming an effective , which was not used to fit the material constants. As reported in the results section, the experiments in both compression and tension at 80 °C had a lower flow stress at 10−2 s−1 than 10−4 s−1. The model was able to predict that response assuming an effective . According to the model, this is from the competition between thermal softening and strain rate hardening. The predicted temperature increase for the compression experiments at 22 °C at different strain rates is shown in Fig. 15a. As the strain rate increases, there is an increase in temperature due to the rate sensitivity of A1035CS steel because Eq. (9) is a function of stress, and as the strain rate increases, the flow stress increases.
Fig. 14:

Comparison between the experiments and the model fit (correlation) at different strain rates in a) compression at 22 °C, b) compression at 80 °C, c) tension at 22 °C, and d) tension at 80 °C. The experimental results for 10−2 s−1 and 100 s−1 are assuming an effective and , respectively. The 10−2 s−1 experiments in compression and tension, and 100 s−1 experiments in tension were not used for the fit, and therefore are predictions.
Fig. 15:

a) Predicted temperature increase in compression at 22 °C and at different strain rates assuming for strain rates ≥ 100 s−1 and assuming an effective for 10−2 s−1, b) predicted compressive response for the strain rate jump experiment (from Fig. 9a) from 10−4 s−1 to 100 s−1 assuming at 100 s−1. c) and d) predicted compressive response of LUR experiments from Fig. 8 at 10−2 s−1 and 100 s−1, respectively.
To assess the model prediction, the strain rate jump experiment from 10−4 s−1 to 100 s−1 was predicted (Fig. 15b) assuming 100 s−1 is fully adiabatic. The model predicted the material response well, but it was not able to capture the initial sudden yield increase and there was slight difference in the hardening rate at 100 s−1 between the experiment and the model. Further, the model was assessed by predicting the LUR experiments from Fig. 5 in compression at 10−2 s−1 (Fig. 15c) and 100 s−1 (Fig. 15d). The model under predicts the LUR experiments for both strain rates indicating mechanisms other than adiabatic heating, which are not taken into account within the model, might be playing an important role during the LUR experiments. This is discussed further in Section 5.
5. Discussion
Tension, compression, LUR, strain rate jump, and hat-shaped experimental data and modeling are discussed in the following subsections. First, the model is analyzed regarding adiabatic heating, strain rate jump experiment, and LUR experiments, as well as the accuracy and deficiencies in the model are discussed. Next, the role of inter-lath austenite, strain-partitioning between the martensite and austenite, and phase-transformation behavior are related to different aspects of the material behavior and their implications to the material model are discussed. Finally, the potential mechanisms of the tension-compression asymmetry of A1035CS steel are reported.
5.1. Constitutive model, and thermal and rate dependent material behavior
The model developed in Section 4 does capture the uniaxial mechanical behavior reasonably well for A1035CS steel in tension and compression. However, to calibrate the rate dependent portion of the model (Eq. (5)) within the quasi-static strain rates, the material was assumed to be fully adiabatic with a at 100 s−1 and above, and an effective is assumed for the 10−2 s−1 experiments for the model prediction. This is consistent with others on steel, which have shown deformation induced heating at quasi-static strain rates [15–20,34,47,48]. For example, Zou et al. [47] have shown that DP980 steel can be approximated as adiabatic at strain rates above 10−2 s−1. Andrade-Campos [34] reported that at 10−2 s−1 the heat fraction can be estimated as 0.7. Therefore, it is not unrealistic to assume a and for 100 s−1 and 10−2 s−1, respectively. However, direct temperature measurements with a high-speed infrared camera or pyrometer will be necessary to identify the correct temperature rise as a function of plastic strain and strain rates. Nonetheless, even with these assumptions for 10−2 s−1 and 100 s−1, the model under predicts the LUR experiments (Fig. 15c&d), even though the model was able to capture the strain rate jump experiment under monotonic loading condition to a certain extent. This suggests additional temperature and rate dependent deformation mechanisms might be governing the material behavior, especially once the material is unloaded, which is discussed further in Section 5.2 and 5.3.
As shown in Section 4.2, thermal softening effects during the monotonic experiments are more pronounced as the strain rate increases (Fig. 15a). We have also shown that the flow stress of the material increases as the strain rates increases (strain rate hardening) especially between quasi-static and dynamic strain rates. Using the model developed in Section 4, we are able to separate the thermal softening from the strain rate hardening effects. By doing so, the thermal and rate dependent material behavior of A1035CS steel is attributed to the competition between thermal softening and strain rate hardening. At low strain rates, the thermal softening and strain rate hardening are approximately equal, but at dynamic strain rates, the strain rate hardening is greater than thermal softening, resulting in a higher flow stress at dynamics strain rates. Non-linear strain rate hardening behavior has been shown on different steels, where the strain rate hardening is small as quasi-static strain rates but begins to increase at strain rates greater than 10 s−1[32,33].
Extrapolating the present model outside the calibration range presented here should be avoided or done with caution. The Lode angle dependent term captures the tension-compression asymmetry, but this does not suggest that the model is able to capture the material response under shear or other stress-states. Torsion or simple shear experiments will be necessary to validate the model under such conditions. Also, the Lode angle dependent term does not provide a way to account for material anisotropy due to thermomechanical processing, which was not investigated in this study.
We are also unsure how the model will perform outside of the calibrated temperature range. The model calibration was never designed to be used for modeling temperatures much larger than 80 °C or in an adiabatic shear band at high strains such as in the hat-shaped specimen experiments at dynamic strain rates. Ideally, to calibrate such a model, high temperature experiments up to melting temperature should be performed using advanced rapid heating techniques such as in Mates et al. [49,50] to avoid time dependent microstructural changes. For A1035CS steel, long heating times at high enough temperatures using conventional heating methods will decompose the inter-lath austenite and form carbides [6]. Using such data to calibrate a model for simulating adiabatic shear band in the hat-shaped specimen would be inaccurate. In addition to the plasticity model, we have shown that cracks that form at and inside the corners of the hat-shaped specimens develop near the maximum load. This highlights the importance of a comprehensive fracture study, similar to [51], to model and simulate the deformation behavior of this material in the hat-shaped specimen, which is outside the scope of this investigation.
5.2. Inter-lath austenite and strain partitioning
The Ludwik hardening model is typically sufficient in capturing the hardening behavior of most metals. However, it was inadequate for A1035CS steel for its high strain hardening at low strains. As stated previously, A1035CS steel consists of untransformed nano-sheets of austenite in-between the lath martensite, where the austenite is typically chemically stabilized in many different steels by carbon [52], nitrogen, and manganese [53], among other elements. Additionally, thin austenite films found in A1035CS steel are typically more stable than bulky austenite [54–57]. However, austenite is softer than martensite, therefore, austenite begins to deform prior to martensite, resulting in high hardening in the initial stages of deformation as strain is partitioned over to the harder martensite [58,59]. The high hardening is from the work hardening of the austenite phase and the high back stresses from strain incompatibilities between the phases and grains [59,60]. This strain partitioning effect is often attributed to the “unloading yield effect” and reload yield stress increase [59–61], similar to what is observed for the LUR experiments on A1035CS steel.
The retained austenite is intentional for A1035CS steel, since it is well-known to improve ductility and fracture toughness in martensitic steels [6,54,62–65]. Maresca et al. [63,64] modeled the inter-lath austenite and showed how it improves the ductility of the lath martensite by accommodating dislocations on the planes, which run parallel to the martensite habit plane (Kurdjumov-Sachs orientation relationship [66]), to cross without piling up at the interface. They also showed that depending on the loading condition, the majority of deformation can be accommodated by the austenite phase at low strains. They also reported that as little as 5 % inter-lath retained austenite, in combination with crystallographic orientation of the lath, can significantly enhance ductility of martensite.
Although inter-lath austenite can enhance the ductility of steel, strain partitioning and deformation induced heating at strain rates of 10−2 s−1 and greater can cause heterogeneous temperature gradients, where the temperature within the austenite can be greater than within the martensite. The difference in temperature should be larger as the strain rate increases due to the time duration for heat to conduct from the austenite to the martensite phase. During the LUR experiments, the specimen is at 22 °C prior to being reloaded. Therefore, the reload yield stress increase can be partly attributed to strain partitioning effects, but also from the increase in strength of the austenite and martensite, which are strain rate dependent, as thermal softening effects of both phases are removed. However, during continual straining, the flows stress of the LUR experiments decease indicating the activation of softening mechanisms, likely strain partitioning effects and thermal softening. Regardless, this will require further investigations to conclude the effect of strain partitioning on the rate dependent mechanical behavior of A1035CS steel.
The strain partitioning effect between the different phases could also explain the localization behavior of A1035CS steel in the hat-shaped specimens at high strain rates. As strain increases in the austenite phase at dynamic strain rate, heterogeneous temperature gradients between the austenite and martensite phase increases, thereby softening the austenite at a higher rate than the martensite, further confining the localized deformation and hindering strain hardening to distribute the strain across a larger region. Aside from the different phases, the ductility of A1035CS steel is further improved by the lack of carbides, which are void nucleation sites [54,67].
5.3. Phase-transformation
Austenite-to-martensite phase transformation is another important deformation mechanism that might be influencing the hardening, thermal, and rate dependent mechanical behavior of this material. As stated above, unlike bulk austenite, the thin austenite films found in A1035CS steel are typically more stable [54–57], but this does not indicate that the austenite phase will not transform to martensite under large stresses and strains under proper strain rate and temperature conditions.
It is well-known that retained austenite in steel can exhibit martensitic transformation when plastically deformed, which has been reported to be rate and thermally dependent [15–17,20,68,69]. For example, Zou et al. [47] have shown that DP980 steel, which contains ≈ 11 % austenite, experiences rate and temperature dependent martensitic transformation during plastic deformation. They showed small strain rate sensitivity between strain rates of 10−4 s−1 and 0.1 s−1 and higher sensitivity at higher strain rates, similar to the A1035CS steel studied here. They reported that there is a competition between thermal effects and rate dependent deformation that alters the phase transformation behavior, which follows the conclusions of Hecker et al. [16] and Olson and Cohen [70] on strain induced phase transformation. At moderate strain rates of 10−3 s−1 to 10−1 s−1, adiabatic heating effects overcome the strain rate effects, leading to a decrease in the transformation rate [47], but at 2 s−1, this behavior is reversed. Regardless, the rate dependent phase transformation behavior is dependent on material and austenite stability [20,48]. The reported flow stress behavior of the aforementioned literatures at different strain rates have similarities to our experimental results on A1035CS steel, and this could suggest similar rate and temperature dependent phase transformation behavior might be influencing the mechanical behavior of A1035CS steel. Nonetheless, a comprehensive phase transformation study at different strain rates and temperatures would be needed to elucidate the reasoning behind the distinct mechanical behavior of A1035CS steel.
5.4. Tension-compression asymmetry
The austenite-to-martensite phase transformation behavior could also offer reasoning behind the tension-compression asymmetry. Young [71] showed that martensitic transformation is loading direction dependent (tension or compression). They showed that uniaxial tension resulted in a higher volume fraction of phase transformation for a given plastic strain compared to compression. This was also shown recently by He et al. [72] for different stress states ranging from biaxial tension to simple shear. However, other reasoning could have to do with the manufacturing process of this material, which could induce kinematic hardening of the material (often referred to as Bauschinger effect [73]), but further investigation is necessary to conclude the reasoning.
6. Summary and conclusions
Uniaxial tension and compression experiments at quasi-static and dynamic strain rates on ASTM A1035CS steel were conducted at 22 °C and 80 °C. A1035CS steel exhibits tension-compression asymmetry at both 22 °C and 80 °C, where the strength in compression is larger than in tension. The material showed small strain rate sensitivity in the quasi-static regime and a pronounced positive strain rate sensitivity as the strain rate increases from quasi-static to dynamic. The small strain rate sensitivity at quasi-static strain rates in tension and compression was partly attributed to the low strain rate hardening of the material, and partially attributed to thermal softening from the temperature rise due to the plastic deformation.
The dynamic compression data is not enough to investigate the localization behavior of this material. Therefore, compression tests on hat-shaped specimens were used to confine the deformation under compression and shear. Different hat-shaped specimens were tested to alter the strain rate and the stress state within the shear zone. We have shown that the shear localization developed by a load drop in the hat-shaped specimen requires a certain applied displacement rate or strain rate within the shear zone, which was also shown by Dougherty et al. [8]. We also have shown that localization in A1035CS steel initiates with cracks at and inside the corners, which they then grow and combine to develop larger cracks. In conjunction with the cracks forming, diffuse shear deformation is progressive within the shear zone with displacement until a very fine adiabatic shear band is developed.
A constitutive model was developed using a modified Hockett-Sherby (MHS) hardening model [24] to capture the high work hardening behavior at low strains and low hardening at higher strains for A1035CS steel. A new nonlinear strain rate dependent term was developed to model the material behavior at different strain rates. The model also incorporates the Lode angle to capture the tension-compression asymmetry of the material. A good agreement between the model and the experimental data was shown.
The high work hardening rate at low strains indicates strain partitioning effects between the austenite and martensite phases might be active. Using the constitutive model, the separation between thermal softening and rate dependent material behavior suggests that the increase in flow stress during the subsequent reload during the LUR experiments at 10−2 s−1 and 100 s−1 is partly attributed to thermal softening, but also potentially strain partitioning effects between the two phases and the possibility of austenite-to-martensite phase transformation. While the contribution of thermal softening was modeled as a bulk temperature increase, the strain contribution from the softer austenite phase can be larger than in the martensite, and therefore local temperature heterogeneity could be playing an important role in mechanical behavior of A1035CS steel at strain rates greater than 10−2 s−1. However, to conclude the exact reasoning behind the distinct rate dependent mechanical behavior of A1035C steel will require further investigations.
Acknowledgements
We would like to thank Commercial Metals Company (CMC) and Tom Russo from CMC for providing the machined specimens and partially funding this work. We would also like to thank Dr. Mark Stoudt (NIST) for polishing and etching the hat-shaped specimens for the optical micrographs, as well as Dr. Steven Mates (NIST) for the fruitful discussions and for the thorough review of this manuscript.
Footnotes
Disclaimer
Certain commercial firms and trade names are identified in this report in order to specify aspects of the experimental procedure adequately. Such identification is not intended to imply recommendation or endorsement by the National Institute of Standards and Technology, nor is it intended to imply that the materials or equipment identified are necessarily the best available for the purpose.
References
- [1].Clemena GG, Virmani YP, Comparing the chloride resistances of reinforcing bars, Concrete International. 26 (2004) 39–49. [Google Scholar]
- [2].ASTM A1035CS, Standard specification for deformed and plain, low-carbon, chromium, steel bars for concrete reinforcement, 2016.
- [3].Faza S, Kwok J, Salah O, Application of High-Strength and Corrosion-Resistant ASTM A1035 Steel Reinforcing Bar in Concrete High-Rise Construction, Design and Sustainability. (2007) 211. [Google Scholar]
- [4].Thomas G, Kusinski G, Lath (Packet) Martensite Revisited, (2000) 4. [Google Scholar]
- [5].Kusinski G, Thomas G, High Strength, Toughness and Nanostructure Considerations for Fe/Cr/Mn/C Lath Martensitic Steels, in: Proceedings of 1st International Conference on Super-High Strength Steels, Rome, Italy, 2005. [Google Scholar]
- [6].Sarikaya M, Jhingan AK, Thomas G, Retained Austenite and Tempered Martensite Embrittlement in Medium Carbon Steels, Metallurgical and Materials Transactions A. (1983) 13. [Google Scholar]
- [7].Sarikaya M, Steinberg BG, Thomas G, Optimization of Fe/Cr/C base structural Steels for improved strength and toughness, MTA. 13 (1982) 2227–2237. [Google Scholar]
- [8].Dougherty LM, Cerreta EK, Gray GT, Trujillo CP, Lopez MF, Vecchio KS, Kusinski GJ, Mechanical Behavior and Microstructural Development of Low-Carbon Steel and Microcomposite Steel Reinforcement Bars Deformed under Quasi-Static and Dynamic Shear Loading, Metall and Mat Trans A. 40 (2009) 1835–1850. [Google Scholar]
- [9].El-Hacha R, Rizkalla S, Behaviour of MMFX-2 Microcomposite Steel and Stainless Steel Rebars In Uniaxial Tension, Technical Report, North Carolina State University, Constructed Facilities, 2002. [Google Scholar]
- [10].Dwairi H, Dawood M, Rizkalla S, Faza S, Shear and Flexural Behavior of Concrete Members Reinforced with MMFX Steel, 7th International Conference on Multi-Purpose High-Rise Towers and Tall Buildings. (2005) 9. [Google Scholar]
- [11].Abed F, Abdul-Latif A, Voyiadjis GZ, Performance of MMFX Steel Rebar at Elevated Temperatures, Journal of Engineering Mechanics. 146 (2020) 04020126. [Google Scholar]
- [12].Song Y, Yeon J, Voyiadjis GZ, Constitutive Modeling and Numerical Simulations for Dynamic Strain Aging in MMFX Steel at Elevated Temperatures, International Journal of Mechanical Sciences. (2021) 106743. [Google Scholar]
- [13].Meyers MA, Xu YB, Xue Q, Pérez-Prado MT, McNelley TR, Microstructural evolution in adiabatic shear localization in stainless steel, Acta Materialia. 51 (2003) 1307–1325. [Google Scholar]
- [14].Hartmann K-H, Kunze H-D, Meyer L, Metallurgical effects on impact loaded materials, in: Shock Waves and High-Strain-Rate Phenomena in Metals, Springer, 1981: pp. 325–337. [Google Scholar]
- [15].Talonen J, Nenonen P, Pape G, Hänninen H, Effect of Strain Rate on the Strain-Induced Martensite Transformation and Mechanical Properties of Austenitic Stainless Steels, Metallurgical and Materials Transactions A. (2004) 421–432. [Google Scholar]
- [16].Hecker SS, Stout MG, Staudhammer KP, Smith JL, Effects of Strain State and Strain Rate on Deformation-Induced Transformation in 304 Stainless Steel: Part I. Magnetic Measurements and Mechanical Behavior, MTA. 13 (1982) 619–626. [Google Scholar]
- [17].Angel T, Formation of martensite in austenitic stainless steels, J. Iron Steel Inst 177 (1954) 165–174. [Google Scholar]
- [18].Benzing JT, Poling WA, Pierce DT, Bentley J, Findley KO, Raabe D, Wittig JE, Effects of strain rate on mechanical properties and deformation behavior of an austenitic Fe-25Mn-3Al-3Si TWIP-TRIP steel, Materials Science and Engineering: A. 711 (2018) 78–92. [Google Scholar]
- [19].Benzing JT, Liu Y, Zhang X, Luecke WE, Ponge D, Dutta A, Oskay C, Raabe D, Wittig JE, Experimental and numerical study of mechanical properties of multi-phase medium-Mn TWIP-TRIP steel: Influences of strain rate and phase constituents, Acta Materialia. 177 (2019) 250–265. [DOI] [PMC free article] [PubMed] [Google Scholar]
- [20].Poling WA, Tensile deformation of third generation advanced high strength sheet steels under high strain rates, PhD Thesis, Colorado School of Mines, 2016. [Google Scholar]
- [21].López JG, Peirs J, Verleysen P, Degrieck J, Effect of small temperature variations on the tensile behaviour of Ti-6Al-4V, Procedia Engineering. 10 (2011) 2330–2335. [Google Scholar]
- [22].Peirs J, Verleysen P, Degrieck J, Coghe F, The use of hat-shaped specimens to study the high strain rate shear behaviour of Ti-6Al-4V, International Journal of Impact Engineering. 37 (2010) 703–714. [Google Scholar]
- [23].Meyers M, Meyer L, Vecchio K, Andrade U, High strain, high strain-rate deformation of copper, Le Journal de Physique IV. 1 (1991) C3–11. [Google Scholar]
- [24].Noder J, Butcher C, A comparative investigation into the influence of the constitutive model on the prediction of in-plane formability for Nakazima and Marciniak tests, International Journal of Mechanical Sciences. 163 (2019) 105138. [Google Scholar]
- [25].ECT Team, MMFX Microcomposite Steel (MMFX2), Purdue. ECT Fact Sheets (2007). [Google Scholar]
- [26].ASTM E8, Standard test methods for tension testing of metallic materials, Annual Book of ASTM Standards. ASTM. (2011). [Google Scholar]
- [27].Habib SA, Khan AS, Gnäupel-Herold T, Lloyd JT, Schoenfeld SE, Anisotropy, tension-compression asymmetry and texture evolution of a rare-earth-containing magnesium alloy sheet, ZEK100, at different strain rates and temperatures: Experiments and modeling, International Journal of Plasticity. 95 (2017) 163–190. [Google Scholar]
- [28].Chen W, Song B, Split Hopkinson (Kolsky) Bar, Springer US, Boston, MA, 2011. [Google Scholar]
- [29].Safa K, Gary G, Displacement correction for punching at a dynamically loaded bar end, International Journal of Impact Engineering. 37 (2010) 371–384. [Google Scholar]
- [30].Dieter GE, Bacon DJ, Mechanical metallurgy, McGraw-hill; New York, 1986. [Google Scholar]
- [31].Schindelin J, Arganda-Carreras I, Frise E, Kaynig V, Longair M, Pietzsch T, Preibisch S, Rueden C, Saalfeld S, Schmid B, others, Fiji: an open-source platform for biological-image analysis, Nature Methods. 9 (2012) 676–682. [DOI] [PMC free article] [PubMed] [Google Scholar]
- [32].Jin H, Sanborn B, Lu W-Y, Song B, Mechanical characterization of 304L-VAR stainless steel in tension with a full coverage of low, intermediate, and high strain rates, Mechanics of Materials. 152 (2021) 103654. [Google Scholar]
- [33].Vural M, Ravichandran G, Rittel D, Large strain mechanical behavior of 1018 cold-rolled steel over a wide range of strain rates, Metall and Mat Trans A. 34 (2003) 2873–2885. [Google Scholar]
- [34].Andrade-Campos A, Teixeira-Dias F, Krupp U, Barlat F, Rauch EF, Grácio JJ, Effect of Strain Rate, Adiabatic Heating and Phase Transformation Phenomena on the Mechanical Behaviour of Stainless Steel: Effect of Strain Rate on Stress-Strain Behaviour of Stainless Steel, Strain. 46 (2008) 283–297. [Google Scholar]
- [35].Cullen GW, Korkolis YP, Ductility of 304 stainless steel under pulsed uniaxial loading, International Journal of Solids and Structures. 50 (2013) 1621–1633. [Google Scholar]
- [36].Jia B, Rusinek A, Pesci R, Bahi S, Bernier R, Thermo-viscoplastic behavior of 304 austenitic stainless steel at various strain rates and temperatures: Testing, modeling and validation, International Journal of Mechanical Sciences. 170 (2020) 105356. [Google Scholar]
- [37].Hauser M, Wendler M, Fabrichnaya O, Volkova O, Mola J, Anomalous stabilization of austenitic stainless steels at cryogenic temperatures, Materials Science and Engineering: A. 675 (2016) 415–420. [Google Scholar]
- [38].Boyce BL, Dilmore M, Crenshaw TB, The strain-rate sensitivity of high-strength high-toughness steels, United States. Department of Energy, 2006. [Google Scholar]
- [39].Boyce BL, Dilmore MF, The dynamic tensile behavior of tough, ultrahigh-strength steels at strain-rates from 0.0002 s- 1 to 200 s- 1, International Journal of Impact Engineering. 36 (2009) 263–271. [Google Scholar]
- [40].Verma P, Sudhakar Rao G, Srinivas NCS, Singh V, Rosette fracture of modified 9Cr–1Mo steel in tension, Materials Science and Engineering: A. 683 (2017) 172–186. [Google Scholar]
- [41].ASTM A706, Specification for Deformed and Plain Low-Alloy Steel Bars for Concrete Reinforcement, ASTM International, 2016. [Google Scholar]
- [42].Johnson GR, Cook WH, A constitutive model and data for metals subjected to large strains, high strain rates and high temperatures, in: Proceedings of the 7th International Symposium on Ballistics, The Netherlands, 1983: pp. 541–547. [Google Scholar]
- [43].Hockett J, Sherby O, Large strain deformation of polycrystalline metals at low homologous temperatures, Journal of the Mechanics and Physics of Solids. 23 (1975) 87–98. [Google Scholar]
- [44].Khan AS, Sung Suh Y, Kazmi R, Quasi-static and dynamic loading responses and constitutive modeling of titanium alloys, International Journal of Plasticity. 20 (2004) 2233–2248. [Google Scholar]
- [45].Khan AS, Yu S, Liu H, Deformation induced anisotropic responses of Ti–6Al–4V alloy Part II: A strain rate and temperature dependent anisotropic yield criterion, International Journal of Plasticity. 38 (2012) 14–26. [Google Scholar]
- [46].Taylor GI, Quinney H, The latent energy remaining in a metal after cold working, Proceedings of the Royal Society of London. Series A, Containing Papers of a Mathematical and Physical Character. 143 (1934) 307–326. [Google Scholar]
- [47].Zou DQ, Li SH, He J, Temperature and strain rate dependent deformation induced martensitic transformation and flow behavior of quenching and partitioning steels, Materials Science and Engineering: A. 680 (2017) 54–63. [Google Scholar]
- [48].Finfrock CB, Thrun MM, Bhattacharya D, Ballard TJ, Clarke AJ, Clarke KD, Strain Rate Dependent Ductility and Strain Hardening in Q&P Steels, Metall Mater Trans A. 52 (2021) 928–942. [Google Scholar]
- [49].Mates SP, Rhorer R, Whitenton E, Burns T, Basak D, A Pulse-Heated Kolsky Bar Technique for Measuring the Flow Stress of Metals at High Loading and Heating Rates, Exp Mech. 48 (2008) 799–807. [Google Scholar]
- [50].Mates SP, Vax E, Rhorer RR, Stoudt MR, Dynamic Flow Stress Behavior of Hypo-Eutectoid Ferrite-Pearlite Steels Under Rapid Heating, J. Dynamic Behavior Mater 6 (2020) 246–265. [Google Scholar]
- [51].Habib SA, Lloyd JT, Meredith CS, Khan AS, Schoenfeld SE, Fracture of an anisotropic rare-earth-containing magnesium alloy (ZEK100) at different stress states and strain rates: Experiments and modeling, International Journal of Plasticity. In Press (2019). [Google Scholar]
- [52].Morito S, Huang X, Furuhara T, Maki T, Hansen N, The morphology and crystallography of lath martensite in alloy steels, Acta Materialia. 54 (2006) 5323–5331. [Google Scholar]
- [53].Schaeffler AL, Constitution diagram for stainless steel weld metal, Metal Progress. 56 (1949) 680. [Google Scholar]
- [54].Bhadeshia HKDH, Theory and significance of retained austenite in steels, PhD Thesis, University of Cambridge, 1980. [Google Scholar]
- [55].Xiong XC, Chen B, Huang MX, Wang JF, Wang L, The effect of morphology on the stability of retained austenite in a quenched and partitioned steel, Scripta Materialia. 68 (2013) 321–324. [Google Scholar]
- [56].Wang M-M, Tasan CC, Ponge D, Kostka A, Raabe D, Smaller is less stable: Size effects on twinning vs. transformation of reverted austenite in TRIP-maraging steels, Acta Materialia. 79 (2014) 268–281. [Google Scholar]
- [57].Krauss G, Marder AR, The morphology of martensite in iron alloys, Metallurgical Transaction. 2 (1971) 2343–2357. [Google Scholar]
- [58].Tomota Y, Kuroki K, Mori T, Tamura I, Tensile deformation of two-ductile-phase alloys: Flow curves of α-γ Fe-Cr-Ni alloys, Materials Science and Engineering. 24 (1976) 85–94. [Google Scholar]
- [59].Yang MX, Yuan FP, Xie QG, Wang YD, Ma E, Wu XL, Strain hardening in Fe–16Mn–10Al–0.86C–5Ni high specific strength steel, Acta Materialia. 109 (2016) 213–222. [Google Scholar]
- [60].Wu X, Yang M, Yuan F, Wu G, Wei Y, Huang X, Zhu Y, Heterogeneous lamella structure unites ultrafine-grain strength with coarse-grain ductility, Proc Natl Acad Sci USA. 112 (2015) 14501–14505. [DOI] [PMC free article] [PubMed] [Google Scholar]
- [61].Nieh TG, Nix WD, Unloading yield effects in aluminum alloys, MTA. 17 (1986) 121–126. [Google Scholar]
- [62].Thomas G, Retained austenite and tempered martensite embrittlement, MTA. 9 (1978) 439–450. [Google Scholar]
- [63].Maresca F, Kouznetsova VG, Geers MGD, Subgrain lath martensite mechanics: A numerical–experimental analysis, Journal of the Mechanics and Physics of Solids. 73 (2014) 69–83. [Google Scholar]
- [64].Maresca F, Kouznetsova VG, Geers MGD, On the role of interlath retained austenite in the deformation of lath martensite, Modelling Simul. Mater. Sci. Eng 22 (2014) 045011. [Google Scholar]
- [65].Mine Y, Hirashita K, Takashima H, Matsuda M, Takashima K, Micro-tension behaviour of lath martensite structures of carbon steel, Materials Science and Engineering: A. 560 (2013) 535–544. [Google Scholar]
- [66].Kurdjumow G, Sachs G, Über den mechanismus der stahlhärtung, Zeitschrift Für Physik. 64 (1930) 325–343. [Google Scholar]
- [67].Benzerga AA, Besson J, Pineau A, Anisotropic ductile fracture, Acta Materialia. 52 (2004) 4623–4638. [Google Scholar]
- [68].Olson GB, Cohen M, A mechanism for the strain-induced nucleation of martensitic transformations, Journal of the Less Common Metals. 28 (1972) 107–118. [Google Scholar]
- [69].Wang M, Huang MX, Abnormal TRIP effect on the work hardening behavior of a quenching and partitioning steel at high strain rate, Acta Materialia. 188 (2020) 551–559. [Google Scholar]
- [70].Olson G, Cohen M, Kinetics of strain-induced martensitic nucleation, Metallurgical Transactions A. 6 (1975) 791–795. [Google Scholar]
- [71].Young C-C, Transformation toughening in phosphocarbide-strengthened austenitic steels, 1988. [Google Scholar]
- [72].He J, Han G, Li S, Zou D, To correlate the phase transformation and mechanical behavior of QP steel sheets, International Journal of Mechanical Sciences. 152 (2019) 198–210. [Google Scholar]
- [73].Joo G, Huh H, Rate-dependent isotropic–kinematic hardening model in tension–compression of TRIP and TWIP steel sheets, International Journal of Mechanical Sciences. 146 (2018) 432–444. [Google Scholar]