

Summary
Hexaploid wheat (Triticum aestivum), a major staple crop, has a remarkably large genome of ~14.4 Gb (containing 106 913 high‐confidence [HC] and 159 840 low‐confidence [LC] genes in the Chinese Spring v2.1 reference genome), which poses a major challenge for functional genomics studies. To overcome this hurdle, we performed whole‐exome sequencing to generate a nearly saturated wheat mutant database containing 18 025 209 mutations induced by ethyl methanesulfonate (EMS), carbon (C)‐ion beams, or γ‐ray mutagenesis. This database contains an average of 47.1 mutations per kb in each gene‐coding sequence: the potential functional mutations were predicted to cover 96.7% of HC genes and 70.5% of LC genes. Comparative analysis of mutations induced by EMS, γ‐rays, or C‐ion beam irradiation revealed that γ‐ray and C‐ion beam mutagenesis induced a more diverse array of variations than EMS, including large‐fragment deletions, small insertions/deletions, and various non‐synonymous single nucleotide polymorphisms. As a test case, we combined mutation analysis with phenotypic screening and rapidly mapped the candidate gene responsible for the phenotype of a yellow‐green leaf mutant to a 2.8‐Mb chromosomal region. Furthermore, a proof‐of‐concept reverse genetics study revealed that mutations in gibberellic acid biosynthesis and signalling genes could be associated with negative impacts on plant height. Finally, we built a publically available database of these mutations with the corresponding germplasm (seed stock) repository to facilitate advanced functional genomics studies in wheat for the broad plant research community.
Keywords: wheat mutant, whole‐exome sequencing, EMS, γ‐rays, C‐ion beams, functional genomics
Introduction
Wheat (Triticum aestivum L.) is one of the most important staple crops worldwide, contributing ~20% of the total calories consumed by humans globally (IWGSC, 2018). The genome of widely cultivated allohexaploid bread wheat consists of three subgenomes that share high sequence similarity and structural conservation (IWGSC, 2014). Due to its large genome size, polyploidy, and complex DNA repeat sequences, functional studies in wheat have lagged behind those of other species (Walkowiak et al., 2020). However, the recent refinement and release of a new reference genome for the model cultivar Chinese Spring has accelerated functional genomics studies in wheat (IWGSC, 2018; Zhu et al., 2021).
A major limiting factor for functional genomics studies is the lack of mutational resources with easily accessible genomic information. Although an ethyl methanesulfonate (EMS)‐induced mutant library constructed using whole‐exome capture was previously reported in wheat (Krasileva et al., 2017), considerable efforts (i.e., more mutant lines) are needed to cover most of the annotated genes due to the large size of the wheat genome, which is ~14.4 Gb and contains 106 913 high‐confidence (HC) and 159 840 low‐confidence (LC) annotated genes (Zhu et al., 2021). Based on differences in the efficiency and mutation types induced by different mutagenesis methods, the most diverse, broad‐coverage mutant library could be produced using a combination of chemical and physical mutagenic approaches, although such resources are seldom reported.
Although several studies have characterized the mutation types preferentially induced by various chemical or physical mutagens, a molecular‐level comparison of EMS‐, γ‐ray‐, and heavy ion beam‐induced mutations to facilitate mutagen selection has not been reported. EMS in wheat mainly produces G‐to‐A and C‐to‐T transitions, as well as a smaller number of deletions (Krasileva et al., 2017). By contrast, γ‐ray and heavy ion beam mutagens, which are effective in Arabidopsis (Arabidopsis thaliana; Yoshihara et al., 2013), tend to induce more diverse mutations in plants, including single‐base substitutions, insertions, deletions, inversions, and translocations (Nawaz and Shu, 2014). Carbon (C)‐ion beam irradiation induces more single‐base substitutions and small insertions/deletions (indels) than Argon (Ar) ions in Arabidopsis (Kazama et al., 2017). Genome‐wide sequencing of C‐ion beam‐induced Arabidopsis mutants revealed a higher prevalence of base substitutions than indels, among which transitions and transversions occurred at comparable frequencies (Du et al., 2017). By contrast, the molecular characteristics of γ‐ray‐ and C‐ion beam‐induced mutations in wheat have been largely overlooked.
In this study, we used whole‐exome capture of 2162 hexaploid wheat mutant lines to identify 18 025 209 mutations, covering 96.7% of HC genes, and performed forward mapping of one mutation that affects leaf colour, delimiting it to a 2.8‐Mb chromosomal region. By comparing sequence variations, we also uncovered the molecular features of mutations induced by EMS, γ‐ray, or C‐ion beam irradiation and performed case studies involving reverse genetic analysis of the functional disruption of gibberellic acid (GA) biosynthesis and signalling genes that affect plant height in various mutant lines. We also established a publically accessible mutant database in wheat with an accompanying seed germplasm repository to facilitate basic research and molecular breeding of wheat globally. This large‐scale wheat mutant population provides a powerful and informative resource for wheat functional genomics studies that will enable rapid advances in wheat research and production.
Results
Genome‐wide sequencing and assembly of the Jing411 wheat genome
In this study, we selected Jing411 as the wild type (WT) to construct a mutant library, as this major wheat variety is cultivated in the Northern winter wheat region in China and has been used as a core parent for local breeding for decades. To obtain accurate mutation sequences, especially for identifying indels between WT and mutant lines, we performed long‐read sequencing of WT Jing411 on the PacBio Sequel II platform with the continuous long reads (CLR) model. We obtained 450 Gb of clean data with an average read depth of ~30× after filtering. We assembled the high‐quality reads and oriented the contigs according to the Chinese Spring RefSeq v2.1 (Zhu et al., 2021). Finally, we corrected the sequences by resequencing the WT genome (30× coverage) using Illumina PE150. The assembly generated 168 572 contigs for a total of 14.2 Gb with an N50 of 565 kb and an N90 of 96 kb. The longest contig was 6.6 Mb on chromosome 7B. We used the newly assembled Jing411 genome to identify mutations, especially large‐fragment deletions, in mutant lines derived from Jing411.
Identification of mutations in the 2162 mutant lines
To establish a mutant population for genetic improvement in wheat, we performed whole‐exome sequencing of 2162 mutant lines, including 1630 EMS‐, 274 γ‐ray‐, and 258 C‐ion beam‐induced mutants derived from Jing411 (Figure 1). Among these, 1719 lines (1202 EMS, 261 γ‐ray, and 256 C‐ion beam) were M2 lines, while 443 lines (428 EMS, 13 γ‐ray, and 2 C‐ion beam) were stable across many generations (≥M6; hereafter referred to as “high generation lines”). In this mutant population, numerous phenotypic variations were visible, such as variations in plant architecture, spike morphology, and seed morphology (Figure S1). In total, we obtained 34 959 398 368 500 bp of clean sequencing data, ranging from 1 598 327 100 to 51 951 589 800 bp for each sample, with an average of 16 169 934 491 bp per sample (Table S1).
Figure 1.

Overview of the method used to establish the wheat mutant database by exome capture sequencing. Dry wheat seeds were treated with ethyl methanesulfonate, γ‐rays, or C‐ion beam irradiation. M1 or M2 plants were propagated by single seed descent; for each M2 line, M3 plants were grown in a row to obtain seed stocks for distribution. Finally, 1719 M2 lines and 443 high generation lines were used for exome capture sequencing. The mutation information was deposited into a public database.
We aligned the clean reads to the newly assembled Jing411 genome. The average coding sequence (CDS) coverage per sample was ~43×, and the average number of read depth of variants detected in the mutants was ~35×. We identified 18 025 209 variations, including 17 176 497 single nucleotide polymorphisms (SNPs), 442 110 small insertions, 406 601 small deletions, and 68 323 large‐fragment deletions (Table S3). Functional mutations were identified in 96.7% of the HC genes and 70.5% of the LC genes, with an average of 47.1 mutations detected per kb of CDS in each gene in this combined mutant population (Table S3). These results demonstrate that whole‐exome sequencing can provide a reliable resource for mutation analysis of most functional genes in wheat.
Comparative effects of EMS, γ‐ray irradiation, and C‐ion beam irradiation
To promote the selection of the most suitable mutagenesis method for different research questions, we compared differences in the variations introduced by each mutagenesis method. The average number of mutations differed substantially among populations obtained by EMS (1630 lines), γ‐rays (274 lines), or C‐ion beam (258 lines) irradiation (Table 1). In general, EMS lines had the most mutations (average of 8818 per sample), while C‐ion beam‐induced lines had the fewest mutations (average of 5586 per sample). SNPs comprised the largest proportion of mutations in all three mutagenesis populations. C‐ion beam and γ‐ray irradiation induced relatively high percentages of indels compared to EMS mutagens (Table 1).
Table 1.
Number of SNP, small insertions and deletions induced by γ‐ray, C‐ion beam and EMS.
| γ ray | C ion beam | EMS | All | |
|---|---|---|---|---|
| No. of samples | 274 | 258 | 1630 | 2162 |
| SNP | 1 982 253 | 1 281 910 | 13 912 334 | 17 176 497 |
| Small INS | 116 692 | 85 951 | 239 467 | 442 110 |
| Small DEL | 111 401 | 73 243 | 221 958 | 406 602 |
| Total | 2 210 346 | 1 441 104 | 14 373 759 | 18 025 209 |
| mutations/sample | 8066.96 | 5585.67 | 8818.26 | 8337.28 |
| SNP (%) | 89.68 | 88.95 | 96.79 | 95.29 |
| INS (%) | 5.28 | 5.96 | 1.67 | 2.45 |
| DEL (%) | 5.04 | 5.08 | 1.54 | 2.26 |
Among EMS‐induced mutations, 82.9% of SNPs were G‐to‐A and C‐to‐T transitions, while these conversions represented 42.6% and 44.6% of the SNP variations generated by γ‐ray and C‐ion beam irradiation, respectively. Conversely, γ‐ray and C‐ion beam irradiation induced higher percentages of T‐to‐C and A‐to‐G transitions compared to EMS treatment (Figure 2a; Table S5). Among the four types of transversions, the percentages of C:G > G:C and C:G > A:T transversions were higher than the two other types of transversions in all three mutant populations (Figure 2a; Table S5). The ratio of transition (Ts) to transversion (Tv) was 9.3 for EMS‐induced SNPs but only 2.1 and 2.2 for γ‐ray‐ and C‐ion beam‐induced mutations, respectively (Table S5). We also compared the amino acid changes induced by EMS, γ‐ray and C‐ion beam irradiation. Since the number of EMS mutations was much higher than that of the other two mutagens in this mutant population, to vision all amino acid changes with the same scale, the number of different kinds of amino acid changes induced by EMS and γ‐ray irradiation was synchronously decreased by a factor of 2 and 65, respectively. The results showed that the amino acid changes induced by γ‐ray or C‐ion beam irradiation were more diverse than those induced by EMS (Figure 2b–d).
Figure 2.

Comparison of the percentage of different types of SNP variations and the amino acid changes induced by EMS, γ‐ray, or C‐ion beam irradiation in the mutant population. (a) The percentage of different types of SNP variations. (b–d) The amino acid changes induced by EMS (b), γ‐ray (c), or C‐ion beam irradiation (d). To use the same scale for the three mutagens, the number of different kinds of amino acid changes from EMS and γ‐ray was synchronously decreased by a factor of 2 and 65, respectively. The colour of each cell indicates the adjusted number of mutations that led to the specific amino acid change.
To analyse the number of large‐fragment (>1 Mb) deletions in this combined population, we identified genome fragments in each line that showed a high percentage (>50%) of missing exons within a 1‐Mb region compared to the Jing411 genome. Numerous wheat lines generated by C‐ion beam or γ‐ray irradiation contained 100–150 such large‐fragment deletions (Figure 3a). Among all C‐ion beam mutant lines, we detected 28 571 large‐fragment deletions, with an average of 142 per sample. Notably, 460 large fragments were missing in line C0097 (Figure 3b). Similarly, we identified 29 752 large‐fragment deletions across all γ‐ray‐induced mutant lines, with a mean of 180 missing fragments per line; the highest number of large deletions (626) was found in line G0211 (Figure 3c). In general, the γ‐ray mutant lines contained more large‐fragment deletions than the C‐ion beam mutants (Figure 3a). Notably, γ‐ray mutant line G0211 harboured a super fragment deletion from position 0 to 250 Mb on the short arm of chromosome 1B (Figure 3c), while C‐ion beam mutant line C0097 lost the short arm of chromosome 3B (~350 Mb; Figure 3b).
Figure 3.

Large‐fragment deletions induced by γ‐ray or C‐ion beam irradiation, and genome‐wide distribution of mutations. (a) The number of samples with different total numbers of 1‐Mb fragment deletions. A 1‐Mb genomic region with >50% of exons deleted was designated as a 1 Mb fragment deletion. The x‐axis indicates the number of 1 Mb fragment deletions in each sample, while the y‐axis represents the number of samples showing the corresponding number of 1 Mb fragment deletions. Green columns: C‐ion beam; orange columns: γ ray. (b, c) The super‐large‐fragment deletions in the chromosomes of lines C0097 (b) and G0211 (c). The different coloured dots indicate the exon loss ratio. (d) Genome‐wide distribution of mutations induced by EMS, γ‐rays, or C‐ion beam irradiation. circle a: Chromosomes. b: High‐confidence gene density. c: Low‐confidence gene density. d: Variant density in the EMS mutagenized population. e: Variant density in the C‐ion beam‐induced mutation population. f: Variant density in the γ‐ray‐induced mutation population. g: Variant number/gene number in the EMS mutagenized population. h: Variant number/gene number in the C‐ion beam‐induced mutation population. i: Variant number/gene number in the γ‐ray‐induced mutation population. The distribution of mutations across different chromosomes was analysed by counting the total number of mutations in a 1‐Mb window with a step width of 500 kb in the heatmap.
The distribution of mutations across the chromosomes in the EMS population was similar to the distribution of HC genes in these lines, whereas the chromosomal distribution of mutations in the γ‐ray or C‐ion beam mutant populations substantially differed from that of HC genes (Figure 3d, circle b–f). In addition, some genomic regions showed a high number of variants per gene (Figure 3d, circle g–i), suggesting that some genes are preferentially mutated.
The effects of mutations on gene function
We searched for mutations that potentially affect protein function (Table S7). This analysis revealed 299 488 stop codon gain/loss mutations, 154 270 frameshifts, 352 036 splice site mutations, and 6 311 792 missense mutations (Table S7). In particular, we detected a total of 188 170 stop‐gain mutations in 65.7% of the HC genes, and a total of 81 509 frameshift mutations in 18.7% of the HC genes (Tables S7 and S8). Moreover, 50.6% of the HC genes contained splice site mutations, while 94.8% of the HC genes contained missense mutations in the combined mutant population (Table S8). Among LC genes, 32.9% contained a total of 111 318 stop gain/loss mutations and 63.3% harboured a total of 1 889 894 missense mutations (Tables S7 and S8). Comparing mutagen types revealed that C‐ion beam and γ‐ray irradiation induced a higher percent of mutations in the upstream or downstream regions of genes, while EMS induced the highest percent of missense mutations (Table S7). Notably, C‐ion beam or γ‐ray irradiation generated a higher percent of frameshifts and codon indels compared to EMS mutagens (Table S7). Taken together, our mutant library contains numerous mutations from various sources that should affect protein function.
Validation of the mutations
Next, we used sequence analysis to functionally validate the variants identified. We randomly selected 181 homozygous G‐to‐A and C‐to‐T mutations (EMS‐type mutations) spanning 21 chromosomes for validation by Sanger sequencing (Table S9). The results showed that 171/181 (94.5%) mutations were positive, while 10/181 (5.5%) were not found in their respective mutant lines. For comparison, we also validated 99 mutations from other types of single‐base variations and found that 87.9% were correct in the whole‐exome capture data (Table S10). Additionally, we examined 43 small indels and found that 81.4% were indeed present in the mutant lines (Table S11), while PCR assays successfully verified 34/43 (79.1%) of the large‐fragment deletions (Table S12).
A highly efficient method for gene mapping using the wheat mutant populations
To illustrate the utility of the mutant resources for functional genomic studies in wheat, we used the yellow‐green leaf wheat mutant yellow‐green 1 (yg1) as a case study. We advanced the yg1 mutant to the M3 generation (Figure 4a), which yielded three plants with green leaves and 10 plants with yellow‐green leaves. Thus, the mutation resulting in the yellow‐green leaf phenotype appeared to be transmitted as a dominant trait given the M3 segregation ratio, which is consistent with the segregation ratio for the M4 plants (Table S14). Using WT Jing411 and yg1 M2 plants for background analysis, we conducted whole‐exome capture of these 13 individual M3 plants. The SNPs in individuals of the M3 population with green leaves were considered to be homozygous for the WT allele, whereas the SNPs in plants with yellow‐green leaves were considered to be heterozygous or homozygous for the mutant allele and were therefore selected as SNPs potentially linked to leaf colour (Figure 4b).
Figure 4.

Gene mapping of the yellow‐green leaf gene from the wheat mutant population. (a) Phenotype of the yellow‐green leaf mutant yg1. (b) Identifying the linked SNPs by exome capture sequencing. The SNPs that were homozygous WT alleles in green leaved plants and homozygous or heterozygous mutant alleles in yellow‐green leaved plants were identified as the candidate mutations linked to the yellow‐green leaf gene. The first three dark‐green plants to the left of the dotted line represent the green leaved individuals, while the remaining plants following the dotted line represent the yellow‐green leaved individuals. (c) Mapping of the yellow‐green leaf gene. Black lines indicate the WT genotype; white lines indicate the homozygous mutant genotype; grey lines indicate the heterozygous genotype. The number of individuals with the corresponding genotype and phenotype are shown in parentheses. Red dotted lines indicate the physical interval of the yellow‐green leaf gene, as determined by phenotype and genotype analyses.
After screening based on these criteria, we identified two mutations: one located on chromosome 2D and one located on chromosome 3A (Table S13). To determine which of these mutations might be linked to the candidate leaf colour gene, we performed a phenotypic screening of the progeny. The segregation of phenotypes in the M4 progeny was consistent with the genotypes of the mutation located on chromosome 2D of the M3 plants (Table S14). This finding suggests that the mutation located on chromosome 2D is linked to the gene responsible for the yellow‐green leaf phenotype.
We developed the p6 molecular marker for this mutation and seven other molecular markers close to p6. Using 75 M4 individuals, we mapped the yellow‐green leaf gene to a 2.8‐Mb chromosomal region between markers p2 and p3 (Figure 4c). Unfortunately, the mapped interval contains a gap region in the reference genome (Figure 4c). Therefore, we could not pinpoint the causal mutation for the leaf colour variation by exome capture alone; further refinement of the current reference genome should eventually facilitate the identification of the causal gene. Taken together, these results indicate that the combined mutant population generated in this study could facilitate relatively rapid, accurate mapping of genes related to agronomically or biologically important traits.
Reverse genetics‐based identification of GA biosynthesis and signalling pathway genes
Since GA biosynthetic or signalling pathway genes affect plant height, we performed a proof‐of‐concept reverse genetics study of mutations that could influence phenotype. Specifically, we examined plant height in mutant lines carrying homozygous stop‐gain or missense mutations with high or moderate predicted effects on gene function in the GA biosynthesis and signalling pathways (Figure 5). As expected, the average plant height in mutant lines carrying mutations in GA biosynthetic and/or signalling genes was lower than that of the WT. Plants harbouring mutations in the A, B, or D subgenome copies of GA20ox2 (encoding GA 20‐oxidase 2, which catalyses the conversion of GA12 to bioactive GAs) were significantly shorter than WT plants. By contrast, mutations in subgenome homeologs of GA2ox (encoding an enzyme that converts bioactive GAs into inactive GAs) were associated with only a slight decrease in plant height relative to the WT. Notably, mutations in the A/B/D subgenome homeologs of some genes, such as Gibberellin‐insensitive dwarf1 (GID1) and SCF (Skp1‐Cul1‐F‐box), were associated with a range of negative effects on plant height. We randomly selected 10 non‐GA‐related genes for comparison and found that mutations in these genes did not significantly affect plant height (Figure S2). These results indicate that this Jing411 mutant library can indeed be used for reverse genetics identification of genes responsible for quantitative traits.
Figure 5.
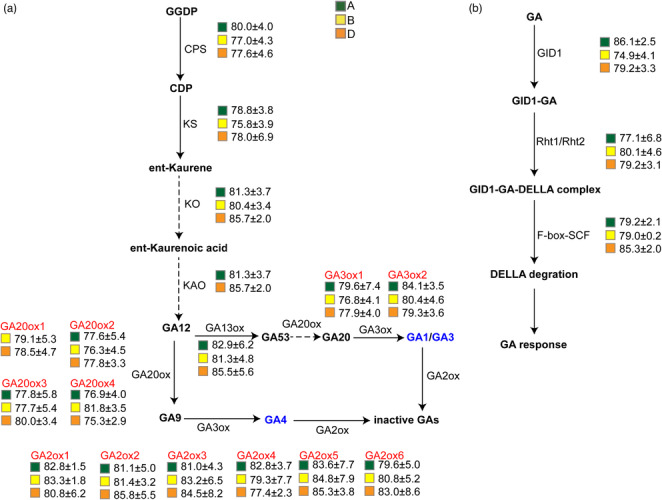
Plant height of mutants of GA biosynthesis and signalling pathway genes. Green, yellow, and orange squares represent mutations in genes from the A, B, and D subgenomes, respectively. The average height of plants carrying homozygous mutant alleles predicted to affect the functions of the corresponding genes was calculated. Values are average plant height (in cm) ± SD. The average plant height of the WT was 91.1 ± 4.5 cm.
A mutation database for functional genomics studies in wheat
We established a public database of these wheat mutations based on the mutations detected by exome capture sequencing (http://jing411.molbreeding.com/#/) to broadly disseminate and promote the efficient use of these mutants by the plant research community. Using this database, users can find information about mutations relevant to their research interests, including predicted functional impacts, gene annotations, and nucleotide base or amino acid conversions (among others) by performing searches using gene IDs or chromosome positions in Chinese Spring V2.1 as a query. This database also provides a Jbrowse interface to search for corresponding mutations on each chromosome. To date, more than 10 research institutes have used this database to explore >100 mutants. This mutation database represents a powerful, informative, efficient resource for functional genetic analyses in wheat.
Discussion
Mutant collections with complete genome sequences are valuable resources for gene discovery and functional studies in plants (Alonso et al., 2003; Cheng et al., 2014; Droc et al., 2006; Parry et al., 2009). Wheat is one of the most important staple crops worldwide, and wheat mutant libraries with whole‐exome sequencing data represent highly informative tools for improving wheat production. In this study, we established a large hexaploid wheat mutant library by whole‐exome sequencing of 2162 mutant lines derived from EMS, γ‐ray, or C‐ion beam mutagenesis of wheat cultivar Jing411 (Figure 1). This resource facilitates forward genetic mapping of genes related to important agronomic traits and provides useful data for reverse genetics studies of gene function. In particular, gene mapping of a subsequent generation of mutant progeny can enable gene function identification using fewer generations to produce a segregating population compared to relatively time‐consuming crossing strategies.
The effectiveness of our approach is illustrated by the quick mapping of the yg1 mutation (Figure 4). Additionally, by performing reverse genetic analysis with this mutant resource, we identified mutations in GA biosynthesis and signalling pathway genes associated with plant height (Figure 5). Interestingly, we determined that mutations in GA20ox2 had stronger negative effects on plant height than mutations in other wheat genes, which is similar to the reported dwarfing effect of the rice (Oryza sativa) “green revolution” gene semidwarf1 (sd1) (Sasaki et al., 2002). Therefore, the high coverage of mutations in functional genes in the Jing411 genome can greatly facilitate the identification of gene functions in wheat.
This mutant population could also be directly or indirectly applied to wheat breeding. More than 3400 plant varieties worldwide have been developed and deployed for agricultural production using mutant lines (https://mvd.iaea.org/). As Jing411 is a major wheat cultivar with many superior agronomic traits (such as high yield potential, cold tolerance, and high tillering ability), it is an ideal resource to create advanced breeding lines. The identification of functional mutations in genes of interest in the mutant population should enable the rapid identification of novel lines with improved traits. Furthermore, the mutant lines could be used for variety development by backcrossing into recurrent parents to improve the corresponding traits. Thus, we believe that this mutant resource will be beneficial for wheat breeding programs.
Ethyl methanesulfonate has been widely used to create mutant libraries in numerous crops and model plants such as wheat (Krasileva et al., 2017), maize (Zea mays; Lu et al., 2018; Nie et al., 2021), rice (Wu et al., 2005), sorghum (Sorghum bicolor; Jiao et al., 2016), soybean (Glycine max; Zhang et al., 2022), upland cotton (Gossypium hirsutum; Lian et al., 2020), Arabidopsis (Capilla‐Perez et al., 2018), and vegetable crops (Sun et al., 2022). It is well known that EMS mainly induces G/C to A/T base pair transitions, while physical mutagens such as γ ray and ion beam irradiation induce more diverse mutations (Du et al., 2017; Nawaz and Shu, 2014; Shirasawa et al., 2016). Our results align well with these previous observations, as the percentage of γ‐ray‐ and C‐ion beam‐induced G/C to A/T transitions was roughly half that detected in EMS mutant lines (Figure 2a). These effects are also consistent with the proportions of different variants induced by fast‐neutron mutagenesis in rice (Li et al., 2017).
Furthermore, higher percentages of small indels and large‐fragment deletions were induced by C‐ion beam and γ‐ray irradiation than by EMS (Table 1, Figure 3). These results are consistent with the finding that small and large indels are induced by C, Ar, or iron (Fe) ion beam irradiation in Arabidopsis (Du et al., 2017; Hirano et al., 2015; Kazama et al., 2017). Additionally, unlike EMS‐induced mutations, mutations induced by γ‐rays or C‐ion beams were not evenly distributed across the chromosomes, which is consistent with a previous report of γ‐ray‐induced mutations in barley (Hordeum vulgare; Tan et al., 2019). Therefore, the multiple mutagenesis approach applied in this mutant population provides a more diverse genetic basis for functional genomics studies in wheat. For instance, large deletions induced by γ‐ray or C‐ion beam irradiation are useful for chromosomal rearrangement studies, while the high percentage of small indels in C‐ion beam‐induced mutant lines can facilitate investigations of null mutations in functional genes. However, there are also some disadvantages to the integration of physically induced mutations, such as the difficulty in determining gene function within a large‐fragment deletion region induced by γ‐ray or C‐ion beam irradiation and the rare occurrence of mutations in some genes due to the uneven distribution of mutations in the genome.
In conclusion, this work provides valuable materials for reverse genetics investigations while also simplifying some steps in the forward genetics analysis of causal genes underlying important traits in wheat. The mutant resources and database generated in this study should greatly benefit basic and applied wheat research to advance our understanding of wheat biology and drive the agronomic improvement of this essential staple crop.
Experimental procedures
EMS, γ‐ray, and C‐ion beam treatments
Chinese winter wheat (Triticum aestivum L.) variety Jing411 was used as the wild type (WT). EMS treatment, γ‐ray irradiation (Xiong et al., 2018), and C‐ion beam (Du et al., 2017) irradiation were conducted as previously described. In brief, for EMS treatment, dry wheat seeds were immersed in water for 16 h and soaked in 1.0% EMS (Sigma, St. Louis, MO) for 4–8 h. The treated seeds were washed under running water before planting. For γ‐ray irradiation, dry wheat seeds were irradiated with a 200 Gy dose of γ‐rays at a rate of 9–10 Gy/min. For C‐ion beam irradiation, dry wheat seeds were exposed to an 80 Gy dose of 60 Gy/min C ion beams at the Heavy Ion Research Facility in Lanzhou (HIRFL). After treatment, the seeds were planted in the field station of the Institute of Crop Sciences, Chinese Academy of Agricultural Sciences. Three M2 seeds from a single M1 plant were planted. One plant was then randomly selected and sampled for DNA extraction. The M3 seeds from the corresponding sampled plant were harvested, and 30 seeds from each M3 line were planted in a row. All M4 seeds from each row were harvested for distribution. For the 443 high generation mutants, the M2 mutants showing phenotypic variations were selected and continually planted for several generations (≥M6) until the observed phenotypes were stable in all of the plants.
Whole‐genome sequencing and de novo assembly of the wheat Jing 411 genome
Long‐read sequences of WT Jing411 were generated using the PacBio Sequel II platform with the continuous long reads (CLR) model. Minimap2 (v2.17) was used to align the raw long‐reads to the genome, and reads with mapping quality <50 were removed. Reads were extracted from the bam files and corrected by the Illumina PE150 reads (30× coverage). Corrected long sequence reads of each sub‐genome and unmapped long‐reads were independently assembled with Fly (v2.8.3). Finally, all assembled contigs were oriented to the genome with RagTag (v2.0.1) based on IWGSC Chinese Spring RefSeq v2.1.
Exome capture and sequencing
For each sample, 2 μg genomic DNA was fragmented into 250 bp pieces using a Bioruptor UCD‐200 sonicator (Diagenode, Denville, NJ). Size selection of the fragmented DNA was performed using magnetic bead (NucleoMag, Macherey‐Nagel, Duren, Germany). A VAHTS Universal DNA Library Prep Kit was used to generate pre‐libraries. End repair of size‐selected DNA was performed with an end‐repair enzyme, and deoxyadenosine was added to the 3′ ends of the fragments. Barcoded and indexed adapters were ligated to the libraries. Pre‐capture amplification was performed via five cycles of PCR. Equal amounts of products from eight libraries were pooled to obtain a total of 4 μg of DNA for hybridization. Hybridization of the sample libraries was performed at 45 °C for ~16 h using the custom‐designed pan‐exome capture panel (https://doi.org/10.5281/zenodo.7943210; Tcuni Technologies, Chengdu, China). This exome capture panel includes 2 574 323 probes covering 137 Mb CDS of Chinese Spring RefSeq V2.1 and specific CDS according to genome sequences of modern wheat cultivars such as KN9204, AK58 and YZ4110. The hybrids were enriched using capture beads with a T1 Pure Capture Bead kit (ThermoFisher, Massachusetts, USA), washed, and amplified by ligation‐mediated PCR. The quality of the captured libraries was assessed using the Agilent 4200 TapeStation (Agilent Technologies, Santa Clara, CA). The libraries were quantified by qPCR and sequenced on the BGI‐seq platform to generate 150‐bp paired‐end reads.
Variant calling
To improve the accuracy of variant calling of the mutants, 30x whole genome sequencing data from Jing411 were used to replace the Chinese Spring RefSeq v2.1 genome (Zhu et al., 2021). WGS reads were aligned to the Chinese Spring RefSeq v2.1 genome, and variant calling was performed using the GATK (v4.1.5.0) best practice pipeline (McKenna et al., 2010). High‐quality SNPs with DP ≥ 10 and QUAL ≥ 100 were retained. To avoid introducing ambiguity and changes to the gene positions, only homologous SNPs were replaced using bcftools csq (Li, 2011). All exome‐captured raw sequencing data from the mutants and WT Jing411 were trimmed using Fastp (Chen et al., 2018) to remove read adapters and low‐quality reads. The clean reads were aligned to the Jing 411 replacement genome to obtain bam files using BWA software (default parameters; Li and Durbin, 2009). Picard (McKenna et al., 2010) was used to sort and remove PCR duplicates from the bam files. Finally, haplotype caller of the GATK pipeline was used to generate raw VCF files. Both read mapping and variant calling used a genome target bed that covered the CDS and 2 kb regions upstream and downstream of the CDS of all genes. The filtering parameters of the bam files were MQ ≥ 50 and BQ ≥ 20, and the filtering parameters of the VCF files were QUAL ≥ 100 || DP ≥ 10. For small indels, the size was set to 1–10 bp.
Variant filtering and annotation
To reduce the influence of genetic background and obtain accurate variants, we merged and filtered the data according to mutant type. In each type of mutant collection, only mutations that differed from the genotype of the WT material were retained. The threshold parameters for filtering mutations were set at a minimum coverage of 10 reads for homozygous and heterozygous mutations, and one mutation detected in no more than two mutant lines in the population. After filtering, the merged and filtered VCF files were annotated using snpEff (v4.3T; Cingolani et al., 2012) with Chinese Spring RefSeq v2.1 gene annotation. The upstream and downstream regions of each gene were defined as 2 kb regions.
Evaluating large deletions in the genome
To measure the loss of large fragments in mutants identified by exome sequencing, we used a sliding window approach to evaluate the loss of large fragments in the mutant population.
The “bedcov” function of samtools (v1.6; Li and Durbin, 2009) was used to calculate the exome coverage; a covered exome was defined as an exome with an average reads depth ≥ 3. C is a constant, and the window size is set to 100 kb–1 Mb or a different size. In this study, C was set to 50%, and window size was set to 1 Mb.
To evaluate the sizes of large deletions, the sizes of all consecutive in the genome were added to determine the final deletion size. To eliminate genetic background or regions that were not covered by the exome panel, we removed regions with <50% coverage in the samples in our population.
Validation of mutations by PCR sequencing or electrophoresis
We randomly selected 181 EMS‐type mutations, 99 non‐EMS type mutations, 43 small indels, and 43 large deletion mutations for validation. Genome‐specific PCR primers were designed based on the sequences flanking the mutations. For single nucleotide variations or small indels, the PCR products covering the corresponding mutations were sequenced by Sanger sequencing. For large deletion mutations, the sizes of the PCR products (as determined by electrophoresis) were used to validate the mutations.
Gene mapping for the yellow‐green leaf trait using the wheat mutant population
Thirteen plants, including three plants with green leaves and 10 plants with yellow‐green leaves from the M3 generation, were used for exome capture sequencing. The linked SNPs were filtered based on the following rules: the genotypes of candidate SNPs were heterozygous in the M2 population of yg1; the genotypes of all green individuals were homozygous and the same as that of the WT; the genotypes of yellow‐green leaf individuals were heterozygous or homozygous mutation alleles. The linked SNPs were validated by examining the phenotypes of plants in the M4 generation. The genotypes of 75 M4 individuals were analysed using KASP or PCR sequencing markers. The candidate gene for the yellow‐green leaf trait was delimited to a physical interval based on the genotypes and phenotypes of M4 individuals.
Analysis of plant height in mutations of GA biosynthesis and signalling pathway genes
The GA biosynthesis and signalling pathway genes of wheat were identified based on the corresponding orthologous genes from rice or Arabidopsis. Mutants showing homozygous mutations in GA biosynthesis and signalling pathway genes, including stop‐gain mutations or missense mutations that putatively affect gene function, were used for plant height analysis. The effects of missense mutations on gene function were predicted as previously reported (Xiong et al., 2021). The missense mutations that were predicted to affect gene function were used for further analysis of plant height. Ten non‐GA related genes were randomly selected as a control, and mutants showing predictably functional mutations in these genes were also analysed. For each mutant, plant height was measured in six individuals. The average plant height was calculated for mutants putatively affected in the corresponding GA biosynthesis and signalling pathway genes.
Author contributions
L. L. conceived the project and revised the manuscript. H. X. and H. G. conducted most of the experiments and analysed the data. M. F. performed gene mapping and validation of some mutations. Y. X., L. Z., J. G., S. Z., Y. D. assisted in mutant planting and data analysis. Q. D., J. Z., L. Q., X. X. validated the mutations. L. Z. participated in C‐ion beam treatment. Z. C. assisted in sequence data analysis and database construction. H. X. wrote the first draft of the manuscript. All authors have read and approved the final manuscript.
Conflict of interest
The authors declare no conflict of interest.
Supporting information
Figure S1 Phenotypic variations in the mutant population.
Figure S2 Comparison of plant height between the wild type and 10 mutants of non‐gibberellic acid‐related genes.
Table S1 Summary of whole‐exome sequencing of 2162 mutants induced by ethyl methanesulfonate, γ‐rays, and C‐ion beam irradiation.
Table S2 Summary of heterozygous/homozygous mutations in each mutant.
Table S3 Statistical analysis of mutations in the mutant database.
Table S4 Number of mutations induced by γ‐rays, C‐ion beam and ethyl methanesulfonate.
Table S5 Number of different types of SNP mutations.
Table S6 Summary of the effects of the mutations in 2162 mutants.
Table S7 Number of variations by mutation type.
Table S8 Number of mutations in wheat genes.
Table S9 Detailed information for validating ethyl methanesulfonate‐type mutations.
Table S10 Detailed information for validating non‐ethyl methanesulfonate‐type SNP mutations.
Table S11 Detailed information for validating small indel mutations.
Table S12 Detailed information for validating large‐fragment deletion mutations.
Table S13 Candidate linked SNPs analysed by exome capture sequencing.
Table S14 The genotypes of candidate SNPs linked to the yellow‐green leaf trait in M3 individuals, and the phenotypes of the corresponding M3 and M4 plants.
Acknowledgements
This work was financially supported by the National Key Research and Development Program of China (Grant No. 2022YFD1200700), the Crop Varietal Improvement and Insect Pests Control by Nuclear Radiation, the China Agriculture Research System of MOF and MARA (Grant No. CARS‐03), and the Agricultural Science and Technology Innovation Program (Grant No. CAAS‐ZDRW202109).
Data availability statement
The sequencing data for Jing411 and mutants have been deposited in the National Center for Biotechnology Information (NCBI) under the Sequence Read Archive (SRA) with BioProject ID PRJNA967225 (https://www.ncbi.nlm.nih.gov/bioproject/PRJNA967225), and also deposited at the National Genomics Data Center (NGDC) under accession number PRJCA016607 (https://ngdc.cncb.ac.cn/bioproject/browse/PRJCA016607).
References
- Alonso, J.M. , Stepanova, A.N. , Leisse, T.J. , Kim, C.J. , Chen, H. , Shinn, P. , Stevenson, D.K. et al. (2003) Genome‐wide insertional mutagenesis of Arabidopsis thaliana . Science, 301, 653–657. [DOI] [PubMed] [Google Scholar]
- Capilla‐Perez, L. , Solier, V. , Portemer, V. , Chambon, A. , Hurel, A. , Guillebaux, A. , Vezon, D. et al. (2018) The HEM lines: a new library of homozygous Arabidopsis thaliana EMS mutants and its potential to detect meiotic phenotypes. Front. Plant Sci. 9, 1339. [DOI] [PMC free article] [PubMed] [Google Scholar]
- Chen, S. , Zhou, Y. , Chen, Y. and Gu, J. (2018) fastp: an ultra‐fast all‐in‐one FASTQ preprocessor. Bioinformatics, 34, i884–i890. [DOI] [PMC free article] [PubMed] [Google Scholar]
- Cheng, X. , Wang, M. , Lee, H.K. , Tadege, M. , Ratet, P. , Udvardi, M. , Mysore, K.S. et al. (2014) An efficient reverse genetics platform in the model legume Medicago truncatula . New Phytol. 201, 1065–1076. [DOI] [PubMed] [Google Scholar]
- Cingolani, P. , Platts, A. , Wang le, L. , Coon, M. , Nguyen, T. , Wang, L. , Land, S.J. et al. (2012) A program for annotating and predicting the effects of single nucleotide polymorphisms, SnpEff: SNPs in the genome of Drosophila melanogaster strain w 1118; iso‐2; iso‐3 . Fly, 6, 80–92. [DOI] [PMC free article] [PubMed] [Google Scholar]
- Droc, G. , Ruiz, M. , Larmande, P. , Pereira, A. , Piffanelli, P. , Morel, J.B. , Dievart, A. et al. (2006) OryGenesDB: a database for rice reverse genetics. Nucleic Acids Res. 34, D736–D740. [DOI] [PMC free article] [PubMed] [Google Scholar]
- Du, Y. , Luo, S. , Li, X. , Yang, J. , Cui, T. , Li, W. , Yu, L. et al. (2017) Identification of substitutions and small insertion‐deletions induced by carbon‐ion beam irradiation in Arabidopsis thaliana . Front. Plant Sci. 8, 1851. [DOI] [PMC free article] [PubMed] [Google Scholar]
- Hirano, T. , Kazama, Y. , Ishii, K. , Ohbu, S. , Shirakawa, Y. and Abe, T. (2015) Comprehensive identification of mutations induced by heavy‐ion beam irradiation in Arabidopsis thaliana . Plant J. 82, 93–104. [DOI] [PubMed] [Google Scholar]
- IWGSC (2014) A chromosome‐based draft sequence of the hexaploid bread wheat (Triticum aestivum) genome. Science, 345, 1251788. [DOI] [PubMed] [Google Scholar]
- IWGSC (2018) Shifting the limits in wheat research and breeding using a fully annotated reference genome. Science, 361, eaar7191. [DOI] [PubMed] [Google Scholar]
- Jiao, Y. , Burke, J.J. , Chopra, R. , Burow, G. , Chen, J. , Wang, B. , Hayes, C. et al. (2016) A sorghum mutant resource as an efficient platform for gene discovery in grasses. Plant Cell, 28, 1551. [DOI] [PMC free article] [PubMed] [Google Scholar]
- Kazama, Y. , Ishii, K. , Hirano, T. , Wakana, T. , Yamada, M. , Ohbu, S. and Abe, T. (2017) Different mutational function of low‐ and high‐linear energy transfer heavy‐ion irradiation demonstrated by whole‐genome resequencing of Arabidopsis mutants. Plant J. 92, 1020–1030. [DOI] [PubMed] [Google Scholar]
- Krasileva, K.V. , Vasquez‐Gross, H.A. , Howell, T. , Bailey, P. , Paraiso, F. , Clissold, L. , Simmonds, J. et al. (2017) Uncovering hidden variation in polyploid wheat. Proc. Natl Acad. Sci. USA, 114, E913–E921. [DOI] [PMC free article] [PubMed] [Google Scholar]
- Li, H. (2011) Improving SNP discovery by base alignment quality. Bioinformatics, 27, 1157–1158. [DOI] [PMC free article] [PubMed] [Google Scholar]
- Li, H. and Durbin, R. (2009) Fast and accurate short read alignment with Burrows‐Wheeler transform. Bioinformatics, 25, 1754–1760. [DOI] [PMC free article] [PubMed] [Google Scholar]
- Li, G.T. , Jain, R. , Chern, M. , Pham, N.T. , Martin, J.A. , Wei, T. , Schackwitz, W.S. et al. (2017) The sequences of 1504 mutants in the model rice variety Kitaake facilitate rapid functional genomic studies. Plant Cell, 29, 1218–1231. [DOI] [PMC free article] [PubMed] [Google Scholar]
- Lian, X. , Liu, Y. , Guo, H. , Fan, Y. , Wu, J. , Guo, H. , Jiao, C. et al. (2020) Ethyl methanesulfonate (EMS) mutant library construction in Gossypium hirsutum L. for allotetraploid functional genomics and germplasm innovation. Plant J. 103, 858–868. [DOI] [PubMed] [Google Scholar]
- Lu, X. , Liu, J. , Ren, W. , Yang, Q. , Chai, Z. , Chen, R. , Wang, L. et al. (2018) Gene‐indexed mutations in maize. Mol. Plant, 11, 496–504. [DOI] [PubMed] [Google Scholar]
- McKenna, A. , Hanna, M. , Banks, E. , Sivachenko, A. , Cibulskis, K. , Kernytsky, A. , Garimella, K. et al. (2010) The genome analysis toolkit: a MapReduce framework for analyzing next‐generation DNA sequencing data. Genome Res. 20, 1297–1303. [DOI] [PMC free article] [PubMed] [Google Scholar]
- Nawaz, Z. and Shu, Q. (2014) Molecular nature of chemically and physically induced mutants in plants: a review. Plant Genet. Resour. 12, S74–S78. [Google Scholar]
- Nie, S. , Wang, B. , Ding, H. , Lin, H. , Zhang, L. , Li, Q. , Wang, Y. et al. (2021) Genome assembly of the Chinese maize elite inbred line RP125 and its EMS mutant collection provide new resources for maize genetics research and crop improvement. Plant J. 108, 40–54. [DOI] [PubMed] [Google Scholar]
- Parry, M.A.J. , Madgwick, P.J. , Bayon, C. , Tearall, K. , Hernandez‐Lopez, A. , Baudo, M. , Rakszegi, M. et al. (2009) Mutation discovery for crop improvement. J. Exp. Bot. 60, 2817–2825. [DOI] [PubMed] [Google Scholar]
- Sasaki, A. , Ashikari, M. , Ueguchi‐Tanaka, M. , Itoh, H. , Nishimura, A. , Swapan, D. , Ishiyama, K. et al. (2002) Green revolution: a mutant gibberellin‐synthesis gene in rice. Nature, 416, 701–702. [DOI] [PubMed] [Google Scholar]
- Shirasawa, K. , Hirakawa, H. , Nunome, T. , Tabata, S. and Isobe, S. (2016) Genome‐wide survey of artificial mutations induced by ethyl methanesulfonate and gamma rays in tomato. Plant Biotechnol. J. 14, 51–60. [DOI] [PMC free article] [PubMed] [Google Scholar]
- Sun, X. , Li, X. , Lu, Y. , Wang, S. , Zhang, X. , Zhang, K. , Su, X. et al. (2022) Construction of a high‐density mutant population of Chinese cabbage facilitates the genetic dissection of agronomic traits. Mol. Plant, 15, 913–924. [DOI] [PubMed] [Google Scholar]
- Tan, C. , Zhang, X.Q. , Wang, Y. , Wu, D. , Bellgard, M.I. , Xu, Y. , Shu, X. et al. (2019) Characterization of genome‐wide variations induced by gamma‐ray radiation in barley using RNA‐Seq. BMC Genomics, 20, 783. [DOI] [PMC free article] [PubMed] [Google Scholar]
- Walkowiak, S. , Gao, L. , Monat, C. , Haberer, G. , Kassa, M.T. , Brinton, J. , Ramirez‐Gonzalez, R.H. et al. (2020) Multiple wheat genomes reveal global variation in modern breeding. Nature, 588, 277–283. [DOI] [PMC free article] [PubMed] [Google Scholar]
- Wu, J.L. , Wu, C. , Lei, C. , Baraoidan, M. , Bordeos, A. , Madamba, M.R. , Ramos‐Pamplona, M. et al. (2005) Chemical‐ and irradiation‐induced mutants of indica rice IR64 for forward and reverse genetics. Plant Mol. Biol. 59, 85–97. [DOI] [PubMed] [Google Scholar]
- Xiong, H. , Guo, H. , Xie, Y. , Zhao, L. , Gu, J. , Zhao, S. , Li, J. et al. (2018) Enhancement of dwarf wheat germplasm with high‐yield potential derived from induced mutagenesis. Plant Genet. Resour. 16, 74–81. [Google Scholar]
- Xiong, H. , Li, Y. , Guo, H. , Xie, Y. , Zhao, L. , Gu, J. , Zhao, S. et al. (2021) Genetic mapping by integration of 55K SNP array and KASP markers reveals candidate genes for important agronomic traits in hexaploid wheat. Front. Plant Sci. 12, 628478. [DOI] [PMC free article] [PubMed] [Google Scholar]
- Yoshihara, R. , Nozawa, S. , Hase, Y. , Narumi, I. , Hidema, J. and Sakamoto, A.N. (2013) Mutational effects of gamma‐rays and carbon ion beams on Arabidopsis seedlings. J. Radiat. Res. 54, 1050–1056. [DOI] [PMC free article] [PubMed] [Google Scholar]
- Zhang, M. , Zhang, X. , Jiang, X. , Qiu, L. , Jia, G. , Wang, L. , Ye, W. et al. (2022) iSoybean: a database for the mutational fingerprints of soybean. Plant Biotechnol. J. 20, 1435–1437. [DOI] [PMC free article] [PubMed] [Google Scholar]
- Zhu, T. , Wang, L. , Rimbert, H. , Rodriguez, J.C. , Deal, K.R. , De Oliveira, R. , Choulet, F. et al. (2021) Optical maps refine the bread wheat Triticum aestivum cv. Chinese Spring genome assembly. Plant J. 107, 303–314. [DOI] [PMC free article] [PubMed] [Google Scholar]
Associated Data
This section collects any data citations, data availability statements, or supplementary materials included in this article.
Supplementary Materials
Figure S1 Phenotypic variations in the mutant population.
Figure S2 Comparison of plant height between the wild type and 10 mutants of non‐gibberellic acid‐related genes.
Table S1 Summary of whole‐exome sequencing of 2162 mutants induced by ethyl methanesulfonate, γ‐rays, and C‐ion beam irradiation.
Table S2 Summary of heterozygous/homozygous mutations in each mutant.
Table S3 Statistical analysis of mutations in the mutant database.
Table S4 Number of mutations induced by γ‐rays, C‐ion beam and ethyl methanesulfonate.
Table S5 Number of different types of SNP mutations.
Table S6 Summary of the effects of the mutations in 2162 mutants.
Table S7 Number of variations by mutation type.
Table S8 Number of mutations in wheat genes.
Table S9 Detailed information for validating ethyl methanesulfonate‐type mutations.
Table S10 Detailed information for validating non‐ethyl methanesulfonate‐type SNP mutations.
Table S11 Detailed information for validating small indel mutations.
Table S12 Detailed information for validating large‐fragment deletion mutations.
Table S13 Candidate linked SNPs analysed by exome capture sequencing.
Table S14 The genotypes of candidate SNPs linked to the yellow‐green leaf trait in M3 individuals, and the phenotypes of the corresponding M3 and M4 plants.
Data Availability Statement
The sequencing data for Jing411 and mutants have been deposited in the National Center for Biotechnology Information (NCBI) under the Sequence Read Archive (SRA) with BioProject ID PRJNA967225 (https://www.ncbi.nlm.nih.gov/bioproject/PRJNA967225), and also deposited at the National Genomics Data Center (NGDC) under accession number PRJCA016607 (https://ngdc.cncb.ac.cn/bioproject/browse/PRJCA016607).