

Abstract
Aims
The milk fat globule-epidermal growth factor 8 (MFGE8), also called lactadherin, is an integrin ligand and a known mediator of inflammation and atherosclerosis in T2DM in studies using animal models. However, its role in the pathophysiology of human T2DM, obesity, and cardiovascular disease has been poorly explored. Aim of this study was to investigate the role of a missense variant (rs371227978 C/T: Arg148His) in the MFGE8 gene identified through exome sequencing for its association with T2DM and cardiometabolic traits.
Methods
Exome-wide sequencing was performed using DNA samples from 68 Sikh individuals from multi-generation pedigrees affected with diabetes on Illumina’s GAIIx using “SureSelect Human All Exon” panels. We further replicated this variant by de novo genotyping in a total of 4242 individuals of the Asian Indian Diabetic Heart Study/Sikh Diabetes Study using custom TaqMan genotyping assay. We also measured circulating concentrations of Mfge8 using frozen serum aliquots by enzyme-linked immunosorbent assay.
Results
Overall, only 1.78% of 4242 individuals were carriers of this variant with MAF being 0.009. Except for the significant correlation of this variant with T2DM and triglycerides, no other quantitative risk phenotype was significant. The minor per allele-associated increased risk for T2DM showed odds ratio of 1.95 (95% CI 1.18–3.23; p = 0.008) in unadjusted model and was 1.73 (95% CI 1.02–2.93; p = 0.043) after adjusting for the age, gender, and BMI. However, there was a strong correlation between serum Mfge8 concentrations with T2DM, (r2 = 0.38; p = 0.001), fasting glucose (r2 = 0.36; p = 0.002), and triglycerides (r2 = 0.33; p = 0.005). Our data revealed a significant dose-related increase in MFGE8 genotypes for affecting serum Mfge8 (p = 2.1 × 10⁻³) and triglyceride concentrations (p = 3.2 × 10⁻³). For a per risk allele-associated increase of 4.74 ng/ml ± SD of 1.62 ng/ml of the Mfge8 concentration was found to increase T2DM risk to 1.7 fold (95% CI from 1 to 3 fold).
Conclusions
Here, we report for the first time a novel population-specific rare variant in the MFGE8 gene linked with the increased Mfge8 concentrations and the risk for developing T2DM and cardiovascular risk factors in a population of Punjabi Sikhs from India. In view of a strong evidence from animal studies supporting the role of Mfge8 in obesity, insulin resistance, and the development of atherosclerosis in T2DM, our findings are important and timely. If validated in a large independent dataset, early screening of Mfge8 in blood levels may especially benefit those patients with genetically elevated Mfge8 levels to preventing or reducing the risk of T2DM and cardiovascular disease.
Keywords: MFGE8, Exome sequencing, Population-specific rare variant, Type 2 diabetes mellitus, Hypertriglyceridemia, Punjabi Sikhs
Introduction
Type 2 diabetes mellitus (T2DM) is a devastating disease which greatly impacts the quality of life by leading to the development of coronary heart disease, stroke, peripheral vascular disease, renal failure, blindness, and amputation. T2DM often remains unrecognized and hence untreated for many years which further exacerbates the long-term exposure of vascular endothelium and organ tissues to hyperglycemia and hyperinsulinemia. Therefore, it is important to identify the potential biomarkers of glucose and insulin metabolism preceding T2DM that can be used for its early diagnosis to reduce the burden of cardiovascular complications. Genetic variation collectively accounts for only 8–10% of total heritability linked with cardiovascular traits in genome-wide association studies (GWAS) [1], hence efforts are needed to account for missing heritability using more biologically associated explanations.
The milk fat globule-epidermal growth factor 8 (Mfge8), also called as lactadherin, is an integrin ligand that binds to αvβ3/5 integrin receptors. It is a multifunctional glycoprotein involved in regulation of many biological and physiological processes, such as angiogenesis, atherosclerosis, phagocytosis, and tissue remodeling and is a key mediator of inflammation and atherosclerosis in T2DM in animal models [2]. It is secreted by the subset of macrophages, and it is specifically bound to apoptotic cells by recognizing aminophospholipids such as phosphatidylserine [3]. The Mfge8 plays a critical role in removing apoptotic B cells in the germinal centers, and its failure can lead to autoimmune diseases [4]. It is involved in tissue regeneration and healing of lesions in ulcerative diseases [5]. On the contrary, several recent studies mainly using animal models have implicated Mfge8/integrin pathways to promote obesity, eating behavior, and insulin resistance and lipid storage [6, 7].The Mfge8 regulates and promotes fatty acid uptake and absorption in the enterocytes by triggering the activation of P13 kinase/mTORC2 signaling [8]. Circulating Mfge8 concentrations in animal models correlate positively with glycosylated hemoglobin in diabetes with increased prevalence of obesity and lipid storage [8]. However, the role of the MFGE8 in human T2DM, obesity, and cardiovascular disease has been poorly explored. In this study, we are the first to report a novel population-specific rare missense variant in the MFGE8 which elevates circulating Mfge8 concentrations and increases the risk for developing T2DM and cardiovascular risk factors in a population of Punjabi Sikhs from India.
Study subjects
A total of 4242 individuals (2455 T2DM cases and 1787 controls) were included in this study from the Asian Indian Diabetic Heart Study (AIDHS)/Sikh Diabetes Study (SDS) [9–12]. Diabetic subjects (n = 2455; male/female = 1384/1071) were identified based upon their medical records for symptoms and use of diabetic medications and were defined as diabetics based on fasting glucose levels following the American Diabetes Association guidelines as described previously [10, 13]. Non-diabetic control participants (n = 1787; male/female = 984/803) were selected based on a fasting glycemia < 100.8 mg/dl (5.6 mmol/l) or 2-hour glucose < 141.0 mg/dl (7.8 mmol/l). All blood samples were obtained at the baseline visit. All participants in this study were the same from northern part of India and provided written informed consent following procedures approved by the institutional review boards (IRBs). All AIDHS/SDS protocols and consent documents were reviewed and approved by the University of Oklahoma Health Science Center (OUHSC)’s IRB as well as the Human Subject Protection (Ethics) committees at the participating hospitals and institutes in India as described previously [14, 15].
Body mass index (BMI) was calculated as [weight (kg)/height (m2)]. A tape measure was used to measure the waist and hip circumferences at the abdomen and at the hip, respectively. The World Health Organization’s (WHO) new guidelines for the BMI thresholds for Asians were followed (WHO Expert Panel, 2004) [16]. Blood pressure was measured twice after a 5-min seated rest period with the participant’s feet flat on the floor. Serum lipids [total cholesterol, fasting serum triglycerides (TGs), high-density lipoprotein cholesterol (HDL-C), and low-density lipoprotein cholesterol (LDL-C)] were measured using standard enzymatic methods (Roche, Basel, Switzerland) as described previously [17]. CAD was considered if there was use of nitrate medication (nitroglycerine), electrocardiographic evidence of angina pain, coronary angiographic evidence of severe (greater than 50%) stenosis, or echocardiographic evidence of myocardial infarction. Diagnosis was based on date of coronary artery bypass graft (CABG) or angioplasty, and medication usage obtained from patient records as described previously [11, 18].
Exome sequencing
Exome-wide sequencing was performed using DNA samples from 68 Sikh individuals (35 male/33 female), age 22–89 years. Of these 54 individuals were T2DM cases, and 14 were ethnicity-matched non-T2DM controls. Index cases were selected from multiplex pedigrees affected with T2DM. Genomic DNA was extracted from whole blood or buffy coats using Qiagen kits (Qiagen, Chatsworth, CA) or salting out method described previously [19, 20]. Exome sequencing was performed using 1 μg of genomic DNA and “SureSelect QXT Human All Exon” panels by Agilent Technologies Inc. (Santa Clara, CA) and “Paired-End Sequencing Library Prep by Illumina” (Version 1.0.1) (Illumina Biotechnology Co. San Diego, CA) at the Genomics Core Laboratory at the Oklahoma Medical Research Foundation (OMRF) following manufacturer’s instructions. The quality and integrity of DNA were checked at the core laboratory using Agilent’s Analyzer and Tape Station reagents before target capture and library preparation as described previously [14]. Exome sequencing (75 base paired) was performed on the Illumina’s GAIIx platform at the OMRF.
Read processing
The unmapped sequence reads were collected using FastQC files. We used combined suits of Illumina software and other packages [genome-analysis tool kit (GATK) [21], borrow wheeler aligner (BWA) [22], and SAMTools] [23] for data alignment, quality recalibration, duplicate removal, data merging, and variant detection as described in detail previously [14]. Briefly, the unaligned BAM files were aligned to NCBI’s human reference genome (GRCh37; hg19) using BWA. The sequence alignments of each subject’s samples were merged into a single BAM file to which the quality control measures such as base call quality recalibration, duplicate detection, and INDEL realignment methods from the GATK [21] were applied as described earlier [14]. Annotated variants and genotype call data were stored in bgzip (SAMtools)-compressed VCF files.
Sequence data quality control (QC) and analysis
All sequence data underwent further QC protocol as described in detail previously. [14] In brief, we assessed total reads, library complexity, capture efficiency, coverage efficiency (80% at 20× required), raw error rates, and transition versus transversion ratio (3 for known site, 2.5 for novel sites). Only samples with > 80% of the target at > 20× coverage were analyzed further. Data QC, variant annotation, and analysis were performed using SVS software Win 64 8.8.1 (Golden Helix, Bozeman, MT). Of a total of 191,879 mutations, 108,302 (~ 56%) variants were only found in diabetic cases. Using the Ingenuity Pathway Analysis tool, we identified 469 genes in four predominant T2DM pathways (insulin signaling, glucose transport, G-protein signaling, and MAPK signaling). Of these, 293 genes showed significant clustering of damaging and deleterious rare mutations in T2DM patients (p-values ranging from 1.9 × 10⁻⁹ to 5.5 × 10⁻¹⁵) (Supplementary Table 1S). In this study, we are describing the role of a missense variant (rs371227978 C/T: Arg148His) in the MFGE8 gene identified through exome sequencing. The sequence alignment of this variant with ancestral ‘C’ allele at amino acid position 148 (arginine) revealed strong conservation across major species (Supplementary Fig. 1). The MFGE8 variant (rs371227978 C/T) was also confirmed by Sanger sequencing.
Genotyping
We genotyped missense variant in the MFGE8 (rs371227978 C/T: Arg148His) discovered using exome sequencing in a total of 4242 individuals of the Asian Indian Diabetic Heart Study/Sikh Diabetes Study using Applied Biosystems’ Custom TaqMan Genotyping Assay (Life Technologies Corp., Grand Island, NY) following the manufacturer’s instructions. Genomic DNA was extracted from buffy coats or whole blood using QIAamp kits (Qiagen, Chatsworth, CA) as describe above. The entire genotyping was carried out on the samples blinded for phenotypes using TaqMan assay using Applied Biosystems QuantStudio 6 as described elsewhere [11, 24]. For quality control, we ran 30 replicative controls and 10 negative controls to match the concordance. Genotypes were scored by analyzing data on both real-time as well as allele discrimination analysis using QuantStudio Software v1.3. Samples with poor call or poor clusters were repeated to achieve the call rate > 95%.
Serum Mfge8 measurements using ELISA
Circulating concentrations of Mfge8 levels were quantified using frozen serum aliquots by enzyme-linked immunosorbent assay (ELISA) kits from Boster Biological Technology (Pleasanton, CA, USA) following the standard protocols following manufacturer’s instructions. (www.bosterbio.com). Briefly, the Boster’s Human MFGE8/Lactadherin ELISA Kit was based on standard sandwich ELISA technology. A monoclonal antibody specific for Mfge8/lactadherin has been pre-coated onto 96-well plates, and test samples were added to the wells in duplicates. A biotinylated detection polyclonal antibody was added subsequently and then followed by washing with 1xPBS buffer. Avidin–biotin–peroxidase complex was added, and unbound conjugates were washed away with 1xPBS buffer. Horseradish peroxidase (HRP) substrate 3,3′,5,5′-tetramethylbenzidine (TMB) was used to visualize HRP enzymatic reaction. TMB was catalyzed by HRP to produce a blue color product that changed into yellow after adding acidic stop solution. The density of yellow is proportional to the Human Mfge8/Lactadherin amount of sample captured in the plate, and the optical density (OD) absorbance was measured at 450 nm by Tecan Infinite 200 PRO microplate reader. Samples were blinded for Mfge8 measurements, and each specimen was run in duplicates following the manufacturer’s instructions. A standard curve was generated and used to determine the Mfge8 level in the tested serum samples following the manufacturer’s instructions. The Mefge8 measures were performed in a selected subset 78 individuals including 39 T2DM cases and 39 controls who were matched for age, gender and BMI and were of same ancestry. All were available with MFGE8 genotypes (Fig. 1; Table 4).
Fig. 1.
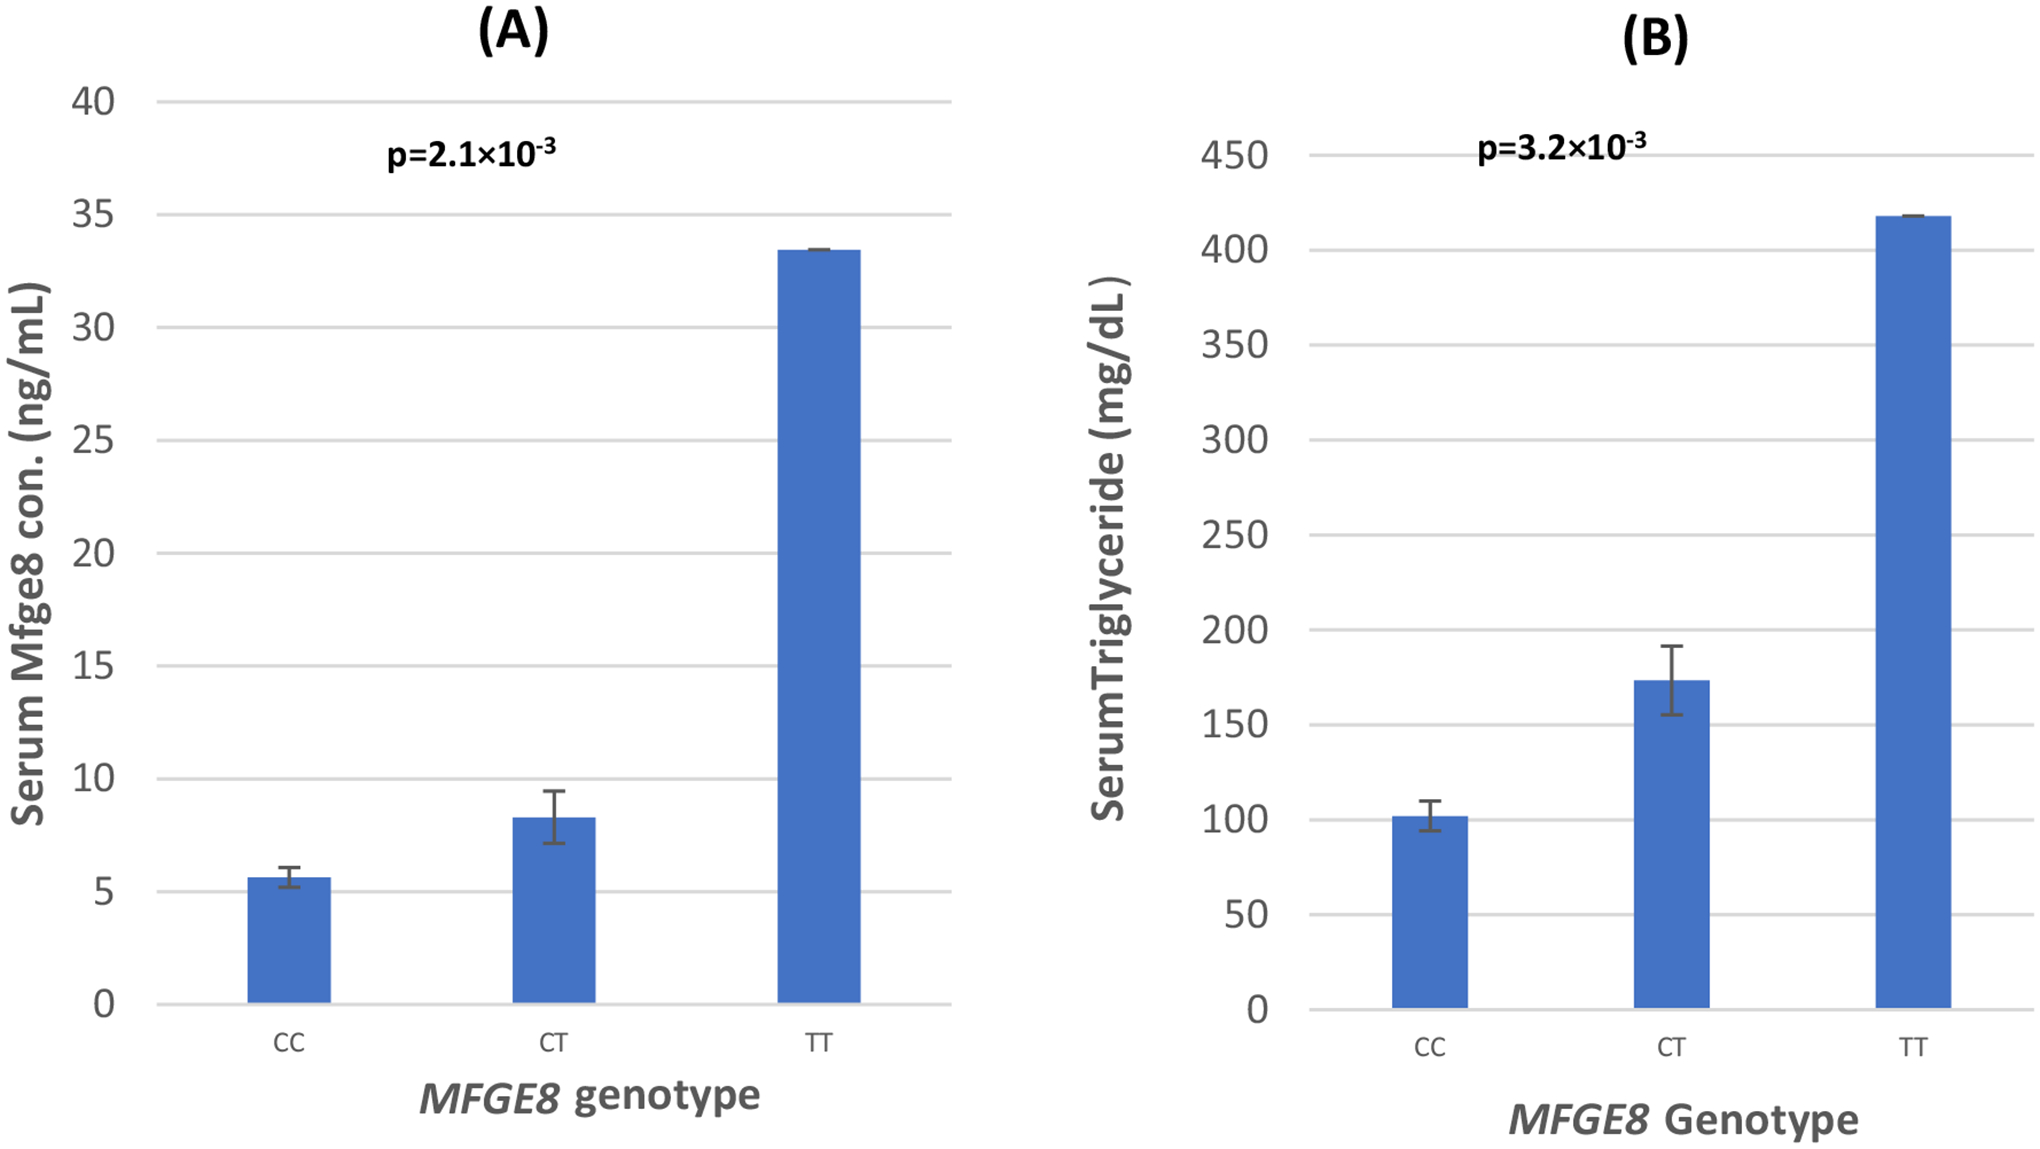
a The distribution of circulating Mfge8 concentrations by MFGE8 genotypes. b The distribution of serum triglyceride levels by MFGE8 genotypes. p values are from the analysis of covariance (ANCOVA) showing difference between group means after adjusting for the confounding effects of age, gender, and BMI. Serum Mfge8 measures were available in 78 subjects including 39 T2DM cases and age- and gender-matched 39 controls
Table 4.
Multivariate regression analysis showing interactions between [T2DM status * Mfge8 concentrations] and [MFGE8 genotype * Mfge8 concentrations] for affecting triglyceride levels
| Traits | Triglyceride | ||
|---|---|---|---|
| Mean square | F | p value | |
| Gender | 20426.013 | 2.217 | 0.141 |
| Age | 1146.803 | 0.124 | 0.725 |
| T2D | 23320.454 | 2.532 | 0.116 |
| Serum Mfge8 | 26243.797 | 2.849 | 0.096 |
| T2D* serum Mfge8 | 66743.585 | 7.245 | 0.009 |
| Gender | 14496.400 | 1.595 | 0.211 |
| Age | 242.159 | 0.027 | 0.871 |
| T2D | 701.799 | 0.077 | 0.782 |
| MFGE8 genotype (CC, CT + TT) | 18383.013 | 2.023 | 0.160 |
| Genotype*serum Mfge8 | 45481.772 | 5.004 | 0.029 |
Serum Mfge8 measures were available in a subset including 39 T2DM cases and age- and gender-matched 39 controls; Figures in bold font are statstically significant p-values
Statistical analysis
Allele frequencies were calculated by allele counting. Deviation from Hardy–Weinberg equilibrium was tested using Pearson’s chi-square test. Variables with skewed distributions were normalized by log transformation before statistical comparisons (e.g., fasting blood glucose [FBG], total cholesterol, TG, LDL-C, and HDL-C), and p values reported are from analyses of the transformed data. Transformed variables were retransformed into the original measurement scale and reported. Multiple-linear regression analyses were used to examine the impact of MFGE8 genotypes on quantitative traits adjusted for covariates. Covariates considered included age, gender, and BMI. Significant covariates for each dependent trait were identified by Pearson’s correlation and step-wise multiple-linear regression using two-tailed p value of significance. Multivariate logistic regression, linear regression analysis, and analysis of variance were performed to evaluate the association of MFGE8 genotypes on diabetes status and adjusted for age, gender, and BMI when appropriate. Interaction terms were included to determine whether the concentration of human Mfge8 and MFGE8 genotypes would affect concentrations of TG and other cardiometabolic traits. All statistical analyses were performed using SPSS for windows statistical package (version 19.0) (SPSS Inc., Chicago, USA).
Results
Clinical and physical characteristics of the study subjects (n = 4242) stratified by T2DM status are presented in Table 1. Distribution of gender and BMI, waist-to-hip ratio did not vary significantly between T2DM cases and healthy controls. However, as expected, mean blood levels of fasting glucose and cholesterol panel, as well as mean levels of systolic and diastolic blood pressure, were significantly elevated in diabetic patients compared to non-diabetic controls.
Table 1.
Clinical and demographic characteristics of AIDHS/SDS subjects
| Traits | Control | Case | p value |
|---|---|---|---|
| N (%) | 1787 (42.1) | 2455 (57.9) | |
| Age (years) | 48.1 ± 14.4 | 54.9 ± 11.5 | < 0.001 |
| Gender (M/F) | 984/803 | 1384/1071 | 0.838 |
| BMI (kg/m2) | 26.0 ± 4.6 | 27.2 ± 4.8 | 0.438 |
| Systolic BP (mmHg) | 129.9 ± 21.6 | 141.9 ± 23.7 | < 0.001 |
| Diastolic BP (mmHg) | 80.2 ± 11.8 | 83.5 ± 12.6 | < 0.051 |
| WHRATIO | 1.0 ± 2.6 | 0.9 ± 6.1 | 0.046 |
| FBG (mg/dl) | 94.8 ± 11.6 | 158.4 ± 61.3 | < 0.001 |
| Total cholesterol (mg/dl) | 178.4 ± 51.6 | 174.1 ± 47.5 | 0.087 |
| Triglycerides (mg/dl) | 132.3 ± 73.4 | 155.3 ± 81.8 | < 0.0001 |
| HDL-C (mg/dl) | 39.5 ± 14.8 | 37.5 ± 13.6 | < 0.001 |
| LDL-C (mg/dl) | 108.3 ± 38.5 | 100.8 ± 38.2 | < 0.001 |
N number, M male, F female, BMI body mass index, BP blood pressure, FBG fasting blood glucose, WHRATIO waist hip ratio, HDL-C high-density lipoprotein cholesterol, LDL-C low-density lipoprotein cholesterol; values are mean ± SD
The genotype and allele frequency distributions of the SNP rs371227978 located in MFGE8 are presented in Table 2. Genotype frequencies in control subjects did not deviate significantly from Hardy–Weinberg expectations (p = 0.969). Only 1.78% (76 of 4242 individuals) of the total study subjects were the carriers for this SNP, of which only one individual was the carrier for minor homozygous (TT) genotype. Among these genotype carriers (n = 76), 55 (72%) individuals had T2DM and the remaining 21 (28%) were controls. The genotype distribution between cases and controls was statistically significant (p = 0.030). The allele frequency of minor T allele was almost double in T2DM cases (0.012) versus controls (0.006) (Table 2). By far, the majority of subjects that had high serum Mfge8 concentrations also were diabetic (T2DM) and only one individual with serum Mfge8 (> 10 ng/ml) was non-diabetic (data not shown). In the logistic regression analysis using an additive genetic model, odds ratio of a per allele (T)-associated risk for T2DM was odd ratio (OR) 1.95 (95% CI 1.18–3.23, p = 0.008) in unadjusted model. However, after controlling for age, gender, and BMI, the association of this variant for the increased risk for T2DM remained marginally significant (p = 0.043) (Table 2) in the additive and in the dominant genetic model (comparing genotype (CC vs. CT/TT) the OR was 1.93 [95% CI 1.16–3.20] with a significance of p = 0.010. No significant difference in the distribution of MFGE8 genotypes and alleles frequencies was observed between other traits like CAD, obesity, or with cardiometabolic quantitative traits, e.g., FBG, BMI, WHR, total cholesterol, LDL-C or HDL-C, and systolic and diastolic blood pressure (data not shown) except a dose-related increase in serum TG concentration was noted in mutant ‘T’ allele carriers (Fig. 1).
Table 2.
Distribution of rs371227978 (MFGE8) genotypes and allele frequencies in study samples stratified by diabetes status and association testing using logistic regression modeling
| Control (n = 1787) | Cases (n = 2455) | Combine (n = 4242) | p value | HWE p value | |
|---|---|---|---|---|---|
| n (%) | n (%) | n (%) | |||
| Genotypes | |||||
| CC | 1766 (98.8) | 2400 (97.76) | 4166 (98.2) | 0.030 | 0.969 |
| CT | 21 (1.2) | 54 (2.2) | 75 (1.78) | ||
| TT | 0 (0.00) | 1 (0.04) | 1 (0.02) | ||
| Control (n = 1787) | Cases (n = 2455) | Combine (n = 4242) | Type 2 diabetes risk | ||
| OR (95% CI) | p value | ||||
| Allele frequency | |||||
| C | 3553 (99.4) | 4854 (98.86) | 8407 (99.1) | ||
| T | 21 (0.6) | 56 (1.14) | 77 (0.9) | ||
| Minor allele frequency | |||||
| 0.006 | 0.012 | 0.009 | |||
| Additive (unadjusted) | 1.95 (1.18–3.23) | 0.008 | |||
| Additive (adjusted) | 1.73 (1.02–2.93) | 0.043 ¥ | |||
| Dominant (adjusted) | 1.93 (1.16–3.20) | 0.010 ¥ | |||
HWE deviations from Hardy–Weinberg equilibrium, OR odds ratio, CI confidence interval, BMI body mass index
After adjustment with age, gender, and BMI in logistic regression model; Figures in bold font are statstically significant p values
To examine the effect of genotype on the human serum Mfge8 level underlying T2DM status, we quantified serum levels in selected subset of individuals having both genotype carrier (CT/TT) and non-carrier (CC) based on their T2DM status. Multivariate regression analysis revealed a statistically significant increase in the Mfge8 concentrations associated with ‘minor T’ allele (β 4.736 ± S.E. 1.616) or (95% CI 1.515–7.956); p = 0.005 using an additive genetic model and adjusting for age, BMI, and gender (Table 3). As shown in Table 2S, there was a strong correlation between serum Mfge8 concentrations with T2DM, (r2 0.38; p = 0.001), FBG (r2 0.36; p = 0.002), and TG (r2 = 0.33; p = 0.005). Serum Mfge8 concentrations were significantly elevated among the CT and TT genotype-carrier and correlated significantly with T2DM (Fig. 1; Table 2S). Although fasting serum TG was elevated among CT and TT carriers among both patients and control, multivariate regression modeling revealed a strong interaction between diabetes status*serum Mfge8 concentrations for elevated serums TG levels (F = 7.245; p = 0.009) as was the interaction of MFGE8 genotype*serum Mfge8 concentrations for increasing TG (F = 5.004; p = 0.029) (Table 4).
Table 3.
Multivariate linear regression analysis modeling showing genotype–phenotype association of MFGE8 variant for affecting serum Mfge8 concentrations
| Model | Unstandardized coefficients | t | 95% confidence interval for B | p value | ||
|---|---|---|---|---|---|---|
| B | SE | Lower bound | Upper bound | |||
| AGE | − .013 | .063 | − .210 | − .139 | .112 | .834 |
| BMI | − .202 | .161 | − 1.255 | − .522 | .119 | .214 |
| GENDER | − 1.027 | 1.625 | − .632 | − 4.266 | 2.213 | .530 |
| MFGE8 genotype | 4.736 | 1.616 | 2.931 | 1.515 | 7.956 | .005 |
Mfge8 concentration was used as dependent trait; Figures in bold font are statstically significant p values
Discussion
Increasing world-wide burden of T2DM and obesity and its effect on cardiovascular disease risk is a major challenge that offers opportunity for discovering the basis for preventive approaches. Despite considerable success of GWAS and sequencing studies, including studies from our group [12, 25–27], the genetic mechanisms that predispose people to metabolic and vascular risk factors remain poorly understood. Additionally, most post-GWA studies of exome-wide or candidate gene sequencing have predominantly been focused on European populations which provide limited information on the usefulness of variants in populations of non-European ancestry. Also, despite the sample sizes of these studies being enormously increased, the clinical usefulness of these data for risk prediction (as early biomarker) or diagnostics has been a major challenge. Moreover, in view of the rapidly expanding role of genetic testing in disease diagnosis, there is a need to identify population-specific genetic and phenotypic biomarkers so that people from all lineages can benefit from the precision genetic approaches.
In this study, we have examined the role of a novel population-specific rare variant (rs371227978, Arg148His) identified within the coding region of the MFGE8 gene for its association with T2DM susceptibility using a unique endogamous population of the Punjabi Sikhs from India. Interestingly, this variant was monomorphic in other major global populations including Europeans, African, and East Asians (Chinese, Japanese, and Koreans) (see data from Exome Aggregation Consortium EXAC in Supplementary Table 3S. As rare variants tend to be of more recent origin, they are less likely to be cosmopolitan and are often population specific [28]. Surprisingly, this variant was also monomorphic in Asian Indian subjects of the LOLIPOP study in directly genotyped data (N = 3000) (data not shown). Of note, this variant is located on the second EGF-like domain in the human Mfge8 which is highly conserved across species (Fig. 1S) and contains an arginine–glycine–aspartic acid (RGD) sequence that has been shown to bind the v3 and v5 integrins [3]. This F5/8 type C domain is a major protein domain of many blood coagulation factors, e.g., Factor V and Factor VIII that mediate high-affinity binding to phosphatidylserine-containing membranes [2]. Essentially, the variant’s restricted presence in the northern Indian (Punjabi) region of the Indian subcontinent further suggests its recent origin with possibly strong familial effects.
Overall, only 1.78% of 4242 individuals of the AIDHS/SDS were carriers of this variant with minor allele frequency (MAF) being 0.009. Except for the significant correlation of this variant with T2DM and TG, no other quantitative risk phenotype correlated. When we examined the genotype–phenotype association, the vast majority of ‘T’ allele carriers presented higher serum levels of Mfge8 (ranging from 0.62 ng/ml to 33.4 ng/ml) compared to wild type ‘C’ allele carriers (1.87 ng/ml to 11.1 ng/ml). Our data revealed a significant dose-related increase in serum Mfge8 (p = 2.1 × 10⁻³) and TG levels (3.2 × 10⁻³) among the MFGE8 genotypes (Fig. 1a, b). Multivariate linear regression analysis revealed a strong interaction of T2DM and high serum Mfge8 levels for increasing serum TG (F Statistics 7.245; p = 0.009) (Table 4).
The Mfge8 regulates the absorption of dietary fat by enterocytes through binding of the αvβ3 and αvβ5 integrin and activation of PI3 kinase/mTORC2/PKCζ-dependent pathway that leads to cellular uptake of free fatty acids. In addition to the fatty acid uptake, Mfge8 also regulates lipid storage in the enterocytes under the conditions of high dietary fat intake in animal studies [8]. Elevated TGs with either normal or impaired fasting glucose often predict the development of T2DM [29]. In fact, elevated serum TG is a strong independent risk factor for cardiovascular diseases [30, 31]. Our findings are also in agreement with recent animal studies where Mfge8 knockout mice fed with a high-fat diet did not develop obesity and were insulin sensitive and had lower TG levels than the wild-type mice [32]. High expression of Mfge8 was detected in aortas of rats with T2DM and type 1 diabetes [33]. In proteomic analysis of atherosclerotic aorta of diabetic mice, exogenous administration of recombinant Mfge8 was shown to promote the development of atherosclerotic lesions in db/db mice including endothelial injury and smooth muscle cell proliferation [33].
In this study, for a per ‘T’ (risk) allele-associated increase of serum Mfge8 concentrations (4.74 ng/ml standard deviation 1.62 ng/ml) will increase T2DM risk to 1.7 fold (95%CI 1.0–3.0 fold). However, given the rarity of this polymorphism, our current study has < 50% power to detect the observed effect of 1.73–2.93 with (MAF = 0.009) using 2455 T2DM cases and 1787 controls at α = 0.05 and conservative prevalence of T2DM being 18% (in India). Thus, a larger size sample from this population will be required to measure the true effect size on influencing Mfge8 protein levels with high accuracy and consequently its association with T2DM susceptibility. Nevertheless, based on the convincing data from studies using animal models, our new data on the association of a rare missense variant with T2DM and cardiovascular risk traits provide evidence of a potential new pathway involved in human cardiovascular disease in T2DM. Therefore, despite limitations, our study in humans not only agrees with the mouse studies showing that the increased serum levels of Mfge8 would increase the risk for T2DM, but we also provide evidence that genetically enhanced Mfge8 (with a possible gain-of-function mutation) may potentially predispose people to develop T2DM and hypertriglyceridemia.
Based on findings from animal studies, currently some companies are working to design Mfge8 inhibitors or its ligand inhibitors as a new therapy for treating human obesity. However, to the best of our knowledge, the role of Mfge8 in T2DM or cardiovascular/vascular complications at a population scale has not been described in humans. It is worth noting that the MFGE8 was not detected among the list of genes associated with T2DM or lipid traits (for the common variant effect) in GWAS and even in large GWAS/meta-analysis studies using hundreds of thousands of T2DM cases and controls. However, the detection of a rare and potentially functional variant was successfully achieved by sequencing multiple cases of a few Sikh pedigrees. Thus, it is possible that other (yet unidentified) rare or less common variants in the MFGE8 could be involved with population-specific effects in Europeans, African, Hispanic/American Indian, or East Asian cohorts. Future confirmation and deep genetic evaluation of this gene would be required to putatively confirm the role of Mfge8 in T2DM and atherosclerotic disease.
In summary, in view of the strong evidence from animal studies supporting the role of Mfge8 in obesity, insulin resistance, and the development of atherosclerosis in diabetes, our findings on the association of a rare variant in the human MFGE8 gene with T2DM and cardiovascular risk traits are important and timely. If validated in a large independent dataset, early screening of Mfge8 levels may especially benefit those patients with genetically elevated serum Mfge8 for preventing or reducing the risk of T2DM and cardiovascular disease.
Supplementary Material
Acknowledgements
Authors thank all the participants of AIDHS/SDS who made this study possible. We thankfully acknowledge Dr. Piers Blackett for reviewing the manuscript review and suggestions.
Funding
The Sikh Diabetes Study/Asian Indian Diabetic Heart Study was supported by NIH Grants-R01DK082766 (NIDDK) and NOT-HG-11-009 (NHGRI) and Grants from Presbyterian Health Foundation; and Harold Hamm Diabetes Center, Oklahoma City, USA.
Footnotes
Electronic supplementary material The online version of this article (https://doi.org/10.1007/s00592-019-01463-x) contains supplementary material, which is available to authorized users.
Conflict of interest The authors declare that there is no conflict of interest that could be perceived as prejudicing the impartiality of the research reported.
Ethical approval The study was reviewed and approved by the University of Oklahoma Health Sciences Center’s Institutional Review Board, as well as the Human Subject Protection Committees at the participating hospitals and institutes in India.
Informed consent All participants provided a written informed consent for investigations.
References
- 1.Sanghera DK, Blackett PR (2012) Type 2 diabetes genetics: beyond GWAS. J Diabetes Metab 3(198):6948. 10.4172/2155-6156.1000198 [DOI] [PMC free article] [PubMed] [Google Scholar]
- 2.Aziz M, Jacob A, Matsuda A, Wang P (2011) Review: milk fat globule-EGF factor 8 expression, function and plausible signal transduction in resolving inflammation. Apoptosis: Int J Program Cell Death 16(11):1077–1086 [DOI] [PubMed] [Google Scholar]
- 3.Hanayama R, Tanaka M, Miwa K, Shinohara A, Iwamatsu A, Nagata S (2002) Identification of a factor that links apoptotic cells to phagocytes. Nature 417(6885):182–187 [DOI] [PubMed] [Google Scholar]
- 4.Hanayama R, Tanaka M, Miyasaka K et al. (2004) Autoimmune disease and impaired uptake of apoptotic cells in MFG-E8-deficient mice. Science 304(5674):1147–1150 [DOI] [PubMed] [Google Scholar]
- 5.Bu HF, Zuo XL, Wang X et al. (2007) Milk fat globule-EGF factor 8/lactadherin plays a crucial role in maintenance and repair of murine intestinal epithelium. J Clin Investig 117(12):3673–3683 [DOI] [PMC free article] [PubMed] [Google Scholar]
- 6.Rankinen T, Zuberi A, Chagnon YC et al. (2006) The human obesity gene map: the 2005 update. Obesity (Silver Spring). 14(4):529–644 [DOI] [PubMed] [Google Scholar]
- 7.Cheng M, Li BY, Li XL et al. (2012) Correlation between serum lactadherin and pulse wave velocity and cardiovascular risk factors in elderly patients with type 2 diabetes mellitus. Diabetes Res Clin Pract 95(1):125–131 [DOI] [PubMed] [Google Scholar]
- 8.Khalifeh-Soltani A, Gupta D, Ha A et al. (2016) Mfge8 regulates enterocyte lipid storage by promoting enterocyte triglyceride hydrolase activity. JCI Insight 1(18):e87418. [DOI] [PMC free article] [PubMed] [Google Scholar]
- 9.Sanghera DK, Bhatti JS, Bhatti GK et al. (2006) The Khatri Sikh diabetes study (SDS): study design, methodology, sample collection, and initial results. Hum Biol 78(1):43–63 [DOI] [PubMed] [Google Scholar]
- 10.Sanghera DK, Nath SK, Ortega L et al. (2008) TCF7L2 polymorphisms are associated with type 2 diabetes in Khatri Sikhs from North India: genetic variation affects lipid levels. Ann Hum Genet 72:499–509 [DOI] [PubMed] [Google Scholar]
- 11.Saxena R, Bjonnes A, Prescott J et al. (2014) Genome-wide association study identifies variants in casein kinase II (CSNK2A2) to be associated with leukocyte telomere length in a Punjabi Sikh diabetic cohort. Circ Cardiovasc Genet 7(3):287–295 [DOI] [PMC free article] [PubMed] [Google Scholar]
- 12.Saxena R, Saleheen D, Been LF et al. (2013) Genome-wide association study identifies a novel locus contributing to type 2 diabetes susceptibility in sikhs of punjabi origin from India. Diabetes 62(5):1746–1755 [DOI] [PMC free article] [PubMed] [Google Scholar]
- 13.American Diabetes A (2004) Diagnosis and classification of diabetes mellitus. Diabetes Care 27(Suppl 1):S5–S10 [DOI] [PubMed] [Google Scholar]
- 14.Sanghera DK, Hopkins R, Malone-Perez MW et al. (2019) Targeted sequencing of candidate genes of dyslipidemia in Punjabi Sikhs: population-specific rare variants in GCKR promote ectopic fat deposition. PLoS ONE 14(8):e0211661. [DOI] [PMC free article] [PubMed] [Google Scholar]
- 15.Sanghera DK, Bejar C, Sapkota B, Wander GS, Ralhan S (2018) Frequencies of poor metabolizer alleles of 12 pharmacogenomic actionable genes in Punjabi Sikhs of Indian Origin. Sci Rep 8(1):15742. [DOI] [PMC free article] [PubMed] [Google Scholar]
- 16.Panel WE (2004) Appropriate body-mass index for Asian populations and its implications for policy and intervention strategies. Lancet 363(9403):157–163 [DOI] [PubMed] [Google Scholar]
- 17.Sanghera DK, Demirci FY, Been L et al. (2010) PPARG and ADI-POQ gene polymorphisms increase type 2 diabetes mellitus risk in Asian Indian Sikhs: Pro12Ala still remains as the strongest predictor. Metab: Clin Exp 59(4):492–501 [DOI] [PMC free article] [PubMed] [Google Scholar]
- 18.Sapkota BR, Hopkins R, Bjonnes A et al. (2016) Genome-wide association study of 25(OH) Vitamin D concentrations in Punjabi Sikhs: results of the Asian Indian diabetic heart study. J Steroid Biochem Mol Biol 158:149–156 [DOI] [PMC free article] [PubMed] [Google Scholar]
- 19.Sanghera DK, Manzi S, Minster RL et al. (2008) Genetic variation in the paraoxonase-3 (PON3) gene is associated with serum PON1 activity. Ann Hum Genet 72(Pt 1):72–81 [DOI] [PubMed] [Google Scholar]
- 20.Miller SA, Dykes DD, Polesky HF (1988) A simple salting out procedure for extracting DNA from human nucleated cells. Nucleic Acids Res 16(3):1215. [DOI] [PMC free article] [PubMed] [Google Scholar]
- 21.McKenna A, Hanna M, Banks E et al. (2010) The genome analysis toolkit: a MapReduce framework for analyzing next-generation DNA sequencing data. Genome Res 20(9):1297–1303 [DOI] [PMC free article] [PubMed] [Google Scholar]
- 22.Li H, Durbin R (2009) Fast and accurate short read alignment with Burrows–Wheeler transform. Bioinformatics 25(14):1754–1760 [DOI] [PMC free article] [PubMed] [Google Scholar]
- 23.Li H, Handsaker B, Wysoker A et al. (2009) The sequence alignment/map format and SAMtools. Bioinformatics 25(16):2078–2079 [DOI] [PMC free article] [PubMed] [Google Scholar]
- 24.Been LF, Hatfield JL, Shankar A et al. (2012) A low frequency variant within the GWAS locus of MTNR1B affects fasting glucose concentrations: genetic risk is modulated by obesity. Nutr Metab Cardiovasc Dis 22(11):944–951 [DOI] [PMC free article] [PubMed] [Google Scholar]
- 25.Kooner JS, Saleheen D, Sim X et al. (2011) Genome-wide association study in individuals of South Asian ancestry identifies six new type 2 diabetes susceptibility loci. Nat Genet 43(10):984–989 [DOI] [PMC free article] [PubMed] [Google Scholar]
- 26.Replication DIG, Meta-analysis C, Asian Genetic Epidemiology Network Type 2 Diabetes C et al. (2014) Genome-wide transancestry meta-analysis provides insight into the genetic architecture of type 2 diabetes susceptibility. Nat Genet 46(3):234–244 [DOI] [PMC free article] [PubMed] [Google Scholar]
- 27.Reddivari L, Sapkota BR, Rudraraju A et al. (2017) Metabolite signatures of diabetes with cardiovascular disease: a pilot investigation. Metab: Off J Metab Soc 13(12):154 [Google Scholar]
- 28.Cooper RS, Tayo B, Zhu X (2008) Genome-wide association studies: implications for multiethnic samples. Hum Mol Genet 17(R2):R151–R155 [DOI] [PMC free article] [PubMed] [Google Scholar]
- 29.Stergachis A, Shy KK, Grothaus LC et al. (1990) Tubal sterilization and the long-term risk of hysterectomy. JAMA: J Am Med Assoc 264(22):2893–2898 [PubMed] [Google Scholar]
- 30.Hokanson JE, Austin MA (1996) Plasma triglyceride level is a risk factor for cardiovascular disease independent of high-density lipoprotein cholesterol level: a meta-analysis of population-based prospective studies. J Cardiovasc Risk 3(2):213–219 [PubMed] [Google Scholar]
- 31.Freiberg JJ, Tybjaerg-Hansen A, Jensen JS, Nordestgaard BG (2008) Nonfasting triglycerides and risk of ischemic stroke in the general population. JAMA: J Am Med Assoc 300(18):2142–2152 [DOI] [PubMed] [Google Scholar]
- 32.Khalifeh-Soltani A, McKleroy W, Sakuma S et al. (2014) Mfge8 promotes obesity by mediating the uptake of dietary fats and serum fatty acids. Nat Med 20(2):175–183 [DOI] [PMC free article] [PubMed] [Google Scholar]
- 33.Yu F, Li BY, Li XL et al. (2012) Proteomic analysis of aorta and protective effects of grape seed procyanidin B2 in db/db mice reveal a critical role of milk fat globule epidermal growth factor-8 in diabetic arterial damage. PLoS ONE 7(12):e52541. [DOI] [PMC free article] [PubMed] [Google Scholar]
Associated Data
This section collects any data citations, data availability statements, or supplementary materials included in this article.