

Abstract
Unsaturated ketone derivatives are known as monoamine oxidase B (MAO-B) inhibitors, a potential drug target for Parkinson’s disease. Here, molecular modeling studies, including 2D-QSAR, ADMET prediction, molecular docking, and MD simulation, were performed on a new series of MAO-B inhibitors. The objective is to identify new MAO-B inhibitors with high inhibitory efficacy. The developed 2D-QSAR model was based on the descriptors of MOE software. The most appropriate model, using the partial least squares regression (PLS regression) method, yielded 0.88 for the determination coefficient (r2), 0.28 for the root-mean-square error (RMSE), and 0.2 for the mean absolute error (MAE). The predictive capacity of the generated model was evaluated by internal and external validations, which gave the Q2 and R2test values of 0.81 and 0.71, respectively. The ability of a compound to be orally active was determined using the drug-likeness and ADMET prediction. The results indicate that most of the compounds have moderate pharmacokinetic characteristics without any side effects. Furthermore, the affinity of the ligands (unsaturated ketone derivatives) to the MAO-B receptor was determined using molecular docking. The top conformers were then subjected to MD simulation. This research may pave the way for the development of novel unsaturated ketone derivatives capable of inhibiting the MAO-B enzyme.
Keywords: MAO-B inhibitors, Parkinson’s disease, ligand-based drug design, structure-based drug design
1. Introduction
Monoamine oxidase (MAO) is a flavin adenine dinucleotide (FAD)-dependent enzyme involved in the oxidation of monoamine neurotransmitters such as catecholamines (i.e. epinephrine, norepinephrine, and dopamine) and 5-hydroxy-tryptamine (i.e. serotonin, to their corresponding aldehydes with the formation of hydrogen peroxide (H2O2) [1] (ure 1). In mammals, this enzyme exists in two isoforms, MAO-A and MAO-B, encoded by two genes located on the X chromosome [2]. Human isoenzymes MAO-A (527 aa) and MAO-B (520 aa) display a high degree of amino acid sequence homology (share 70% amino acid identity) [3]. Each isoenzyme is the target of affective and neurogenerative disorders [4,5]. MAO-A inhibitors are used to treat behavioral disorders, particularly depression [6,7]. In contrast, MAO-B inhibitors such as selegiline and rasagiline are used in the treatment of Parkinson’s disease (PD). MAO-B inhibitors are also involved in the treatment of Alzheimer’s disease (AD) [8,9] and other neurodegenerative disorders [10]. However, MAO-B drugs are irreversible and cause pharmacological side effects in the long-term treatment of PD [11]. Therefore, the development of reversible MAO-B inhibitors, such as the recent anti-Parkinson drug safinamide [12], is required.
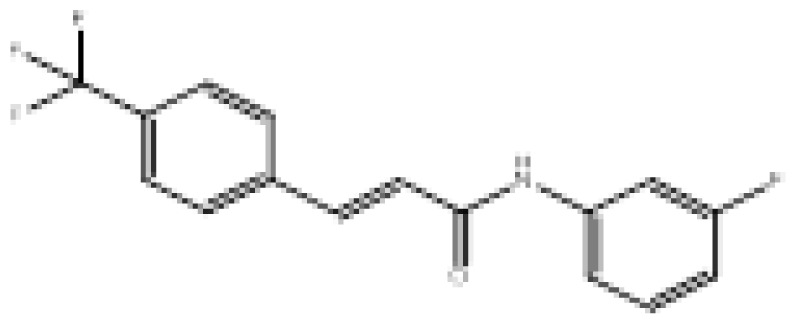
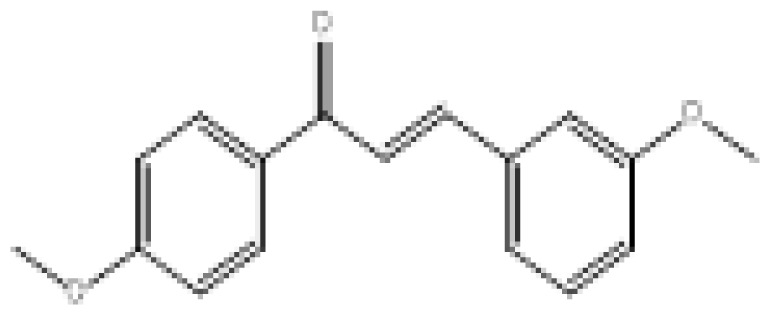
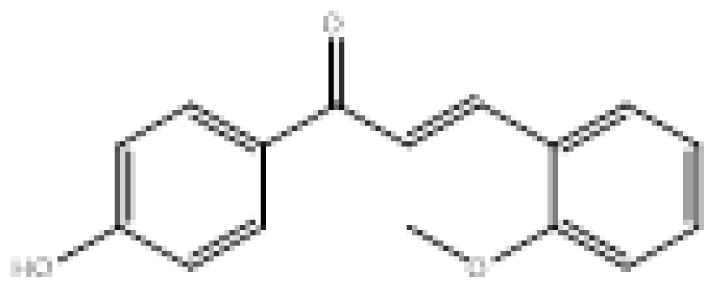
To search for new MAO-B inhibitors, chalcone scaffolds are selected. Chalcones are a class of polyphenolic derivatives belonging to the flavonoid family, their structure consisting of two aromatic cycles linked by a three-carbon α, β-unsaturated carbonyl system (Figure 2). They exhibit a wide range of pharmacological activities, including anticancer [13], antiinflammatory [14], antidiabetic [15], antioxidants [16, 17], antimalarial [18], anti-HIV [19] and anti-MAO-B [20].
Figure 2.

Chemical structures of chalcones (1), α, β-unsaturated ester derivatives (2), and α, β-unsaturated amide derivatives (3).
Computer-aided drug design (CADD) approaches have recently become essential in drug discovery. These techniques proved to be effective in various stages of the drug development process, reducing both the cost and time required to develop a drug compared to conventional methods [21]. In general, CADD approaches are classified into two types: structure-based drug design (SBDD) and ligand-based drug design (LBDD). When the 3D structure of the protein is available, SBDD methods such as homology modeling, molecular docking, and molecular dynamics simulation are used [22]. On the other hand, LBDD methods such as quantitative structure-activity relationship (QSAR), similarity search, and pharmacophore modeling are applied when the 3D structure of the protein is not available. With the help of these methods, several approved drugs have been developed [23–28]. For example, the discovery of amprenavir as a potential inhibitor of the human immunodeficiency virus (HIV) protease using protein modeling and MD simulations [29], imatinib as an inhibitor of the tyrosine kinase using SBDD [30], amprenavir as a potential inhibitor of the human immunodeficiency virus (HIV) protease using protein modeling and MD simulations [31,32], thymidylate synthase inhibitor, raltitrexed against HIV using the SBDD approach [33], Norfloxacin as an inhibitor of topoisomerase II, IV using QSAR modeling [32], and darolutamide as an inhibitor of androgen receptor using docking and MD simulations [34].
In this work, a new series of chalcones and their derivatives were synthesized by Choi and coworkers [35]. The synthesized compounds are known as monoamine oxidase inhibitors (MAOI). They have a wide range of activity (0.016 < IC50 (μM) < 8.39). To understand the relationship between the chemical structures and their related activities, 2D-QSAR was performed, based on the descriptors of molecular operating environment (MOE) software. The pharmacokinetic properties of compounds were analyzed using the drug-likeness and the ADMET (adsorption, distribution, metabolism, excretion, and toxicity) prediction. Docking study was also displayed to find out the binding modes of the unsaturated ketone derivatives in the active site of monoamine oxidase-B (MAO-B) receptor. Finally, the dynamic behavior and stability of ligand-receptor complexes were evaluated using molecular dynamics (MD) simulation. In this study, the combination of ligand and structure-based drug design may be helpful to develop and design new unsaturated ketone candidates as MAO-B inhibitors.
2. Materials and methods
2.1. Dataset preparation and structure optimization
A dataset of unsaturated ketone derivatives synthetized by Choi and coworkers was selected [35]. The IC50 values were converted into corresponding pIC50 values (pIC50 = log (1/IC50.) and then used as a dependent variable in this study. The selected compounds are known as monoamine oxidase inhibitors and display a wide range of activity (3 log units). The dataset was randomly split into a training set (80% of the dataset) for 2D-QSAR model generation and a test set (20% of the dataset) for testing the predictive ability of the generated model. The core substructure of these compounds is shown in Figure 3.
Figure 3.

Core substructure of unsaturated ketone derivatives.
Before modeling, the 3D chemical structures were designed using Marvin Sketch software. Energy minimization and calculations were performed using SYBYL-X 2.1 software [36]. All compounds were energy minimized using the conjugate gradient procedure based on the tripos force field with a convergence criterion value set to 0.01 kcal/mol Å [37]. The maximum number of iterations was set to 2000. Partial atomic charges were added, using Gasteiger-Hücke charges [38]. The chemical structures and their corresponding activity are presented in Table 1.
Table 1.
Chemical structures of unsaturated ketone derivatives and their corresponding experimental activities.
| No | Structure | pIC50 | No | Structure | pIC50 |
|---|---|---|---|---|---|
| 8b | 6.5969 | 12a | 5.0762 | ||
| 9a | 6.1007 | 12b | 5.5498 | ||
| 10a | 6.3270 | 15a | 5.2233 | ||
| 10b | 7.7959 | 15b | 5.2832 | ||
| 10c | 6.8386 | 16a | 5.4724 | ||
| 10d |

|
6.7011 | 16b |

|
5.3107 |
| 10e |

|
7.2518 | 16c |
|
6.5482 |
| 10f |

|
7.1612 | 17a |

|
6.2366 |
| 10g |

|
6.3778 | 18a |

|
6.6517 |
| 10h |
|
5.8551 | 19a |

|
5.2306 |
| 11a |

|
6.7399 | 20a |

|
5.5867 |
| 11b |

|
7.2441 | 20b |

|
6.0283 |
| 11g |
|
6.2048 |
indicates test set compounds.
2.2. 2D-QSAR analysis
2.2.1. Molecular descriptors calculation
The 2D-QSAR model was constructed using MOE descriptors. For each compound, a total of 354 descriptors were calculated. Then, the descriptors with a zero or equal variance predictor and the descriptors with a constant value for all observations were deleted. The number of descriptors was reduced by removing descriptors with a low correlation with the pIC50 value. The multicollinearity of the selected descriptors was verified by calculating the variation inflation factors (VIF), which can be calculated as follows:
| Eq. 1 |
Where r2 is the multiple correlation coefficient of one descriptor’s effect regressed on the remaining molecular descriptors. If the VIF value is greater than 5 (VIF > 5), multicollinearity is very high [39].
2.2.2. Model generation
After selecting the most appropriate descriptors, PLS method was used to build the linear 2D-QSAR model. The MOE descriptors were used as independent variables (X variables), while MAO-B inhibitory activity (pIC50) was employed as the dependent variable (Y variables). Both variables are related by the following equation below:
| Eq. 2 |
The developed QSAR model is evaluated by the squared correlation coefficient (r2), the adjusted squared correlation coefficient (r2a), the root-mean-square error (RMSE), the mean absolute error and the fisher value (F).
Figure 1.

Mechanism of interaction of monoamine oxidase-B (MAO-B) inhibitors. AD = dopamine, L-Dopa = levodopa, AADC = aromatic L-amino acid decarboxylase, 3-OMD = 3-O-methyldopa, COMT = catechol-O-methyltransferase, TH = tyrosine hydroxylase, and DOPAC = 3, 4-dihydroxyphenylacetic acid.
| Eq. 3 |
| Eq.4 |
| Eq.5 |
| Eq.6 |
| Eq.7 |
In the above equations, Yi obs and Yi pred are the observed and predicted activities (pIC50 obs and pIC50 pred) for ith compound in the training set, Ȳi mean is the average activity ( mean) of the compounds in the training set, SSE is the residual of squares, SST is the total sum of squares, n is the total number of compounds in the training set, and p is the number of descriptors in the generated model. For a good model, the value of r2 should be closed to 1, the values of RMSE and MAE should be closed to 0, and the value of F should be high. The generated model is used to understand how the activity changes when any one of the descriptors is varied.
2.3. QSAR Model validation
2.3.1. Internal validation
Leave-one-out cross validation
In order to judge the quality and goodness of the generated QSAR model, the leave-one-out (LOO) cross validation process is performed [40, 41]. In this process, one compound is primarily eliminated from the training set. Then, the QSAR model is built based on the remaining compounds (n-1), and the activity of the deleted compound is predicted by the established QSAR model. This process is repeated until all the compounds have been removed once. The performance of the QSAR model is measured by the cross validated correlation coefficient (Q2LOO), which is calculated by the following equation below [42]:
| Eq.8 |
In the above equation, Yi obs and Yi pred are the observed and predicted activities (pIC50 obs and pIC50 pred) for ith compound in the training set, based on the LOO cross validation method, Ȳi mean is the average activity ( ) of the compounds in the training set. The value of Q2LOO reflects the quality of the model and it should be >0.5 (Q2LOO > 0.5) [43].
R2m (LOO) parameter
A high value of Q2LOO does not indicate that the observed and predicted activities are close to each other. To solve this problem, and to better indicate the internal validation of the QSAR model, R2m (LOO) and metrics are calculated [44].
| Eq.9 |
| Eq.10 |
Where, R2 and R02 are the squared correlation coefficient values between the observed and calculated (leave-one-out) activities with and without intercept, respectively. The parameter has the same meaning as R0 but with the axes reversed. The value of R2m (LOO) and should be more than 0.5.
2.3.2. Y-randomization test
To ensure the robustness of the developed QSAR model, a Y-randomization test is performed [45]. The values of pIC50 are randomly permuted and a new QSAR model is generated using the original descriptors [46]. The new QSAR models are expected to have significant low R2 and Q2 values for several trials, which confirm that the generated QSAR model is robust and not due to a chance correlation. Another parameter, cRp2 is also calculated by the following equation below:
| Eq.9 |
Where, Rr is the average ‘R’ of random models. The cRp2 value should be more than 0.5 to pass this test.
2.3.3. External validation
Test set (r2 test)
The predictability of the elaborated QSAR model is evaluated by the external validation or test set. This process consists in keeping a set of compounds not included in the model generation and their activity values are predicted by the generated QSAR model. The performance of the external validation is evaluated by the squared correlation coefficient of prediction (R2 test), which is calculated by the following equation [47].
| Eq.10 |
Where, Yi obs (test) and Yi pred (test) represent the observed and predicted activity (pIC50 obs (test) and pIC50 pred (test)) of the ith compound in the test set, respectively and Ȳi mean ( ) represents the mean activity of the compounds in the training set. The value of the R2test should be more than 0.5, for a power predictability.
Golbraikh and Tropsh’s criteria
The external predictability of the generated QSAR model is also evaluated by several parameters. According to Golbraikh and Tropsha [48], a QSAR model is considered satisfactory if all the following conditions are satisfied:
Q2 > 0.5
R2test > 0.6
and 0.85 < k < 1.15 or and 0.85 < k′ < 1.15
|r2 − r0′2| < 0.3
Where k is the slop of the plot of the observed and predicted values of compounds via the origin and k′ is the reversed axes intercept.
2.3.4. R2m (test) parameter
A high value of R2 test does not indicate that the observed and predicted activities are close to each other. To solve this problem, and to better indicate the external validation of the QSAR model, R2m (test) and metrics, similar to R2m (LOO) and are calculated [44]. For an acceptable prediction, the value of should be lower than 0.2, provided that the value of is more than 0.5 [44].
| Eq.11 |
| Eq.12 |
2.3.5. Q2 (F2) metric
The Q2 (F2) metric can be calculated by the following equation below [49]:
| Eq.13 |
Where, Ȳi represents the mean observed data of the test set compounds. The value of Q2 (F2) should be more than 0.5.
2.4. Applicability domain
The applicability domain is defined as a theoretical region in chemical space, including both model variables and modeled response [50,51]. The applicability domain is based on the calculation of the leverage value (hi) of each compound i, for which a QSAR model is used to predict its activity:
| Eq.14 |
In Eq.14, xi is the descriptor row-vector of a query compound, and X is the n*(k-1) matrix of k descriptor values for n data set compounds. A compound i was considered outside the applicability domain when the leverage value (hi) of this compound is greater than the critical value (h*) (h* = 3(d+1)/n, where d is the number of variables and n is the number of compounds in the training set). Conversely, a compound i is considered inside the applicability domain when hi is lower than the h*.
2.5. Drug likeness and ADMET analysis
Drug likeness and ADMET (absorption, distribution, metabolism, excretion, and toxicity) analysis were performed using pkCSM [52] and SWISSadmet [53] web servers. The drug likeness of all compounds was verified using the Lipinski’s rule of five [54], veber [55], Egan, Muegge [55], and Ghose [56] rules. The pharmacokinetic properties such as blood-brain barrier (BBB) permeability, human intestinal absorption (HIA), water solubility (log mol/L), CYP450 substrate and its inhibitor (CYP2D6, CYP3A4, CYP1A2, CYP2C19 and CYP3A4), CaCo-2 permeability and toxicity were evaluated using ADMET analysis. Some other physicochemical properties such as molecular weight (MW), octanol-water partition (LogP), number of hydrogen bond acceptors (HBA), number of hydrogen bond donors (HBD), and topological polar surface area were also verified.
2.6. Docking study
Molecular docking is one of the most virtual screening methods, especially when the 3D structure of the receptor is available [57–59]. Here, the X-ray diffraction structure of monoamine oxidase B (MAO-B) was downloaded from the protein database bank (PDB ID: 2BK3) [60]. All preparations were carried out using the AutoDock tool [61]. The ligand was extracted from the protein and the water molecules were removed. Gast-Huck charges and polar hydrogen were added to the crystal structure. Then, a grid box centered on the catalytic site of the MAO-B receptor was created with a dimension of 40 × 40 × 40 Å in x, y, and z directions, respectively. Finally, the optimized ligands were converted to the pdbqt format and docked into the binding site of MAO-B using AutoDock vina [62]. The results were analyzed and visualized using PyMol and Discovery Studio 2017 R2 software’s.
2.7. Molecular dynamics simulations
The molecular dynamics simulations were performed using GROMACS 5.1.4 package [63]. The topology files of the ligand and the protein were generated using the CHARMM General Force Field (CGenFF) server and the ‘pdb2gmx’ script, respectively [64]. The simulations were run using the CHARMM36 all-atom (March, 2019) force field [65] in a triclinic box with a distance of 1.0 nm and a TIP3P water model solvated system [66]. The neutralization of the system was performed by adding sodium (Na+) or Chlorure (Cl−) ions. The energy minimization system was subjected to 50,000 steps using the steepest descent algorithm. Then, the production MD simulations were run for 20 ns for each simulation at a temperature of 300 k, a pressure of 1 bar and a time step of 2 fs.
3. Results and discussion
3.1. 2D-QSAR analysis
3.1.1. Model generation
2D-QSAR model was built based on the training set compounds. The PLS method was used to generate the 2D-QSAR model by establishing a linear correlation between the most relevant descriptors (BCUT_SMR_2, LogP (o/w), SlogP_VSA4, and vsurf_IW3) and the inhibitory activity of MAO-B enzyme (pIC50). The linear equation connecting the selected descriptors to MAO-B inhibitory activity is presented below.
| Eq. 15 |
In the above equation, N is the number of compounds in the training set, RMSE is the root mean square error, and F is the Fisher value.
The best generated model explains 88% (r2 = 0.88) of the total variance in the training set with small values of RMSE and MAE (RMSE = 0.28 and MAE = 0.2). The high value of the F-test (F = 27.76) indicates that the generated model is statistically significant. Also, the significance of each descriptor in Eq.15 was verified by calculating the value of VIF and p (Table 2). All descriptors in the generated model have acceptable values of VIF and p (VIF < 5 and p < 0.05), indicating a good significant relationship between the modeled response and the selected descriptors. The correlation matrix of the selected descriptors is shown in Table 3. Table 4 shows the values of selected descriptors, experimental activity, and predicted activity.
Table 2.
VIF and p-values of the selected descriptors.
| Statistique | BCUT_SMR_2 | logP(o/w) | SlogP_VSA4 | Vsurf_IW3 |
|---|---|---|---|---|
| Tolérance | 0.5117 | 0.6216 | 0.5946 | 0.6546 |
| VIF | 1.9545 | 1.6087 | 1.6817 | 1.5277 |
| p-value | 0.0012 | 0.0092 | <0.0001 | 0.0007 |
| R_square | −0.34 | 0.44 | 0.72 | −0.31 |
Table 3.
Correlation matrix of the selected descriptors.
| Variables | BCUT_SMR_2 | logP(o/w) | SlogP_VSA4 | vsurf_IW3 | pIC50 |
|---|---|---|---|---|---|
| BCUT_SMR_2 | 1.0000 | ||||
| logP(o/w) | −0.4640 | 1.0000 | |||
| SlogP_VSA4 | −0.5413 | 0.0986 | 1.0000 | ||
| vsurf_IW3 | 0.2441 | −0.5042 | 0.1923 | 1.0000 | |
| pIC50 | −0.3386 | 0.4451 | 0.7195 | −0.3148 | 1.0000 |
Table 4.
Values of selected descriptors, experimental activity, and predicted activity.
| No | Molecular descriptors | pIC50_Obs | 2D-QSAR | ||||
|---|---|---|---|---|---|---|---|
| logP(o/w) | SlogP_VSA4 | vsurf_IW3 | BCUT_SMR_2 | pIC50_Pred | pIC50_Loo | ||
| 8b | 4.9518 | 33.4189 | 2.4626 | 0.7751 | 6.5968 | 6.7780 | 6.8746 |
| 9a | 4.0580 | 30.2334 | 2.8303 | 0.8189 | 6.1007 | 6.2360 | 6.2645 |
| 10a | 4.0210 | 30.2334 | 2.1943 | 0.8309 | 6,3269 | 6.5958 | 6.6497 |
| 10b | 4.9538 | 33.4189 | 0.4323 | 0.7648 | 7.7958 | 7.5893 | 7.4689 |
| 10c | 4.9928 | 33.4189 | 2.0546 | 0.7876 | 6.8386 | 7.0902 | 7.1913 |
| 10e | 4.1720 | 30.2334 | 1.8544 | 0.8309 | 7.2518 | 6.8420 | 6.7629 |
| 10f | 4.6110 | 30.2334 | 2.3715 | 0.8311 | 7.1611 | 6.8939 | 6.8292 |
| 10g | 3.9750 | 30.2334 | 1.8080 | 0.7969 | 6.3777 | 6.4492 | 6.4735 |
| 11g | 3.7110 | 30.2334 | 2.8445 | 0.8335 | 6.2048 | 6.1328 | 6.1054 |
| 12b | 4.0930 | 3.1856 | 1.5152 | 0.8826 | 5.5497 | 5.8354 | 5.8976 |
| 15a | 4.1648 | 6.3712 | 1.8161 | 0.7838 | 5.2232 | 5.0928 | 5.0162 |
| 15b | 3.8220 | 3.1856 | 3.0879 | 0.9392 | 5.2831 | 5.4470 | 5.5726 |
| 16a | 4.6258 | 6.3712 | 1.5711 | 0.7690 | 5.4723 | 5.3691 | 5.3122 |
| 16b | 4.6648 | 6.3712 | 1.2923 | 0.8091 | 5.3106 | 5.8565 | 5.9500 |
| 16c | 4.6278 | 6.3712 | 0.7767 | 0.8543 | 6.5482 | 6.4438 | 6.4168 |
| 17a | 4.5888 | 6.3712 | 1.2236 | 0.8543 | 6.2365 | 6.2213 | 6.2190 |
| 18a | 4.5908 | 6.3712 | 0.2897 | 0.8543 | 6.6516 | 6.6357 | 6.6276 |
| 19a | 4.1450 | 3.1856 | 2.0563 | 0.8543 | 5.2306 | 5.3892 | 5.4115 |
| 20a | 4.1010 | 3.1856 | 2.5898 | 0.8543 | 5.5867 | 5.1253 | 5.0201 |
| 20b | 4.6910 | 3.1856 | 2.3541 | 0.8718 | 6.0282 | 5.7528 | 5.6333 |
| 10d* | 4.9558 | 33.4189 | 1.4270 | 0.8270 | 6.7014 | 7.6778 | - |
| 10h* | 4.0140 | 30.2334 | 2.1155 | 0.7972 | 5.8551 | 6.3405 | - |
| 11a* | 3.7570 | 30.2334 | 2.9518 | 0.8543 | 6.7399 | 6.2909 | - |
| 11b* | 4.6898 | 33.4189 | 1.6233 | 0.8175 | 7.2441 | 7.3417 | - |
| 12a* | 4.4358 | 6.3712 | 1.5940 | 0.7690 | 5.0762 | 5.2381 | - |
Represents compounds of test set, pIC50_Pred represents the value of activity predicted by the created model and pIC50_LOO represents the value of activity predicted by leave-one-out cross-validation method.
3.1.2. 2D-QSAR model validation
The predictability of the generated model was verified by internal and external validations. The statistical parameters are listed in Table 5. The performance of internal validation was determined by leave-one out cross validation. This approach was used to predict the activity (pIC50_LOO) of each compound in the data set using the model established by (n-1) compounds. Our developed model is predictive, as evidenced by the results (Q2LOO = 0.81, RMSE LOO = 0.31 and MAELOO = 0.27). The quality of Q2LOO was also verified by calculating the R2m (R2m = 0.57 > 0.5) parameter. To ensure the robustness of the developed model, a y-randomization test was applied. Several random shuffles of pIC50 were performed. The results are summarized in Table S1 (see supplementary data). The low average R2 and Q2 (R2 = 0.15 and Q2 = −0.52) and the high value of cRp2 (cRp2 = 0.81 > 0.5), indicate that the good results in our original model are not due to a chance correlation. The external validation of the developed model was verified by a test set of 5 compounds. The results (r2test = 0.71) indicate that the developed model is capable of predicting the activity of new untested compounds. Also, the goodness of external validation was verified by calculating the Q2 (F2) parameter, which gave a value greater than 0.5 (Q2 (F2) = 0.52). The plot of the experimental versus the predicted activities for the internal and the external validations is shown in Figure 4.
Table 5.
Accepted 2D-QSAR model validation tools.
| Parameters | Interpretation | Acceptable value | Generated 2D-QSAR model |
|---|---|---|---|
| r2 | Coefficient of determination | ≥0.6 | 0.88 |
| r2 adjusted | Adjusted R-squared | >0.6 | 0.84 |
| Q2LOO | Coefficient of determination for internal validation | >0.5 | 0.81 |
| R2m cv | R2m cross validation parameter | >0.5 | 0.57 |
| cRp2 | Coefficient of determination for Y-randomization | >0.5 | 0.81 |
| R2test | Coefficient of determination of external validation | >0.6 | 0.71 |
| Q2 (F) | The regression slope passing through the origin | >0.5 | 0.52 |
| K | The regression slope passing through the origin (plot of experimental versus predicted activities) | 0.85 ≤ k ≤ 1.15 | 0.96 |
| K′ | The regression slope passing through the origin (plot of predicted versus experimental activities) | 0.85 ≤ k′ ≤ 1.15 | 1.04 |
Figure 4.

Plot of predicted and observed activity. The blue dots denote internal validation (LOO), whereas the orange dots represent external validation.
3.1.3. 2D-QSAR descriptors interpretation
In order to understand the relationship between BCUT_SMR_2, LogP (o/w), SlogP_VSA4, and vsurf_IW3 descriptors and the inhibitory activity of the MAO-B enzyme, it is necessary to explain the meaning of each descriptor in Eq. 15. Figure 5, shows the contribution of each descriptor in Eq. 15.
Figure 5.

Contribution of descriptors in the generated 2D-QSAR model.
As described in Figure 5, the most important descriptor in the established 2D-QSAR model is SlogP_VSA4. This descriptor represents the sum of approximate accessible van der Waal’s surface area i such that logP for atom i is in the range (0.1 to 0.15). The positive contribution (+ 0.057) and high correlation (r = 0.72) with the inhibitory activity, indicate that compounds with high accessible van der Waals surface area could increase the inhibitory activity of the MAO-B enzyme. A deep analysis of chemical structures and their experimental activity indicate that the SlogP_VSA4 descriptor is related to the number of fluorine (F) in R1 and R2 positions. From the experimental dataset (Table 1), compounds with R1 = F (16a, 16b, 16c, 17a, and 18a) have the same value of SlogP_VSA4 (SlogP_VSA4 = 6.3716) and compounds with R2 = CF3 have the same value of SlogP_VSA4 (SlogP_VSA4 = 33.4189). To ensure that the SlogP_VSA4 descriptor is related to the number of fluorine, we compared compounds 10b and 11b, which have the same substituent in the R2 position (R2 = CF3) but differ in the R1 position (10b: R1 = −OCH3, 11b: R1 = OH). The value of the SlogP_VSA4 descriptor is the same in both compounds (SlogP_VSA4 = 33.4189).
The second most important descriptor in the generated 2D-QSAR model is BCUT_SMR_1. The BCUT descriptor using atomic contribution to molar refractivity (using the Wildman and Crippen SMR method) instead of partial charge [67]. The positive influence (+ 8.469) of this descriptor in Eq. 15, reflects the importance of atomic properties that govern the intermolecular interactions (atomic charge, atomic polarizability, and atomic hydrogen bonding ability) on the inhibitory activity of MAO-B enzyme [68].
The next descriptor in the generated 2D-QSAR model is Vsurf_IW3, which describes the hydrophilic integy moment, calculated at −0.6 kcal/mol [69]. The integy moment of this descriptor measures the unbalance between the center of mass of a compound and the barycenter of specific regions of the surface [70]. The negative contribution (−0.442) of this descriptor in Eq. 15, indicates that the integy moment of compounds should be smaller. To reduce the integy moment, the polar moieties should be close to the center of mass or at the opposite ends of the compound. This may explain the significant increase in activity of compounds 10d (pIC50 = 6.701, ortho-R2 = CF3), 10c (pIC50 = 6.8386, meta-R2 = CF3), and 10b (pIC50 =7.7959, para-R2 = CF3). Moreover, compounds with only one hydrated region (12a, 12b and 19a), show high values of Vsurf_IW3 and consequently, low activity.
The LogP (o/w) (log of the octanol/water partition coefficient) is a descriptor for measuring the overall hydrophobicity of compounds [71]. The positive contribution (+ 0.636) of this descriptor in Eq. 15, indicates that a decrease in the lipophilicity of compounds could increase the inhibitory activity of the MAO-B enzyme.
3.1.4. Applicability domain
The applicability domain of the developed 2D-QSAR model was generated, using William’s plot (Figure 6), taken by MINITAB. 17 software [72]. As described in this figure, all compounds are in the applicability domain, except compound 10d, which has a standardized residual value greater than ±2σ. Although this compound is considered outside the applicability domain.
Figure 6.

Applicability domain of the generated 2D-QSAR model. The blue dots represent the training set compounds and the red dots represent the test set compounds.
3.2. Physicochemical properties and drug-likeness
Physicochemical properties and drug-likeness results are summarized in Table S2 (see supplementary data). All compounds show MW values less than 500 Da (224.25 < MW < 309.26), LogP values less than 5 (3.28 < LogP < 4.61), HBA less than 10 (2 < HBA < 5), HBD less than 5 (0 < HBD < 2), and TPSA less than 140 Å (26.30 Å < TPSA < 49.33 Å). This result revealed that these compounds are very likely to be orally active. Also, the results of drug likeness showed that all compounds respect the Lipinski rule of five, Veber, Egan, and Muegge rules without any violations. However, compounds 8b, 9b, 10b, 10c, 16a, 16b, 16c, 17a, and 18a showed one violation for the Ghose rule (WLOGP>5.6).
3.3. ADMET prediction
The pharmacokinetic (PK) properties and toxicity were envaulted using ADMET analysis. The results are summarized in Table S3 (see supplementary data). The moderate values of LogBB reveal that these compounds may be effective for treating the neurodegenerative disease. The values of human intestinal absorption (HIA) (HIA > 30%) indicate that these compounds are highly absorbed. Also, the absorption rate of the studied compounds was evaluated by the Caco-2 cell permeability parameter. The results indicate that all compounds show high Caco-2 cell permeability (Caco-2 > 0.90). In addition, the metabolism of the studied compounds was verified by the inhibitory or substrate behavior of the cytochrome P450 enzymes (CYPs). This enzyme plays a major role in the oxidation process and facilitates the excretion of foreign organic compounds, including drugs. All the compounds were found to be a substrate of 3A4, while no compounds were found to be a substrate of 2D6. Moreover, results of inhibition studies indicate that no compounds were found to inhibit 2D6, whereas, all of them were found to inhibit 1A2, 2C19, and 2C9, except compounds 11a, 11g, and 19a. The toxicity analysis, including AMES toxicity and hepatoxicity indicates that the predicted compounds are not harmful. However, the maximum tolerated dose in human was in the range of 0.26–1.23 mg/kg/day.
3.4. Molecular docking analysis
3.4.1. Docking validation
In order to validate the binding site of the crystal structure, docking validation (or redocking) was applied. First, the native ligand was extracted from its PBD structure (PDB ID: 2BK3). The docking parameters were generated using AutoDock tools. Then, the native ligand was redocked into the same binding site of the crystal structure, using AutoDock 4.1. The best obtained pose gave the root mean square deviation (RMSD) value of 1.57, using 50 iterations. The superposition between the native and the redocked ligands is shown in Figure S1 (see supplementary data).
3.4.2. Binding modes interactions and affinity of the studied compounds
After docking validation, the dataset of compounds was used to generate the docking study. The results are summarized in Table S4 (see supplementary data). The values of binding free energy revealed that unsaturated ketone derivatives showed significant stability in the binding site of the MAO-B enzyme. In addition, the correlation between the binding free energy and the pIC50 values (r2 = 0.73) showed that the docking results are in agreement with the activity values. Figure 7, illustrates the correlation between the binding free energy and pIC50 values.
Figure 7.

Correlation between the binding free energy values and the pIC50 values.
In order to predict whether and how unsaturated ketone derivatives bind to the MAO-B active site, compounds 10b and 10e (the most potent inhibitors in the dataset) were used. The results are shown in Figures 8 and 9. As described in Figure 8, compound 10b was fixed in the binding pocket of the MAO-B enzyme by several types of interactions. The most important are the conventional hydrogen bond interaction with CYS 172, the halogen interaction with GLY 204, and hydrophobic interactions (Pi-Pi stacked, Pi-Pi T-shaped, Alkyl, Pi-alkyl, and Pi-sigma) with TYR 398, PHE 343, TYR 326, CYS 172, ILE 199, and LEU 171. These types of interactions may confirm why this compound displays a low binding affinity (−9.9 Kcal/mol). The low binding affinity of compound 10e (−9.7 Kcal/mol) was also related to the type of interactions that it has with the MAO-B receptor. As described in Figure 9, compound 10e was fixed in the binding pocket of the MAO-B receptor with the same type of interactions (halogen interactions with the fluorine at the ortho-R1 position, conventional hydrogen bond interaction with the ketone group of α, β-unsaturated, and hydrophobic interactions at the R2 position) as that of compound 10b. The values of binding affinity of the studied compounds are related to the number of interactions, the types of interactions, and the distance between the ligand and a particular amino acid.
Figure 8.

Docking analysis of compound 10b. (a) 2D view of binding site interactions, (b) 3D view of the binding conformation.
Figure 9.

Docking analysis of compound 10e. (a) 2D view of binding site interactions, (b) 3D view of the binding conformation.
3.5. Molecular dynamics simulation
In order to validate the results of molecular docking and to affirm the stability of docked compounds in the binding pocket of the MAO-B receptor, the most active compound in the dataset (compound 10b) was subjected to MD simulation. The system was employed for 20 ns time scale simulation. The results are shown in Figure 10. The plot of the root means square deviation (RMSD) (Figure 10a) indicates that the 10b_2BK3 complex attained stability at 7 ns. Then, it remained constant during the MD simulation. The average RMSD value is 0.26 nm with a maximum value of 0.49 nm and a minimum value of 0.37 nm. The root means square fluctuation (RMSF) of the 10b_2BK3 complex is also determined (Figure 10b). This parameter is an indicator of residual flexibility. We conclude that all amino acid residues had RMSF values less than 0.1 nm, with the exception of residues 470–500, which had RMSF values greater than 0.1 nm. The stability of the system was also verified by plotting the radius of gyration (Rg) (Figure 10c). The Rg value of the complex is in the range of 5.15 – 5.2 nm suggesting that these complexes are stable and compact during the 20 ns of the MD simulation. In addition, and from Figure 10d, we can see that the main secondary structural elements of the ligand and the protein in the 10b_2BK3 complex remained close to its initial structure before the MD simulation.
Figure 10.

Molecular dynamics simulations of the 10b_2BK3 complex. (a) represents the RMSD plot, (b) represents the RMSF plot, (c) represents the Rg plot, and (d) represents the superposition of the final complex structure after MD simulation of 20 ns (green color) and initial complex structures before MD simulation (blue color).
4. Conclusion
In this paper, molecular modeling studies including 2D-QSAR, ADMET, molecular docking, and molecular dynamics simulation were applied on a series of unsaturated ketone derivatives as MAO-B inhibitors. The PLS technique was utilized to build the 2D QSAR model, which employed the pIC50 values as a dependent variable and the MOE descriptors as independent variables. The results revealed the importance of BCUT_SMR_2, logP (o/w), SlogP_VSA4 and vsurf_IW3 descriptors in describing the activity values. The pharmacokinetic characteristics of compounds were also studied using drug likeness and ADMET prediction. Molecular docking was carried out to investigate the binding site interactions between ligands and the MAO-B receptor. The activity data exhibited a greater correlation (r2 = 0.73) with the binding free energy values. Finally, the active compounds were evaluated using MD simulation. The findings of this work clearly demonstrate the importance of unsaturated ketone derivatives in inhibiting MAO-B enzymatic activity, and they may open the way for the development of other inhibitory derivatives as Parkinson’s disease possible treatments.
The superposition between the native (green color) and the redocked (red color) ligands into the binding site of MAO-B enzyme.
Table S1.
Y-randomization parameters after several runs.
| Model | R | R2 | Q2 | Model | R | R2 | Q2 |
|---|---|---|---|---|---|---|---|
| Original | 0.94 | 0.88 | 0.81 | Random 11 | 0.28 | 0.08 | −0.65 |
| Random 1 | 0.55 | 0.30 | −0.20 | Random 12 | 0.29 | 0.09 | −0.59 |
| Random 2 | 0.11 | 0.01 | −0.91 | Random 13 | 0.47 | 0.22 | −0.41 |
| Random 3 | 0.44 | 0.19 | −0.51 | Random 14 | 0.50 | 0.25 | −0.40 |
| Random 4 | 0.23 | 0.05 | −0.74 | Random 15 | 0.54 | 0.29 | −0.11 |
| Random 5 | 0.38 | 0.14 | −0.54 | Random 16 | 0.28 | 0.08 | −0.62 |
| Random 6 | 0.39 | 0.15 | −0.54 | Random 17 | 0.32 | 0.10 | −0.48 |
| Random 7 | 0.50 | 0.25 | −0.49 | Random 18 | 0.34 | 0.12 | −0.51 |
| Random 8 | 0.57 | 0.32 | −0.34 | Random 19 | 0.35 | 0.13 | −0.48 |
| Random 9 | 0.33 | 0.11 | −0.73 | Random 20 | 0.39 | 0.15 | −0.63 |
| Random 10 | 0.23 | 0.05 | −0.65 |
Table S2.
Physicochemical properties and drug-likeness of dataset compounds.
| No | Physicochemical properties | Druglikeness | |||||||||
|---|---|---|---|---|---|---|---|---|---|---|---|
| MW | Log P | HBA | HBD | TPSA | Lipinski | Ghose | Veber | Egan | Muegge | Bioavailability Score | |
| 8b | 306.28 | 4.61 | 5 | 0 | 26.30 | Yes 0 violation |
No 1 violation: WLOGP>5.6 |
Yes | Yes | Yes | 0.55 |
| 9a | 238.28 | 3.59 | 2 | 0 | 26.30 | Yes 0 violation |
yes | Yes | Yes | Yes | 0.55 |
| 9b | 306.28 | 4.61 | 5 | 0 | 26.30 | Yes 0 violation |
No 1 violation: WLOGP>5.6 |
Yes | Yes | Yes | 0.55 |
| 10a | 238.28 | 3.59 | 2 | 0 | 26.30 | Yes 0 violation |
yes | Yes | Yes | Yes | 0.55 |
| 10b | 306.28 | 4.61 | 2 | 0 | 26.30 | Yes 0 violation |
Yes | Yes | Yes | Yes | 0.55 |
| 10c | 306.28 | 4.61 | 5 | 0 | 26.30 | Yes 0 violation |
No 1 violation: WLOGP>5.6 |
Yes | Yes | Yes | 0.55 |
| 10d | 306.28 | 4.61 | 5 | 0 | 26.30 | Yes 0 violation |
No 1 violation: WLOGP>5.6 |
Yes | Yes | Yes | 0.55 |
| 10e | 256.27 | 3.73 | 3 | 0 | 26.30 | Yes 0 violation |
yes | Yes | Yes | Yes | 0.55 |
| 10f | 272.73 | 4.24 | 2 | 0 | 26.30 | Yes 0 violation |
yes | Yes | Yes | Yes | 0.55 |
| 10g | 268.31 | 3.59 | 3 | 0 | 35.53 | Yes 0 violation |
yes | Yes | Yes | Yes | 0.55 |
| 10h | 268.31 | 3.59 | 3 | 0 | 35.53 | Yes 0 violation |
yes | Yes | Yes | Yes | 0.55 |
| 11a | 224.25 | 3.28 | 2 | 1 | 37.30 | Yes 0 violation |
yes | Yes | Yes | Yes | 0.55 |
| 11b | 292.25 | 4.30 | 5 | 1 | 37.30 | Yes 0 violation |
yes | Yes | Yes | Yes | 0.55 |
| 11g | 254.28 | 3.29 | 3 | 1 | 46.33 | Yes 0 violation |
yes | Yes | Yes | Yes | 0.55 |
| 12b | 257.71 | 3.99 | 4 | 1 | 29.10 | Yes 0 violation |
yes | Yes | Yes | Yes | 0.55 |
| 15a | 307.27 | 4.06 | 5 | 2 | 49.33 | Yes 0 violation |
yes | Yes | Yes | Yes | 0.55 |
| 15b | 273.71 | 3.69 | 2 | 2 | 49.33 | Yes 0 violation |
yes | Yes | Yes | Yes | 0.55 |
| 16a | 309.26 | 4.49 | 5 | 1 | 29.10 | Yes 0 violation |
No 1 violation: WLOGP>5.6 |
Yes | Yes | Yes | 0.55 |
| 16b | 309.26 | 4.49 | 5 | 1 | 29.10 | Yes 0 violation |
No 1 violation: WLOGP>5.6 |
Yes | Yes | Yes | 0.55 |
| 16c | 309.26 | 4.49 | 5 | 1 | 29.10 | Yes 0 violation |
No 1 violation: WLOGP>5.6 |
Yes | Yes | Yes | 0.55 |
| 17a | 309.26 | 4.49 | 5 | 1 | 29.10 | Yes 0 violation |
No 1 violation: WLOGP>5.6 |
Yes | Yes | Yes | 0.55 |
| 18a | 309.26 | 4.49 | 5 | 1 | 29.10 | Yes 0 violation |
No 1 violation: WLOGP>5.6 |
Yes | Yes | Yes | 0.55 |
| 19a | 224.25 | 3.30 | 2 | 0 | 26.30 | Yes 0 violation |
yes | Yes | Yes | Yes | 0.55 |
| 20a | 254.28 | 3.31 | 3 | 0 | 35.53 | Yes 0 violation |
yes | Yes | Yes | Yes | 0.55 |
| 20b | 288.73 | 3.96 | 3 | 0 | 35.53 | Yes 0 violation |
yes | Yes | Yes | Yes | 0.55 |
LogP = octanol–water partition coefficient, MW = molecular weight, HBA = number of hydrogen bond acceptor, TPSA = topological polar surface area, HBD = number of hydrogen bond donor.
Table S3.
ADMET prediction of all the compounds in the dataset.
| Compounds | Absorption | Distribution | Metabolism | Excretion | Toxicity | ||||||||||
|---|---|---|---|---|---|---|---|---|---|---|---|---|---|---|---|
| Water solubility | Caco2 permeability | Intestinal absorption human (HIA) | Blood brain barrier permeability | CYP | Total clearance | AMES toxicity | hepatoxicity | Max. tolerated dose (human) | |||||||
| 2D6 | 3A4 | 1A2 | 2C19 | 2C9 | 2D6 | 3A4 | |||||||||
| Substrate | Inhibitor | ||||||||||||||
| Numeric (log mol/L) | Numeric (log Papp in 10−6 cm/s) | Numeric (% absorbed) | Numeric (log BB) | Categorical (Yes/No) | Numeric (log ml/min/kg) | Categorical (Yes/No) | Categorical (Yes/No) | Numeric (log mg/kg/day) | |||||||
| 8b | −5.905 | 1.46 | 93.70 | 0.33 | No | Yes | Yes | Yes | Yes | No | No | −0.003 | No | No | 0.83 |
| 9a | −4.66 | 1.45 | 97.68 | 0.39 | No | Yes | Yes | Yes | Yes | No | No | 0.23 | No | No | 1.05 |
| 9b | −6.04 | 1.48 | 94.41 | 0.35 | No | Yes | Yes | Yes | Yes | No | Yes | 0.044 | No | No | 0.91 |
| 10a | −4.73 | 1.07 | 98.12 | 0.38 | No | Yes | Yes | Yes | Yes | No | No | 0.24 | No | No | 1.02 |
| 10b | −6.02 | 1.11 | 94.85 | 0.33 | No | Yes | Yes | Yes | Yes | No | Yes | 0.055 | No | No | 0.88 |
| 10c | −6.02 | 1.11 | 94.85 | 0.34 | No | Yes | Yes | Yes | Yes | No | Yes | 0.045 | No | No | 0.88 |
| 10d | −6.03 | 1.11 | 94.85 | 0.34 | No | Yes | Yes | Yes | Yes | No | Yes | 0.035 | No | No | 0.88 |
| 10e | −4.97 | 1.31 | 97.35 | 0.35 | No | Yes | Yes | Yes | Yes | No | No | 0.19 | Yes | No | 1.007 |
| 10f | −5.41 | 1.08 | 96.46 | 0.32 | No | Yes | Yes | Yes | Yes | No | No | −0.007 | No | No | 0.99 |
| 10g | −4.93 | 1.29 | 98.10 | −0.13 | No | Yes | Yes | Yes | Yes | No | No | 0.33 | Yes | No | 0.97 |
| 10h | −4.97 | 1.10 | 99.00 | −0.19 | No | Yes | Yes | Yes | Yes | No | No | 0.26 | No | No | 1.05 |
| 11a | −3.65 | 1.63 | 94.05 | 0.16 | No | Yes | No | Yes | No | No | No | 0.15 | No | No | 0.63 |
| 11b | −4.95 | 1.66 | 90.77 | 0.18 | No | Yes | Yes | Yes | Yes | No | No | −0.04 | No | No | 0.5 |
| 11g | −3.73 | 1.35 | 93.93 | −0.08 | No | Yes | Yes | Yes | No | No | No | 0.23 | No | No | 0.56 |
| 12b | −5.23 | 1.51 | 91.54 | 0.27 | No | Yes | Yes | Yes | Yes | No | No | 0.045 | No | Yes | 0.69 |
| 15a | −4.71 | 1.39 | 89.13 | −0.08 | No | Yes | Yes | Yes | Yes | No | Yes | 0.074 | No | Yes | 0.26 |
| 15b | −.3.99 | 1.34 | 90.25 | −0.052 | No | Yes | Yes | Yes | Yes | No | No | −0.081 | No | No | 0.35 |
| 16a | −5.69 | 1.48 | 91.57 | 0.27 | No | Yes | Yes | Yes | Yes | No | Yes | −0.071 | No | Yes | 0.74 |
| 16b | −5.64 | 1.48 | 90.91 | 0.26 | No | Yes | Yes | Yes | Yes | No | Yes | −0.08 | No | Yes | 0.74 |
| 16c | −5.64 | 1.46 | 90.90 | 0.26 | No | Yes | Yes | Yes | Yes | No | Yes | −0.09 | No | Yes | 0.76 |
| 17a | −5.44 | 1.62 | 90.00 | 0.28 | No | Yes | Yes | Yes | Yes | No | Yes | −0.15 | No | Yes | 0.73 |
| 18a | −5.51 | 1.24 | 90.72 | 0.29 | No | Yes | Yes | Yes | Yes | No | Yes | −0.085 | No | Yes | 0.80 |
| 19a | −4.21 | 1.74 | 96.38 | 0.28 | No | Yes | Yes | Yes | No | No | No | 0.77 | No | No | 1.18 |
| 20a | −4.63 | 1.50 | 97.61 | 0.11 | No | Yes | Yes | Yes | Yes | No | No | 0.75 | No | No | 1.23 |
| 20b | −5.28 | 1.51 | 95.95 | 0.10 | No | Yes | Yes | Yes | Yes | No | No | −0.04 | No | No | 1.19 |
Table S4.
Binding affinity of the studied compounds
| No | pIC50 | Binding affinity (Kcal/mol) | No | pIC50 | Binding affinity (Kcal/mol) |
|---|---|---|---|---|---|
| 8b | 6.5968 | −9.4 | 11g | 6.2048 | −9.4 |
| 9a | 6.1007 | −9.5 | 12b | 5.5497 | −8.5 |
| 9b | 5.6740 | −9.5 | 15a | 5.2232 | −7.9 |
| 10a | 6.3269 | −9.2 | 15b | 5.2831 | −8.1 |
| 10b | 7.7958 | −9.9 | 16a | 5.4723 | −8.5 |
| 10c | 6.8386 | −9.6 | 16b | 5.3106 | −8.3 |
| 10d | 6.70114 | −9.3 | 16c | 6.5482 | −9.4 |
| 10e | 7.2518 | −9.7 | 17a | 6.2365 | −9.1 |
| 10f | 7.1611 | −9.6 | 18a | 6.6516 | −9.2 |
| 10g | 6.3777 | −9.3 | 19a | 5.2306 | −8.3 |
| 10h | 5.8551 | −9.3 | 20a | 5.5867 | −8.7 |
| 11a | 6.7399 | −9.4 | 20b | 6.0282 | −9.2 |
| 11b | 7.2441 | −9.5 |
Acknowledgment
The authors want to thank the Moroccan Association of Theoretical Chemistry (MATC) for its relevant help regarding to the Software.
Footnotes
Conflict of interest
All authors declare that they have no conflict of interest in this work.
References
- 1. Shih JC, Chen K, Ridd MJ. MONOAMINE OXIDASE: From Genes to Behavior. Annual Review of Neuroscience. 1999;22:197–217. doi: 10.1146/annurev.neuro.22.1.197. [DOI] [PMC free article] [PubMed] [Google Scholar]
- 2. Denney RM. Assignment of genes for human monoamine oxidases A and B to the X chromosome. Journal of Neuroscience Research. 1986;616:601–616. doi: 10.1016/B978-0-7020-3373-5.00010-1. [DOI] [PubMed] [Google Scholar]
- 3. Bach AWJ, Lant NC, Johnsont DL, Abell CW, Bembenek ME, et al. cDNA cloning of human liver monoamine oxidase A and B: Molecular basis of differences in enzymatic properties. Proceedings of the National Academy of Sciences. 1988;85:4934–4938. doi: 10.1073/pnas.85.13.4934. [DOI] [PMC free article] [PubMed] [Google Scholar]
- 4. Cesura BAM, Pletscher A. The new generation of monoamine oxidase inhibitors. Progress in Drug Research/Fortschritte der Arzneimittelforschung/Progrès des recherches pharmaceutiques. 1992;38:224–225. doi: 10.1007/978-3-0348-7141-9_3. [DOI] [PubMed] [Google Scholar]
- 5. Jegham S, George P, Recherche S, Snc DDR, Carrières R. Monoamine oxidase A and B inhibitors. Expert Opinion on Therapeutic Patents Jegham. 1998;8(9):1143–1150. doi: 10.1517/13543776.8.9.1143. [DOI] [Google Scholar]
- 6. Academy S, Sciences M. The discovery of antidepressants: A winding path. A Pletscher. 1991;47(1):4–8. doi: 10.1007/BF02041242. [DOI] [PubMed] [Google Scholar]
- 7. DSZM A clinical overview of monoamine oxidase inhibitors. Psychosomatics. 1985;26(3):240–246. 251. doi: 10.1016/S0033-3182(85)72877-0. [DOI] [PubMed] [Google Scholar]
- 8. Marin DB, Bierera LM, Lawlorb BA, Ryana TM, Jacobsonc R, et al. L-Deprenyl and physostigmine for the treatment of Alzheimer’s disease. Psychiatry Research. 1995;58(3):181–189. doi: 10.1016/0165-1781(95)02714-8. [DOI] [PubMed] [Google Scholar]
- 9. Jo S, Yarishkin O, Hwang YJ, Chun YE, Park M, et al. ARTICLES GABA from reactive astrocytes impairs memory in mouse models of Alzheimer ‘ s disease. Nature Publishing Group. 2014;20:886–896. doi: 10.1038/nm.3639. [DOI] [PMC free article] [PubMed] [Google Scholar]
- 10. Waibel S, Reuter A, Ludolph AC. Rasagiline alone and in combination with riluzole prolongs survival in an ALS mouse model. Journal of Neurology. 2004;251:1080–1084. doi: 10.1007/s00415-004-0481-5. [DOI] [PubMed] [Google Scholar]
- 11. Halgren TA, Murphy RB, Friesner RA, Beard HS, Frye LL, et al. Glide: A new approach for rapid, accurate docking and scoring. 2. Enrichment factors in database screening. Journal of Medicinal Chemistry. 2004;47(7):1750–1759. doi: 10.1021/jm0310885. [DOI] [PubMed] [Google Scholar]
- 12. Fabbri M, Rosa MM, Abreu D, Ferreira JJ. Clinical pharmacology review of safinamide for the treatment of Parkinson’s disease. Future Medicine. 2015;5 doi: 10.2217/nmt.15.46. [DOI] [PubMed] [Google Scholar]
- 13. Salum LB, Altei WF, Chiaradia LD, Cordeiro MNS, Canevarolo RR, et al. European Journal of Medicinal Chemistry migration inhibitors. European Journal of Medicinal Chemistry. 2013;63:501–510. doi: 10.1016/j.ejmech.2013.02.037. [DOI] [PMC free article] [PubMed] [Google Scholar]
- 14. Israf DA, Khaizurin TA, Syahida A, Lajis NH, Khozirah S. Cardamonin inhibits COX and iNOS expression via inhibition of p65NF-κB nuclear translocation and Iκ-B phosphorylation in RAW 264.7 macrophage cells. Molecular Immunology. 2007;44:673–679. doi: 10.1016/j.molimm.2006.04.025. [DOI] [PubMed] [Google Scholar]
- 15. Mahapatra DK, Asati V, Bharti SK. European Journal of Medicinal Chemistry Chalcones and their therapeutic targets for the management of diabetes: Structural and pharmacological perspectives. European Journal of Medicinal Chemistry. 2015;92:839–865. doi: 10.1016/j.ejmech.2015.01.051. [DOI] [PubMed] [Google Scholar]
- 16. Rao Lambu Mallikharjuna, Kumar Suresh, Yousuf Syed Khalid, Sharma Deepak K, hussain Altaf, et al. Medicinal chemistry of dihydropyran based medium ring macrolides related to aspergillides: selective inhibition of PI3K α! Journal of Medicinal Chemistry. 2013;56(15):6136–6145. doi: 10.1021/jm400515c. [DOI] [PubMed] [Google Scholar]
- 17. Ramadan M, Sayed E, Hamadah H, El A, Fodah R. European Journal of Medicinal Chemistry Antiobesity, antioxidant and cytotoxicity activities of newly synthesized chalcone derivatives and their metal complexes. European Journal of Medicinal Chemistry. 2014;76:517–530. doi: 10.1016/j.ejmech.2014.02.021. [DOI] [PubMed] [Google Scholar]
- 18. Sinha S, Medhi B, Sehgal R. Chalcones as an Emerging Lead Molecule for Antimalarial Therapy: A Review. Journal of Modern Medicinal Chemistry. 2013;1:64–77. [Google Scholar]
- 19. Sharma H, Patil S, Sanchez TW, Neamati N, Schinazi RF, et al. Bioorganic & Medicinal Chemistry Synthesis, biological evaluation and 3D-QSAR studies of 3-keto salicylic acid chalcones and related amides as novel HIV-1 integrase inhibitors. Bioorganic & Medicinal Chemistry. 2011;19(6):2030–2045. doi: 10.1016/j.bmc.2011.01.047. [DOI] [PMC free article] [PubMed] [Google Scholar]
- 20. Arasappan A, Padilla AI, Jao E, Bennett F, Bogen SL, et al. Toward second generation hepatitis C Virus NS3 serine protease inhibitors: discovery of novel P4 modified analogues with improved potency and pharmacokinetic profile. Journal of Medicinal Chemistry. 2009;52:2806–2817. doi: 10.1021/jm801590u. [DOI] [PubMed] [Google Scholar]
- 21. Newman DJ, Cragg GM. Natural products as sources of new drugs over the last 25 years. Journal of Natural Products. 2007;70(3):461–477. doi: 10.1021/np068054v. [DOI] [PubMed] [Google Scholar]
- 22. Scapin G. Structural biology and drug discovery. Current Pharmaceutical Design. 2006;12(17):2087–2097. doi: 10.2174/138161206777585201. [DOI] [PubMed] [Google Scholar]
- 23. Drie JH. Computer-aided drug design: The next 20 years. Journal of Computer-Aided Molecular Design. 2007;21(10–11):591–601. doi: 10.1007/s10822-007-9142-y. [DOI] [PubMed] [Google Scholar]
- 24. Zhou H, Liu L, Huang J, Bernard D, Karatas H, et al. Structure-based design of high-affinity macrocyclic peptidomimetics to block the menin-mixed lineage leukemia 1 (MLL1) protein-protein interaction. Journal of Medicinal Chemistry. 2013;56(3):1113–1123. doi: 10.1021/jm3015298. [DOI] [PubMed] [Google Scholar]
- 25. Fung HYJ, Chook YM. Atomic basis of CRM1-cargo recognition, release and inhibition. Seminars in Cancer Biology. 2014;27:52–61. doi: 10.1016/j.semcancer.2014.03.002. [DOI] [PMC free article] [PubMed] [Google Scholar]
- 26. Ran X, Liu L, Yang CY, Lu J, Chen Y, et al. Design of high-affinity stapled peptides to target the repressor activator protein 1 (RAP1)/telomeric repeat-binding factor 2 (TRF2) protein-protein interaction in the shelterin complex. Journal of Medicinal Chemistry. 2016;59(1):328–334. doi: 10.1021/acs.jmedchem.5b01465. [DOI] [PubMed] [Google Scholar]
- 27. Kargbo RB. Novel triterpenone for treatment of viral diseases-HIV inhibitors. ACS Medicinal Chemistry Letters. 2018;9(4):298–299. doi: 10.1021/acsmedchemlett.8b00113. [DOI] [PMC free article] [PubMed] [Google Scholar]
- 28. Nagasaka M, Ge Y, Sukari A, Kukreja G, Ou SHI. A user’s guide to lorlatinib. Critical Reviews in Oncology/Hematology. 2020;151(4):102969. doi: 10.1016/j.critrevonc.2020.102969. [DOI] [PubMed] [Google Scholar]
- 29. Huang HJ, Lee KJ, Yu HW, Chen CY, Hsu CH, et al. Structure-based and ligand-based drug design for her 2 receptor. Journal of Biomolecular Structure and Dynamics. 2010;28(1):23–37. doi: 10.1080/07391102.2010.10507341. [DOI] [PubMed] [Google Scholar]
- 30. Druker BJLNB. Lessons learned from the development of an Abl tyrosine kinase inhibitor for chronic myelogenous leukemia. Journal of Clinical Investigation. 2000;105(1):3–7. doi: 10.1172/JCI9083. [DOI] [PMC free article] [PubMed] [Google Scholar]
- 31. Wlodawer A, Vondrasek J. Inhibitors of HIV-1 protease: A major success of structure-assisted drug design. Annual Review of Biophysics and Biomolecular Structure. 1998;27:249–284. doi: 10.1146/annurev.biophys.27.1.249. [DOI] [PubMed] [Google Scholar]
- 32. Clark DE. What has computer-aided molecular design ever done for drug discovery? Expert Opinion on Drug Discovery. 2006;1(2):103–110. doi: 10.1517/17460441.1.2.103. [DOI] [PubMed] [Google Scholar]
- 33. Depeursinge A, Racoceanu D, Iavindrasana J, Cohen G, Platon A, et al. Fusing visual and clinical information for lung tissue classification in HRCT data. Artificial Intelligence in Medicine. 2010;10:ARTMED1118. doi: 10.1016/j. [DOI] [PubMed] [Google Scholar]
- 34. Liu B, Tsutsui M, Taniguchi M. Measuring single-molecule conductance at an Ultra-Low molecular concentration in vacuum. Micromachines. 2018;9(6):282. doi: 10.3390/mi9060282. [DOI] [PMC free article] [PubMed] [Google Scholar]
- 35. Choi JW, Jang BK, Cho N, Park JH, Yeon SK, et al. Synthesis of a series of unsaturated ketone derivatives as selective and reversible monoamine oxidase inhibitors. Bioorganic & Medicinal Chemistry. 2015;23(19):6486–6496. doi: 10.1016/j.bmc.2015.08.012. [DOI] [PubMed] [Google Scholar]
- 36. Tong J, Zhan P, Wang XS, Wu Y. Quionolone carboxylic acid derivatives as HIV-1 integrase inhibitors: Docking-based HQSAR and topomer CoMFA analyses. Journal of Chemometrics. 2017;31(12):1–13. doi: 10.1002/cem.2934. [DOI] [PMC free article] [PubMed] [Google Scholar]
- 37. Clark M, Cramer RD, Van Opdenbosch N. Validation of the general purpose tripos 5.2 force field. Journal of Computational Chemistry. 1989;10(8):982–1012. doi: 10.1002/jcc.540100804. [DOI] [Google Scholar]
- 38. Caballero J, Saavedra M, Fernández M, González-Nilo FD. Quantitative structure-activity relationship of rubiscolin analogues as δ opioid peptides using comparative molecular field analysis (CoMFA) and comparative molecular similarity indices analysis (CoMSIA) Journal of Agricultural and Food Chemistry. 2007;55(20):8101–8104. doi: 10.1021/jf071031h. [DOI] [PubMed] [Google Scholar]
- 39.El Aissouq A, Toufik H.QSAR study of isonicotinamides derivatives as Alzheimr’s disease inhibitors using PLS-R and ANN methods. 2019 International Conference on Intelligent Systems and Advanced Computing Sciences (ISACS); 2019; pp. 1–7. [DOI] [Google Scholar]
- 40. El Aissouq A, Toufik H, Stitou M, Ouammou A, Lamchouri F. In silico design of novel tetra-substituted pyridinylimidazoles derivatives as c-Jun N-Terminal Kinase-3 Inhibitors, Using 2D/3D-QSAR studies, molecular docking and ADMET prediction. International Journal of Peptide Research and Therapeutics. 2020;26:1335–1351. doi: 10.1007/s10989-019-09939-8. [DOI] [Google Scholar]
- 41. El Aissouq A, Chedadi O, Kasmi R, Elmchichi L, En-nahli F, et al. Molecular modeling studies of C-Glycosylfavone derivatives as GSK-3β inhibitors based on QSAR and docking analysis. Journal of Solution Chemistry. 2021;50(5):808–822. doi: 10.1007/s10953-021-01083-6. [DOI] [Google Scholar]
- 42. Zhihua L, Yuzhang W, Bo Z, Bing N, Li W. Toward the quantitative prediction of T-Cell epitopes: QSAR studies on peptides having affinity with the class I MHC molecular HLA-A*0201. Journal of Computational Biology. 2005;11(4):683–694. doi: 10.1089/cmb.2004.11.683. [DOI] [PubMed] [Google Scholar]
- 43.Kunal R, Supratik K, Rudra, Narayan D. A Primer on QSAR/QSPR Modeling. New York: Springer International Publishing; 2015. [Google Scholar]
- 44. Roy PP, Roy K. On some aspects of variable selection for partial least squares regression models. QSAR & Combinatorial Science. 2008;27(3):302–313. doi: 10.1002/qsar.200710043. [DOI] [Google Scholar]
- 45. Shukla A, Tyagi R, Meena S, Datta D, Srivastava SK, et al. 2D- and 3D-QSAR modelling, molecular docking and in vitro evaluation studies on 18β-glycyrrhetinic acid derivatives against triple-negative breast cancer cell line. Journal of Biomolecular Structure and Dynamics. 2019;38(1):168–185. doi: 10.1080/07391102.2019.1570868. [DOI] [PubMed] [Google Scholar]
- 46. Tropsha A. Best Practices for QSAR Model development, validation, and exploitation. Molecular Informatics. 2010;29:476–488. doi: 10.1002/minf.201000061. [DOI] [PubMed] [Google Scholar]
- 47.Roy K, Kar S, Das RN. A Primer on QSAR/QSPR Modeling: Fundamental Concepts. Boston: Academic Press; 2015. [Google Scholar]
- 48. Golbraikh A, Tropsha A. Beware of q2! Journal of Molecular Graphics and Modelling. 2002;20(4):269–276. doi: 10.1016/S1093-3263(01)00123-1. [DOI] [PubMed] [Google Scholar]
- 49. Schu G, Ebert R, Chen J, Wang B, Ku R. External validation and prediction employing the predictive squared correlation coefficient. Journal of Chemical Information and Modeling. 2008;48(11):2140–2145. doi: 10.1021/ci800253u. [DOI] [PubMed] [Google Scholar]
- 50. Gramatica P. Principles of QSAR models validation: Internal and external. QSAR and Combinatorial Science. 2007;26(5):694–701. doi: 10.1002/qsar.200610151. [DOI] [Google Scholar]
- 51. Goudzal A, El Aissouq A, El Hamdani H, Ouammou A. Materials Today: Proceedings QSAR modeling, molecular docking studies and ADMET prediction on a series of phenylaminopyrimidine- ( thio ) urea derivatives as CK2 inhibitors. Materials Today: Proceedings. 2020;31:1–12. doi: 10.1016/j.matpr.2020.08.044. [DOI] [Google Scholar]
- 52. Pires DEV, Blundell TL, Ascher DB. pkCSM: Predicting small-molecule pharmacokinetic and toxicity properties using graph-based signatures. Journal of Medicinal Chemistry. 2015;58(9):4066–4072. doi: 10.1021/acs.jmedchem.5b00104. [DOI] [PMC free article] [PubMed] [Google Scholar]
- 53. Daina A, Michielin O, Zoete V. SwissADME: A free web tool to evaluate pharmacokinetics, drug-likeness and medicinal chemistry friendliness of small molecules. Scientific Reports. 2017;7(8):1–13. doi: 10.1038/srep42717. [DOI] [PMC free article] [PubMed] [Google Scholar]
- 54. Dong X, Zhang ZM, Liu F, Wang W, Yu F, et al. Metamorphic rocks of the causes of southeastern Lhasa terrane and the Mesozoic - Cenozoic orogeny. Acta Petrologica Sinica. 2012;28(6):1765–1784. [Google Scholar]
- 55. Dalvit C, Fasolini M, Flocco M, Knapp S, Pevarello P, et al. Spectroscopy Experiments: Detection of High-Affinity Ligands. Journal of Medicinal Chemistry. 2002;45:2610–2614. doi: 10.1021/jm011122k. [DOI] [PubMed] [Google Scholar]
- 56. Yan B, Gremlich HU, Moss S, Coppola GM, Sun Q, et al. A comparison of various FTIR and FT Raman methods: Applications in the reaction optimization stage of combinatorial chemistry. Journal of Combinatorial Chemistry. 1999;1(1):46–54. doi: 10.1021/cc980003w. [DOI] [Google Scholar]
- 57. El Aissouq A, Chedadi O, Bouachrine M, Ouammou A. Identification of novel SARS-CoV-2 inhibitors: A structure-based virtual screening approach. Journal of Chemistry. 2021;2021:1–7. doi: 10.1155/2021/1901484. [DOI] [Google Scholar]
- 58. Kasmi R, Hadaji E, Chedadi O, El Aissouq A, Bouachrine M, et al. 2D-QSAR and docking study of a series of coumarin derivatives as inhibitors of CDK (anticancer activity) with an application of the molecular docking method. Heliyon. 2020;6(March):e04514. doi: 10.1016/j.heliyon.2020.e04514. [DOI] [PMC free article] [PubMed] [Google Scholar]
- 59. El Mchichi L, El Aissouq A, Kasmi R, Belhassan A, El-Mernissi R, et al. In silico design of novel Pyrazole derivatives containing thiourea skeleton as anti-cancer agents using: 3D QSAR, Drug-Likeness studies, ADMET prediction and molecular docking. Materials Today: Proceedings. 2021;45(8):7661–7674. doi: 10.1016/j.matpr.2021.03.152. [DOI] [Google Scholar]
- 60. Binda C, Khalil A, Li M, Mattevi A, Castagnoli N, et al. Demonstration of isoleucine 199 as a structural determinant for the selective inhibition of human monoamine oxidase B by specific reversible inhibitors. Journal of Biological Chemistry. 2005;280(16):15761–15766. doi: 10.1074/jbc.M500949200. [DOI] [PubMed] [Google Scholar]
- 61. Morris GM, Huey R, Lindstrom W, Sanner MF, Belew RK, et al. Software news and updates AutoDock4 and AutoDockTools4: Automated docking with selective receptor flexibility. Journal of Computational Chemistry. 2009;30(16):2785–2791. doi: 10.1002/jcc. [DOI] [PMC free article] [PubMed] [Google Scholar]
- 62. Trott O, Olson AJ. Software news and update AutoDock vina: improving the speed and accuracy of docking with a new scoring function, efficient optimization, and multithreading. Journal of Computational Chemistry. 2009;31(2):455–461. doi: 10.1002/jcc. [DOI] [PMC free article] [PubMed] [Google Scholar]
- 63. Abraham MJ, Murtola T, Schulz R, Páll S, Smith JC, et al. Gromacs: High performance molecular simulations through multi-level parallelism from laptops to supercomputers. SoftwareX. 2015;1–2:19–25. doi: 10.1016/j.softx.2015.06.001. [DOI] [Google Scholar]
- 64. Vanommeslaeghe K, Hatcher E, Acharya C, Kundu S, Zhong S, et al. CHARMM general force field: A force field for drug-like molecules compatible with the CHARMM all-atom additive biological force fields. Journal of Computational Chemistry. 2010;31(4):671–690. doi: 10.1002/jcc.21367. [DOI] [PMC free article] [PubMed] [Google Scholar]
- 65. Best RB, Zhu X, Shim J, Lopes PEM, Mittal J, et al. Optimization of the additive CHARMM all-atom protein force field targeting improved sampling of the backbone φ, ψ and side-chain χ 1 and χ 2 dihedral angles. Journal of Chemical Theory and Computation. 2012;8(9):3257–3273. doi: 10.1021/ct300400x. [DOI] [PMC free article] [PubMed] [Google Scholar]
- 66. Jorgensen WL, Chandrasekhar J, Madura JD, Impey RW, Klein ML, et al. Comparison of simple potential functions for simulating liquid water Comparison of simple potential functions for simulating liquid water. The Journal of Chemical Physics. 1983;926(79) doi: 10.1063/1.445869. [DOI] [Google Scholar]
- 67. Wildman SA, Crippen GM. Three-dimensional molecular descriptors and a novel QSAR method. Journal of Molecular Graphics and Modelling. 2002;21(February):161–170. doi: 10.1016/S1093-3263(02)00147-X. [DOI] [PubMed] [Google Scholar]
- 68.Introduction AN, Chemoinformatics TO. An Introduction to Chemoinformatics. Springer; 2007. [Google Scholar]
- 69. Sulistyo B, Sudarmanto ARI, Yuswanto A, Susidarti A, Noegrohati SRI. Mole cu la r Mod eling of H um an 3 β-Hy droxy steroid dehydrogenase Type 2: combined homology modeling, docking and QSAR approach (Pemodelan molekular enzim 3β-Hydroxysteroid dehydrogenase tipe 2: pemodelan kombinasi homologi, docking dan pendekatan. Indonesian Journal of Pharmaceutical Sciences. 2017;15(1):7–16. [Google Scholar]
- 70. Meng-lund H, Kasten G, Tarp K, Poso A, Pantsar T. The use of molecular descriptors in the development of co-amorphous formulations. European Journal of Pharmaceutical Sciences. 2018;119(2):31–38. doi: 10.1016/j.ejps.2018.04.014. [DOI] [PubMed] [Google Scholar]
- 71. Shahapurkar S, Pandya T, Kawathekar N, Chaturvedi SC. Quantitative structure activity relationship studies of diaryl furanones as selective COX-2 inhibitors. European Journal of Medicinal Chemistry. 2004;39(4):383–388. doi: 10.1016/j.ejmech.2003.12.007. [DOI] [PubMed] [Google Scholar]
- 72. Bower KM. Analysis of variance (ANOVA) using MINITAB. Journal of Scientific Instruments. 2000;17(3):0–5. [Google Scholar]
Associated Data
This section collects any data citations, data availability statements, or supplementary materials included in this article.
Supplementary Materials
The superposition between the native (green color) and the redocked (red color) ligands into the binding site of MAO-B enzyme.
Table S1.
Y-randomization parameters after several runs.
| Model | R | R2 | Q2 | Model | R | R2 | Q2 |
|---|---|---|---|---|---|---|---|
| Original | 0.94 | 0.88 | 0.81 | Random 11 | 0.28 | 0.08 | −0.65 |
| Random 1 | 0.55 | 0.30 | −0.20 | Random 12 | 0.29 | 0.09 | −0.59 |
| Random 2 | 0.11 | 0.01 | −0.91 | Random 13 | 0.47 | 0.22 | −0.41 |
| Random 3 | 0.44 | 0.19 | −0.51 | Random 14 | 0.50 | 0.25 | −0.40 |
| Random 4 | 0.23 | 0.05 | −0.74 | Random 15 | 0.54 | 0.29 | −0.11 |
| Random 5 | 0.38 | 0.14 | −0.54 | Random 16 | 0.28 | 0.08 | −0.62 |
| Random 6 | 0.39 | 0.15 | −0.54 | Random 17 | 0.32 | 0.10 | −0.48 |
| Random 7 | 0.50 | 0.25 | −0.49 | Random 18 | 0.34 | 0.12 | −0.51 |
| Random 8 | 0.57 | 0.32 | −0.34 | Random 19 | 0.35 | 0.13 | −0.48 |
| Random 9 | 0.33 | 0.11 | −0.73 | Random 20 | 0.39 | 0.15 | −0.63 |
| Random 10 | 0.23 | 0.05 | −0.65 |
Table S2.
Physicochemical properties and drug-likeness of dataset compounds.
| No | Physicochemical properties | Druglikeness | |||||||||
|---|---|---|---|---|---|---|---|---|---|---|---|
| MW | Log P | HBA | HBD | TPSA | Lipinski | Ghose | Veber | Egan | Muegge | Bioavailability Score | |
| 8b | 306.28 | 4.61 | 5 | 0 | 26.30 | Yes 0 violation |
No 1 violation: WLOGP>5.6 |
Yes | Yes | Yes | 0.55 |
| 9a | 238.28 | 3.59 | 2 | 0 | 26.30 | Yes 0 violation |
yes | Yes | Yes | Yes | 0.55 |
| 9b | 306.28 | 4.61 | 5 | 0 | 26.30 | Yes 0 violation |
No 1 violation: WLOGP>5.6 |
Yes | Yes | Yes | 0.55 |
| 10a | 238.28 | 3.59 | 2 | 0 | 26.30 | Yes 0 violation |
yes | Yes | Yes | Yes | 0.55 |
| 10b | 306.28 | 4.61 | 2 | 0 | 26.30 | Yes 0 violation |
Yes | Yes | Yes | Yes | 0.55 |
| 10c | 306.28 | 4.61 | 5 | 0 | 26.30 | Yes 0 violation |
No 1 violation: WLOGP>5.6 |
Yes | Yes | Yes | 0.55 |
| 10d | 306.28 | 4.61 | 5 | 0 | 26.30 | Yes 0 violation |
No 1 violation: WLOGP>5.6 |
Yes | Yes | Yes | 0.55 |
| 10e | 256.27 | 3.73 | 3 | 0 | 26.30 | Yes 0 violation |
yes | Yes | Yes | Yes | 0.55 |
| 10f | 272.73 | 4.24 | 2 | 0 | 26.30 | Yes 0 violation |
yes | Yes | Yes | Yes | 0.55 |
| 10g | 268.31 | 3.59 | 3 | 0 | 35.53 | Yes 0 violation |
yes | Yes | Yes | Yes | 0.55 |
| 10h | 268.31 | 3.59 | 3 | 0 | 35.53 | Yes 0 violation |
yes | Yes | Yes | Yes | 0.55 |
| 11a | 224.25 | 3.28 | 2 | 1 | 37.30 | Yes 0 violation |
yes | Yes | Yes | Yes | 0.55 |
| 11b | 292.25 | 4.30 | 5 | 1 | 37.30 | Yes 0 violation |
yes | Yes | Yes | Yes | 0.55 |
| 11g | 254.28 | 3.29 | 3 | 1 | 46.33 | Yes 0 violation |
yes | Yes | Yes | Yes | 0.55 |
| 12b | 257.71 | 3.99 | 4 | 1 | 29.10 | Yes 0 violation |
yes | Yes | Yes | Yes | 0.55 |
| 15a | 307.27 | 4.06 | 5 | 2 | 49.33 | Yes 0 violation |
yes | Yes | Yes | Yes | 0.55 |
| 15b | 273.71 | 3.69 | 2 | 2 | 49.33 | Yes 0 violation |
yes | Yes | Yes | Yes | 0.55 |
| 16a | 309.26 | 4.49 | 5 | 1 | 29.10 | Yes 0 violation |
No 1 violation: WLOGP>5.6 |
Yes | Yes | Yes | 0.55 |
| 16b | 309.26 | 4.49 | 5 | 1 | 29.10 | Yes 0 violation |
No 1 violation: WLOGP>5.6 |
Yes | Yes | Yes | 0.55 |
| 16c | 309.26 | 4.49 | 5 | 1 | 29.10 | Yes 0 violation |
No 1 violation: WLOGP>5.6 |
Yes | Yes | Yes | 0.55 |
| 17a | 309.26 | 4.49 | 5 | 1 | 29.10 | Yes 0 violation |
No 1 violation: WLOGP>5.6 |
Yes | Yes | Yes | 0.55 |
| 18a | 309.26 | 4.49 | 5 | 1 | 29.10 | Yes 0 violation |
No 1 violation: WLOGP>5.6 |
Yes | Yes | Yes | 0.55 |
| 19a | 224.25 | 3.30 | 2 | 0 | 26.30 | Yes 0 violation |
yes | Yes | Yes | Yes | 0.55 |
| 20a | 254.28 | 3.31 | 3 | 0 | 35.53 | Yes 0 violation |
yes | Yes | Yes | Yes | 0.55 |
| 20b | 288.73 | 3.96 | 3 | 0 | 35.53 | Yes 0 violation |
yes | Yes | Yes | Yes | 0.55 |
LogP = octanol–water partition coefficient, MW = molecular weight, HBA = number of hydrogen bond acceptor, TPSA = topological polar surface area, HBD = number of hydrogen bond donor.
Table S3.
ADMET prediction of all the compounds in the dataset.
| Compounds | Absorption | Distribution | Metabolism | Excretion | Toxicity | ||||||||||
|---|---|---|---|---|---|---|---|---|---|---|---|---|---|---|---|
| Water solubility | Caco2 permeability | Intestinal absorption human (HIA) | Blood brain barrier permeability | CYP | Total clearance | AMES toxicity | hepatoxicity | Max. tolerated dose (human) | |||||||
| 2D6 | 3A4 | 1A2 | 2C19 | 2C9 | 2D6 | 3A4 | |||||||||
| Substrate | Inhibitor | ||||||||||||||
| Numeric (log mol/L) | Numeric (log Papp in 10−6 cm/s) | Numeric (% absorbed) | Numeric (log BB) | Categorical (Yes/No) | Numeric (log ml/min/kg) | Categorical (Yes/No) | Categorical (Yes/No) | Numeric (log mg/kg/day) | |||||||
| 8b | −5.905 | 1.46 | 93.70 | 0.33 | No | Yes | Yes | Yes | Yes | No | No | −0.003 | No | No | 0.83 |
| 9a | −4.66 | 1.45 | 97.68 | 0.39 | No | Yes | Yes | Yes | Yes | No | No | 0.23 | No | No | 1.05 |
| 9b | −6.04 | 1.48 | 94.41 | 0.35 | No | Yes | Yes | Yes | Yes | No | Yes | 0.044 | No | No | 0.91 |
| 10a | −4.73 | 1.07 | 98.12 | 0.38 | No | Yes | Yes | Yes | Yes | No | No | 0.24 | No | No | 1.02 |
| 10b | −6.02 | 1.11 | 94.85 | 0.33 | No | Yes | Yes | Yes | Yes | No | Yes | 0.055 | No | No | 0.88 |
| 10c | −6.02 | 1.11 | 94.85 | 0.34 | No | Yes | Yes | Yes | Yes | No | Yes | 0.045 | No | No | 0.88 |
| 10d | −6.03 | 1.11 | 94.85 | 0.34 | No | Yes | Yes | Yes | Yes | No | Yes | 0.035 | No | No | 0.88 |
| 10e | −4.97 | 1.31 | 97.35 | 0.35 | No | Yes | Yes | Yes | Yes | No | No | 0.19 | Yes | No | 1.007 |
| 10f | −5.41 | 1.08 | 96.46 | 0.32 | No | Yes | Yes | Yes | Yes | No | No | −0.007 | No | No | 0.99 |
| 10g | −4.93 | 1.29 | 98.10 | −0.13 | No | Yes | Yes | Yes | Yes | No | No | 0.33 | Yes | No | 0.97 |
| 10h | −4.97 | 1.10 | 99.00 | −0.19 | No | Yes | Yes | Yes | Yes | No | No | 0.26 | No | No | 1.05 |
| 11a | −3.65 | 1.63 | 94.05 | 0.16 | No | Yes | No | Yes | No | No | No | 0.15 | No | No | 0.63 |
| 11b | −4.95 | 1.66 | 90.77 | 0.18 | No | Yes | Yes | Yes | Yes | No | No | −0.04 | No | No | 0.5 |
| 11g | −3.73 | 1.35 | 93.93 | −0.08 | No | Yes | Yes | Yes | No | No | No | 0.23 | No | No | 0.56 |
| 12b | −5.23 | 1.51 | 91.54 | 0.27 | No | Yes | Yes | Yes | Yes | No | No | 0.045 | No | Yes | 0.69 |
| 15a | −4.71 | 1.39 | 89.13 | −0.08 | No | Yes | Yes | Yes | Yes | No | Yes | 0.074 | No | Yes | 0.26 |
| 15b | −.3.99 | 1.34 | 90.25 | −0.052 | No | Yes | Yes | Yes | Yes | No | No | −0.081 | No | No | 0.35 |
| 16a | −5.69 | 1.48 | 91.57 | 0.27 | No | Yes | Yes | Yes | Yes | No | Yes | −0.071 | No | Yes | 0.74 |
| 16b | −5.64 | 1.48 | 90.91 | 0.26 | No | Yes | Yes | Yes | Yes | No | Yes | −0.08 | No | Yes | 0.74 |
| 16c | −5.64 | 1.46 | 90.90 | 0.26 | No | Yes | Yes | Yes | Yes | No | Yes | −0.09 | No | Yes | 0.76 |
| 17a | −5.44 | 1.62 | 90.00 | 0.28 | No | Yes | Yes | Yes | Yes | No | Yes | −0.15 | No | Yes | 0.73 |
| 18a | −5.51 | 1.24 | 90.72 | 0.29 | No | Yes | Yes | Yes | Yes | No | Yes | −0.085 | No | Yes | 0.80 |
| 19a | −4.21 | 1.74 | 96.38 | 0.28 | No | Yes | Yes | Yes | No | No | No | 0.77 | No | No | 1.18 |
| 20a | −4.63 | 1.50 | 97.61 | 0.11 | No | Yes | Yes | Yes | Yes | No | No | 0.75 | No | No | 1.23 |
| 20b | −5.28 | 1.51 | 95.95 | 0.10 | No | Yes | Yes | Yes | Yes | No | No | −0.04 | No | No | 1.19 |
Table S4.
Binding affinity of the studied compounds
| No | pIC50 | Binding affinity (Kcal/mol) | No | pIC50 | Binding affinity (Kcal/mol) |
|---|---|---|---|---|---|
| 8b | 6.5968 | −9.4 | 11g | 6.2048 | −9.4 |
| 9a | 6.1007 | −9.5 | 12b | 5.5497 | −8.5 |
| 9b | 5.6740 | −9.5 | 15a | 5.2232 | −7.9 |
| 10a | 6.3269 | −9.2 | 15b | 5.2831 | −8.1 |
| 10b | 7.7958 | −9.9 | 16a | 5.4723 | −8.5 |
| 10c | 6.8386 | −9.6 | 16b | 5.3106 | −8.3 |
| 10d | 6.70114 | −9.3 | 16c | 6.5482 | −9.4 |
| 10e | 7.2518 | −9.7 | 17a | 6.2365 | −9.1 |
| 10f | 7.1611 | −9.6 | 18a | 6.6516 | −9.2 |
| 10g | 6.3777 | −9.3 | 19a | 5.2306 | −8.3 |
| 10h | 5.8551 | −9.3 | 20a | 5.5867 | −8.7 |
| 11a | 6.7399 | −9.4 | 20b | 6.0282 | −9.2 |
| 11b | 7.2441 | −9.5 |