

Summary
Battery lifespan estimation is essential for effective battery management systems, aiding users and manufacturers in strategic planning. However, accurately estimating battery capacity is complex, owing to diverse capacity fading phenomena tied to factors such as temperature, charge-discharge rate, and rest period duration. In this work, we present an innovative approach that integrates real-world driving behaviors into cyclic testing. Unlike conventional methods that lack rest periods and involve fixed charge-discharge rates, our approach involves 1000 unique test cycles tailored to specific objectives and applications, capturing the nuanced effects of temperature, charge-discharge rate, and rest duration on capacity fading. This yields comprehensive insights into cell-level battery degradation, unveiling growth patterns of the solid electrolyte interface (SEI) layer and lithium plating, influenced by cyclic test parameters. The results yield critical empirical relations for evaluating capacity fading under specific testing conditions.
Subject areas: Applied sciences, Energy Modeling
Graphical abstract
Highlights
-
•
1000 unique cycles that mimic real-world conditions: Varied rests, C-rates, temperatures
-
•
Cell-level degradation study: During charge, discharge, rest after charge and discharge
-
•
Empirical model to estimate capacity fade: SEI layer growth, lithium plating contribution
Applied sciences; Energy Modeling
Introduction
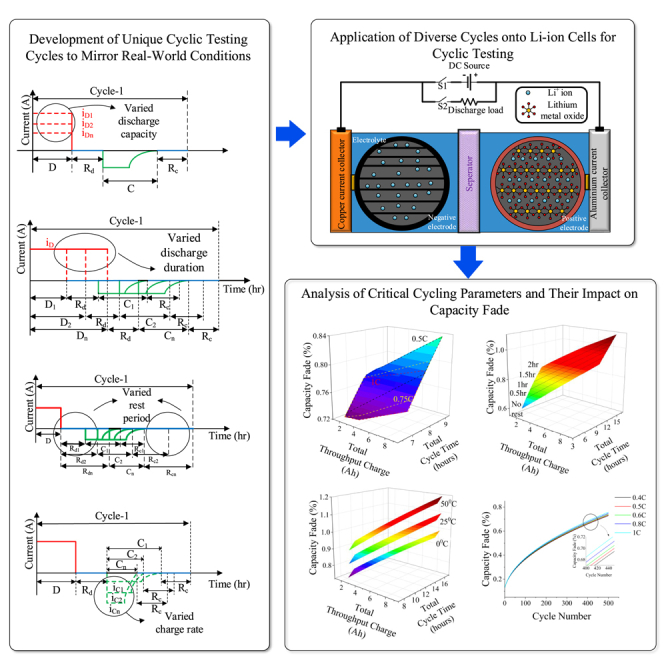
Estimating electric vehicle (EV) battery lifespan has long been a complex and challenging task for multiple stakeholders. Consumers, automobile original equipment manufacturers (OEMs), certification agencies, and battery management system (BMS) developers all require accurate algorithms, methods, and techniques for precise battery lifespan estimation. This information is essential for a variety of reasons. On the one hand, it enables buyers to make informed decisions by providing a cost-benefit breakdown of the EV they are considering. Additionally, certification agencies and insurance firms rely on accurate battery lifespan estimates to protect consumers from false warranty claims made by manufacturers. Furthermore, as batteries age, their states and parameters change, making it essential for an effective BMS to detect capacity fading. This allows for accurate State of Charge (SOC) and State of Health (SOH) estimation, which is crucial for maintaining the performance and safety of the EV.1,2 Automobile original equipment manufacturers (OEMs) rely on cyclic tests, which involve cycling the battery at different operating temperatures and discharge rates, as shown in Figure 1A, to determine capacity fading and lifespan estimation.3,4 However, these tests are typically done in a continuous manner, which can lead to an optimistic lifespan estimate for the battery packs. In reality, the usage patterns of EV batteries are closer to the cycle shown in Figure 1B, which involves intermittent rest periods. As a result, the real-world capacity fading is usually greater than that estimated using the cycle shown in Figure 1A. The absence of rest periods in testing cycles alters the reaction kinetics rate within the cell. It prevents the cell from reaching an equilibrium state concerning temperature, charge, and concentration.5,6 These accelerated reaction kinetics lead to higher degradation rates, causing cyclic aging.
Figure 1.

Battery testing cycles depicting the different phases involved in it viz. Discharge period (D), Charge period (C), Rest period after discharging (Rd), Rest period after charging (Rc) along with the level of degradation phenomenon viz. SEI layer growth (S) and Lithium plating (P) in it
(A) Standard test cycle.
(B–F) (B) Proposed test cycle; Individual test cycles illustrating the variation in the (C) Discharge capacity, (D) Discharge duration, (E) Rest period, (F) Charge rate. Combining these four variations, an exhaustive set of experimental sets is designed.
Literature review
The accurate measurement and prediction of LIB performance and degradation are crucial for optimizing battery design, management, and operation. Therefore, extensive research has been conducted to investigate the testing methods and models for estimating the capacity fading and lifetime of LIBs. Several tests have been proposed in the literature to determine capacity fading. For example, tests based on electrochemical models,7,8,9 equivalent circuit models,10,11,12,13,14 performance-based models,15,16,17,18 an analytical model with empirical data fitting,19,20,21,22,23 and statistical methods24,25,26,27 have been proposed. For example, Christensen. J and Newman J.28,29,30 developed a numerical model to investigate the impact of stress caused during the intercalation of lithium in LMO batteries. The capacity fading caused by a byproduct of side reactions, the Solid Electrolyte Interphase (SEI) layer growth, is examined with a solvent diffusion model by Ploehn et al.31 Safari et al.32,33 developed an electrochemical model to study the impact of aging on capacity fading and impedance rise.34 and35 proposed advanced data-driven methods for predicting the remaining useful life (RUL) and whole life cycle state of charge (SOC) of lithium-ion batteries. The introduced techniques, namely improved feed forward-long short-term memory (FF-LSTM) and improved anti-noise adaptive long short-term memory (ANA-LSTM), demonstrate remarkable accuracy in predicting whole-life-cycle SOC and RUL of lithium-ion batteries. However, an important limitation in these approaches is highlighted, specifically concerning the training dataset used. The data from whole life cycle aging tests predominantly relies on capacity tests at different discharge C-rates and accounts for temperature variations. Still, it overlooks the impact of varying rest periods and discharge durations. Additionally, the constant charge rate used throughout the entire life cycle aging tests fails to capture the influence of charge rates on battery degradation. By presenting this comparison constructively, the current work aims to shed light on the potential for further advancements in estimating capacity fading techniques by considering a more comprehensive set of battery operating conditions. Another approach is using equivalent circuit models, which provide valuable insight into the battery aging phenomenon, but they require extensive data gathered through time-consuming tests for parameter identification. Additionally, these tests focus on understanding the fading phenomenon and are typically time-consuming, laborious, and suited for testing an individual cell. Furthermore, scaling up these tests for testing a battery pack is challenging compared to cyclic tests. Therefore, cyclic tests are still considered a viable solution for testing EV battery packs. Still, there is a need to use a cycle that is more akin to real-world conditions to improve the accuracy of lifespan estimates.
One of the critical parts of the actual driving behavior is the rest period, which could be related to any time for which the vehicle is stationary. The rest period in the testing cycle plays a critical role in the battery performance. Tables 1 and 2 presents a detailed review of current literature that has conducted cyclic testing of lithium-ion batteries and analyzed capacity fade. It offers a detailed overview of the parameters studied and limitations identified in performing capacity fade analysis. The literature has work explicitly reported, focusing on three main points: (1) the limitations of current cycling testing methods and the importance of considering rest periods in battery testing; (2) the effect of relaxation periods on lithium ion performance and the need to consider the dominant factor of calendar aging during rest periods; and (3) the time dependency of degradation and the rate of solid electrolyte interface (SEI) layer growth and lithium plating during different phases of cycling.
Table 1.
Literature review of capacity fade studies in batteries: factors considered in previous research
| Reference | CR | DR | TCE | TCT | ATC | ATD |
|---|---|---|---|---|---|---|
| Ning et al.3 | No | Yes | No | No | No | No |
| Carnovale et al.36 | No | No | No | No | Yes | No |
| Zhu et al.37 | No | Yes | No | Yes | No | No |
| Tanim et al.38 | Yes | No | Yes | Yes | Yes | No |
| Raj et al.39 | Yes | No | No | No | No | No |
| Mussa et al.40 | Yes | No | No | Yes | No | No |
| Watanabe et al.41 | No | No | No | No | Yes | No |
| Reichert et al.42 | Yes | Yes | No | No | Yes | No |
| Rashid et al.43 | No | No | No | Yes | No | No |
| Liu et al.44 | Yes | Yes | No | Yes | No | No |
| Zhu et al.45 | Yes | Yes | No | No | Yes | No |
| Severson et al.46 | Yes | No | No | No | No | No |
| Leng et al.47 | No | No | No | No | Yes | Partially |
| Keil et al.48 | Yes | Yes | No | No | No | No |
| Yang et al.49 | Yes | Yes | No | No | Yes | No |
Impact of various factors viz. Charge rate (CR), Discharge rate (DR), Total charge exchanged (TCE), Total cycle time (TCT), Ambient Temperature on whole cycling (ATC), Ambient temperature on individual degradation phenomenon (ATD), on capacity fade.
Table 2.
Literature review of capacity fade studies in batteries
| Reference | Rest period within cycling | Calendar aging (SEI Layer growth) | Lithium plating/lithium stripping phenomenon | Individual phases contribution to capacity fade (Memory Effect) | Empirical model for capacity fade estimation |
|---|---|---|---|---|---|
| Ning et al.3 | No | No | No/No | No | No |
| Carnovale et al.36 | Yes | No | No/No | No | No |
| Zhu et al.37 | Yes | Yes | No/No | No | No |
| Tanim et al.38 | Yes | Yes | No/No | No | No |
| Raj et al.39 | Yes | Yes | Yes/No | No | No |
| Mussa et al.40 | No | Yes | Yes/No | No | No |
| Watanabe et al.41 | No | No | No | No | No |
| Reichert et al.42 | Yes | No | No | No | No |
| Rashid et al.43 | Yes | Yes | No | No | No |
| Liu et al.44 | No | No | Yes/No | No | No |
| Zhu et al.45 | No | No | No | No | No |
| Severson et al.46 | Yes | No | No | No | No |
| Leng et al.47 | Yes | No | No | No | No |
| Keil et al.48 | Yes | Yes | Yes/Yes | No | No |
| Yang et al.49 | Yes | No | Yes/Yes | No | No |
Scope of various parameters investigated on capacity fade.
The first point addresses the inadequacy of current cycling testing methods in capturing the impact of rest periods on battery degradation.3,36,37,38,39,40 Although some studies have included rest periods in the testing cycle,41 they often overlook the calendar aging phenomenon that causes significant SEI layer growth. The capacity loss due to SEI layer growth is primarily time-dependent, which can be dominant during rest periods. Therefore, it is crucial to consider both the rest period and the calendar aging effect in battery testing.
The second point focuses on the effect of relaxation periods on battery performance. Some studies have shown that more extended relaxation periods can improve battery capacity retention and reduce degradation.42,43 However, these studies did not consider the impact of calendar aging during rest periods, which can significantly affect the battery’s lifetime. Therefore, it is essential to investigate the interaction between relaxation periods, calendar aging, and battery performance to develop more accurate models for estimating battery lifetime.
The third point addresses the time dependency of degradation and the rate of SEI layer growth and Lithium plating during different cycling phases. Although some studies have investigated the time-dependent behavior of battery degradation,44 they often overlook the detailed mechanism of SEI layer growth and Lithium plating during different cycling phases. Therefore, it is necessary to investigate the rate of SEI layer growth and Lithium plating during different stages of cycling to understand the degradation mechanism of LIBs better. By providing a comprehensive literature review on these three points, this research article contributes unique insights into understanding lithium-ion cell degradation and performance. The review emphasizes the need for more comprehensive testing methods that consider the impact of rest periods and calendar aging and identifies areas where further research is needed to improve the reliability and accuracy of battery testing.
Advanced cyclic testing methods
One of the crucial degradation phenomena, calendar aging, occurs during rest periods.50 Although a rest period limits cyclic aging to some extent by slowing down the reaction kinetics, capacity fading caused by calendar aging is predominant during this period. Furthermore, capacity fading tests using the cycle shown in Figure 1A indicate that the higher the charge and discharge rates, the higher the capacity fading.3,6 Despite this, if the test cycle shown in Figure 1B is used, capacity fading is not solely a function of charge and discharge rates, but it also depends on the duration of rest periods within a cycle. This subsection presents a unique attempt that combines varying rest periods and diverse charge-discharge rates within a single cycle, aimed at investigating the intricate interplay between calendar and cyclic aging on the performance of lithium-ion batteries. This unique methodology closely emulates real-world driving behavior, where the durations of rest periods, charging, and discharging exhibit dynamic variations. This highlights the need for a more realistic testing cycle incorporating rest periods to accurately estimate EV batteries’ lifespan and understand the underlying degradation mechanisms.
All the simulation experiments are performed using the cycle shown in Figure 1B. The experiments are designed by varying the parameters related to each phase of the cycle: the magnitude of the discharge current, discharge duration, rest period and the charge current, which are shown individually in Figures 1C–1F. In Figure 1C, the amount of charge extracted from a battery (iD1, iD2 … iDn) for a fixed duration (D) is varied by keeping the charge rate (iC and C) and rest period duration (Rd and Rc) constant. Similarly, in Figure 1D, for a fixed discharge Ampere-hour (Ah) (iD), the discharge duration (D1, D2 … Dn) is varied by keeping charge rate (iC) and rest period duration (Rd and Rc) constant. In Figure 1D, by keeping the charge rate (iC) and discharge rate (iD and D) constant, the rest period duration (Rd1, Rd2 … Rdn and Rc1, Rc2 … Rcn) is varied. However, in Figures 1D and 1E, the duration of the charge period (C) depends on the battery’s internal behavior as it follows the Constant Current Constant Voltage (CCCV) charging protocol. In Figure 1F, the charge rate (iC1, iC2, … iCn and C1, C2 … Cn) is varied by keeping discharge rate (iD and D) and rest period duration (Rd and Rc) constant. The design of experiments is done with the intent to investigate the dependency of capacity fading on each of these four parameters and ambient temperature. A detailed methodology for the selection of parameters and establishment of specific testing conditions is provided in the “design of experiments” subsection of the “STAR methods” section.
This research endeavors to present test cycles more reflective of the typical usage scenarios that an EV would encounter. Additionally, an empirical model based on qualitative and quantitative analysis is developed to estimate capacity fading accurately. This model serves as a valuable tool for understanding the underlying degradation mechanisms and estimating EV batteries’ lifespan more realistically. A comprehensive analysis of the degradation of lithium-ion batteries is presented in this work, highlighting the unique insights of the work compared to the existing literature. The proposed approach derives the impact of actual EV driving behavior on modeling a test cycle, which is overlooked in current literature. A total of 1000 unique test cycles relevant to real-world driving conditions were identified, and simulations were performed on these test cycles at three different ambient temperatures. The analysis is used to comprehensively and accurately represent battery performance.
The focus of this study is to understand battery degradation due to the impact of individual phases of a test cycle, viz., charge period, rest period after discharge, discharge period, and rest period after the charge. The results presented reveal that the extent of degradation varies significantly between different phases of the cycle., A detailed analysis of the factors contributing to the degradation in each phase is presented. The results helped to bring unique insights providing a more accurate understanding of battery degradation, which was not previously discussed in the literature.
Finally, based on the analysis, a robust empirical model is presented that precisely estimates battery capacity fade based on the testing objectives. The proposed model considers the effect of temperature, SEI layer growth, lithium plating, cycle time, and the total charge that went in and came out of the battery. Overall, a unique approach to battery degradation analysis, which provides unique insights into the modeling of test cycles based on driving behavior, the impact of individual phases of a cycle, and a robust empirical model for estimating capacity fade, is presented in this study.
Results
The battery pack used in an EV comprises multiple cells in which electrical energy is stored as chemical energy. The schematic of a cell is shown in Figure 2A. The essential components of an electrochemical lithium-ion cell constitute two electrodes - anode and cathode, electrolyte, porous separator, and two current collectors for electrical contact - aluminum (for the cathode) and copper (for the anode) current collectors. The capacity fade testing cycle of Figure 1B is similar to the scenario that a typical EV battery pack experiences. From the cell’s perspective, the three phases in the cycle, viz., charge, discharge, and rest, are shown in Figures 2B–2D, respectively. Along with the primary electrochemical reactions, unwanted side reactions also occur in a cell, which reduces the amount of cyclable lithium concentration over time.50 These side reactions are the primary reasons for cell degradation. In the discharge and charge phases, capacity fading due to lithium plating dominates (Figure 1B), whereas, in the rest period, the capacity fading is predominantly due to SEI layer formation (Figure 1B).
Figure 2.

Electrochemical Processes and Degradation Phenomena in Lithium-ion Cell
(A) Schematic of an electrochemical lithium-ion cell; Illustration of different phases of the battery operation viz.
(B) Charging phase: lithium exits the positive electrode surface by giving up the electron (which is forced through the external circuit to the negative electrode) and becoming Li+ ion in the electrolyte.
(C) Discharging phase: lithium diffuses away from the negative electrode surface by giving up an electron (which travels through an external circuit to the positive electrode and becomes a Li+ ion in the electrolyte, and (D) Rest phase: Neither electronic nor ionic movement takes place within the cell; (E) Schematic of cell degradation phenomenon at anode showing; SEI layer formation, which is predominant during initial cycles and its thickness increases as the cell ages, and lithium plating, where few Li+ ions, instead of intercalating into the anode, form a metallic reversible lithium layer and few ions undergo deposition reaction to form dead lithium causing irreversible loss of lithium.
(F) Different experiments were performed, including the variables considered in this work.
A schematic of these two phenomena at the cell level is shown in Figure 2B.51 It is rational that each duration - discharge, charge, and rest periods individually impact the cell degradation rates over a cycle. Further, since this work proposes an advanced test cycle that considers the rest period, it is crucial to understand the impact of each duration on the overall cell degradation in a test cycle. Hence detailed simulations are performed at different charge and discharge rates, and the duration of rest periods is shown in Figures 1C–1F. Since all the electrochemical parameters of LG-M50 21700 were available in the literature,52 simulation experiments were performed on this cell. Table S4 lists all the electrochemical parameters of this cell. It must, however, be noted that the procedure and the results apply to all lithium chemistries and are not limited to this specific cell chemistry. The details of assumptions, the design of experiments, and the empirical modeling are presented in the “STAR methods” section. This section is divided into three subsections. Each subsection focuses on understanding the impact of the capacity fade with changes in temperature, charge-discharge rates, and duration of rest periods in the proposed test cycle, respectively.
Capacity fade with temperature
The temperature significantly impacts battery degradation, as seen in Figure 3A. The higher temperatures accelerate the degradation process, while moderate temperatures tend to be more favorable for mitigated degradation.47 Under the same ambient temperature, the proposed cycle resulted in more fading, which is expected due to the rest period. However, a deeper insight into the proposed cyclic method depicts the capacity fading rate caused by individual phases involved in a cycle while the ambient temperature varies.
Figure 3.

Capacity fading is expressed as Loss of Lithium Inventory (LLI) (%) after 500 cycles with altering ambient temperatures @0.5C charge rate, 0.5C discharge rate, and a rest period of 2 h
(A–D) (A) Overall capacity fading under different ambient temperatures, (B) Capacity fading due to SEI layer growth within individual phases of a cycle under different ambient temperatures, (C) Capacity fading due to lithium plating within individual phases of a cycle under different ambient temperatures, (D) Total capacity fading within individual phases of a cycle under different ambient temperatures.
Figures 3B–3D show the capacity fading within each phase under different ambient temperatures, 0°C and 25°C. Figures 3B and 3C infer the dependency of SEI layer growth and lithium plating on temperature. Although overall fading is higher at higher temperatures (Figure 3A),47 it is interesting to notice from Figures 3C and 3D that fading within individual phases is less at higher temperatures. The negative fading represents the reversible plating/stripping phenomenon. It can be seen from Figures 3C and 3D that lithium plating happens during the charging phase. During lithium plating, the lithium ions are deposited onto the surface of the anode in the form of a thin layer of lithium metal. Similarly, reversible plating or stripping happens during the discharge phase and the rest period immediately after the charging phase.49
Figures 4A and 5C shows the impact of ambient temperature on capacity fading. During cycling, the total capacity fading in a cell is the sum of fading caused by SEI layer growth and lithium plating, as shown in Figure 4A.51,53,54 To isolate the effect of temperature on capacity fading, 150 unique experiment cycles out of the total 3000 cycles conducted in the study are selected (Figure 2F). These experiments were performed with a constant charge rate of 0.1 C and a constant rest period of 2 h, which allowed us to eliminate the influence of other factors such as charge rate and rest period on the capacity fading. These test conditions are repeated for chosen three temperatures. It can be observed that the capacity fading increases with an increase in temperature. Under the same throughput charge and cycle time, a higher ambient temperature resulted in a higher capacity fading.
Figure 4.

Capacity fading is expressed as LLI (%) with altering temperature
(A–F) (A) Total fading under different ambient temperatures, (B) Fading due to SEI layer growth under different ambient temperatures, (C) Fading due to lithium plating under different ambient temperatures, (D) Individual fading at 0°C, (E) Individual fading at 25°C, (F) Individual fading at 50°C. (See also Figures S1 and S2).
Figure 5.

Capacity fading is expressed as LLI (%) vs. cycle number with altering temperature
(A–C) (A) LLI (%) due to SEI layer growth vs. cycle number at different ambient temperatures, (B) LLI (%) due to lithium plating vs. cycle number at different ambient temperatures, (C) Combined LLI (%) vs. cycle number at different ambient temperatures.
A closer look at Figures 4B and 4C reveals that the fading due to SEI layer growth and lithium plating increases with an increase in temperature.55 Figures 4D–4F show the fading due to SEI layer growth and lithium plating at ambient temperatures of 0°C, 25°C, and 50°C, respectively. Additional results on the capacity fading phenomenon under three different temperatures at a 0.5C charging rate and 2 h rest period are described in the supplementary section (refer to Figures S1 and S2). Figures 5A and 5B show the rate of increase in the SEI layer growth and the rate of decrease in the lithium plating, respectively, at different temperatures as the cycle progresses. A non-linear yet continuous growth in the SEI layer is observed for 500 cycles of the experiment. However, the loss of lithium-to-lithium plating after every cycle will be less than the previous cycle as the availability of area on the negative electrode for plating reduces with time as the SEI layer grows persistently with each cycle.56,57,58 Accelerated fading happens at elevated temperatures, predominantly caused by increased SEI layer growth and lithium plating. The combined fading thus increases with temperature, as shown in Figure 5C.
Capacity fade with change in charge-discharge rate
Contrary to the belief that fading accelerates at faster charge conditions, Figures 6A and 6C show that slower charging results in higher fading.59,60 Figures 6A–6C show the impact of charge rate on capacity fading. To specifically investigate the impact of charge rate on capacity fading, 200 unique experiment cycles out of the total 3000 cycles conducted in this study are chosen (Figure 2F). This selection was made to eliminate the influence of other factors such as rest period and temperature on the capacity fading. By keeping the rest period at 2 h and temperature at 25°C constant across all 200 experiment cycles, we could isolate the charge rate’s effect on capacity fading and more accurately analyze this specific factor. This allows us to draw a clear conclusion about the impact of charge rate on capacity fading and to compare the results with other studies.
Figure 6.

Capacity fading is expressed as Loss of Lithium Inventory (LLI) (%) with altering charge and discharge rates. Battery testing cycles are considered to analyze the impact of the rest period on lithium plating
(A–D) (A) Total fading at 0.1C charging rate, (B) Total fading under different charging rates viz. 0.5C, 0.75C, 1C. (C) Total LLI (%) under varied charge rates vs. cycle number, (D) Total LLI (%) under varied discharge rates vs. cycle number. (See also Figures S3–S5).
It can be observed that the capacity fading is more at lower charging rates. Under the same throughput charge and cycle time, a lower charging C rate (here 0.1C) resulted in higher capacity fading. The accelerated capacity fading at a slower charging rate explains the role of the critical degradation phenomenon of calendar aging and its dominance over cyclic aging during long-term cycling conditions. Figures S3–S5 from the Supplementary material describe the tests which are repeated for the exact charging rates under three other test conditions: @50°C and 2 h rest period; @25°C and no rest period; @50°C and no rest period.
Moreover, Figure 6C shows that the degradation rates for moderate charge rates such as 0.5C, 0.75C, and 1C are similar irrespective of discharge C-rate, temperature, and rest periods. This implies that the degradation rate is higher at a slower charging rate (0.1C) and lower at moderate charge rates.59,60 Furthermore, the chemical degradation is dominant at slower charging rates, resulting in increased SEI layer thickness at a 0.1C charge rate. Subsequently, the impact of discharge C-rate can be seen in Figure 6D. For a fixed discharge cycle duration, the fading correspondingly increases as the amount of charge taken out from the cell increases. Faster rates for a fixed discharge duration increase the capacity fading as the loss of lithium to SEI layer formation is more at higher discharge rates.
Capacity fade with change in the duration of rest period
Figure 7A shows the impact of the rest period on capacity fading. To investigate the influence of rest period on capacity fading, 250 unique experiment cycles from the total 3000 cycles conducted in our study are selected (Figure 2F). By controlling the charge rate at 0.1C and temperature at 25°C across all 250 experiment cycles, the impact of other factors on capacity fading was eliminated. This allowed us to focus solely on the effect of rest periods and, more precisely, analyze their impact on capacity fading.
Figure 7.

Capacity fading is expressed as LLI (%) with altering rest periods @25°C ambient temperature
(A–E) (A) Total fading at 0.1C charge rate under different rest periods, (B) Total fading at 0.5C charge rate under different rest periods, (C) Total fading at 0.75C charge rate under different rest periods, (D) Total fading at 1C charge rate under different rest periods, (E) Total LLI (%) vs. cycle number at 0.5C charge rate under different rest periods. (See also Figure S6).
Under these test conditions, the experiments were performed for chosen four rest periods, 0.5 h–2 h on the scale of 0.5 h after each phase of charging and discharging. The results are compared with the standard cyclic test methods in the literature, where the rest period is not considered.3,4 It can be observed that the capacity fading increases significantly with an increase in the rest period. Under the same throughput charge and cycle time, the longer the rest period, the more the capacity fades.
Figures 7B–7D illustrate the capacity fading for different charge rates: 0.5C, 0.75C, and 1C, respectively. As the charge rate increases, the overall cycle time decreases, reducing the lithium lost in that particular cycle. The ambient temperature is kept constant at 25°C during all these experiments. Figure S6 in the supplementary section describes the results of the experiments performed under 50°C ambient temperature.
Figure 7E illustrates the impact of the rest period on capacity fading within an experiment of 500 cycles each. The increased rest periods account for longer cycle durations and calendar aging. Irrespective of charge and discharge rates, SEI layer formation is dominated by calendar aging. The capacity fading due to the substantial growth of the SEI layer on the negative electrode is primarily dependent on time, and it is similar at different charging rates. However, it is interesting to realize the dependency of lithium plating on the rest periods provided within a cycle. The stripping of deposited lithium metal on the anode happens during the rest period immediately after the charging phase and during the discharging phase.49 To understand the impact of individual relaxation phases on lithium plating after the discharge and charge process, the cell is subjected to four different cycles, as shown in Figures 8A–8D, developed by various combinations of discharge, charge, and rest phases. From Table 3, it is clear that the lithium plating associated with the cycles having a rest period after the charging process, i.e., (D-Rd-C-Rc) and (D-C-Rd), is lesser than the other two cycles, i.e., (D-Rd-C) and D-C. This implies the phenomenon of lithium stripping, where the plated lithium tries to re-intercalate into the anode.
Figure 8.

Battery testing cycles considered to analyze the impact of rest period on lithium plating
(A–D) (A) Proposed test cycle (D-Rd-C-Rc), (B) Proposed test cycle without rest period after charging (D-Rd-C), (C) Proposed test cycle without rest period after discharging (D-C-Rc), (D) Standard test cycle (D and C).
Table 3.
Capacity fading is expressed as LLI (%) for individual degradation phenomenon for four different cycles @25°C ambient temperature, 0.5C charge rate, 0.5C discharge rate, and a rest period of 2 h wherever considered
| Degradation phenomenon | D-Rd-C-Rc | D-Rd-C | D-C-Rc | D-C |
|---|---|---|---|---|
| SEI layer growth | 0.62 | 0.51 | 0.51 | 0.38 |
| Lithium Plating | 0.1118 | 0.1235 | 0.1116 | 0.118 |
| Total | 0.73 | 0.64 | 0.63 | 0.50 |
Discussion
The discrepancy between the claimed battery life by manufacturers and the actual life observed by users is a significant issue in the EV industry. It is found that the resting period of an EV after charging or discharging the batteries has a significant role in the rate of capacity fading. Additionally, batteries are represented using passive energy-storing elements such as capacitors in equivalent circuit diagrams, which confirms the presence of memory of past operations, and which would impact the future response of the batteries. The memory effect is visible in our results based on the experiments designed. Our results have shown that a rest period after charging can mitigate fading through stripping, while a rest period after discharging contributes to fading through plating. This section will present a qualitative perspective of the results obtained with the proposed cyclic test method. The discussion will direct toward validating the results obtained from the previous section.
The results presented in previous section reveal that a higher capacity fading is estimated using the proposed cyclic test method compared to the standard cyclic test method. Figure 9D reveals that the SEI layer is primarily cycle-time dominant, while the relaxation period impacts lithium plating.44 As the rest periods increase, the total cycle time increases, giving more time for the SEI layer to form, resulting in more capacity fading. The rest period provided immediately after the charging phase will allow the plated lithium metal to re-intercalate into graphite (anode), eventually mitigating lithium plating.49 However, overall capacity fading, comprising fading due to both SEI layer growth and lithium plating, increases with temperature. A closer look at Figures 9B and 9C gives two critical insights: lower charge rates result in higher capacity fading for a fixed discharge period, discharge rate, and ambient temperature, while higher discharge rates result in higher capacity fading for a fixed charge rate, cycle duration, and ambient temperature. Both SEI layer growth and lithium plating rates are significantly accelerated at higher temperatures above 40°C.47,61 To extend the battery life by reducing the degradation rate, the operating temperature while charging and discharging must be maintained within a safe operating range. These critical insights can be used to accurately estimate capacity fading, considering the interplay between the battery degradation mechanisms.
Figure 9.

Overall capacity fading after 500 cycles is expressed as Loss of Lithium Inventory (LLI) (%) under different operating conditions
(A–E) (A) Varying temperature @ 0.5C discharge rate, 0.5C charge rate and 2 h rest period, b) Varying charge C-rate @ 0.5C discharge rate, 25°C ambient temperature and 2 h rest period, (C) Varying discharge C-rate @ 0.5C charge rate, 25°C ambient temperature and 2 h rest period, (D) Varying rest periods @ 0.5C discharge rate, 0.5C charge rate, 25°C ambient temperature, (E) Recommended testing cycle with drive cycle dependent discharge profile and charge rate, charge protocol dependent charging profile.
A study on the impact of critical parameters such as temperature, discharge C-rate, charge C-rate, and rest period on the individual degradation phenomenon of SEI layer growth and lithium plating is analyzed. The results are presented in Figures 9A–9D, which depict the capacity fading at the end of 500 cycles. Our findings indicate that although SEI layer growth is more significant at higher discharge C-rates (Figure 9C), the duration of the entire cycle has a more significant impact on the rate of SEI layer growth than the cycling conditions, such as rates of charge and discharge and temperature (Figure 9D). Hence, the formation of the SEI layer increases linearly over cycles, causing significant calendar aging.
In contrast, capacity fading due to lithium plating is independent of the charge and discharge rates, as shown in Figures 9B and 9C. The loss of lithium inventory to lithium plating decays exponentially over cycles. In the initial phase of degradation, the first few cycles, lithium ions have more scope to form a lithium metal layer as there is more surface area for lithium ions to react with the anode. However, as the number of cycles increases, the SEI layer becomes stable and less porous, limiting the plating of lithium metal.56,57,58 Additionally, the higher temperature raises the reaction kinetics and the electrolyte potential, accelerating the formation of lithium metal on the graphite surface by the Li+ ions from the electrolyte. As a result, with the increase in ambient temperature, the capacity fading due to lithium plating also increases (Figure 9A). Furthermore, the proposed work can be extended by simulating actual drive cycles for real-world driving scenarios, instead of a constant-current discharge period, to study their impact on capacity fading. These simulations can be run for different driving styles: mild, gentle, and aggressive. Furthermore, other charging protocols can be employed in place of the standard CCCV method used in this study (Figure 9E).
Empirical modeling
This study presents an empirical model for estimating capacity fading in lithium-ion batteries. The model is developed by fitting simulation results to mathematical functions and can be used to easily determine the capacity loss caused by the growth of the SEI (solid electrolyte interphase) layer and lithium plating. A non-linear least squares method is used from the experimental results to develop the empirical model. The loss of lithium inventory to SEI layer growth and lithium plating are individually to form the empirical model. These two degradation phenomena depend on the total charge throughput (Q), the total time duration of the cycle (T), and the cell ambient temperature (tamb). From the curve fitting, the coefficients are obtained, which can be used to determine the capacity fade mathematically for any discharge duration, discharge capacity, charge-discharge rates, and ambient temperature. The dependency of capacity fade on all of these factors is captured in the empirical model developed. Capacity fade due to SEI layer growth (Fs) and lithium plating phenomenon (Fp) is modeled as shown in Equations 1 and 2, respectively, where ‘Q’ is the total charge exchanged (Ah) during the experiment, which includes both the charge and discharge Ah, ‘T’ is the total cycle time (Hours), ‘tamb’ and ‘tnom’ are ambient and nominal temperatures respectively. The coefficients ‘a’ and ‘b’ signify the dependency of fading due to SEI layer growth on Q and T, respectively, and the coefficients ‘f’ and ‘g’ denote the dependency of fading due to lithium plating on Q and T, respectively and the coefficients ‘e’ and ‘i’ includes the temperature effect on capacity fading due to SEI layer growth and lithium plating respectively, where tamb and tnom are in Kelvin (K). The total capacity fade (F) within a cell is then given by Equation 3.
The design of the empirical expressions is based on the underlying mechanisms and dependencies observed in the experimental results. For the loss of lithium inventory to SEI layer growth, Equation 1 is employed. The choice of this expression is guided by the understanding that SEI layer growth is primarily time-dependent, influenced by the total cycle time (T). Thus, the term involving 'T' is necessary to capture the effect of cycle duration on SEI layer growth. Moreover, it is crucial to consider the presence of calendar aging, where SEI layer growth occurs even without energy exchange (Q = 0). Hence, the Q term is included, representing the total charge exchanged during the experiment. Additionally, the empirical expression accounts for the temperature dependence of SEI layer growth, as evident from Figure 9A. This is reflected through the temperature-dependent exponential term (e(tamb/tnom)), where 'tamb' and 'tnom' represent the ambient and nominal temperatures, respectively, measured in Kelvin (K).
Regarding the loss of lithium inventory to lithium plating, Equation 2 is employed. Lithium plating occurs during ion movement and subsequent deposition of lithium ions onto the negative electrode surface as a thin lithium metal layer. As plating only occurs when there is energy exchange (Q > 0), the product term of 'Q' and 'T' (Qf ∗ Tg) is introduced. This ensures that plating should be zero if there is no energy exchange (Q = 0). Moreover, similar to the SEI layer expression, the empirical model considers the influence of cycle time (T) on plating phenomena. Furthermore, the results (Figure 9A) indicate that lithium plating is temperature-dependent, hence the inclusion of the temperature-dependent exponential term (i(tamb/tnom)) in the expression.
The interdependencies between energy exchange, cycle time, and ambient temperature are captured by choosing these empirical expressions, aligning with the observed trends. The resulting empirical models allow for the mathematical estimation of capacity fade, considering various factors such as discharge duration, discharge capacity, charge-discharge rates, and ambient temperature.
The obtained coefficients for any value of Q and T at a given tamb and under tnom of 298.15 K are as listed in Table 4. It can be seen from Table 4 that, irrespective of the ambient temperature, charge-discharge rates, and rest periods, the coefficients of the fading equations remain the same, ensuring a robust model. The developed empirical model can easily determine the capacity loss caused by SEI layer growth and lithium plating. The developed empirical model must be recommended to end users and OEMs in determining the impact of SEI layer growth and lithium plating on capacity fading. This model is valid for all lithium-ion chemistries and geometries. The nature of the equation remains the same for any lithium-ion chemistry, but the coefficients would change if the battery under test changes. The proposed empirical model coefficients are limited for the considered LGM50 3.6V 5Ah battery cycling experiments that ran for 500 cycles. The coefficients will change for a battery with different specifications and cycling conditions. A more generalized empirical model can be developed from the proposed model, independent of nominal battery parameters. The accuracy of the developed model is validated using actual fading data obtained from simulations. The results of this study provide a useful tool for predicting capacity fading in lithium-ion batteries, which can be used in the design and optimization of battery systems.
| (Equation 1) |
| (Equation 2) |
| (Equation 3) |
Table 4.
Coefficients of the capacity fading estimating equation
| Ambient Temperature (0K) | a | b | c | d | e | f | g | h | i |
|---|---|---|---|---|---|---|---|---|---|
| 273.15 | 0.15 | 0.54 | 0.01 | 0.19 | 1.05 | 0.04 | −0.13 | 0.13 | 1.05 |
| 298.15 | 0.15 | 0.54 | 0.01 | 0.21 | 1.05 | 0.04 | −0.13 | 0.13 | 1.05 |
| 323.15 | 0.15 | 0.54 | 0.01 | 0.23 | 1.04 | 0.05 | −0.13 | 0.13 | 1.05 |
The coefficients are derived from fitting the capacity fading data obtained after performing the 50 experiments for different charge rates, rest periods, and three different ambient temperatures.
Conclusion
Our work addresses the critical issue of the discrepancy between claimed battery life by manufacturers and the actual life observed by users in the EV industry. We have successfully identified the role of resting periods after charging or discharging in the capacity fading rate, shedding light on the memory effect in batteries. Our advanced cyclic test methods incorporate varying rest periods and has provided valuable insights into battery degradation mechanisms.
Our experiments and analysis demonstrated that the proposed cyclic test methods lead to higher capacity fading estimates than the standard cyclic test method. The results emphasize the influence of the SEI layer and lithium plating on overall capacity fading. We have established that the SEI layer growth is primarily cycle-time dominant, while the relaxation period significantly impacts lithium plating. Higher temperatures and longer cycle durations increase capacity fading, as SEI layer growth and lithium plating rates are accelerated under these conditions.
The impact of critical parameters, such as temperature, discharge C-rate, charge C-rate, and rest period, on the individual degradation phenomena of SEI layer growth and lithium plating, has been thoroughly analyzed. Our findings indicate that SEI layer growth is influenced more by the duration of the entire cycle than by the specific cycling conditions. On the other hand, capacity fading due to lithium plating is independent of charge and discharge rates. The decay of lithium inventory to lithium plating diminishes over cycles due to the stabilization of the SEI layer and the limited porosity of the surface.
The comprehensive understanding gained from our work enables a more accurate estimation of capacity fading, considering the interplay between battery degradation mechanisms. Our findings emphasize the importance of maintaining safe operating temperatures during charging and discharging to extend battery life and reduce degradation rates. Furthermore, we propose extending our work to simulate actual drive cycles in real-world driving scenarios and exploring alternative charging protocols.
In conclusion, our research contributes critical insights into battery degradation, addressing the disparity between claimed and observed battery life. The proposed cyclic test method, incorporating varying rest periods, offers a more accurate evaluation of capacity fading. These findings have implications for developing improved battery management system s, enabling manufacturers and end users to make informed decisions and plan for battery replacements based on realistic estimations of battery lifespan.
Limitations of the study
The proposed empirical model’s coefficients’ values may vary with different cell chemistries. Moreover, for the chosen LGM50 cell, the coefficients are valid up to 500 cycles. Beyond 500 cycles, the validity of the empirical relation is not explored, and we leave it for future work. It is important to consider the boundary conditions based on the battery’s life cycle, which is an area yet to be explored. However, within the first 500 cycles of the battery’s lifetime, the model accurately predicts capacity fade, making it valid for any cycle within this range.
STAR★Methods
Key resources table
| REAGENT or RESOURCE | SOURCE | IDENTIFIER |
|---|---|---|
| Software and algorithms | ||
| PyBaMM | PyBaMM | www.pybamm.org |
| Origin Pro 2023 | Origin Lab | www.originlab.com |
| Other | ||
| Param Ishan – Super Computer | IIT Guwahati, India | www.iitg.ac.in/param-ishan |
| Climatic Cell Test Chamber | This paper | N/A |
| Battery charge controller | This paper | N/A |
| LG-M50 INR21700 Cells | Genuine Power | www.genuinepower.co.in |
| Electrical Power sources and Local Computers | E-Mobility Lab, IIT Guwahati, India | www.iitg.ac.in/e_mobility/ |
Resource availability
Lead contact
Further information and request for resources should be directed to and will be fulfilled by the Lead Contact, Bikash Sah (bikash.sah@h-brs.de).
Materials availability
This study did not generate new unique reagents.
Method details
The current work utilizes a pseudo-2D model to simulate the LGM50 21700 cylindrical cell. To ensure the accuracy and reliability of the simulation results, the parameters used in the model were obtained from a comprehensive set of experimental tests extensively conducted and published by Chen et al.52 and Nyman et al.62 The published results characterize the physical, chemical, and electrochemical properties of the cell through various experimental techniques. Further, the pseudo-2D model is also validated with the experiment performed on LGM50 21700 cylindrical cells in a climate-controlled chamber. The experiments to calibrate and validation of the model are performed for a commonly used cycle life testing method for 50 cycles and one of the proposed cycling tests for 15 cycles.
The parameters related to electrode and cell thermodynamics, kinematics, and transport properties utilized in our work were determined from electrochemical tests performed on extracted electrode materials by.52 These tests utilized a three-electrode configuration with a lithium metal reference electrode. This approach determines the individual electrode potentials, cell stoichiometry, and lithium content in the positive and negative electrodes. Additionally, the cells’ open circuit voltage (OCV) was determined based on data obtained from the galvanostatic intermittent titration technique (GITT) experiments.
The parameters associated with the physical properties of the cell components utilized in our work were derived from the direct measurements after cell tear-down conducted by.52 The cell components include electrodes, separators, and current collectors. The work employed ion beam milling combined with scanning electron microscopy to investigate the pore structures of the positive and negative electrodes and the separator. This analysis provided critical information regarding particle shapes, densities, packing density, and the conductive carbon and binder domains (CBD) distribution.
The chemical and material properties of the cell components were also determined through careful analysis.52 For the negative electrode components, the elemental composition of SiOx and graphite was determined using energy-dispersive X-ray spectroscopy (EDS). Similarly, the positive electrode’s NMC composition was analyzed using inductively coupled plasma optical emission spectroscopy (ICP-OES). Therefore, the parameters associated with the chemical and material properties utilized in our work were determined based on the results obtained from these specific analytical techniques performed by.52
The parameters relevant to the mass transport phenomenon in the electrolyte, which were utilized in our work, were derived from experiments conducted by.52 To characterize mass transport, various electrochemical methods were employed. A standard conductivity meter measured ionic conductivity, diffusivity, and transport number. Additionally, galvanostatic polarization and concentration cell experiments were performed to determine the diffusion coefficient and thermodynamic factor of the salt.62
The simulation results presented in this work can be justified by utilizing the parameter data obtained from the comprehensive experimental work conducted by52 and.62 Notably, physically conducting long cycling experiments involving thousands of cycles would be time-consuming and resource-intensive. Therefore, using simulations backed by such accurate and experimentally validated parameter sets enables accelerated cyclic testing experiments while maintaining the validity of the results.
Calibration with standard life cycle test and proposed test cycle
To further strengthen the validity of the simulation results, a cycle life experiment for 50 cycles and one of the proposed cycling tests was conducted on the chosen LGM50 cell within our laboratory. By performing the same life cycle experiment and proposed cycling test in the laboratory and the simulation, we compared the results to assess their agreement.
Cycle life experimentation
For the experimental cycle life test, an environmentally controlled cell testing chamber was developed in-house (Figure S7). The LGM50 cell was subjected to the standard manufacturer-specified cycle life experiment, as explained below. The charging process involved applying a constant current rate of 0.3C (1.44A) until the cell voltage reached 4.1V, followed by constant voltage charging at 4.1V until the current reached 240 mA. A rest period of 10 min was introduced, and then the cell was discharged at a constant current rate of 0.5C (2.4A) until the voltage reached 2.85V, followed by a rest period of 20 min. This cycle was repeated for 50 cycles while maintaining the ambient temperature of the chamber at 25°C.
Figure S8 illustrates the terminal voltage profiles across the cell for 200 h, obtained from experimental and simulation data. The experimental and simulation voltage profiles show a close match to each other. The total energy exchange during the cycle life experiment for 50 cycles was also analyzed to verify the closeness. The experimental entire energy exchange for 50 cycles was measured as 1566.63 Wh, while the simulation yielded a value of 1559.34 Wh. The results and plots demonstrate a close match between the experimental and simulation data, providing further justification for using the pseudo-2D model.
Proposed test cycle experimental validation
In addition to comparing the simulation results with the manufacturer-specified cycle life experiment, we designed and conducted a series of experiments for one of our proposed cyclic testing test cases for 15 cycles. Out of 1000 proposed unique test cycles, a random cycle featuring a discharge duration of 30 min and a discharge C-rate of 0.5C, a charge C- rate of 0.3C, and a rest period of 1 h each after charge and discharge periods is chosen, and the experiment is performed for 15 cycles at a constant ambient temperature of 25°C in the developed battery test chamber. The test cycle involved discharging the cell at a constant current rate of 0.5C (2.5A) for 30 min, followed by a resting period of 1 h. Subsequently, the cell was charged at a constant current rate of 0.3C (1.5A) until the voltage reached 4.1V, and the cell was held at 4.1V until the current reached 0.05C (0.25A), followed by another 1-h rest period. This proposed test cycle was also simulated, and the terminal voltage profiles were compared. Furthermore, the total energy exchange was calculated and compared for experimental and simulation data, resulting in respective values of 147.26 Wh and 146.5 Wh for 15 cycles. Figure S9 illustrates the closely matching voltage profiles obtained from both experimental and simulated data, demonstrating the accuracy and reliability of our pseudo-2D model in replicating the cell’s behavior under our proposed cyclic testing conditions.
By incorporating both the parameter data obtained from the experimentally validated ref. 52,62 and conducting cycle life experiments as well as proposed test cycle experiments within our laboratory, we have significantly strengthened the validity of the simulation results. The combination of accurate parameter data from52,62 ‘s comprehensive experimental work and the successful experimental validation within our laboratory instills confidence in the reliability and applicability of the pseudo-2D model. Given the extensive time and resources required for physical capacity fade experiments on multiple cells, we opted to use simulations to expedite the process.
Further assessment of experimental results
The comparison of experimental results with existing references is a critical aspect of our study on capacity fade in lithium-ion batteries. While we acknowledge that the cell chemistries used in various references and our own may differ, conducting experiments on multiple chemistries to compare results directly would be infeasible and resource intensive. Instead, we adopted a systematic approach to address this challenge.
We specifically chose the cell (LGM50) for which an extensive set of parameters was available.52 We conducted the manufactured specified cycle life experiments and one of our proposed test cycle experiments on that cell as discussed in the previous subsection. This step further confirmed the versatility and reliability of our pseudo-2D model, as it successfully replicated both the standard cycle life testing and our proposed cyclic testing scenarios with promising accuracy. This validation process reassured us that our model was calibrated correctly, thus providing a solid foundation for drawing meaningful insights from the simulation-based capacity fading analysis.
Having established the robustness of our simulation approach, we performed comprehensive fading analyses in the simulation environment. Subsequently, we meticulously compared our simulation-derived insights with those obtained from the existing studies,3,4,41,63 thereby contributing to a more comprehensive understanding of capacity fade mechanisms in lithium-ion batteries3 investigated capacity fade in Li-ion batteries cycled at different discharge rates, highlighting the correlation between higher discharge rates and increased fade. The charging process in this study involved applying a constant current charge (CC) to the fully charged state until the cell voltage reached its peak of around 4.2V. Subsequently, a constant voltage charge (CV) was maintained at 4.2V until the current tapered down to a small value. A rest period was not included, and the cell was directly discharged to a lower cut-off voltage of 2.5V. The capacity losses were estimated after 300 cycles at discharge rates of 1C, 2C, and 3C, revealing that the battery cycled at 3C discharge rate experienced the highest capacity fade, followed by the battery cycled at 2C and 1C, respectively. However, we argue that capacity fade is not solely dependent on discharge rates but is also influenced by charge rate, discharge duration, rest periods, and ambient temperature. Our simulations, where all these parameters were kept constant, demonstrated similar results, reinforcing the importance of considering multiple factors in battery cycling analysis. Furthermore, the absence of a rest period in3 disregards the concept of calendar aging, which we explored in our study and found to be crucial for a comprehensive understanding of cyclic testing effects.41 studied capacity fading during accelerated calendar and cycle life tests and proposed a relationship between depth of discharge (DOD) and capacity fade. The charging process involved a constant current charge (CC) at a rate of 1.0C until the cell voltage reached 4.2V, followed by a constant voltage charge (CV) at 4.2V until the current reduced to 0.05C. After each charge, a rest period of 20 min was introduced. Subsequently, the cell was discharged at a constant current rate of 1.0C until the voltage reached 2.5V, followed by another rest period of 20 min. The authors concluded that higher depth of discharge (DOD) resulted in higher capacity fade. We concur with their findings, but this finding is only valid while maintaining other parameters constant during experiments to accurately isolate the effect of DOD. Our simulations corroborated their results, indicating that increasing DOD without changing discharge duration, charge rate, rest periods, or ambient temperature resulted in higher capacity fade, reinforcing the interdependence of these factors.
In contrast,4 focused on the influence of the state of charge (SOC) ranges on capacity fade in lithium-ion batteries. The cell was cycled at a discharge current of 10A and charge current of 2.5A, with the SOC ranges tested being 5–25%, 25–45%, 45–65%, 65–85%, and 75–95%. The authors observed that cells cycled at higher SOC ranges experienced higher active lithium loss and, consequently, capacity fade. Although their study demonstrated a correlation between higher SOC ranges and increased active lithium loss, we argue that comprehensive judgments about capacity fading require examining various other factors simultaneously. Our research considers a broader range of parameters, shedding light on the role of SEI layer growth and lithium plating during different cycling phases, providing a more holistic understanding of the aging process63 investigated the effects of fast charging rates and temperature on capacity fade. The cells were cycled between 20% and 80% SOC at constant current charging rates of 1C, 2C, 3C, and 4C, corresponding to 25A, 50A, 75A, and 100A, respectively. The cells were discharged at a constant current of 1C (25A) in all cases. While a rest period of 20 min was considered after the charge and discharge phases, the study did not account for calendar aging during these rest periods. While their results showed significant degradation under higher charging rates and temperatures, our study complements their findings by emphasizing the importance of rest periods after charge and discharge phases of at least 30 min (ideally 2 h) to allow lithium and electrolyte concentration gradients to normalize, thus mitigating degradation. Calendar aging during rest periods can lead to SEI layer growth, impacting battery performance. Our simulations highlight the necessity of adequate rest periods to normalize lithium and electrolyte concentration gradients and mitigate degradation.
Our research presents a comprehensive analysis of capacity fade in lithium-ion batteries under various cycling conditions, encompassing discharge rates, charge rates, rest periods, ambient temperature, and discharge durations. By comparing our results with the existing studies, we emphasize the significance of considering multiple factors during cyclic testing for a realistic assessment of battery degradation. Our work also provides insights into the cell-level degradation mechanisms, such as SEI layer growth and lithium plating, during different phases of the cycling process, which is currently missing in the current literature. To ensure meaningful results and reduce computational time, suitable assumptions and designs of experiments have been made, which are discussed in subsequent subsections.
Assumptions
To simplify the models and reduce the computation time, it is important to make certain assumptions. However, the assumptions should not compromise the results. Hence, weighted assumptions are made, and their justifications are listed below –
-
1.
The experiments are limited to a 1C rate considering the present fast charging rate in charging stations. Hence, particle cracking, one of the mechanical degradation mechanisms, is not considered because it is predominant at high charge-discharge rates.59,64,65
-
2.
The loss of lithium in the electrolyte is assumed to be negligible, and the electrolyte exhibits stability as the electrochemical processes are expected to occur within the positive and negative electrodes.66 The total lithium concentration in the electrolyte constitutes less than 2% of the whole lithium present within a cell.53 Hence, neglecting the loss of lithium in the electrolyte does not impact the outcome of the analysis.
-
3.
One of the critical degradation phenomena is SEI layer growth, described using the solvent-diffusion mechanism. Most of the SEI models developed in the existing literature are based on the work of Safari et al.67 According to this work, the SEI reaction is modeled either using the diffusion of the solvent molecule toward the graphite surface through the existing SEI (also called diffusion-solvent model) or the solvent reduction kinetics at the graphite surface. According to the literature, the diffusion-limited model fits better with the experimental data.68 Hence, solvent-diffusion limited SEI growth modeling is used in this work.
-
4.
Lithium plating on the graphite anode surface is one of the damaging phenomena among several aging mechanisms. Generally, the lithium deposited can be both reversible and irreversible.51 During intercalation, some lithium gets deposited on the graphite surface by electrical contact. After a charge transfer reaction with the electrolyte, this deposited lithium will eventually re-intercalate into the anode.69,70 This lithium portion is called reversible lithium, and the process is called lithium-stripping. The residual part of lithium reacts with the electrolyte to form a high-impedance film, termed "dead lithium.” This lithium loss is irreversible.71,72 The current work assumes the lithium plating to be reversible and accounts for the loss of lithium-to-lithium plating73
Design of experiments
In addition to experimental studies, mathematical models are utilized to capture various electrochemical phenomena within a cell, as they provide a suitable replacement for time-consuming real-time experiments. This study includes understanding the electrochemical behavior of the cell, diffusion of solutes in electrode material, characterizing the rates of chemical reactions, the transport properties of electrodes, cell degradation, and capacity fade. Mathematical models are also crucial tools for designing efficient battery management systems.
The Doyle-Fuller Newman (DFN) model developed by Newman et al. is considered a standard continuum mathematical model for lithium-ion batteries.74,75,76 However, this model is computationally extensive as it consists of highly complex nonlinear elliptical and parabolic partial differential equations (PDEs). To overcome this limitation, simpler models such as the Single Particle Model (SPM) are used to gain fundamental insights, but they are not accurate enough in voltage prediction without correction terms.77,78,79,80 This work chose SPM with electrolyte (SPMe) as it has better accuracy than SPM. The key modeling and governing equations of the SPMe model can be found in the Supplementary information (Equations S1a–S1q) and the reader is referred to81 for detailed derivations and equations of the SPMe model. To assess the capacity fading, the chosen cylindrical cell was subjected to the experimental design described in Tables S5 and S6. The selected cell had a nominal voltage of 3.6V and a nominal capacity of 5Ah. LGM50 cell comprises a negative electrode composed of graphite with a 10% SiOx mass fraction, while the positive electrode comprises NMC-811. The separator used is Celgard 2325, a tri-layer polypropylene/polyethylene/polypropylene/polyolefin membrane. The electrolyte employed is a 1 mol dm−3 LiPF6 solution in a mixture of ethylene carbonate (EC) and ethyl methyl carbonate (EMC) in a 3:7 volume ratio. It is important to note that the modeling equations for the electrode (Equations S2 and S3), electrolyte (Equation S4–S8), SEI layer (Equation S9–S16), and lithium plating (Equation S17–S24) and their respective parameters (Table S1–S3) can be found in the Supplementary information, providing a detailed understanding of the interactions and behavior of these components within the Cell LGM50 system. Other relevant cell parameters and specifications provided by the manufacturer are detailed in Table S4.52 The capacity fade associated with the cell was estimated under specific dynamic charge-discharge profiles at different rates and temperature conditions. Initially, the cell was subjected to a constant current discharge period followed by a rest period.
Subsequently, the cell was charged at a constant current rate until the voltage across the cell reached 4.2V, and then the cell was held at 4.2V by constant voltage charging until the current fell below 50 mA (C/100), followed by a rest period. The duration of intermediate rest periods and charging C-rates are discussed in subsequent sections. The set of experiments was performed under three different temperatures to analyze the impact of the temperature on capacity fading.
A two-factor factorial-based experimental design technique82 is used to develop the experimental set. The effect of two parameters – discharge period and discharge capacity, on the capacity fading is studied for different ambient temperatures (0°C, 25°C, and 50°C) and rest periods (0.5 h, 1 h, 1.5 h, and 2 h). We chose five different discharge durations from 0.5 to 1.5 h on a scale of 0.25 h to analyze the impact of the discharge period for a fixed discharge capacity and charge rate under constant ambient temperature. Similarly, ten discharge capacities from 1 to 4.375 Ah are selected to examine the effect of discharge capacity for a fixed discharge duration and charge rate at constant ambient temperature. With five discharge periods and ten different discharge capacities, considering a two-factor multi-level design, 50 experiments were designed, each for 500 cycles. Tables S5 and S6 presents the two-factor multi-level design criteria parameters and the developed experimental set showing the discharge C-rate corresponding to the chosen discharge capacity and the duration of the discharge period for a cycle. Furthermore, the impact of charge rate and ambient temperature on the degradation rate is investigated by performing the designed experiments. As shown in Figure 2F, each of the 50 experiments was performed at four charge rates (0.1C, 0.5C, 0.75C, and 1C) for 200 experiments. All 200 experiments are further performed at four rest periods (0.5 h, 1 h, 1.5 h, and 2 h) along with a standard experiment cycle with no rest period resulting in 1000 unique experiment cycles. These 1000 experiment cycles were then repeated for three different temperatures (0°C, 25°C, and 50°C), resulting in a total of 3000 unique experiment cycles, giving us a complete picture of how various factors, viz. charge rates, rest periods, and temperature, affect the capacity fading of batteries.
Acknowledgments
This work is supported by the Ministry of Education (MoE), Government of India through the Prime Ministers’ Research Fellowship (PMRF) Scheme and E-Mobility Lab, Indian Institute of Technology, Guwahati, Assam, India.
Author contributions
S.K.M., B.S., and P.K. did the conceptualization of the research. S.K.M. performed data curation, formal analysis, investigation, methodology, resources, software, visualization, writing – original draft, review and editing. B.S. supported throughout the formal analysis, investigation, software, and visualization processes. B.S. and P.K. performed supervision, validation and writing – review and editing.
Declaration of interests
The authors declare no competing interests.
Published: August 29, 2023
Footnotes
Supplemental information can be found online at https://doi.org/10.1016/j.isci.2023.107770.
Supplemental information
Data and code availability
-
•
The data reported in this paper will be shared by the lead contact upon request.
-
•
This paper does not report original code.
-
•
Any additional information required to reanalyze the data reported in this paper is available from the lead contact upon request.
References
- 1.Sah B., Kumar P. Charger integrated coestimation of parameters and states of battery. IEEE Trans. Power Electron. 2023;38:7923–7932. doi: 10.1109/TPEL.2023.3253562. [DOI] [Google Scholar]
- 2.Pattipati B., Sankavaram C., Pattipati K. System identification and estimation framework for pivotal automotive battery management system characteristics. IEEE Trans. Syst. Man Cybern. C. 2011;41:869–884. doi: 10.1109/TSMCC.2010.2089979. [DOI] [Google Scholar]
- 3.Ning G., Haran B., Popov B.N. Capacity fade study of lithium-ion batteries cycled at high discharge rates. J. Power Sources. 2003;117:160–169. doi: 10.1016/S0378-7753(03)00029-6. [DOI] [Google Scholar]
- 4.Gantenbein S., Schönleber M., Weiss M., Ivers-Tiffée E., Lindberg G. Capacity fade in lithium-ion batteries and cyclic aging over various state-of-charge ranges. Sustainability. 2019;11:6697. doi: 10.3390/su11236697. [DOI] [Google Scholar]
- 5.Redondo-Iglesias E., Venet P., Pelissier S. Modelling Lithium-Ion Battery Ageing in Electric Vehicle Applications—Calendar and Cycling Ageing Combination Effects. Batteries. 2020;6:14. doi: 10.3390/batteries6010014. [DOI] [Google Scholar]
- 6.Khalid A., Sarwat A.I. 2021 IEEE Transportation Electrification Conference & Expo (ITEC) 2021. Fast charging li-ion battery capacity fade prognostic modeling using correlated parameters’ decomposition and recurrent wavelet neural network; pp. 27–32. [DOI] [Google Scholar]
- 7.Doyle M., Newman J. Modeling the performance of rechargeable lithium-based cells: design correlations for limiting cases. J. Power Sources. 1995;54:46–51. doi: 10.1016/0378-7753(94)02038-5. [DOI] [Google Scholar]
- 8.Doyle M., Newman J., Gozdz A.S., Schmutz C.N., Tarascon J. Comparison of modeling predictions with experimental data from plastic lithium ion cells. J. Electrochem. Soc. 1996;143:1890–1903. doi: 10.1149/1.1836921. [DOI] [Google Scholar]
- 9.Darling R., Newman J. Modeling side reactions in composite LiyMn2O4 electrodes. J. Electrochem. Soc. 1998;145:990–998. doi: 10.1149/1.1838376. [DOI] [Google Scholar]
- 10.Eddahech A., Briat O., Henry H., Delétage J.Y., Woirgard E., Vinassa J.M. Ageing monitoring of lithium-ion cell during power cycling tests. Microelectron. Reliab. 2011;51:1968–1971. doi: 10.1016/j.microrel.2011.07.013. [DOI] [Google Scholar]
- 11.Eddahech A., Briat O., Woirgard E., Vinassa J. Remaining useful life prediction of lithium batteries in calendar ageing for automotive applications. Microelectron. Reliab. 2012;52:2438–2442. doi: 10.1016/j.microrel.2012.06.085. [DOI] [Google Scholar]
- 12.André D., Appel C., Soczka-Guth T., Sauer D.U. Advanced mathematical methods of soc and soh estimation for lithium-ion batteries. J. Power Sources. 2013;224:20–27. doi: 10.1016/j.jpowsour.2012.10.001. [DOI] [Google Scholar]
- 13.Saha B., Goebel K., Poll S., Christophersen J. Prognostics methods for battery health monitoring using a Bayesian framework. IEEE Trans. Instrum. Meas. 2009;58:291–296. doi: 10.1109/TIM.2008.2005965. [DOI] [Google Scholar]
- 14.Saha B., Poll S., Goebel K., Christophersen J. 2007 IEEE Autotestcon. 2007. An integrated approach to battery health monitoring using bayesian regression and state estimation; pp. 646–653. [DOI] [Google Scholar]
- 15.Ecker M., Gerschler J.B., Vogel J., Käbitz S., Hust F., Dechent P., Sauer D.U. Development of a lifetime prediction model for lithium-ion batteries based on extended accelerated aging test data. J. Power Sources. 2012;215:248–257. doi: 10.1016/j.jpowsour.2012.05.012. [DOI] [Google Scholar]
- 16.Smith K., Kim G.-H., Pesaran A. National Renewable Energy Lab. (NREL); 2009. Modeling of Non-uniform Degradation in Large-Format Li-Ion Batteries (Presentation)https://www.osti.gov/servlets/purl/965119 Technical Report. [Google Scholar]
- 17.Tröltzsch U., Kanoun O., Tränkler H.R. Characterizing aging effects of lithium ion batteries by impedance spectroscopy. Electrochim. Acta. 2006;51:1664–1672. doi: 10.1016/j.electacta.2005.02.148. [DOI] [Google Scholar]
- 18.Liaw B.Y., Jungst R.G., Nagasubramanian G., Case H.L., Doughty D.H. Modeling capacity fade in lithium-ion cells. J. Power Sources. 2005;140:157–161. doi: 10.1016/j.jpowsour.2004.08.017. [DOI] [Google Scholar]
- 19.Chen C., Pecht M. Proceedings of the IEEE 2012 Prognostics and System Health Management Conference. PHM-2012 Beijing; 2012. Prognostics of lithium-ion batteries using model-based and data-driven methods; pp. 1–6. [DOI] [Google Scholar]
- 20.Zenati A., Desprez P., Razik H. IECON 2010 - 36th Annual Conference on IEEE Industrial Electronics society. 2010. Estimation of the soc and the soh of li-ion batteries, by combining impedance measurements with the fuzzy logic inference; pp. 1773–1778. [DOI] [Google Scholar]
- 21.Tsang K., Chan W. State of health detection for lithium ion batteries in photovoltaic system. Energy Convers. Manag. 2013;65:7–12. doi: 10.1016/j.enconman.2012.07.006. [DOI] [Google Scholar]
- 22.Salkind A.J., Fennie C., Singh P., Atwater T., Reisner D.E. Determination of state-of-charge and state-of-health of batteries by fuzzy logic methodology. J. Power Sources. 1999;80:293–300. doi: 10.1016/S0378-7753(99)00079-8. [DOI] [Google Scholar]
- 23.Singh P., Vinjamuri R., Wang X., Reisner D. Fuzzy logic modeling of eis measurements on lithium-ion batteries. Electrochim. Acta. 2006;51:1673–1679. doi: 10.1016/j.electacta.2005.02.143. [DOI] [Google Scholar]
- 24.Urbain M. Ph.D. thesis, Institut National Polytechnique de Lorraine; 2009. Modélisation électrique et énergétique des accumulateurs Li-Ion. Estimation en ligne de la SOC et de la SOH.https://www.theses.fr/2009INPL028N [Google Scholar]
- 25.Kozlowski J.D. Vol. 7. 2003. (Electrochemical Cell Prognostics Using Online Impedance Measurements and Model-Based Data Fusion Techniques). [DOI] [Google Scholar]
- 26.Weibull W. A Statistical Distribution Function of Wide Applicability. J. Appl. Mech. 2021;18:293–297. https://hal.science/hal-03112318 [Google Scholar]
- 27.Eom S.-W., Kim M.-K., Kim I.-J., Moon S.-I., Sun Y.-K., Kim H.S. Life prediction and reliability assessment of lithium secondary batteries. J. Power Sources. 2007;174:954–958. doi: 10.1016/j.jpowsour.2007.06.208. [DOI] [Google Scholar]
- 28.Christensen J., Newman J. Effect of anode film resistance on the charge/discharge capacity of a lithium-ion battery. J. Electrochem. Soc. 2003;150:A1416–A1420. doi: 10.1149/1.1612501. [DOI] [Google Scholar]
- 29.Christensen J., Newman J. A mathematical model of stress generation and fracture in lithium manganese oxide. J. Electrochem. Soc. 2006;153:A1019. doi: 10.1149/1.2185287. [DOI] [Google Scholar]
- 30.Christensen J., Newman J. Stress generation and fracture in lithium insertion materials. J. Solid State Electrochem. 2006;10:293–319. doi: 10.1007/s10008-006-0095-1. [DOI] [Google Scholar]
- 31.Ploehn H.J., Ramadass P., White R.E. Solvent diffusion model for aging of lithium-ion battery cells. J. Electrochem. Soc. 2004;151:A456–A462. doi: 10.1149/1.1644601. [DOI] [Google Scholar]
- 32.Safari M., Delacourt C. Modeling of a commercial graphite/lifepo4 cell. J. Electrochem. Soc. 2011;158:A562. doi: 10.1149/1.3567007. [DOI] [Google Scholar]
- 33.Safari M., Delacourt C. Simulation-based analysis of aging phenomena in a commercial graphite/lifepo4 cell. J. Electrochem. Soc. 2011;158:A1436. doi: 10.1149/2.103112jes. [DOI] [Google Scholar]
- 34.Wang S., Fan Y., Jin S., Takyi-Aninakwa P., Fernandez C. Improved anti-noise adaptive long short-term memory neural network modeling for the robust remaining useful life prediction of lithium-ion batteries. Reliab. Eng. Syst. Saf. 2023;230 doi: 10.1016/j.ress.2022.108920. [DOI] [Google Scholar]
- 35.Wang S., Takyi-Aninakwa P., Jin S., Yu C., Fernandez C., Stroe D.I. An improved feedforward-long short-term memory modeling method for the whole-life-cycle state of charge prediction of lithium-ion batteries considering current-voltage-temperature variation. Energy. 2022;254 doi: 10.1016/j.energy.2022.124224. [DOI] [Google Scholar]
- 36.Carnovale A., Li X., Kong X. A modeling and experimental study of capacity fade for lithium-ion batteries. Energy AI. 2020;2 doi: 10.1016/j.egyai.2020.100032. [DOI] [Google Scholar]
- 37.Zhu J., Su P., Dewi Darma M.S., Hua W., Mereacre L., Liu-Théato X., Heere M., Sørensen D.R., Dai H., Wei X., et al. Multiscale investigation of discharge rate dependence of capacity fade for lithium-ion battery. J. Power Sources. 2022;536 doi: 10.1016/j.jpowsour.2022.231516. [DOI] [Google Scholar]
- 38.Tanim T.R., Shirk M.G., Bewley R.L., Dufek E.J., Liaw B.Y. The implications of fast charge in lithium ion battery performance and Life: cell vs. pack. 2018 https://www.osti.gov/servlets/purl/1478846 [Google Scholar]
- 39.Raj A., Rodrigues M.T.F., Abraham D.P. Rate-dependent aging resulting from fast charging of li-ion cells. J. Electrochem. Soc. 2020;167 doi: 10.1149/1945-7111/abace9. [DOI] [Google Scholar]
- 40.Mussa A.S., Liivat A., Marzano F., Klett M., Philippe B., Tengstedt C., Lindbergh G., Edström K., Lindström R.W., Svens P. Fast-charging effects on ageing for energy optimized automotive lini1/3mn1/3co1/3o2/graphite prismatic lithium-ion cells. J. Power Sources. 2019;422:175–184. doi: 10.1016/j.jpowsour.2019.02.095. [DOI] [Google Scholar]
- 41.Watanabe S., Kinoshita M., Hosokawa T., Morigaki K., Nakura K. Capacity fade of LiAlyNi1−x−yCoxO2 cathode for lithium-ion batteries during accelerated calendar and cycle life tests (surface analysis of LiAlyNi1−x−yCoxO2 cathode after cycle tests in restricted depth of discharge ranges) J. Power Sources. 2014;260:50–56. doi: 10.1016/j.jpowsour.2014.02.103. [DOI] [Google Scholar]
- 42.Reichert M., Andre D., Rösmann A., Janssen P., Bremes H.G., Sauer D., Passerini S., Winter M. Influence of relaxation time on the lifetime of commercial lithium-ion cells. J. Power Sources. 2013;239:45–53. doi: 10.1016/j.jpowsour.2013.03.053. [DOI] [Google Scholar]
- 43.Rashid M., Gupta A. Effect of relaxation periods over cycling performance of a li-ion battery. J. Electrochem. Soc. 2015;162:A3145–A3153. doi: 10.1149/2.0201502jes. [DOI] [Google Scholar]
- 44.Liu Q.Q., Petibon R., Du C.Y., Dahn J.R. Effects of electrolyte additives and solvents on unwanted lithium plating in lithium-ion cells. J. Electrochem. Soc. 2017;164:A1173–A1183. doi: 10.1149/2.1081706jes. [DOI] [Google Scholar]
- 45.Zhu, Wang Y., Huang Y., Bhushan G.R., Cao Y., Heere M., Martin J.M., Mereacre L., Dai H., Liu X., et al. Data-driven lithium-ion battery capacity estimation from voltage relaxation. Nat. Commun. 2022;13:2261. doi: 10.1038/s41467-022-29837-w. [DOI] [PMC free article] [PubMed] [Google Scholar]
- 46.Severson K.A., Attia P.M., Jin N., Perkins N., Jiang B., Yang Z., Chen M.H., Aykol M., Herring P.K., Fraggedakis D., et al. Data-driven prediction of battery cycle life before capacity degradation. Nat. Energy. 2019;4:383–391. doi: 10.1038/s41560-019-0356-8. [DOI] [Google Scholar]
- 47.Leng F., Tan C.M., Pecht M. Effect of temperature on the aging rate of li ion battery operating above room temperature. Sci. Rep. 2015;5 doi: 10.1038/srep12967. [DOI] [PMC free article] [PubMed] [Google Scholar]
- 48.Keil J., Paul N., Baran V., Keil P., Gilles R., Jossen A. Linear and nonlinear aging of lithium-ion cells investigated by electrochemical analysis and in-situ neutron diffraction. J. Electrochem. Soc. 2019;166:A3908–A3917. doi: 10.1149/2.1271915jes. [DOI] [Google Scholar]
- 49.Yang X.-G., Ge S., Liu T., Leng Y., Wang C.Y. A look into the voltage plateau signal for detection and quantification of lithium plating in lithium-ion cells. J. Power Sources. 2018;395:251–261. doi: 10.1016/j.jpowsour.2018.05.073. [DOI] [Google Scholar]
- 50.Deng D. Li-ion batteries: basics, progress, and challenges. Energy Sci. Eng. 2015;3:385–418. doi: 10.1002/ese3.95. [DOI] [Google Scholar]
- 51.Zhao X., Yin Y., Hu Y., Choe S.Y. Electrochemical-thermal modeling of lithium plating/stripping of li (ni0.6mn0.2co0.2) o2/carbon lithium-ion batteries at subzero ambient temperatures. J. Power Sources. 2019;418:61–73. doi: 10.1016/j.jpowsour.2019.02.001. [DOI] [Google Scholar]
- 52.Chen C.-H., Brosa Planella F., O’Regan K., Gastol D., Widanage W.D., Kendrick E. Development of experimental techniques for parameterization of multi-scale lithium-ion battery models. J. Electrochem. Soc. 2020;167 doi: 10.1149/1945-7111/ab9050. [DOI] [Google Scholar]
- 53.Sulzer V., Marquis S.G., Timms R., Robinson M., Chapman S.J. Python battery mathematical modelling (pybamm) J. Open Res. Soft. 2021;9:14. doi: 10.5334/jors.309. [DOI] [Google Scholar]
- 54.Edge J.S., O’Kane S., Prosser R., Kirkaldy N.D., Patel A.N., Hales A., Ghosh A., Ai W., Chen J., Yang J., et al. Lithium ion battery degradation: what you need to know. Phys. Chem. Chem. Phys. 2021;23:8200–8221. doi: 10.1039/D1CP00359C. [DOI] [PubMed] [Google Scholar]
- 55.Sah B., Kumar P. An insight into battery degradation for a proposal of a battery-friendly charging technique. Energy Adv. 2023 doi: 10.1039/D3YA00275F. [DOI] [Google Scholar]
- 56.Zhang S., Yang G., Liu S., Li X., Wang X., Wang Z., Chen L. Understanding the dropping of lithium plating potential in carbonate electrolyte. Nano Energy. 2020;70 doi: 10.1016/j.nanoen.2020.104486. [DOI] [Google Scholar]
- 57.Janakiraman U., Garrick T.R., Fortier M.E. Review-lithium plating detection methods in li-ion batteries. J. Electrochem. Soc. 2020;167 doi: 10.1149/1945-7111/abd3b8. [DOI] [Google Scholar]
- 58.Koleti U.R., Rajan A., Tan C., Moharana S., Dinh T.Q., Marco J., Radhakrishnan K.N. A study on the influence of lithium plating on battery degradation. Energies. 2020;13:3458. doi: 10.3390/en13133458. [DOI] [Google Scholar]
- 59.Snyder C.M. Sandia National Lab. (SNL-NM); 2016. The Rate Dependency of Li-Ion Battery Degradation Mechanisms.https://www.osti.gov/servlets/purl/1347641 No. SAND2016-2339PE, Technical Report. [Google Scholar]
- 60.Snyder C. Rensselaer Polytechnic Institute; 2016. The Effects of Charge/discharge Rate on Capacity Fade of Lithium-Ion Batteries (PhD Thesis)https://ui.adsabs.harvard.edu/abs/2016PhDT.......260S [Google Scholar]
- 61.Ma S., Jiang M., Tao P., Song C., Wu J., Wang J., Deng T., Shang W. Temperature effect and thermal impact in lithium-ion batteries: A review. Prog. Nat. Sci. Mater. Int. 2018;28:653–666. doi: 10.1016/j.pnsc.2018.11.002. [DOI] [Google Scholar]
- 62.Nyman A., Behm M., Lindbergh G. Electrochemical characterisation and modelling of the mass transport phenomena in LiPF6–EC–EMC electrolyte. Electrochim. Acta. 2008;53:6356–6365. doi: 10.1016/j.electacta.2008.04.023. [DOI] [Google Scholar]
- 63.Mussa A.S., Liivat A., Marzano F., Klett M., Philippe B., Tengstedt C., Lindbergh G., Edström K., Lindström R.W., Svens P. Fast-charging effects on aging for energy-optimized automotive lini1/3mn1/3co1/3o2/graphite prismatic lithium-ion cells. J. Power Sources. 2019;422:175–184. doi: 10.1016/j.jpowsour.2019.02.095. [DOI] [Google Scholar]
- 64.Takahashi K., Srinivasan V. Examination of graphite particle cracking as a failure mode in lithium-ion batteries: a model experimental study. J. Electrochem. Soc. 2015;162:A635–A645. doi: 10.1149/2.0281504jes. [DOI] [Google Scholar]
- 65.Zhang Y., Zhao C., Guo Z. Simulation of crack behavior of secondary particles in Li-ion battery electrodes during lithiation/de-lithiation cycles. Int. J. Mech. Sci. 2019;155:178–186. doi: 10.1016/j.ijmecsci.2019.02.042. [DOI] [Google Scholar]
- 66.Li Q., Chen J., Fan L., Kong X., Lu Y. Progress in electrolytes for rechargeable Li-based batteries and beyond. Green Energy Environ. 2016;1:18–42. doi: 10.1016/j.gee.2016.04.006. [DOI] [Google Scholar]
- 67.Safari M., Morcrette M., Teyssot A., Delacourt C. Multimodal physics-based aging model for life prediction of Li-ion batteries. J. Electrochem. Soc. 2009;156:A145. doi: 10.1149/1.3043429. [DOI] [Google Scholar]
- 68.O’Kane S.E.J., Ai W., Madabattula G., Alonso-Alvarez D., Timms R., Sulzer V., Edge J.S., Wu B., Offer G.J., Marinescu M., Offer G.J. Lithium-ion battery degradation: how to model it. Phys. Chem. Chem. Phys. 2022;24:7909–7922. doi: 10.1039/D2CP00417H. [DOI] [PubMed] [Google Scholar]
- 69.Wang H., Zhu Y., Kim S.C., Pei A., Li Y., Boyle D.T., Wang H., Zhang Z., Ye Y., Huang W., et al. Underpotential lithium plating on graphite anodes caused by temperature heterogeneity. Proc. Natl. Acad. Sci. USA. 2020;117:29453–29461. doi: 10.1073/pnas.2009221117. [DOI] [PMC free article] [PubMed] [Google Scholar]
- 70.Harris S.J., Timmons A., Baker D.R., Monroe C. Direct in situ measurements of Li transport in Li-ion battery negative electrodes. Chem. Phys. Lett. 2010;485:265–274. doi: 10.1016/j.cplett.2009.12.033. [DOI] [Google Scholar]
- 71.Hein S., Latz A. Influence of local lithium metal deposition in 3D microstructures on local and global behavior of lithium-ion batteries. Electrochim. Acta. 2016;201:354–365. doi: 10.1016/j.electacta.2016.01.220. [DOI] [Google Scholar]
- 72.Legrand N., Knosp B., Desprez P., Lapicque F., Raël S. Physical characterization of the charging process of a li-ion battery and prediction of li plating by electrochemical modelling. J. Power Sources. 2014;245:208–216. doi: 10.1016/j.jpowsour.2013.06.130. [DOI] [Google Scholar]
- 73.Lin X., Khosravinia K., Hu X., Li J., Lu W. Lithium plating mechanism, detection, and mitigation in lithium-ion batteries. Prog. Energy Combust. Sci. 2021;87 doi: 10.1016/j.pecs.2021.100953. [DOI] [Google Scholar]
- 74.Doyle M., Fuller T.F., Newman J. Modeling of galvanostatic charge and discharge of the lithium/polymer/insertion cell. J. Electrochem. Soc. 1993;140:1526–1533. doi: 10.1149/1.2221597. [DOI] [Google Scholar]
- 75.Fuller T.F., Doyle M., Newman J. Simulation and optimization of the dual lithium ion insertion cell. J. Electrochem. Soc. 1994;141:1–10. doi: 10.1149/1.2054684. [DOI] [Google Scholar]
- 76.Newman J., Thomas-Alyea K.E. John Wiley & Sons; 2012. Electrochemical Systems. [Google Scholar]
- 77.Moura S.J., Argomedo F.B., Klein R., Mirtabatabaei A., Krstic M. Battery state estimation for a single particle model with electrolyte dynamics. IEEE Trans. Control Syst. Technol. 2017;25:453–468. doi: 10.1109/TCST.2016.2571663. [DOI] [Google Scholar]
- 78.Bizeray A.M., Kim J.-H., Duncan S.R., Howey D.A. Identifiability and parameter estimation of the single particle lithium-ion battery model. IEEE Trans. Control Syst. Technol. 2019;27:1862–1877. doi: 10.1109/TCST.2018.2838097. [DOI] [Google Scholar]
- 79.Guo M., Sikha G., White R.E. Single-particle model for a lithium-ion cell: Thermal behavior. J. Electrochem. Soc. 2011;158:A122. doi: 10.1149/1.3521314. [DOI] [Google Scholar]
- 80.Dey S., Ayalew B., Pisu P. 2014 13th International Workshop on Variable Structure Systems (VSS) 2014. Combined estimation of state-of-charge and state-of-health of li-ion battery cells using SMO on electrochemical model; pp. 1–6. [DOI] [Google Scholar]
- 81.Marquis S.G., Sulzer V., Timms R., Please C.P., Chapman S.J. 2019. An Asymptotic Derivation of a Single Particle Model with Electrolyte. [DOI] [Google Scholar]
- 82.Krzywinski M., Altman N. Two-factor designs. Nat. Methods. 2014;11:1187–1188. doi: 10.1038/nmeth.3180. [DOI] [PubMed] [Google Scholar]
Associated Data
This section collects any data citations, data availability statements, or supplementary materials included in this article.
Supplementary Materials
Data Availability Statement
-
•
The data reported in this paper will be shared by the lead contact upon request.
-
•
This paper does not report original code.
-
•
Any additional information required to reanalyze the data reported in this paper is available from the lead contact upon request.