

Summary
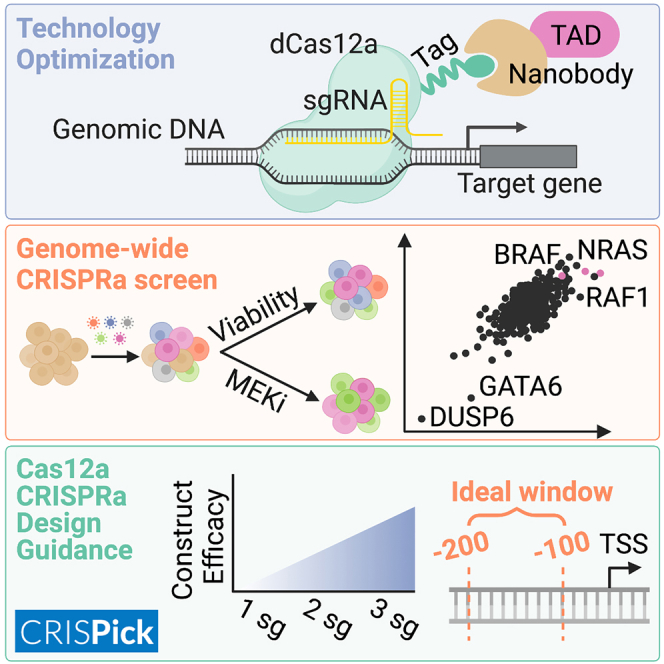
Cas12a CRISPR technology, unlike Cas9, allows for facile multiplexing of guide RNAs from a single transcript, simplifying combinatorial perturbations. While Cas12a has been implemented for multiplexed knockout genetic screens, it has yet to be optimized for CRISPR activation (CRISPRa) screens in human cells. Here, we develop a new Cas12a-based transactivation domain (TAD) recruitment system using the ALFA nanobody and demonstrate simultaneous activation of up to four genes. We screen a genome-wide library to identify modulators of growth and MEK inhibition, and we compare these results with those obtained with open reading frame (ORF) overexpression and Cas9-based CRISPRa. We find that the activity of multiplexed arrays is largely predictable from the best-performing guide and provide criteria for selecting active guides. We anticipate that these results will greatly accelerate the exploration of gene function and combinatorial phenotypes at scale.
Keywords: Cas12a, CRISPR activation, functional genomics, genetic screens
Graphical abstract
Highlights
-
•
Development of a nanobody-based recruitment system for Cas12a-based CRISPRa
-
•
Genome-wide CRISPRa screens reveal selumetinib-sensitizing and -resistance genes
-
•
Design guidance for multiplexed Cas12a CRISPRa
Cas12a allows for easy multiplexing of guide RNAs in a single construct. CRISPRa, in which transactivation domains are used to overexpress endogenous genes, has been optimized using Cas9 but not Cas12a. Griffith et al. optimize Cas12a-based CRISPRa and demonstrate that recruitment using the ALFA tag and a corresponding nanobody enables potent gene activation across multiple genes simultaneously. Then, they perform genome-wide Cas12a-based CRISPRa screens, compare results with screens using other technologies, and derive guidelines for library design.
Introduction
CRISPR technology was rapidly engineered to enable a range of genomic manipulations beyond gene knockout (CRISPRko), including at the level of transcription with gene activation (CRISPRa) and interference (CRISPRi).1,2 Building off prior studies with zinc fingers and transcription activator-like effectors (TALEs),3,4,5 Cas9-based CRISPRa approaches have employed transactivation domains (TADs) such as VP64 or P300 directly fused to deactivated Cas9 (dCas9).6,7 Additionally, the synergistic activation mediator (SAM) and Suntag systems recruit TADs in trans via motifs appended to the trans-activating CRISPR RNA (tracrRNA) and the dCas9, respectively.8,9 Heterologous combinations of TADs have also been developed, such as VPR(combines VP64, p65, and Rta10 domains), and recent studies have explored the landscape of potential TADs in high throughput.11,12,13
CRISPRa technology has been deployed for genome-wide genetic screens across a diversity of phenotypes. Comparison with matched CRISPRko and CRISPRi screens shows that CRISPRa does not simply provide the mirror image of depletion approaches but rather implicates many new genes, providing a fuller understanding of cellular circuitry.14,15 CRISPRa has its challenges, however, as certain TADs can lead to toxicity, as well as vary in their efficacy across different gene targets and cell lines,16 perhaps because endogenous promoters have differing cofactor requirements.17 Further, heterogeneity of transcription start site (TSS) usage and ambiguity in annotation across cell types,18 especially in less well-characterized model systems, can lead to a large number of ineffective reagents, decreasing the power and effective coverage of guide libraries.
Previously, we reported the optimization of an enhanced version of Cas12a from Acidaminococcus sp. (enAsCas12a, herein referred to simply as Cas12a) for some-by-some combinatorial knockout screens and genome-wide single-gene screens.19,20 This approach compares favorably to Cas9-based screens largely because several guides can be easily multiplexed in a single vector, resulting in a more compact library while still benefiting from numerous “shots on goal” for each gene. Further, the production of erroneous hybrid vectors due to lentiviral swapping is a significant concern for dual-Cas9 vectors, where such confounders can represent up to 29% of a pooled library.21,22,23 As the rate of swapping is dependent on the length of intervening regions of homology, this concern is minimized with the Cas12a architecture, as individual guides are separated by only a 20 nucleotide direct repeat (DR) compared with several hundred nucleotides in Cas9 guide cassettes. We and others have leveraged these advantages of Cas12a to explore synthetic lethality19,24 and paralog redundancy25,26 by targeting multiple genes simultaneously.
Design
Prior work with Cas12a for CRISPRa has shown that direct tethering of various TADs, including VPR, VP64, p65, and “Activ” (a set of three modified p65 domains along with HSF1) to dCas12a leads to varying levels of transcriptional activation.27 But as yet, there has been no demonstration of highly penetrant activity when delivering the components by lentivirus—that is, activation of a gene target in a large fraction of cells that receive the machinery—which is a prerequisite for effective genetic screens. Thus, we set out to develop Cas12a as a suitable approach for CRISPRa screens.
Results
Evaluation of existing Cas12a CRISPRa technologies
In an attempt to optimize a Cas12a CRISPRa system that would generalize well across multiple cell types, we assembled a panel of four cell lines, comprised of two melanoma lines (A375 and MelJuSo), one non-small cell lung cancer line (HCC2429), and one colorectal adenocarcinoma line (HT29). Each of the following experiments was done using one or more cell lines from this panel. To measure the activation efficiency of CRISPRa with Cas12a, we first required a guide targeting a gene whose expression could be readily assessed. We opted for a cell surface marker, as magnitude of effect across a population of cells could be measured via flow cytometry; unlike qRT-PCR, flow cytometry can distinguish between a small number of cells with substantial upregulation of a target gene or a large number of cells with a weaker response. We thus designed a small pooled library containing 10 guides targeting the cell surface marker CD4, which is poorly expressed in most cell lines, and 20 control guides targeting olfactory receptors. All guides were paired with one another in a single cassette to generate a dual-guide library. To identify candidate CD4 guides with strong activity, we screened this library in HCC2429 cells stably expressing Cas12a with a deactivating D908A mutation tethered to a modified version of the VPR TAD containing VP64, p65, and a shortened Rta domain.28 We observed a small fraction of cells expressing CD4 (1.8%) on day 10 following transduction and a general toxicity associated with the expression of VPR, which others have reported.16 Nevertheless, we performed flow cytometry and collected the CD4-expressing cell population and the middle 10% of the non-CD4-expressing population, from which we isolated genomic DNA, retrieved the guides using PCR, and sequenced to determine the abundance of guides in each population. Of the ten CD4-targeting guides in the library, one was clearly enriched in the positive population (Figure S1A). We chose this guide, along with another moderately performing guide, and paired them on a single expression cassette for future experiments.
Two different point mutations have been employed to deactivate the DNase activity of Cas12a, D908A and E993A, and we sought to compare their activity for CRISPRa purposes. We tested 12 CRISPRa implementations with each nuclease-inactive variant by appending different TADs at the N′ and C′ termini, with violet-excited GFP (VexGFP) as a transduction marker (Figure 1A). Five days after lentiviral transduction of the guides into HT29 cells, we assessed CD4 expression levels via flow cytometry; a representative example of the gating strategy is provided (Figure S1B). We observed that the D908A mutant consistently led to a higher fraction of CD4-positive cells (Figure 1B), and thus we employed this version (hereafter simply dCas12a) in all following experiments.
Figure 1.

Evaluation of existing Cas12a CRISPRa technologies
(A) Schematic depicting CD4-targeting direct-tether dCas12a CRISPRa vector architecture; EFS (shortened version of the human EF1a promoter).
(B) Comparison of 12 CRISPRa constructs employing two different nuclease-deactivating mutations of Cas12a. Activation was measured by the percentage of cells expressing CD4 5 days after transduction (left). CD4 mean fluorescence intensity (MFI) normalized to baseline expression shown for the 12 constructs with the D908A mutation (right).
(C) Schematic depicting overview of the flow cytometry-based tiling screen performed to identify additional active Cas12a CRISPRa guides.
(D) Z scores of LFCs for each guide across technological replicates are plotted by the location of the guide target site relative to the transcription start site (TSS) for CD4, CD26, CD97, and CD274. The smaller effect size of the two replicates is plotted to minimize false positives.
See also Figure S1.
We next attempted to identify the optimal combination of directly tethered TADs, the configurations of these TADs, and the location of nuclear localization sequences (NLSs). Using both the percentage of CD4-positive cells and the mean fluorescence intensity (MFI) of CD4 normalized to basal expression in HT29 cells, we compared activity of these 12 vectors. We observed no substantial differences in CD4 activation between constructs with the same TADs when the NLS was located either before or after the TAD on the C terminus (Figure 1B). We observed that the Activ domain led to lower levels of CD4 activation than the VP64 domain in every case. Additionally, tethering two VP64 domains to dCas12a moderately improved CRISPRa activity compared with a single VP64.
We selected the top two combinations of domains—one VP64 domain on the C terminus only or one VP64 domain on each terminus—for use in screens to identify additional effective guides. We also replaced the VexGFP marker with blasticidin resistance. We designed a library with numerous guides targeting the promoter regions of 13 genes coding for cell surface proteins (not all of which were assessed here). We transduced this library into both HT29 and A375 cells expressing dCas12a-VP64 or VP64-dCas12a-VP64, each in a single biological treatment, and compared the two dCas12a architectures (Figure 1C; Data S1). On day 15 post-transduction, we sorted A375 and HT29 cells for CD4 expression levels and HT29 for CD97 (ADGRE5). On day 19, we sorted both A375 and HT29 for CD274 and A375 cells for CD26 (DPP4), collecting the top 1% and bottom 5% of the population. After sample processing and sequencing, we calculated the fold change between the log-normalized read counts of guides (log2 fold change [LFC]) in the high- and low-expressing populations, and Z scored these values relative to non-targeting control guides. The two dCas12a architectures were generally poorly correlated (Figure S1C), likely reflecting few true hits as well as noise associated with flow cytometry, especially relative to viability screens.29 To mitigate false positives, we took the minimum positive or negative Z score for each guide across the two dCas12a vectors instead of the average.
We saw stronger enrichment of guides screened in HT29 cells and noted that guide activity varied by gene and by cell line throughout the region [−300 to +300] relative to the annotated TSS (Figure 1D). Notably, the most enriched CD4-targeting guide identified in this screen was the same guide that was most enriched in the initial CD4-targeting screen (Figure S1A). Active guides were rare, and further optimization of this system is thus required before Cas12a CRISPRa can be implemented broadly for genetic screens.
Nanobody-based recruitment improves CRISPRa activity
We next attempted to improve Cas12a CRISPRa potency and consistency with a TAD-recruitment approach. Increased levels of activation with dCas9 has been achieved with recruitment-based systems, such as SAM and Suntag, which increase the local concentration of TADs and afford more spatial flexibility.8,9 The SAM system has been widely used for activation purposes, including in genome-wide studies, but it does not translate readily to Cas12a technology, as the DR sequence, functionally analogous to the tracrRNA, is much less amenable to modification. We opted for a nanobody-based system to recruit TADs to dCas12a, employing the ALFA tag, a 13 amino acid sequence, and the 14 kDa ALFA nanobody to colocalize linked proteins with high binding affinity.30 This approach is conceptually similar to the Suntag system but with the added benefit of a smaller size, as the Suntag scFv-GCN4 is 26 kDa.9 Additionally, both the ALFA tag and nanobody are entirely artificial sequences, ensuring that they do not have endogenous targets in commonly studied organisms, including human and mouse.
We engineered two sets of CRISPRa vectors with (1) dCas12a linked to one or more ALFA tags (hereafter, “tag”) and (2) an ALFA nanobody (hereafter, “nanobody”) linked to one or more TADs (Figure 2A). The latter vectors also contain the two CD4-targeting guides identified above. We assembled five vectors with either 1, 3, or 5 tags in tandem on the N terminus (N′) of dCas12a or 1 or 3 tags on the C terminus (C′), as well as three vectors with either the VP64, the Activ, or the p65 TAD linked to the nanobody. The 15 combinations of these vectors were tested in three cell lines: HT29, A375, and HCC2429. We observed a range of CRISPRa activity across cell lines and vector combinations, with HT29 showing the highest levels of CD4 activation (Figure 2B; Data S2). We again saw that Activ induced minimal levels of CD4 activation, while VP64 and p65 both activated CD4 under several conditions.
Figure 2.

Nanobody recruitment improves CRISPRa activity
(A) Schematic representing dCas12a nanobody-based recruitment of the transactivation domain (top). Plasmid maps depicting one vector containing the ALFA tag fused to dCas12a and a second vector containing the ALFA nanobody, TAD, and targeting guide (bottom).
(B) Heatmaps displaying comparative performance between the p65, VP64, and Activ TADs when recruited via nanobody to dCas12a with increasing numbers of ALFA tags (1×, 3×, 5×) at either the N or the C terminus (N′ or C′). Variable vector components are indicated by dashed lines. Experiments conducted in HT29, HCC2429, and A375 cell lines. Color scale reflects levels of normalized MFI of CD4 expression within each cell line.
(C) Bar plot illustrating combinatorial effects emerging from the direct tethering of TADs to the N terminus of dCas12a and nanobody-based recruitment of varying TAD configurations to the N and/or C termini in HT29 cells. The x axis shows normalized MFI values of CD4 expression on a log10 scale.
(D) Bar plot comparing CRISPRa activity when a nanobody-TAD combination is recruited to the N′ or C′ terminus of Cas12a tethered to VP64 (N′ 5× tag, C′ 5× tag). Normalized CD4 MFI values are shown for three cell lines (A375, HT29, and HCC2429).
See also Figure S2.
Contemporaneous with the above experiments, we varied the number and location of the TADs within the nanobody vector. We assembled 12 nanobody constructs containing the CD4 guides and various configurations of the VP64, Activ, and p65 TADs. We tested these when paired with three dCas12a vectors with a C′ 3× tag with either the VP64 or p65 TAD or with no TAD tethered to the N terminus. We assessed these 36 combinations in HT29 cells and saw a wide range of activity, with normalized MFIs ranging from 1- to 226-fold activation. We observed that nanobody vectors with only one TAD on the C′ terminus generally performed better than nanobody vectors with TADs on both the N′ and C′ termini. Further, nanobody-VP64 performed best when paired with dCas12a and VP64-dCas12a, while nanobody-p65 performed best with VP64-dCas12a. Finally, nanobody-p65 led to the highest average activation of CD4 across all three dCas12a vectors when compared with the 11 other nanobody configurations (Figure 2C). We then compared this combination to the best direct-tether vector, VP64-dCas12a-VP64, again in HT29 cells (Figure S2A). We observed that both approaches led to >85% of cells with CD4 expression, but the nanobody approach led to a 226-fold increase in MFI compared with 16.9 for direct tethering, a 13-fold difference.
We next tested three additional nanobody vectors that deliver the bipartite TAD p65-HSF1, used in the SAM system, either alone or in addition to VP64 or p65. We directly compared the performance of the previous top activator, nanobody-p65, to these three new vectors when paired with VP64-dCas12a-3×-tag in HT29 cells and saw a small increase in normalized CD4 MFI with recruitment of nanobody-p65-HSF1 compared with nanobody-p65 (Figure S2B). We also assessed the effect of including an additional NLS on the C terminus of nanobody-p65 and observed modestly improved CRISPRa efficiency (Figure S2C). Finally, we generated a C′ 5× tag construct to compare with the N′ 5× tag and found the N-terminal location to be preferable across the three TADs tested across three cell lines, although the use of the p65-HSF1 activator showed toxicity in A375 cells (Figure 2D).
In this series of experiments, we tested several dozen combinations of ALFA tag positions and numbers, TADs directly tethered to dCas12a, and combinations of TADs recruited via the ALFA nanobody. We note that we did not test all possible combinations, and those assayed relied entirely on the activation of one gene, CD4. We chose to move forward with a single dCas12a vector, 5×-tag-dCas12a-VP64 (Figure S2A), as well as three nanobody vectors—nanobody-VP64, nanobody-p65, and nanobody-p65-HSF1—for additional experiments to understand how these results generalize across other target genes and cell types.
Effective multiplexing with nanobody-based systems
Returning to the tiling screens described above (Figure 1C), we generated vectors to activate CD4, CD97, CD26, and CD274. For each gene, we selected three guides that showed activity in at least one cell line, ensuring that the target sites for the selected guides did not overlap. We multiplexed all three guides targeting a single gene into one construct and, for each, assembled three vectors containing the nanobody and either VP64, p65, or p65-HSF1, for a total of 12 unique vectors (Figure 3A). We then transduced each vector in duplicate into HT29, A375, and HCC2429 cells stably expressing 5×-tag-dCas12a-VP64 and selected for guide delivery with puromycin for 5 days. We again observed a severe growth effect with the nanobody-p65-HSF1 constructs in A375 cells and thus eliminated them from the remainder of the experiment.
Figure 3.

Effective multiplexing with a nanobody-based system
(A) Schematic depicting single-gene targeting guide cassette architecture (top). Histograms show expression levels of CD4 (APC), CD274 (APC), CD97 (FITC), and CD26 (FITC) in HT29, A375, and HCC2429 cells expressing 5×-tag-dCas12a-VP64 when targeted individually by three guides per gene paired with nanobody-VP64, nanobody-p65, or nanobody-p65-HSF1 (bottom). Data from one representative replicate shown; data for all replicates are included in Data S2.
(B) Schematic depicting multiplexed targeting guide cassette architecture (top). Heatmaps of normalized MFI values for CD26, CD4, CD97, and CD274 in HT29, A375, and HCC2429 cells expressing 5×-tag-dCas12a-VP64 when targeted simultaneously by one guide per gene paired with different TADs, same as those used in (A). MFI values were normalized to basal expression within each cell line/gene combination, as in the color scale (bottom).
(C) Comparison of RNA expression levels across samples expressing 5×-tag-dCas12a-VP64 and either nanobody-VP64 or nanobody-p65 with or without three CD4-targeting guides. Shrunken LFC in the CD4-targeting population is plotted against mean normalized read counts of all replicates for baseline expression (n = 3).
See also Figure S3.
Seven days after guide transduction, we assessed activity by flow cytometry. We observed varied activation across each gene, cell line, and nanobody-TAD vector (Figure 3A); this mirrors the prior results with Cas9-based activation that there is no completely generalizable CRISPRa technology.16 For example, CD26 expression was activated in HT29 cells, with a maximum fold increase in MFI of 16.4, but little activation was seen in either A375 or HCC2429 cells. For the remaining three genes, the fold increase in activation ranged from 33.3 to 148.4 in HT29, 7.9 to 116.3 in A375, and 12.4 to 149.8 in HCC2429, while the corresponding percentage-positive populations ranged from 97.8% to 100%, 60.9% to 95.6%, and 36.4% to 95.6%, respectively (Data S2). Whereas the nanobody-p65 vector consistently achieved the highest level of activation across all genes in A375 and HCC2429 cells, this trend did not hold for HT29. Instead, we observed that the highest expression of each gene was achieved with a different TAD: p65-HSF1 for CD4 and CD274, p65 for CD26, and VP64 for CD97. Although no single nanobody-TAD vector consistently led to highest activity, all TADs, genes, and cell lines showed activation in at least one setting.
Next, we tested the combinatorial capabilities of these nanobody-based Cas12a activation approaches by generating three new guide cassettes that contained one guide for each of the four cell surface genes (Figure 3B). We then paired the guide cassettes with the three nanobody-TAD vectors as before (VP64, p65, and p65-HSF1) in the same cell lines (HT29, A375, HCC2429) expressing 5×-tag-dCas12a-VP64. We analyzed all four surface markers via flow cytometry 9 days following transduction and puromycin selection. Once again, A375 cells with the p65-HSF1 TAD died, suggesting that this cell line may be particularly sensitive to the expression of HSF1 and that this TAD may not be suitable for all-purpose CRISPRa approaches, at least with the strong EFS promoter used for TAD expression in this experiment.
In HT29 cells, the top construct activated all four markers, with average fold increases in MFI ranging from 7.7 to 608.4 when paired with the p65 TAD. We saw the strongest activation of CD4, CD26, and CD274 with the guide cassette containing the top guides, while the strongest activation of CD97 was achieved with the cassette containing its third-ranked guide. As we observed when targeting each gene individually, we were unable to achieve CD26 activation in A375 or HCC2429 with any of the guide combinations (Figure 3B). Although the TAD that led to maximal activation varied by gene and by cell line, the nanobody-p65 construct showed the most generalizable activity.
We next sought to assess the specificity of the nanobody-based recruitment approach in anticipation of a large-scale screen. We performed bulk RNA sequencing (RNA-seq) on MelJuSo cells expressing 5×-tag-dCas12a-VP64 and nanobody-p65 or nanobody-VP64 with or without the cassette containing three CD4-targeting guides described above (Figure S3A). We used DESeq2 to perform differential gene analysis and shrunken LFC to measure differences in activity.31,32 We noted that CD4 was the most significantly upregulated gene in both comparisons, indicating good on-target efficacy for both CRISPRa systems (Figure 3C). In contrast, CD4 showed no evidence of upregulation in the absence of guides (Figure S3B). To gain insight into the relationship between gene expression and proximity to the target site, we examined all the genes within the ±500 kb region surrounding CD4, observing minimal differential expression of nearby genes (Figure S3C). Overall, these results show that these CRISPRa approaches have reasonable specificity.
Genome-wide activation with Cas12a
To assess how well these technologies extrapolate to additional gene targets, we designed a genome-wide library by varying several design parameters. First, guide sequences were generated to target either a window spanning [−300 to 0] or [−450 to 375] nucleotides relative to the annotated TSS (hereafter respectively referred to as “narrow” or “wide”). Six guides were chosen per targeting window and then divided into set A and set B, with three guides per cassette and with a spacing requirement of 40 or 80 nucleotides between guides for the narrow and wide windows, respectively. This resulted in 4 constructs per gene, and each sublibrary was cloned into two nanobody vectors containing either the p65 or the VP64 TAD (Figure 4A).
Figure 4.

Development of Cas12a genome-wide activation libraries
(A) Schematic representing dCas12a screening approach encompassing the “wide” [−450 to 375] and “narrow” [−300 to 0] targeting windows relative to the annotated TSS; each gene is targeted by 6 guides (3 in set A and 3 in set B). Both sets for the two targeting windows were tested with the p65 and VP64 nanobody approach.
(B) Scatterplot comparing the p65 and VP64 nanobody approaches in the viability arm (left) and selumetinib drug arm (right), with select genes highlighted. Pearson’s correlation coefficients are indicated.
(C) Venn diagrams showing overlapping top 100 genes between the dCas9, dCas12a, and ORF selumetinib modifier screens for resistance and sensitization.
See also Figure S4.
Each library was screened in duplicate in MelJuSo cells stably expressing 5×-tag-dCas12a-VP64 at a coverage of 1,000 cells per construct. Seven days post-transduction, each screen was split into two conditions: a viability arm and a modifier arm with the MEK inhibitor selumetinib to allow for comparisons to a previous activation screen using a Cas9 CRISPRa library.33 Samples were collected at day 21, and then guides were retrieved by PCR and sequenced. LFC values for the viability arm were derived by comparing the day 21 sample to sequencing of the plasmid DNA (pDNA) library. The modifier arm was assessed by comparing day 21 samples with and without selumetinib (Data S4). Replicate Pearson correlations ranged from (0.75 to 0.85) for the viability comparison and from (0.25 to 0.6) for selumetinib; lower correlations are expected for drug modifier screens due to relatively fewer genes likely involved in the phenotype and to noise associated with positive selection.
To identify scoring genes, we calculated construct-level Z scores relative to constructs targeting olfactory receptors (OR genes) and averaged the Z scores of the four constructs for each gene to calculate gene-level Z scores. The p65 and VP64 TADs performed similarly, with a Pearson correlation of 0.78 in the viability arm and of 0.57 in the selumetinib arm (Figures 4B and S4A). Using a cutoff of |Z score| >2, we identified 529 genes that scored across the selumetinib and viability arms with either VP64, p65, or both, with 53 more hits identified with p65 than with VP64 at that threshold. We averaged the Z scores across the two TADs for subsequent analyses.
Examining the viability arm, 208 genes scored with a Z score <−2 as negatively impacting cell proliferation. Three of the top five most-depleted genes were the cyclin-dependent kinase inhibitors CDKN1A, CDKN1C, and CDKN2C, which are well established as growth inhibitors based on their action on critical cell-cycle components (Figure 4B). Importantly, CDKN2A (which encodes p16INK4a and p14ARF) is deleted in MelJuSo cells34 and did not score, with a Z score of −0.1 (Figure S4B). Other top hits include the transcription factor JUNB, a member of the AP-1 family of transcription factors; MAP3K11, a Jun N-terminal kinase whose overexpression has previously been shown to inhibit the proliferation of B cells35; and PRDM1 (also known as BLIMP-1), a critical transcription factor in B cell, T cell, and myeloid lineages (Figure 4B). Few genes scored as enhancing proliferation; only 7 genes scored with a Z score >2, and none scored with a Z score >3. That there are substantially more negative regulators of proliferation upon activation mirrors results seen previously with open reading frame (ORF)-based viability screens, which identified 103 STOP genes and only 3 GO genes that scored in common across three cell lines.36
Examining the selumetinib modifier screen, the top sensitizing hit was the phosphatase DUSP6, which aligns with a recent study showing that DUSP6 knockout (along with its paralog, DUSP4) hyperactivates the MAPK pathway.37 Activation of DUSP6, then, would be expected to downregulate the pathway and render the cells more sensitive to further inhibition by selumetinib. Another sensitizing hit was GATA6, which has been shown to be positively regulated by Erk phosphorylation,38 a result that was less obviously expected but that suggests the existence of a feedback loop or other regulatory logic downstream of activated Erk. On the resistance side, RAF1 (rank 1), NRAS (rank 5), and BRAF (rank 13) are all upstream of MEK, and thus their overexpression would be expected to buffer the effects of selumetinib (Figure 4B). Interestingly, neither gene encoding a MEK paralog scored (MAP2K1, Z score = 0.3; MAP2K2, Z score = −0.5), nor did the ERK paralogs (MAPK1, Z score = 0.5; MAPK3, Z score = 0.1). Whether these represent false negatives of the CRISPRa approach or a true reflection of pathway dynamics would require further testing. Many other top-scoring genes, however, have no clear connection to the MAPK pathway and thus represent a starting point for future studies of signaling and regulation.
Gold-standard reference sets of essential and non-essential genes39 have been critical to benchmark the performance of CRISPRko and CRISPRi libraries; however, no such parallel ground truth exists for genes expected to score in a viability screen upon overexpression. Comparison to ORF libraries represents a reasonable starting point, although there are substantive differences between this approach and CRISPRa; for example, the former will not recapitulate native splicing patterns or UTR-mediated regulation. Nevertheless, a gene that scores by both technologies is quite unlikely to represent a dual false positive, and thus ORF screens can inform assessment of CRISPRa approaches. We thus conducted both viability and selumetinib modifier screens with a genome-scale ORF library40,41 in MelJuSo cells as described above, harvesting cells on day 4 rather than relying on the pDNA to represent the starting library abundance due to the varied packaging efficiency of differently sized ORFs. LFC values for the viability arm were derived by comparing the day 21 sample with the day 4 sample, and the modifier arm was assessed by comparing day 21 samples with and without selumetinib. Pearson correlations across replicates were 0.66 for the viability arm and 0.44 for the selumetinib arm (Figure S4C).
We had also previously conducted screens in this model with the Cas9-based Calabrese library.33 10,351 genes were screened with all three modalities—ORF, Cas9, and Cas12a—and we examined the overlap of the top 100 hits from each (Figures 4C and S4D). In the selumetinib treatment arm, four genes scored as resistance hits across all screens, RAF1, EGFR, PDE3A, and WWTR1 (more commonly known as the transcriptional coactivator TAZ). For selumetinib sensitivity, DUSP4 scored with all three approaches, while 17 genes scored in two of the three, including DUSP6 and DUSP10, which scored with both ORF and Cas12a and likely represent false negatives of the Cas9 screen; conversely, DUSP9 did not score with Cas12a but did with Cas9 and ORF (Figure 4C). Overall, however, many genes scored uniquely to one modality. A systematic exploration of the features leading to false negatives with each technology is an important future direction, and the candidate genes identified here will be a valuable resource for such studies.
Validation of screen hits to learn rules for effective targeting
To understand design principles for Cas12a-based CRISPRa guides, we constructed a validation library, including all genes that scored as hits (|Z score| > 2) with either VP64 or p65 in the viability and selumetinib screens (n = 529; Figure S5A). We included the 3-guides-per-cassette designs used in the primary screen as well as all individual guides targeting these genes. For genes that reached the hit threshold with both TADs (n = 142), we tested all shuffled orders of the 3-guides-per-cassette design, as well as all pairwise combinations (Figure S5A).
This library was cloned into two nanobody vectors, containing either the p65 or the VP64 TAD. Each library was screened in duplicate in MelJuSo cells stably expressing 5×-tag-dCas12a-VP64 according to the same timeline as the primary screen. LFCs were calculated as before, and construct-level Z scores were calculated relative to intergenic controls. We first examined the reproducibility of the secondary screen by comparing the Z scores of the original triple-guide constructs in the primary and secondary screens and saw a Pearson correlation of 0.82 (Figure 5A; Data S5). Further, replicates and TADs were well correlated (Figure S5B), so we averaged the Z score between the two TADs for all subsequent analyses. We then selected a set of highest-confidence genes, defined as those that scored (|Z score| > 2) with both TADs in both the primary screen and the secondary screen, consisting of 9 genes from the viability arm and 11 from the selumetinib arm.
Figure 5.

Validation of primary screen hits to learn on rules for effective targeting
(A) Scatterplot of Z scores comparing all triple-guide constructs in both primary and secondary screens. Each triple-guide construct has Z scores calculated in four screen arms: VP64 viability, VP64 selumetinib, p65 viability, and p65 selumetinib (n = 8,416 constructs; 529 genes). Pearson’s correlation coefficient is indicated.
(B) Comparison of Z score distributions for single-, dual-, or triple-guide constructs targeting highest-confidence genes in the selumetinib arm: sensitizing genes (constructs = 291, left) and resistant genes (constructs = 347, right). Boxes show the quartiles (Q1 and Q3) as minima and maxima, and the center represents the median; whiskers show 1.5 times the interquartile range (Q1 − 1.5∗IQR and Q3 + 1.5∗IQR).
(C) Scatterplots of Z score between dual-guide and single-guides targeting highest-confidence selumetinib-sensitizing genes (number of dual guides = 120, left), selumetinib-resistant genes (number of dual guides = 144, middle), and growth-inhibitory genes (number of dual guides = 191, right). Pearson correlations of Z scores between dual guides and best-performing single guides and worst-performing single guides are highlighted in the top left and bottom right corners, respectively.
(D) enPAM+GB scores for single-guide constructs targeting the highest-confidence gene set, binned by Z score. There are 109 guides in the low active bin (|Z score| ≤ 1), 42 guides in the median active bin (1< |Z score| ≤ 2), and 51 guides in the highly active bin (|Z score| > 2). Boxes show the quartiles (Q1 and Q3) as minima and maxima, and the center represents the median; whiskers show 1.5 times the interquartile range (Q1 − 1.5∗IQR and Q3 + 1.5∗IQR).
(E) Fraction of guides in each activity bin for single-guide constructs targeting the highest-confidence gene set relative to MANE Select TSS.
(F) Fraction of guides in each activity bin for single-guide constructs targeting the highest-confidence gene set relative to MANE Select TSS and enPAM+GB (n = 202 constructs).
See also Figure S5.
We examined the efficacy of targeting with single-, dual-, or triple-guide constructs to assess the effectiveness of higher-order multiplexing using the highest-confidence gene set and found that triple-guide constructs performed the best (Figures 5B and S5C). Additionally, we found that the best performing single guide is much more predictive of the performance of dual-guide constructs than the worst performing single guide (Figure 5C). We then sought to understand whether the order of guides impacts performance. Using all shuffled triple-guide constructs, we determined pairwise Pearson correlation for all permutations and found the median correlation to be 0.81 for viability and 0.84 for selumetinib, demonstrating consistent construct performance regardless of guide order (Figure S5D).
Previously, we developed an on-target scoring approach for Cas12a based on activity in knockout screens, enPAM+GB,19 and we wanted to assess the predictive value of this score for CRISPRa. We thus binned single guides into high (|Z score| > 2), medium (|Z score| ≤ 2 and > 1), and low (|Z score| ≤ 1) activity bins and observed that highly active guides tended to have the highest on-target efficacy scores (Figure 5D). Additionally, we examined guide activity as a function of location relative to the TSS and observed more activity in the region upstream of the TSS (Figure 5E), as has been seen previously with Cas9-based CRISPRa.33,42 Finally, we sought to explore the interaction between enPAM+GB and the TSS window. We established a threshold based on the 25th percentile of enPAM+GB scores for highly active guides (enPAM+GB > 0.76), defined the optimal TSS window as 200 to 100 nucleotides upstream of the TSS, and created 4 bins based on these cutoffs. We observed that 56% of guides showed high activity in the bin with high enPAM+GB scores in the optimal TSS window compared with 17% across the other three bins (Figure 5F). This guidance on guide selection, coupled with the observation that a multi-guide construct largely mirrors the performance of the best-performing guide, enables the design of CRISPRa constructs that are likely to be effective.
Discussion
Overview
Here, we develop Cas12a for large-scale CRISPRa screens. We compare the performance of multiple activation approaches by linking the Cas protein to one or more commonly used TADs and show that a recruitment strategy with the ALFA nanobody and its complimentary ALFA tag enables a high fraction of cells to overexpress target genes when delivered by lentivirus, a prerequisite for pooled genetic screens. We then leverage the advantages of Cas12a over Cas9 to readily multiplex guides in a compact cassette and activate several genes simultaneously. Finally, we expand our understanding of Cas12a CRISPRa guide design considerations by screening a genome-wide library.
Limitations of the study
Our findings highlight that there is still much to be learned about effective approaches for CRISPRa and that there is not, as yet, a one-size-fits-all approach. For example, reagents that effectively activated CD97 in HT29 cells failed to do so in HCC2429 and A375 cells. Such observations are not limited to Cas12a-based approaches and have been well documented in prior studies with Cas9.16 This impression gleaned from small-scale study of individual genes is dramatically reinforced by the comparison of CRISPRa with ORF overexpression at genome scale, as many genes scored only via the latter approach. While some of those hits may represent false positives of the ORF screen, we suspect that the majority are false negatives of CRISPRa technology. In addition to the trivial explanation of poor guide selection, biological explanations include different TAD requirements across cell types, the presence of repressive chromatin or DNA marks, and differences in nuclear location that impact CRISPRa potential, among other explanations. These screens thus provide an important starting point to test these hypotheses; for example, one could deeply screen these candidate genes with TADs other than p65 and VP64, as well as domains that modulate the epigenome,43,44,45 and determine what strategies, if any, can best recoup these false negatives of current CRISPRa approaches.
Future directions
Several future directions are immediately enabled by the results and reagents described here, especially given the multiplexing capabilities of Cas12a. First, for genome-wide screens focused on individual genes, the false negative rate can be mitigated by targeting the same gene with multiple guides in the same vector, and we provide guidance on effective guide selection. The technology described here should likewise easily extend to combinatorial screens, such as activating multiple genes at their respective promoters, an approach that is extraordinarily useful to engineer cell types of interest and understand cell-fate decisions. Further, scalable combinatorial screens can enable dissection of the regulatory logic of the non-coding genome by jointly targeting potential enhancer elements and putative promoter targets.16,46 In sum, we have demonstrated methods for implementing Cas12a-based CRISPRa at scale in human cells.
STAR★Methods
Key resources table
| REAGENT or RESOURCE | SOURCE | IDENTIFIER |
|---|---|---|
| Antibodies | ||
| APC anti-human CD4 antibody | Biolegend | Cat#357408; RRID:AB_2565660 |
| FITC anti-human CD26 antibody | Biolegend | Cat#302704; RRID:AB_314288 |
| APC anti-human CD274 antibody | Biolegend | Cat#329708; RRID:AB_940360 |
| FITC anti-human CD97 antibody | Biolegend | Cat#336306; RRID:AB_1227609 |
| Chemicals, peptides, and recombinant proteins | ||
| Selumetinib | Selleckchem | Cat#AZD6244 |
| Benzonase (2000 U/mL) | Millipore Sigma | Cat#E1014 |
| Deposited data | ||
| Primary Cas12a CRISPRa library fastq files | This manuscript | SRA: PRJNA958239 |
| Secondary Cas12a CRISPRa validation library fastq files | This manuscript | GEO: GSE231789 |
| RNAseq fastq files | This manuscript | GEO: GSE230445 |
| Cas9 CRISPRa library fastq files | Sanson et al.33 | N/A |
| ORF library read counts | This manuscript | Data S4 |
| Original code | This manuscript | GitHub: https://doi.org/10.5281/zenodo.8088225 |
| Experimental models: Cell lines | ||
| A375 cells | Cancer Cell Line Encyclopedia | N/A |
| A549 cells | Cancer Cell Line Encyclopedia | N/A |
| HCC2429 cells | Cancer Cell Line Encyclopedia | N/A |
| HT29 cells | Cancer Cell Line Encyclopedia | N/A |
| MelJuSo cells | Cancer Cell Line Encyclopedia | N/A |
| HEK293T cells | ATCC | ATCC CRL-3216 |
| Oligonucleotides | ||
| Library Amplification Forward Primer 1: GTGTAACCCGTAGGGCACCT | This manuscript | N/A |
| Library Amplification Forward Primer 2: CAGCGCCAATGGGCTTTCGA | This manuscript | N/A |
| Library Amplification Forward Primer 3: CTACAGGTACCGGTCCTGAG | This manuscript | N/A |
| Library Amplification Forward Primer 4: CGACGTTATGGATCGACGCC | This manuscript | N/A |
| Library Amplification Reverse Primer 1: GTCGAAGGACTGCTCTCGAC | This manuscript | N/A |
| Library Amplification Reverse Primer 2: CGACAGGCTCTTAAGCGGCT | This manuscript | N/A |
| Library Amplification Reverse Primer 3: CGGATCGTCACGCTAGGTAC | This manuscript | N/A |
| Library Amplification Reverse Primer 4: AGGTGTCGCGGACTACTCAC | This manuscript | N/A |
| Recombinant DNA | ||
| pRDA_763 | This manuscript | Addgene #201156 |
| pRDA_816 | This manuscript | Addgene #201157 |
| pRDA_886 | This manuscript | Addgene #201162 |
| pRDA_887 | This manuscript | Addgene #201164 |
| pRDA_888 | This manuscript | Addgene #201165 |
| pLX_317 | The Broad Institute | https://portals.broadinstitute.org/gpp/public/vector/details?vector=pLX_TRC317 |
| Software and algorithms | ||
| PoolQ | The Broad Institute | https://portals.broadinstitute.org/gpp/public/software/poolq |
| STAR aligner | Dobin et al.47 | https://github.com/alexdobin/STAR |
| RNA-Seq by Expectation Maximization | Li and Dewey48 | http://deweylab.github.io/RSEM/ |
| DESeq2 v1.34.0 | Love et al.31 | https://bioconductor.org/packages/release/bioc/html/DESeq2.html |
| CRISPick | The Broad Institute | https://portals.broadinstitute.org/gppx/crispick/public |
| enPAM+GB | DeWeirdt et al.19 | N/A |
Resource availability
Lead contact
Further information and requests for resources and reagents should be directed to and will be fulfilled by the lead contact, John Doench (jdoench@broadinstitute.org).
Materials availability
The plasmids generated in this study that we recommend for general use have been deposited to Addgene:
pRDA_763 (Addgene #201156): EFS promoter expresses NLS, 5xALFA tag, dEnAsCas12a, NLS; T2A site provides blasticidin resistance.
pRDA_816 (Addgene #201157): EFS promoter expresses NLS, 5xALFA tag, dEnAsCas12a, VP64, NLS; T2A site provides blasticidin resistance.
pRDA_886 (Addgene #201162): U6 promoter expresses customizable Cas12a guide; EFS promoter expresses NLS, NbALFA, VP64, NLS; P2A site provides puromycin resistance.
pRDA_887 (Addgene #201164): U6 promoter expresses customizable Cas12a guide; EFS promoter expresses NLS, NbALFA, p65, NLS; P2A site provides puromycin resistance.
pRDA_888 (Addgene #201165): U6 promoter expresses customizable Cas12a guide; EFS promoter expresses NLS, NbALFA, p65, HSF1, NLS; P2A site provides puromycin resistance.
Additional constructs are available from the lead contact on request. Catalog numbers are listed in the key resources table.
Experimental model and subject details
Cell lines and culture
A375 (female), HCC2429 (female), HT29 (female), and MelJuSo (female) cells were obtained from the Cancer Cell Line Encyclopedia at the Broad Institute. HEK293Ts (female) were obtained from ATCC (CRL-3216).
All cells regularly tested negative for mycoplasma contamination and were maintained in the absence of antibiotics except during screens, flow cytometry-based experiments, and lentivirus production, during which media was supplemented with 1% penicillin-streptomycin. Cells were passaged every 2-4 days to maintain exponential growth and were kept in a humidity-controlled 37°C incubator with 5.0% CO2. Media conditions and doses of polybrene, puromycin, and blasticidin were as follows, unless otherwise noted:
A375: RPMI +10% fetal bovine serum (FBS); 1 μg/mL; 1 μg/mL; 5 μg/mL.
HCC2429: RPMI +10% FBS; 4 μg/mL; 2 μg/mL; 8 μg/mL.
HT29: DMEM +10% FBS, 1 μg/mL; 2 μg/mL; 8 μg/mL.
MelJuSo: RPMI +10% FBS; 4 μg/mL; 1 μg/mL; 4 μg/mL.
HEK293T: DMEM +10% heat-inactivated FBS; N/A; N/A; N/A.
Method details
CD4 CRISPRa library design
10 CD4-targeting guides and 20 guides targeting 20 individual olfactory receptor genes were selected using the guide design tool CRISPick. An additional 29 guides targeting CD45 were also selected, but these were not assessed in the manuscript. These guides were pre-filtered to exclude BsmBI recognition sites or poly-T sequences. Each of the 59 guides was placed in the first position and paired with all 58 remaining guides in the library at the second position, for a total of n = 3,422 unique vectors. The wild-type DR and DR_v2 (TAATTTCTACTATCGTAGAT) were used with the guides in the first and second position, respectively.
Cell surface marker tiling library design
Guide sequences for the tiling library were designed using sequence annotations from Ensembl (GRCh38). CRISPick was used to select every possible guide (using an NNNN PAM) against the longest annotated transcript for 17 genes: CD47, CD63, B2M, CD274, CD46, CD55, CD81, CSTB, CD4, CD26, CD97, CD59, BSG, LDLR, LRRC8A, PIGA, and TFRC. We included guides targeting the coding sequence, all guides for which the start was up to 30 nucleotides into the intron and UTRs, and all guides targeting the window 0–300 bp upstream of the annotated TSS. The library was filtered to exclude any guides with BsmBI recognition sites or TTTT sequences, and guides were annotated to denote the CRISPR technologies with which they were compatible (CRISPRko, CRISPRbe, CRISPRa and/or CRISPRi). Guides with >3 or >5 perfect matches in the genome for CRISPRko/CRISPRbe or CRISPRa/CRISPRi technologies, respectively, were also filtered out. Subsequently, a random 50% subsampling of the CRISPRko/be guides was removed from the library to decrease library size. 700 positive and negative control guides were added into the library, including 500 guides targeting intergenic regions, 100 non-targeting guides, and 100 guides targeting essential splice sites, for a total library size of n = 8,421.
CRISPRa genome-wide library design
Using CRISPick with sequence annotations from NCBI (GRCh38), we generated genome-wide tiling design files with narrow or wide regions around the TSS. NCBI incorporates MANE Select annotation for TSS location. “Narrow” is defined as the window 300 nucleotides upstream of the TSS to the TSS [-300 to 0]. “Wide” is defined as 450 nucleotides upstream of the TSS to 375 nucleotides downstream of the TSS [-450 to 375]. We filtered 382,820 guides with NAs in pick order and 10,000 or greater off-target sites for the narrow design and 1,129,916 guides for wide design. After filtering, 1,688,088 guides and 19,272 genes remained in the narrow design and 4,488,819 guides and 19,284 genes remained in the wide design. For each tiling genome-wide design file, guides were sorted by pick order within each gene and selected with a minimum spacing requirement of 40 nucleotides for the narrow design and 80 nucleotides for the wide design. This procedure was first applied to select three guides per vector for Set A and then repeated for Set B, resulting in 18,715 genes in narrow Set A, 18,715 genes in narrow Set B, 18,580 genes in wide Set A, and 18,580 genes in wide Set B. Each set was then cloned into the VP64 or p65 nanobody-TAD vectors.
CRISPRa secondary screen library design
The library consists of five parts. First, we identified the union of resistant hits (Z score >2) and sensitizing hits (Z score <-2) across VP64 and p65 for the viability and selumetinib arms, which totals 538 genes. There were 7 duplicated hit genes in the selumetinib sensitizing and viability sensitizing arms and 2 duplicated hit genes in the selumetinib resistant and viability sensitizing arms. We removed duplicates, which sums to 529 total genes (538 genes - 9 duplicates = 529 genes). We included each individual guide targeting these 529 genes as individual constructs in the secondary screen, totaling 5423 constructs with one guide per construct (2 TSS windows x 2 Sets(A/B) x 529 total hits x 3 guides - 925 duplicate guides). Second, we included the original triple guide construct targeting each of these 529 hits, totaling 2116 constructs (2 TSS windows x 2 Sets(A/B) x 529 total hits). Third, we identified overlapping hits between VP64 and p65 in the selumetinib resistance (Z score >2), selumetinib sensitizing (Z score <-2), viability resistance (Z score >2), and viability sensitizing (Z score <-2) directions, which sum to 142 genes. We included all possible permutations of triple guide constructs targeting these 142 genes, totaling 2840 constructs with three guides per construct (2 TSS windows x 2 Sets(A/B) x 142 overlapping hits x 5 permutations). Fourth, we targeted all of the overlapping hits in all possible permutations of double guide constructs, totaling 3408 constructs with two guides per construct (2 TSS windows x 2 Sets(A/B) x 142 overlapping hits x 6 permutations). Lastly, we included 1000 intergenic controls with 334 single guide controls, 333 double guide controls, and 333 triple guide controls. In total, the secondary library contains 14,787 constructs, which were then cloned into the nanobody-VP64 and nanobody-p65 vectors, resulting in a total of two secondary libraries.
ORF library
ORF screens used a pre-existing lentiviral ORF library consisting of 17,522 ORF constructs with barcodes cloned into pLX_317 as described.40,41 Immediately prior to transduction, lentivirus was treated with 2000 U/mL Benzonase (Millipore Sigma, Product No. E1014) in a buffer consisting of 50 mM Tris HCl (pH 8.0, Millipore Sigma, Product No. T2694-100ML), 1 mM MgCl2 (Millipore Sigma, Product No. M8787), and 100 μg/mL BSA (Millipore Sigma, Product No. A3294-10G) to remove residual pDNA contamination.21
Library production
Oligonucleotide pools were synthesized by Genscript. BsmBI recognition sites were appended to each guide sequence along with the appropriate overhang sequences (bold italic) for cloning into the guide expression vectors, as well as primer sites to allow differential amplification of subsets from the same synthesis pool. The final oligonucleotide sequence was thus: 5′-[forward primer]CGTCTCAAGAT[guide RNA]TTTTTTGAATCGAGACG[reverse primer].
Primers were used to amplify individual subpools using 25 μL 2x NEBnext PCR master mix (New England Biolabs), 2 μL of oligonucleotide pool (∼40 ng), 5 μL of primer mix at a final concentration of 0.5 μM, and 18 μL water. PCR cycling conditions: (1) 98°C for 30 s; (2) 53°C for 30 s; (3) 72°C for 30 s; (4) go to (1), x 24.
In cases where a library was divided into subsets, unique primers were used for amplification:
Primer Set; Forward Primer, 5′–3′; Reverse Primer, 5′–3′
1; GTGTAACCCGTAGGGCACCT; GTCGAAGGACTGCTCTCGAC.
2; CAGCGCCAATGGGCTTTCGA; CGACAGGCTCTTAAGCGGCT.
3; CTACAGGTACCGGTCCTGAG; CGGATCGTCACGCTAGGTAC.
4; CGACGTTATGGATCGACGCC; AGGTGTCGCGGACTACTCAC.
The resulting amplicons were PCR-purified (Qiagen) and cloned into the library vector via Golden Gate cloning with Esp3I (Fisher Scientific) and T7 ligase (Epizyme); the library vector was pre-digested with BsmBI (New England Biolabs). The ligation product was isopropanol precipitated and electroporated into Stbl4 electrocompetent cells (Invitrogen) and grown at 30°C for 16 h on agar with 100 μg/mL carbenicillin. Colonies were scraped and pDNA was prepared (HiSpeed Plasmid Maxi, Qiagen). To confirm library representation and distribution, the pDNA was sequenced.
Lentivirus production
For small-scale virus production, the following procedure was used: 24 h before transfection, HEK293T cells were seeded in 6-well dishes at a density of 1.5 × 10⁶ cells per well in 2 mL of DMEM +10% heat-inactivated FBS. Transfection was performed using TransIT-LT1 (Mirus) transfection reagent according to the manufacturer’s protocol. Briefly, one solution of Opti-MEM (Corning, 66.75 μL) and LT1 (8.25 μL) was combined with a DNA mixture of the packaging plasmid pCMV_VSVG (Addgene 8454, 125 ng), psPAX2 (Addgene 12260, 1250 ng), and the transfer vector (e.g., the library pool, 1250 ng). The solutions were incubated at room temperature for 20–30 min, during which time media was changed on the HEK293T cells. After this incubation, the transfection mixture was added dropwise to the surface of the HEK293T cells, and the plates were centrifuged at 1000 g for 30 min at room temperature. Following centrifugation, plates were transferred to a 37°C incubator for 6–8 h, after which the media was removed and replaced with DMEM +10% FBS media supplemented with 1% BSA. Virus was harvested 36 h after this media change.
A larger-scale procedure was used for pooled library production. 24 h before transfection, 18 × 106 HEK293T cells were seeded in a 175 cm2 tissue culture flask and the transfection was performed the same as for small-scale production using 6 mL of Opti-MEM, 305 μL of LT1, and a DNA mixture of pCMV_VSVG (5 μg), psPAX2 (50 μg), and 40 μg of the transfer vector. Flasks were transferred to a 37°C incubator for 6–8 h; after this, the media was aspirated and replaced with BSA-supplemented media. Virus was harvested 36 h after this media change.
Determination of antibiotic dose
In order to determine an appropriate antibiotic dose for each cell line, cells were transduced with the pRosetta or pRosetta_v2 lentivirus such that approximately 30% of cells were transduced and therefore EGFP+. At least 1 day post-transduction, cells were seeded into 6-well dishes at a range of antibiotic doses (e.g., from 0 μg/mL to 8 μg/mL of puromycin). The rate of antibiotic selection at each dose was then monitored by performing flow cytometry for EGFP+ cells. For each cell line, the antibiotic dose was chosen to be the lowest dose that led to at least 95% EGFP+ cells after antibiotic treatment for 7 days (for puromycin) or 14 days (for blasticidin).
Small molecule doses in pooled screens
For genome-wide primary and secondary screens in MelJuSo cells, selumetinib (Selleckchem, AZD6244) was diluted in DMSO and was screened at 1.5 μM, as done previously with a Cas9-based CRISPRa library.33
Determination of lentiviral titer
To determine lentiviral titer for transductions, cell lines were transduced in 12-well plates with a range of virus volumes (e.g., 0, 150, 300, 500, and 800 μL virus) with 3 × 10⁶ cells per well in the presence of polybrene. The plates were centrifuged at 640 x g for 2 h and were then transferred to a 37°C incubator for 4–6 h. Each well was then trypsinized, and an equal number of cells seeded into each of two wells of a 6-well dish. Two days post-transduction, puromycin was added to one well out of the pair. After 5 days, both wells were counted for viability. A viral dose resulting in 30–50% transduction efficiency, corresponding to an MOI of ∼0.35–0.70, was used for subsequent library screening.
Derivation of stable cell lines
In order to establish the dCas12a expressing cell line for the large-scale screens with the genome-wide libraries, MelJuSo cells were transduced with pRDA_816 (5x-tag-dCas12a-VP64), and successfully transduced cells were selected with blasticidin for a minimum of 2 weeks. Cells were taken off blasticidin at least one passage before transduction with libraries.
Pooled screens
For pooled screens, cells were transduced in two biological replicates with the lentiviral library. Transductions were performed at a low multiplicity of infection (MOI ∼0.5), using enough cells to achieve a representation of at least 1000 transduced cells per guide assuming a 20–40% transduction efficiency. Cells were plated in polybrene-containing media with 3 × 10⁶ cells per well in a 12-well plate. Plates were centrifuged for 2 h at 821 x g, after which 2 mL of media was added to each well. Plates were then transferred to an incubator for 4–6 h, after which virus-containing media was removed and cells were pooled into flasks. Puromycin was added 2 days post-transduction and maintained for 5 days to ensure complete removal of non-transduced cells. Upon puromycin removal, cells were split to any drug arms (each at a representation of at least 1,000 cells per guide) and passaged on drug every 2–3 days for an additional 2 weeks to allow guides to enrich or deplete; cell counts were taken at each passage to monitor growth.
Genomic DNA isolation and sequencing
Genomic DNA (gDNA) was isolated using the KingFisher Flex Purification System with the Mag-Bind Blood & Tissue DNA HDQ Kit (Omega Bio-Tek). The gDNA concentrations were quantitated by Qubit.
For PCR amplification, gDNA was divided into 100 μL reactions such that each well had at most 10 μg of gDNA. pDNA was also included at a maximum of 100 pg per well. Per 96-well plate, a master mix consisted of 150 μL DNA Polymerase (Titanium Taq; Takara), 1 mL of 10x buffer, 800 μL of dNTPs (Takara), 50 μL of P5 stagger primer mix (stock at 100 μM concentration), 500 μL of DMSO (if used), and water to bring the final volume to 4 mL. Each well consisted of 50 μL gDNA and water, 40 μL PCR master mix, and 10 μL of a uniquely barcoded P7 primer (stock at 5 μM concentration). PCR cycling conditions were as follows: (1) 95°C for 1 min; (2) 94°C for 30 s; (3) 52.5°C for 30 s; (4) 72°C for 30 s; (5) go to (2), x 27; (6) 72°C for 10 min. PCR primers were synthesized at Integrated DNA Technologies (IDT). PCR products were purified with Agencourt AMPure XP SPRI beads according to manufacturer’s instructions (Beckman Coulter, A63880), using a 1:1 ratio of beads to PCR product. Samples were sequenced on a HiSeq2500 HighOutput (Illumina) with a 5% spike-in of PhiX, using a custom oligo (oligo sequence: CTTGTGGAAAGGACGAAACACCGGT AATTTCTACTCTTGTAGAT).
Flow cytometry assays with VexGFP vectors
HT29 cells were transduced with virus for each of the guide+dCas12a-TAD-containing vectors separately; 5 days after transduction, cells were visualized by flow cytometry on a CytoFLEX S Sampler. To prepare samples for visualization, cells were stained with APC anti-human CD4 Antibody (Biolegend, 357408), diluted 1:100 for 20–30 min on ice.
Cells were washed with PBS two times to remove residual antibody and were resuspended in flow buffer (PBS, 2% FBS, 5 μM EDTA). CD4 signal was measured in the APC-A channel and VexGFP signal was measured in the K0525-A channel. Flow cytometry data were analyzed using FlowJo (v10.8.1). Cells were gated for VexGFP expression and APC gates were drawn such that ∼1% of cells score as APC-positive in the control condition (stained parental cells).
Flow cytometry assays with nanobody vectors
HT29, MelJuSo, HCC2429 and/or A375 cells were transduced with virus for each of the dCas12a-containing vectors separately; 2 days after transduction, cells were selected with blasticidin for 14 days. Blasticidin was removed for one passage and cells were subsequently transduced with virus for guide+nanobody-TAD-containing vectors. 2 days after transduction, cells were selected with puromycin for 5 days. Following selection, cells were visualized by flow cytometry on a CytoFLEX S Sampler at varying time points. To prepare samples for visualization, cells were stained with a fluorophore-conjugated antibody targeting the respective cell surface marker gene, diluted 1:100 for 20–30 min on ice.
CD4: APC anti-human CD4 antibody (Biolegend, 357408)
CD26 (DPP4): FITC anti-human CD26 antibody (Biolegend, 302704)
CD274: APC anti-human CD274 antibody (Biolegend, 329708)
CD97 (ADGRE5): FITC anti-human CD97 antibody (Biolegend, 336306)
Cells were washed with PBS two times to remove residual antibody and were resuspended in flow buffer (PBS, 2% FBS, 5 μM EDTA). Fluorophore signal was measured in the respective channel (APC-A or FITC-A). Flow cytometry data were analyzed using FlowJo (v10.8.1). Gates were set such that ∼1% of cells score as APC-positive or FITC-positive in the control condition (stained parental cells).
RNA sequencing
Cells were cultivated as normal in preparation for RNA sequencing. When cells reached confluency, they were scraped from their flasks using cell scrapers, with existing media still present. 10 mL serological pipettes were used to break up cell clumps and cell-containing media was transferred to conicals. Cell mixtures were counted using a Coulter Counter to ensure that each pellet contained >1e6 cells. Cells were then pelleted by centrifugation at 321 x g for 5 min. Media was aspirated, pellets were resuspended in PBS, and the PBS-cell mixture was aliquoted into Eppendorf tubes. Cells were pelleted once more by centrifugation in a table-top centrifuge at maximum speed for 2 min. The supernatant was aspirated and pellets were flash frozen on dry ice, then frozen at −80°C, and submitted to Genewiz from Azenta Life Sciences for RNA extraction and sequencing.
Quantification and statistical analysis
Screen analysis
Guide sequences were extracted from sequencing reads by running PoolQ (https://portals.broadinstitute.org/gpp/public/software/poolq). Reads were counted by alignment to a reference file of all possible guide RNAs present in the library. The read was then assigned to a condition (e.g., a well on the PCR plate) on the basis of the 8 nucleotide index included in the P7 primer. Following deconvolution, the resulting matrix of read counts was first normalized to reads per million within each condition by the following formula: read per guide RNA/total reads per condition x 1e6. Reads per million was then log2-transformed by first adding one to all values, which is necessary in order to take the log of guides with zero reads.
Prior to further analysis, we filtered out guides for which the log-normalized reads per million of the pDNA was >3 standard deviations from the mean. We then calculated the log2-fold-change between conditions. All dropout (no drug) conditions were compared to the pDNA; drug-treated conditions were compared to the time-matched dropout sample. We assessed the correlation between log2-fold-change (LFC) values of replicates. LFC values were then z-scored based on intergenic or non-targeting guide controls. In the case of the primary genome-wide screens, guides targeting olfactory receptors were used in place of intergenic or non-targeting controls for z-scoring.
RNA-seq analysis
RNA-seq was performed in triplicate for each experimental condition. Sequencing reads from Genewiz were aligned to the human Genome Reference Consortium Human Build 38 (hg38) using the STAR aligner.47 Transcript abundances were quantified using RNA-Seq by Expectation Maximization (RSEM).48 Genes were removed when the sum of all raw counts across replicates and samples was less than 10. Subsequently, differential expression was calculated using DESeq2 (v1.34.0) with shrunken LFC using apeglm.31
External datasets
CRISPRa Cas9 screens are from.33
Data visualization
Figures were created with Python3, RStudio, FlowJo 10.8.1, and GraphPad Prism (version 8). Schematics were created with BioRender.com.
Statistical analysis
All z-scores and correlation coefficients were calculated in Python. Q-values by the Storey-Tibshirani method are provided.49 We reported q-values for all genes and in each condition in Data S3. We calculated p values using 2∗pnorm(abs(Z score), mean = 0, sd = 1, lower.tail = False). We then used qvalue, a package developed by the Storey Lab (Github: https://github.com/StoreyLab/qvalue), to calculate q-values from p values.
In addition, we averaged z-scores across 8 sub-libraries for the selumetinib and viability arms to calculate p values. The averaged z-scores have mean of 0 and standard deviation of square root of 1/8. We employed RStudio’s function, 2∗pnorm(abs(Z score), mean = 0, sd = sqrt(1/8), lower.tail = False), to calculate p values from z-scores. We then used qvalue to calculate q-values from p values. The combined z-scores are also reported in Data S3.
Acknowledgments
We thank all members of the Genetic Perturbation Platform; Desiree Hernandez, Berta Escude Velasco, Monica Roberson, Eliezer Josue Ibarra, Pema Tenzing, Tashi Lokyitsang, and Xiaoping Yang for producing guide libraries and lentivirus; Olivia Bare, Yenarae Lee, and Quinton Celuzza for logistics support; Matthew Greene, Bronte Wen, Doug Alan, Mark Tomko, and Tom Green for software engineering support; the Broad Institute Genomics Platform Walk-up Sequencing group for Illumina sequencing; the Functional Genomics Consortium for funding support; and Sarah Weiss, Ryan Steger, Priyanka Roy, and Dany Gould for helpful discussions.
Author contributions
Conceived the study, J.G.D.; executed genetic screens, A.L.G., A.V.M., N.W.M., G.R., Z.M.S., F.G., I.N., and Y.V.L.; performed analyses, A.L.G., F.Z., and Z.M.S.; created visualizations, A.L.G., A.V.M., A.G., and F.Z.; designed libraries, J.G.D., F.Z., and M.H.; curated data, A.L.G. and F.Z.; wrote the manuscript, A.L.G., A.V.M., A.G., F.Z., and J.G.D.; supervised the project, J.G.D.
Declaration of interests
J.G.D. consults for Microsoft Research, Abata Therapeutics, Maze Therapeutics, BioNTech, Sangamo, and Pfizer. J.G.D. consults for and has equity in Tango Therapeutics. J.G.D. serves as a paid scientific advisor to the Laboratory for Genomics Research, funded in part by GSK, and the Innovative Genomics Institute, funded in part by Apple Tree Partners. J.G.D. receives funding support from the Functional Genomics Consortium: Abbvie, Bristol Myers Squibb, Janssen, Merck, and Vir Biotechnology. J.G.D.’s interests are reviewed and managed by the Broad Institute in accordance with its conflict-of-interest policies.
Published: September 1, 2023
Footnotes
Supplemental information can be found online at https://doi.org/10.1016/j.xgen.2023.100387.
Supplemental information
Data and code availability
Source data are provided with this paper. The read counts for all screening data, the mean fluorescence intensity values for all flow cytometry, and subsequent analyses are provided as Supplementary Data.
Fastq files for the primary library are deposited in the Sequence Read Archive (SRA) database. Fastq files for the validation library and RNA-seq experiments are deposited in the Gene Expression Omnibus (GEO) database. Accession numbers for all sets of data files are listed in the key resources table and all data are publicly available as of the date of publication.
All original code used for analysis and example notebooks are deposited on GitHub: https://github.com/gpp-rnd/Cas12a-CRISPRa-Manuscript. DOI is listed in the key resources table.
Any additional information required to reanalyze the data reported in this paper is available from the lead contact upon request.
References
- 1.Qi L.S., Larson M.H., Gilbert L.A., Doudna J.A., Weissman J.S., Arkin A.P., Lim W.A. Repurposing CRISPR as an RNA-guided platform for sequence-specific control of gene expression. Cell. 2013;152:1173–1183. doi: 10.1016/j.cell.2013.02.022. [DOI] [PMC free article] [PubMed] [Google Scholar]
- 2.Gilbert L.A., Larson M.H., Morsut L., Liu Z., Brar G.A., Torres S.E., Stern-Ginossar N., Brandman O., Whitehead E.H., Doudna J.A., et al. CRISPR-mediated modular RNA-guided regulation of transcription in eukaryotes. Cell. 2013;154:442–451. doi: 10.1016/j.cell.2013.06.044. [DOI] [PMC free article] [PubMed] [Google Scholar]
- 3.Beerli R.R., Dreier B., Barbas C.F., 3rd Positive and negative regulation of endogenous genes by designed transcription factors. Proc. Natl. Acad. Sci. USA. 2000;97:1495–1500. doi: 10.1073/pnas.040552697. [DOI] [PMC free article] [PubMed] [Google Scholar]
- 4.Perez-Pinera P., Ousterout D.G., Brunger J.M., Farin A.M., Glass K.A., Guilak F., Crawford G.E., Hartemink A.J., Gersbach C.A. Synergistic and tunable human gene activation by combinations of synthetic transcription factors. Nat. Methods. 2013;10:239–242. doi: 10.1038/nmeth.2361. [DOI] [PMC free article] [PubMed] [Google Scholar]
- 5.Maeder M.L., Linder S.J., Reyon D., Angstman J.F., Fu Y., Sander J.D., Joung J.K. Robust, synergistic regulation of human gene expression using TALE activators. Nat. Methods. 2013;10:243–245. doi: 10.1038/nmeth.2366. [DOI] [PMC free article] [PubMed] [Google Scholar]
- 6.Hilton I.B., D’Ippolito A.M., Vockley C.M., Thakore P.I., Crawford G.E., Reddy T.E., Gersbach C.A. Epigenome editing by a CRISPR-Cas9-based acetyltransferase activates genes from promoters and enhancers. Nat. Biotechnol. 2015;33:510–517. doi: 10.1038/nbt.3199. [DOI] [PMC free article] [PubMed] [Google Scholar]
- 7.Maeder M.L., Linder S.J., Cascio V.M., Fu Y., Ho Q.H., Joung J.K. CRISPR RNA–guided activation of endogenous human genes. Nat. Methods. 2013;10:977–979. doi: 10.1038/nmeth.2598. [DOI] [PMC free article] [PubMed] [Google Scholar]
- 8.Konermann S., Brigham M.D., Trevino A.E., Joung J., Abudayyeh O.O., Barcena C., Hsu P.D., Habib N., Gootenberg J.S., Nishimasu H., et al. Genome-scale transcriptional activation by an engineered CRISPR-Cas9 complex. Nature. 2015;517:583–588. doi: 10.1038/nature14136. [DOI] [PMC free article] [PubMed] [Google Scholar]
- 9.Tanenbaum M.E., Gilbert L.A., Qi L.S., Weissman J.S., Vale R.D. A protein-tagging system for signal amplification in gene expression and fluorescence imaging. Cell. 2014;159:635–646. doi: 10.1016/j.cell.2014.09.039. [DOI] [PMC free article] [PubMed] [Google Scholar]
- 10.Chavez A., Scheiman J., Vora S., Pruitt B.W., Tuttle M., P R Iyer E., Lin S., Kiani S., Guzman C.D., Wiegand D.J., et al. Highly efficient Cas9-mediated transcriptional programming. Nat. Methods. 2015;12:326–328. doi: 10.1038/nmeth.3312. [DOI] [PMC free article] [PubMed] [Google Scholar]
- 11.Tycko J., DelRosso N., Hess G.T., Banerjee A., Banerjee A., Mukund A., Van M.V., Ego B.K., Yao D., Spees K., et al. High-Throughput Discovery and Characterization of Human Transcriptional Effectors. Cell. 2020;183:2020–2035.e16. doi: 10.1016/j.cell.2020.11.024. [DOI] [PMC free article] [PubMed] [Google Scholar]
- 12.Alerasool N., Leng H., Lin Z.-Y., Gingras A.-C., Taipale M. Identification and functional characterization of transcriptional activators in human cells. Mol. Cell. 2022;82:677–695.e7. doi: 10.1016/j.molcel.2021.12.008. [DOI] [PubMed] [Google Scholar]
- 13.DelRosso N., Tycko J., Suzuki P., Andrews C., Aradhana M.,A., Mukund A., Liongson I., Ludwig C., Spees K., Fordyce P., et al. Large-scale mapping and mutagenesis of human transcriptional effector domains. Nature. 2023;616:365–372. doi: 10.1038/s41586-023-05906-y. [DOI] [PMC free article] [PubMed] [Google Scholar]
- 14.Leng K., Rose I.V.L., Kim H., Xia W., Romero-Fernandez W., Rooney B., Koontz M., Li E., Ao Y., Wang S., et al. CRISPRi screens in human iPSC-derived astrocytes elucidate regulators of distinct inflammatory reactive states. Nat. Neurosci. 2022;25:1528–1542. doi: 10.1038/s41593-022-01180-9. [DOI] [PMC free article] [PubMed] [Google Scholar]
- 15.Rebendenne A., Roy P., Bonaventure B., Chaves Valadão A.L., Desmarets L., Arnaud-Arnould M., Rouillé Y., Tauziet M., Giovannini D., Touhami J., et al. Bidirectional genome-wide CRISPR screens reveal host factors regulating SARS-CoV-2, MERS-CoV and seasonal HCoVs. Nat. Genet. 2022;54:1090–1102. doi: 10.1038/s41588-022-01110-2. [DOI] [PMC free article] [PubMed] [Google Scholar]
- 16.Tak Y.E., Horng J.E., Perry N.T., Schultz H.T., Iyer S., Yao Q., Zou L.S., Aryee M.J., Pinello L., Joung J.K. Augmenting and directing long-range CRISPR-mediated activation in human cells. Nat. Methods. 2021;18:1075–1081. doi: 10.1038/s41592-021-01224-1. [DOI] [PMC free article] [PubMed] [Google Scholar]
- 17.Bell C.C., Talarmain L., Scolamiero L., Lam E.Y.N., Ang C.-S., Gilan O., Dawson M.A. Transcription factors use a unique combination of cofactors to potentiate different promoter-dependent steps in transcription. bioRxiv. 2022 doi: 10.1101/2022.10.25.513774. Preprint at. [DOI] [Google Scholar]
- 18.Radzisheuskaya A., Shlyueva D., Müller I., Helin K. Optimizing sgRNA position markedly improves the efficiency of CRISPR/dCas9-mediated transcriptional repression. Nucleic Acids Res. 2016;44 doi: 10.1093/nar/gkw583. [DOI] [PMC free article] [PubMed] [Google Scholar]
- 19.DeWeirdt P.C., Sanson K.R., Sangree A.K., Hegde M., Hanna R.E., Feeley M.N., Griffith A.L., Teng T., Borys S.M., Strand C., et al. Optimization of AsCas12a for combinatorial genetic screens in human cells. Nat. Biotechnol. 2021;39:94–104. doi: 10.1038/s41587-020-0600-6. [DOI] [PMC free article] [PubMed] [Google Scholar]
- 20.Kleinstiver B.P., Sousa A.A., Walton R.T., Tak Y.E., Hsu J.Y., Clement K., Welch M.M., Horng J.E., Malagon-Lopez J., Scarfò I., et al. Engineered CRISPR-Cas12a variants with increased activities and improved targeting ranges for gene, epigenetic and base editing. Nat. Biotechnol. 2019;37:276–282. doi: 10.1038/s41587-018-0011-0. [DOI] [PMC free article] [PubMed] [Google Scholar]
- 21.Sack L.M., Davoli T., Xu Q., Li M.Z., Elledge S.J. Sources of Error in Mammalian Genetic Screens. G3. 2016;6:2781–2790. doi: 10.1534/g3.116.030973. [DOI] [PMC free article] [PubMed] [Google Scholar]
- 22.Hegde M., Strand C., Hanna R.E., Doench J.G. Uncoupling of sgRNAs from their associated barcodes during PCR amplification of combinatorial CRISPR screens. PLoS One. 2018;13 doi: 10.1371/journal.pone.0197547. [DOI] [PMC free article] [PubMed] [Google Scholar]
- 23.Replogle J.M., Bonnar J.L., Pogson A.N., Liem C.R., Maier N.K., Ding Y., Russell B.J., Wang X., Leng K., Guna A., et al. Maximizing CRISPRi efficacy and accessibility with dual-sgRNA libraries and optimal effectors. bioRxiv. 2022 doi: 10.1101/2022.07.13.499814. Preprint at. [DOI] [PMC free article] [PubMed] [Google Scholar]
- 24.Gier R.A., Budinich K.A., Evitt N.H., Cao Z., Freilich E.S., Chen Q., Qi J., Lan Y., Kohli R.M., Shi J. High-performance CRISPR-Cas12a genome editing for combinatorial genetic screening. Nat. Commun. 2020;11:3455. doi: 10.1038/s41467-020-17209-1. [DOI] [PMC free article] [PubMed] [Google Scholar]
- 25.Dede M., McLaughlin M., Kim E., Hart T. Multiplex enCas12a screens detect functional buffering among paralogs otherwise masked in monogenic Cas9 knockout screens. Genome Biol. 2020;21:262. doi: 10.1186/s13059-020-02173-2. [DOI] [PMC free article] [PubMed] [Google Scholar]
- 26.Li R., Klingbeil O., Monducci D., Young M.J., Rodriguez D.J., Bayyat Z., Dempster J.M., Kesar D., Yang X., Zamanighomi M., et al. Comparative optimization of combinatorial CRISPR screens. Nat. Commun. 2022;13:2469. doi: 10.1038/s41467-022-30196-9. [DOI] [PMC free article] [PubMed] [Google Scholar]
- 27.Campa C.C., Weisbach N.R., Santinha A.J., Incarnato D., Platt R.J. Multiplexed genome engineering by Cas12a and CRISPR arrays encoded on single transcripts. Nat. Methods. 2019;16:887–893. doi: 10.1038/s41592-019-0508-6. [DOI] [PubMed] [Google Scholar]
- 28.Vora S., Cheng J., Xiao R., VanDusen N.J., Quintino L., Pu W.T., Vandenberghe L.H., Chavez A., Church G. Rational design of a compact CRISPR-Cas9 activator for AAV-mediated delivery. bioRxiv. 2018 doi: 10.1101/298620. Preprint at. [DOI] [Google Scholar]
- 29.Doench J.G. Am I ready for CRISPR? A user’s guide to genetic screens. Nat. Rev. Genet. 2018;19:67–80. doi: 10.1038/nrg.2017.97. [DOI] [PubMed] [Google Scholar]
- 30.Götzke H., Kilisch M., Martínez-Carranza M., Sograte-Idrissi S., Rajavel A., Schlichthaerle T., Engels N., Jungmann R., Stenmark P., Opazo F., Frey S. The ALFA-tag is a highly versatile tool for nanobody-based bioscience applications. Nat. Commun. 2019;10:4403. doi: 10.1038/s41467-019-12301-7. [DOI] [PMC free article] [PubMed] [Google Scholar]
- 31.Love M.I., Huber W., Anders S. Moderated estimation of fold change and dispersion for RNA-seq data with DESeq2. Genome Biol. 2014;15:550. doi: 10.1186/s13059-014-0550-8. [DOI] [PMC free article] [PubMed] [Google Scholar]
- 32.Zhu A., Ibrahim J.G., Love M.I. Heavy-tailed prior distributions for sequence count data: removing the noise and preserving large differences. Bioinformatics. 2019;35:2084–2092. doi: 10.1093/bioinformatics/bty895. [DOI] [PMC free article] [PubMed] [Google Scholar]
- 33.Sanson K.R., Hanna R.E., Hegde M., Donovan K.F., Strand C., Sullender M.E., Vaimberg E.W., Goodale A., Root D.E., Piccioni F., Doench J.G. Optimized libraries for CRISPR-Cas9 genetic screens with multiple modalities. Nat. Commun. 2018;9:5416. doi: 10.1038/s41467-018-07901-8. [DOI] [PMC free article] [PubMed] [Google Scholar]
- 34.van der Meer D., Barthorpe S., Yang W., Lightfoot H., Hall C., Gilbert J., Francies H.E., Garnett M.J. Cell Model Passports-a hub for clinical, genetic and functional datasets of preclinical cancer models. Nucleic Acids Res. 2019;47 doi: 10.1093/nar/gky872. D923–D929. [DOI] [PMC free article] [PubMed] [Google Scholar]
- 35.Knackmuss U., Lindner S.E., Aneichyk T., Kotkamp B., Knust Z., Villunger A., Herzog S. MAP3K11 is a tumor suppressor targeted by the oncomiR miR-125b in early B cells. Cell Death Differ. 2016;23:242–252. doi: 10.1038/cdd.2015.87. [DOI] [PMC free article] [PubMed] [Google Scholar]
- 36.Sack L.M., Davoli T., Li M.Z., Li Y., Xu Q., Naxerova K., Wooten E.C., Bernardi R.J., Martin T.D., Chen T., et al. Profound Tissue Specificity in Proliferation Control Underlies Cancer Drivers and Aneuploidy Patterns. Cell. 2018;173:499–514.e23. doi: 10.1016/j.cell.2018.02.037. [DOI] [PMC free article] [PubMed] [Google Scholar]
- 37.Ito T., Young M.J., Li R., Jain S., Wernitznig A., Krill-Burger J.M., Lemke C.T., Monducci D., Rodriguez D.J., Chang L., et al. Paralog knockout profiling identifies DUSP4 and DUSP6 as a digenic dependence in MAPK pathway-driven cancers. Nat. Genet. 2021;53:1664–1672. doi: 10.1038/s41588-021-00967-z. [DOI] [PubMed] [Google Scholar]
- 38.Meng Y., Moore R., Tao W., Smith E.R., Tse J.D., Caslini C., Xu X.-X. GATA6 phosphorylation by Erk1/2 propels exit from pluripotency and commitment to primitive endoderm. Dev. Biol. 2018;436:55–65. doi: 10.1016/j.ydbio.2018.02.007. [DOI] [PMC free article] [PubMed] [Google Scholar]
- 39.Hart T., Chandrashekhar M., Aregger M., Steinhart Z., Brown K.R., MacLeod G., Mis M., Zimmermann M., Fradet-Turcotte A., Sun S., et al. High-Resolution CRISPR Screens Reveal Fitness Genes and Genotype-Specific Cancer Liabilities. Cell. 2015;163:1515–1526. doi: 10.1016/j.cell.2015.11.015. [DOI] [PubMed] [Google Scholar]
- 40.Yang X., Boehm J.S., Yang X., Salehi-Ashtiani K., Hao T., Shen Y., Lubonja R., Thomas S.R., Alkan O., Bhimdi T., et al. A public genome-scale lentiviral expression library of human ORFs. Nat. Methods. 2011;8:659–661. doi: 10.1038/nmeth.1638. [DOI] [PMC free article] [PubMed] [Google Scholar]
- 41.Rees M.G., Brenan L., do Carmo M., Duggan P., Bajrami B., Arciprete M., Boghossian A., Vaimberg E., Ferrara S.J., Lewis T.A., et al. Systematic identification of biomarker-driven drug combinations to overcome resistance. Nat. Chem. Biol. 2022;18:615–624. doi: 10.1038/s41589-022-00996-7. [DOI] [PubMed] [Google Scholar]
- 42.Horlbeck M.A., Gilbert L.A., Villalta J.E., Adamson B., Pak R.A., Chen Y., Fields A.P., Park C.Y., Corn J.E., Kampmann M., Weissman J.S. Compact and highly active next-generation libraries for CRISPR-mediated gene repression and activation. Elife. 2016;5 doi: 10.7554/eLife.19760. [DOI] [PMC free article] [PubMed] [Google Scholar]
- 43.Amabile A., Migliara A., Capasso P., Biffi M., Cittaro D., Naldini L., Lombardo A. Inheritable Silencing of Endogenous Genes by Hit-and-Run Targeted Epigenetic Editing. Cell. 2016;167:219–232.e14. doi: 10.1016/j.cell.2016.09.006. [DOI] [PMC free article] [PubMed] [Google Scholar]
- 44.Holtzman L., Gersbach C.A. Editing the Epigenome: Reshaping the Genomic Landscape. Annu. Rev. Genom. Hum. Genet. 2018;19:43–71. doi: 10.1146/annurev-genom-083117-021632. [DOI] [PubMed] [Google Scholar]
- 45.Nuñez J.K., Chen J., Pommier G.C., Cogan J.Z., Replogle J.M., Adriaens C., Ramadoss G.N., Shi Q., Hung K.L., Samelson A.J., et al. Genome-wide programmable transcriptional memory by CRISPR-based epigenome editing. Cell. 2021 doi: 10.1016/j.cell.2021.03.025. [DOI] [PMC free article] [PubMed] [Google Scholar]
- 46.Chardon F.M., McDiarmid T.A., Page N.F., Martin B., Domcke S., Regalado S.G., Lalanne J.B.Æ., Calderon D., Starita L.M., Sanders S.J., et al. Multiplex, single-cell CRISPRa screening for cell type specific regulatory elements. bioRxiv. 2023 doi: 10.1101/2023.03.28.534017. Preprint at. [DOI] [PMC free article] [PubMed] [Google Scholar]
- 47.Dobin A., Davis C.A., Schlesinger F., Drenkow J., Zaleski C., Jha S., Batut P., Chaisson M., Gingeras T.R. STAR: ultrafast universal RNA-seq aligner. Bioinformatics. 2013;29:15–21. doi: 10.1093/bioinformatics/bts635. [DOI] [PMC free article] [PubMed] [Google Scholar]
- 48.Li B., Dewey C.N. RSEM: accurate transcript quantification from RNA-Seq data with or without a reference genome. BMC Bioinf. 2011;12:323. doi: 10.1186/1471-2105-12-323. [DOI] [PMC free article] [PubMed] [Google Scholar]
- 49.Storey J.D., Tibshirani R. Statistical significance for genomewide studies. Proc. Natl. Acad. Sci. USA. 2003;100:9440–9445. doi: 10.1073/pnas.1530509100. [DOI] [PMC free article] [PubMed] [Google Scholar]
Associated Data
This section collects any data citations, data availability statements, or supplementary materials included in this article.
Supplementary Materials
Data Availability Statement
Source data are provided with this paper. The read counts for all screening data, the mean fluorescence intensity values for all flow cytometry, and subsequent analyses are provided as Supplementary Data.
Fastq files for the primary library are deposited in the Sequence Read Archive (SRA) database. Fastq files for the validation library and RNA-seq experiments are deposited in the Gene Expression Omnibus (GEO) database. Accession numbers for all sets of data files are listed in the key resources table and all data are publicly available as of the date of publication.
All original code used for analysis and example notebooks are deposited on GitHub: https://github.com/gpp-rnd/Cas12a-CRISPRa-Manuscript. DOI is listed in the key resources table.
Any additional information required to reanalyze the data reported in this paper is available from the lead contact upon request.