Abstract
Aim:
To examine computed tomography (CT) radiomic feature stability on various texture patterns during pre-processing utilizing the Credence Cartridge Radiomics (CCR) phantom textures.
Materials and Methods:
Imaging Biomarker Explorer (IBEX) expansion for the abbreviation IBEX extracted 51 radiomic features of 4 categories from 11 textures image regions of interest (ROI) of the phantom. 19 software pre-processing algorithms processed each CCR phantom ROI. All ROI texture processed image features were retrieved. Pre-processed CT image radiomic features were compared to non-processed features to measure its textural influence. Wilcoxon T-tests measured the pre-processing relevance of CT radiomic features on various textures. Hierarchical cluster analysis (HCA) was performed to cluster processer potency and texture impression likeness.
Results:
The pre-processing filter, CT texture Cartridge, and feature category affect the CCR phantom CT image’s radiomic properties. Pre-processing is statistically unaltered by Gray Level Run Length Matrix (GLRLM ) expansion for the abbreviation GLRLM and Neighborhood Intensity Difference matrix (NID) expansion for the abbreviation NID feature categories. The 30%, 40%, and 50% honeycomb are regular directional textures and smooth 3D-printed plaster resin, most of the image pre-processing feature alterations exhibited significant p-values in the histogram feature category. The Laplacian Filter, Log Filter, Resample, and Bit Depth Rescale Range pre-processing algorithms hugely influenced histogram and Gray Level Co-occurrence Matrix (GLCM) image features.
Conclusion:
We found that homogenous intensity phantom inserts, CT radiomic feature, are less sensitive to feature swaps during pre-processing than normal directed honeycomb and regular projected smooth 3D-printed plaster resin CT image textures. Because they lose fewer information during image enhancement, This feature concentration empowerment of the images also enhances texture pattern recognition.
Key Words: Image pre-processing, radiomics analysis, texture, Image enhancement, CT radiomics
Introduction
Recent advances in quantitative imaging (radiomics) traits are utilized to determine how well a tumor is benign or malignant (Bayanati et al., 2015). Radiomics is also renowned for characterizing tumor heterogeneity and phenotypes using high throughput quantified features derived from clinical standards of image-based biomarkers related to pathologic, genomic, proteomic, and clinical data (Lambin P et al., 2012). It is used as a predictive tool for clinical decision-making in detecting Non-small cell lung cancer (NSCLC) tumor genetic mutations (Weiss GJ et al., 2014). The response evaluates an early potential biomarker for therapy (Bertelsen et al., 2011; Bernchou et al., 2015). It is regarded as the most accurate radiomics trait for predicting distant metastasis in NSCLC patients (Coroller et al., 2015).
Given that radiomics may be collected noninvasively and at no extra expense at any point during the treatment procedure, it is envisaged that radiomics will play an important part in the present cancer care management workflow (Yip et al., 2016). However, the key concern and challenge for the clinical use of radiomics is the reproducibility and repeatability of its characteristics across multicenter (Lambin et al., 2017). Several factors namely image acquisition settings and techniques, image preprocessing algorithms, tumor segmentation influence the reliability and predictability outcome of radiomics. The majority of radiomics research on a specific element of radiomics reproducibility and repeatability was conducted in computed tomography (CT) and positron emission tomography (PET) modalities for limited cancer types (Zwanenburg et al.,2019; Bagher-Ebadian et al., 2017), with a few studies published in Magnetic resonance imaging (MRI) (Lecler et al., 2019).
The sturdiness of radiomic characteristics collected is heavily influenced by the image pre-processing parameters (Wichtmann et al., 2018; Altazi et al., 2017; Bailly et al., 2016; Leijenaar et al., 2015; Shafiq-ul-Hassan et al., 2017). The local binary descriptor employing gray scale data will necessitate a distinct set of pre-processing steps. The raw image data from the scanner contains a variety of noise during picture capture, which the image enhancement approach efficiently eliminates to improve the quality of input images. Some of the medical image data information may be lost during the enhancing pre-processing phases due to various filtering techniques; thus, careful evaluation of image pre-processing may have significant beneficial impacts on the quality of feature extraction and the outcomes of image analysis. Image pre-processing is similar to mathematical normalization of a data collection, which is a typical step in many feature descriptor algorithms.
To estimate feature stability, it is required to first discover which texture characteristics are prone to change during image preprocessing, as well as to examine whether the variations are present in each Cartridge texture. The Credence Cartridge Radiomics (CCR) phantom textures were pre-processed in this study. By using Imaging Biomarker Explorer (IBEX) free source software (available for free at http://bit.ly/IBEX MDAnderson), pre-processed and raw data were recovered from ten different cartridges and water. Texture features were compared to features taken from raw images to explore the pre-processing data stability using textures. The Wilcoxon signed-rank test was used to measure this connected sample. To determine the similarity relevance among the pre-processing filters and textures, a hierarchical cluster categorized using the p-value was used.
Materials and Methods
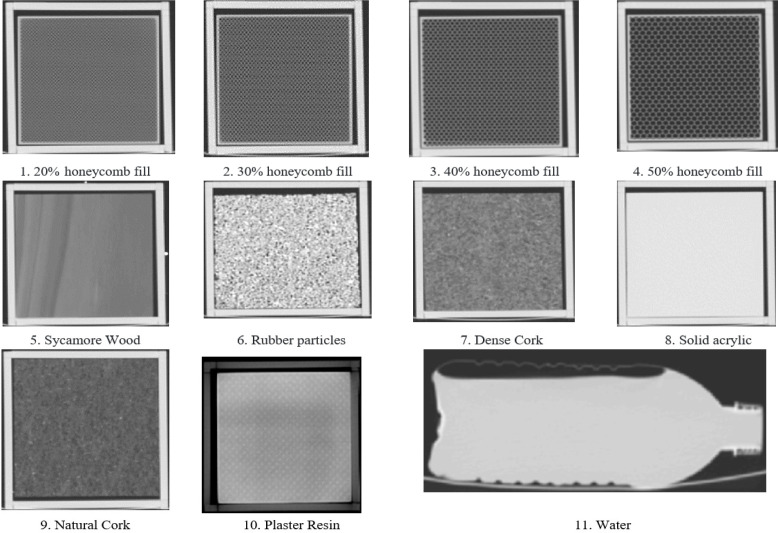
The phantom images used for this study were obtained from the publicly accessible Cancer Imaging Archive collection, which comprises of 17 CT scans of the CCR phantom-created for textural feature robustness tests. The CCR phantom is made up of ten cartridges, each of the size 10.1 x 10.1 x 3.2 cm3 with a different texture (Figures 1 and 2). The first four cartridges are 3D printed Acrylonitrile Butadiene Styrene (ABS) plastic with 20%, 30%, 40%, and 50% honeycomb fill which gives regular periodic textures. Natural textures are presented by the 5th, 7th, and 9th cartridges, which are sycamore wood, Dense cork, and natural cork, respectively. The 8th cartridge is made of solid, homogeneous acrylic similar to water. Water, on the other hand provides limited textural control in these scanned images. Finally, the 10th cartridge is 3D printed plaster Resin with the maximum electron density (400 – 600 HU) and is suitable for more demanding applications like bone.
Figure 1.
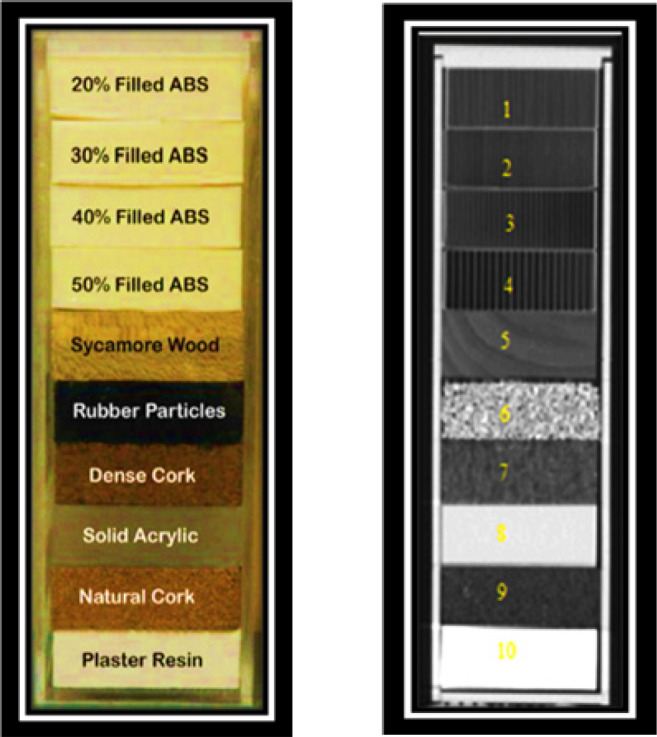
The 10 Cartridges of the CCR Radiomics Phantom (Courtesy Mackin et al., 2017)
Figure 2.
CCR Phantom. The first four cartridges are 3D printed ABS plastic with 20%, 30%, 40%, and 50% honeycomb fill, 5) Sycamore Wood ,6) Rubber particles,7) Dense Cork 8) Solid acrylic,9) Natural Cork,10) Plaster Resin 11) water
We had retrieved one image set of the 17 CCR phantom image sets from the TCIA manifest file sources. This image set was scanned using GE Discovery CT750 HD Helical scan of 2.5mm slice thickness, 0.49mm pixel size, spiral pitch factor 0.98, kVp 120, effective mAs 81, and standard kernel.
Quantitative image feature extraction and its definition
The CCR phantom image was imported into IBEX software in Digital Imaging and Communication in Medicine (DICOM) format. Using the IBEX graphical user interfaces (GUI) contouring option, each unique texture cartridge was marked as an area of interest (ROI). For the sources of texture feature extraction, delineated divided ROIs are regarded sub images. As seen in Table 1 the essential 11 ROIs cartridge features retrieved were not preprocessed and hence preprocessed utilizing IBEX software’s 19 preprocessing algorithms. As shown in Table 2, the four-feature category and its 51 feature extraction algorithms- 1) 13 Histogram Features are mere data signifiers based on the global gray level. Since these features are consisting of single-pixel or single-voxel analyses, they are called first-order features, 2) 11 Gray Level Run Length Matrix (GLRLM) reveals the spatial distribution of runs of successive pixels with the same gray level, in one or more directions, 3) 22 Gray Level Co-occurrence Matrix (GLCM) is a second-order gray-level histogram. GLCM captures spatial relationships of pairs of pixels or voxels with predefined gray-level intensities, in different directions, and 4) 5 Neighborhood Intensity Difference matrix (NID) determines the sum of differences between the gray level of a pixel or voxel and the average gray level of its neighboring pixels or voxels within a predetermined spacing. The 51 features chosen can be generated for a range of functions, including tumor diagnostics, tumor staging, gene prediction, and outcome prediction.
Table 1.
The Image Pre-Processor Used in the Study Hypen Its Purposes, the Filter Name, and Its Description
| processing Purpose | Preprocessing filters | Description |
|---|---|---|
| Image smoothing | Average Smooth | Average filter comes in the classification of windowed filter of linear class which are used to remove noise and smoothing images. The concept works on averaging the neighbours of any element of the image. 2D averaging filter in slice-by-slice. Kernal is a square matrix. |
| Edge Preserve_Smooth3D | Anisotropic diffusion smoothing and edge enhancement in 3D. | |
| Gaussian Smooth | Gaussian filters are a class of linear smoothing filters with the weights chosen according to the shape of a Gaussian function. The Gaussian smoothing filter is a good filter for removing noise drawn from a normal distribution. 2D Gaussian smoothing in slice-by-slice. | |
| Gaussian_Smooth3D | Gaussian filters are a class of linear smoothing filters with the weights chosen according to the shape of a Gaussian function. The Gaussian smoothing filter is a good filter for removing noise drawn from a normal distribution. Gaussian smoothing in 3D. | |
| Median Smooth | Median filter is a nonlinear filtering technique also used to remove noise and smoothing images unlike mean filter it preserves useful details in the image 2D median filter in slice-by-slice. | |
| Wiener Smooth | The Wiener filter is the mean squared error optimal linear filter for blurred images and images contaminated with additive noise. This filter requires the information about the spectra of the noise and the original signal. This method is to delur the image using 2D pixel wise adaptive wiener filter in slice-by-slice. | |
| Image enhancement |
AdaptHistEqualization_Enhance3D | Adaptive histogram equalization is a technique used for contrast improvement. It computes several histograms corresponding to distinct image sections and then uses these sections of images to redistribute brightness value of the image. This method is to perform adaptive histogram equalization in 3D. |
| Histogram Equalization Enhance | This method is to perform 3D contrast enhancement using histogram equalization. | |
| Image deblur | Blind Deblur | This method is to delur image using blind deconvolution. |
| Gaussian Deblur | This method is to deblur 2D image using Lucy-Richardson method and Gaussian PSF in slice-by-slice. | |
| Change enhancement |
Laplacian Filter | 2D Laplacian filter in slice-by-slice. |
| Log Filter | 2D Laplacian of Gaussian filter in slice-by-slice. | |
| X Edge Enhance | 2D sobel horizontal edge-emphasizing filter in slice-by-slice. | |
| Y Edge Enhance | 2D sobel vertical edge-emphasizing filter in slice-by-slice. | |
| Resample | Resample Up Down Sample | In the test review window, the original image is also resampled accordingly. This method is to up-sample or down-sample image in 3D. |
| Resample Voxel Size | In the test review window, the original image is also resampled accordingly. This method is to resample the pixel size in 3D. | |
| Miscellaneous | Threshold Image Mask | This method is to modify image and mask by applying image intensity threshold and 2D binary mask erosion. |
| Threshold Mask | This method is to modify mask only by applying image intensity threshold and 2D binary mask erosion. | |
| Bit Depth Rescale Range | There are many instances where you may want to scale data from a higher to a lower bit depth. For example, you can prepare data for visual display by scaling it from 16-bit or 32-bit to 8-bit. You can also scale data to a lower bit depth before you export it to applications that do not support data bits greater than 8-bit. By scaling, you can change 32-bit real data from a real number to a whole number and you can scale to reduce the size of your imagery. However, there is a risk of losing information when you scale to reduce file size. This method is to scale the image intensity into the certain bit range. |
Table 2.
Feature Extraction Algorithms Used in the Study with Estimated Feature Names
| Radiomic feature Category, Feature name and its Feature abbreviation | |||
|---|---|---|---|
| Gray Level Co-occurrence Matrix (GLCM) | Histogram | Gray Level Run Length Matrix (GLRLM) |
Neighborhood Intensity Difference (NID) |
| Auto Correlation Cluster Prominence Cluster Shade Cluster Tendency Difference Entropy Dissimilarity Entropy Homogeneity1 InformationMeasureCorr1 InformationMeasureCorr2 Inverse Diff Moment Norm Inverse Diff Norm Inverse Variance Max Probability Sum Average Sum Entropy Sum Variance Variance Contrast Correlation Energy Homogeneity2 |
Energy Root Mean Square Variance Kurtosis Skewness Range Inter Quartile Range Global Entropy Global Uniformity Global Max Global Mean Global standard deviation Mean Absolute Deviation |
Gray Level Non uniformity High Gray Level Run Emphasis Long Run Emphasis Long Run High Gray-Level Emphasis Long Run Low Gray-Level Emphasis Low Gray-Level Run Emphasis Run Length Non uniformity Run Percentage Short Run Emphasis Short Run High Gray-Level Emphasis Short Run Low Gray Level Emphasis |
Busyness Coarseness Complexity Contrast Texture Strength |
Statistical analysis
The Wilcoxon signed-rank test referred to as the (Wilcoxon T-test) was used to assess the pre-processed changes in SPSS statistics version 26.0.0. The consistency of pre-processing filters employed in the IBEX software was also evaluated over a variety of texture cartridges of CCR phantom. The statically significant changes in extracted features due to pre-processing were assessed using the Asymp.Sig. (2-tailed) p-value based on this comparison study. The computation revealed that when the Wilcoxon signed-rank test p-value is greater than 0.05, the radiomic feature changes caused by image pre-processing are less significant, and when the p-value is less than 0.05, they are significant.
An agglomerative Hierarchical cluster analysis (HCA) was employed in this study to integrate each connected individual variable. This connection cluster analysis is performed using SPSS statistics version 26.0.0 to locate the clusters that are closest together and to combine the most comparable clusters (between the pre-processing filters) and their effects on the texture’s radiomics. Similarly, cartridges were separated into groups that are significantly similar within themselves based on a series of criteria, and the Wilcoxon T-test was performed to evaluate the degree of significance (p-value). This connection cluster displays its range of solutions in the form of a dendrogram. (A dendrogram is a tree-like representation of the relationship between 19 pre-processor and 11 texture cluster subgroups with equivalent matrix distances based on the Wilcoxon T-test p-value).
Results
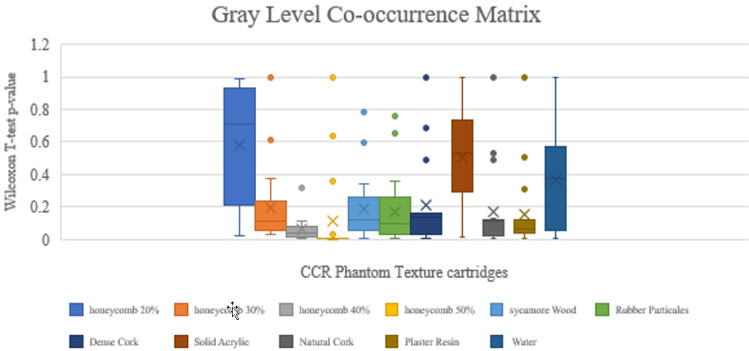
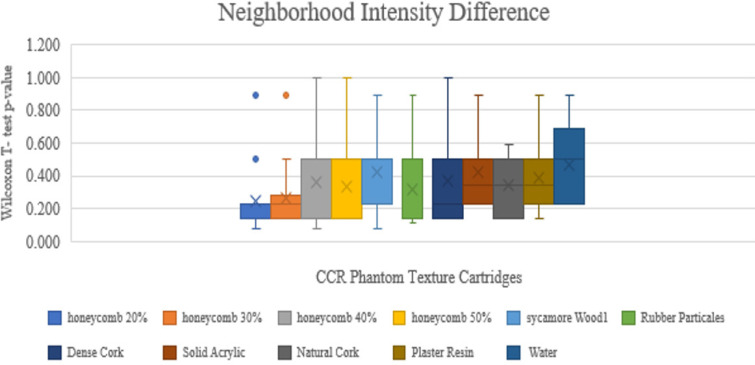
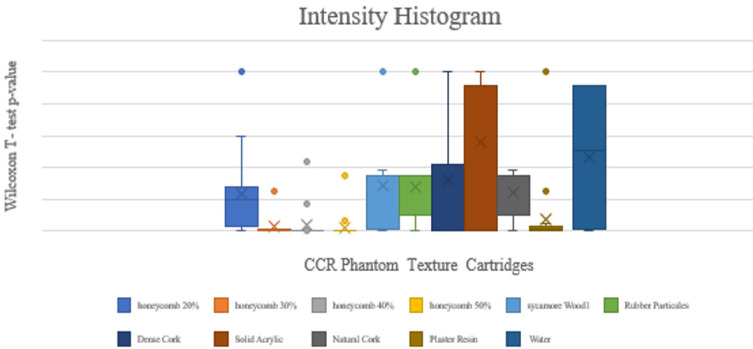
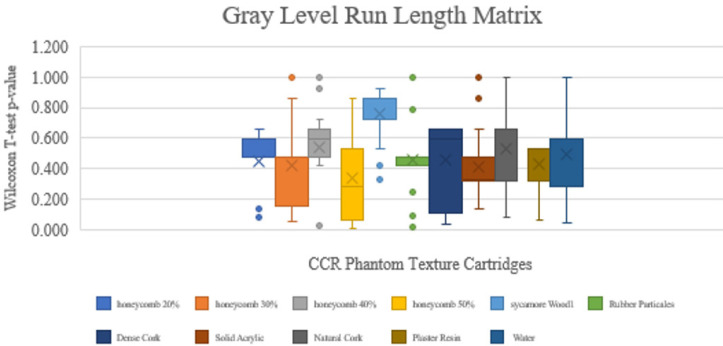
The box plot analysis of the radiomic changes of the four feature category samples using the Wilcoxon T-test p-value is shown in Figure 4a-4d. The significant p-values of each pre-processing filter corresponding to the segment textures are tabulated in Tables 3a-3d for four feature categories of 11 texture Cartridges ROIs segment. This investigation shows that the radiomic features derived from the CCR phantom CT image alter according to 1) the kind of preprocessing filter utilized, 2) the CT texture Cartridge, and 3) the feature category.
Figure 4a.
Box Plot Whisper for Preprocessed and Non-Preprocessed GLCM Features Related Sample Wilcoxon T-test p-value Comparison of CCR Phantom Different Texture Cartridges
Figure 4d.
Box Plot Whisper for Preprocessed and Non-Preprocessed NID Features Related Sample Wilcoxon T-test p-value Comparison of CCR Phantom Different Texture Cartridges
Table 3a.
The Calculated Wilcoxon T-test p-value of the Gray Level Co-Occurrences Matrix Radiomic Feature
| preprocessing filters in IBEX software | GLCM Wilcoxon sign-rank test p-value | ||||||||||
|---|---|---|---|---|---|---|---|---|---|---|---|
| Honeycomb 20% | Honeycomb 30% | Honeycomb 40% | Honeycomb 50% | Sycamore Wood | Rubber Particles | Dense Cork | Solid Acrylic | Natural Cork | Plaster Resin | Water | |
| Average Smooth | 0.935 | 0.123 | 0.101 | 0.004 | 0.123 | 0.101 | 0.14 | 0.527 | 0.123 | 0.067 | 0.506 |
| Edge Preserve Smooth3D | 0.935 | 0.058 | 0.072 | 0.005 | 0.101 | 0.077 | 0.095 | 0.808 | 0.088 | 0.049 | 0.355 |
| Gaussian Smooth | 0.987 | 0.123 | 0.088 | 0.006 | 0.158 | 0.101 | 0.14 | 0.485 | 0.123 | 0.067 | 0.39 |
| Gaussian Smooth3D | 0.935 | 0.082 | 0.067 | 0.003 | 0.123 | 0.263 | 0.088 | 0.808 | 0.115 | 0.042 | 0.236 |
| Median Smooth | 0.548 | 0.615 | 0.115 | 0.006 | 0.236 | 0.758 | 0.101 | 0.91 | 0.082 | 0.036 | 0.57 |
| Wiener Smooth | 0.961 | 0.049 | 0.049 | 0.002 | 0.095 | 0.072 | 0.14 | 0.527 | 0.131 | 0.067 | 0.506 |
| Adapt Hist Equalization Enhance3D | 0.808 | 0.372 | 0.011 | 0.638 | 0.783 | 0.049 | 0.685 | 0.733 | 0.008 | 0.506 | 0.833 |
| Hist Equalization Enhance | 0.445 | 0.355 | 0.013 | 0.355 | 0.592 | 0.008 | 0.007 | 0.638 | 0.036 | 0.306 | 0.858 |
| Blind Deblur | 0.095 | 0.101 | 0.002 | 0.002 | 0.058 | 0.02 | 0.067 | 0.236 | 0.101 | 0.123 | 0.058 |
| Gaussian Deblur | 0.18 | 1 | 0.317 | 1 | 0.18 | 0.655 | 1 | 1 | 1 | 1 | 1 |
| Laplacian Filter | 0.05 | 0.028 | 0.033 | 0.006 | 0.003 | 0.033 | 0.007 | 0.02 | 0.006 | 0.002 | 0.007 |
| Log Filter | 0.306 | 0.115 | 0.028 | 0.028 | 0.004 | 0.024 | 0.024 | 0.082 | 0.02 | 0.004 | 0.009 |
| X Edge Enhance | 0.211 | 0.236 | 0.002 | 0.004 | 0.004 | 0.355 | 0.485 | 0.592 | 0.527 | 0.306 | 0.638 |
| Y Edge Enhance | 0.223 | 0.058 | 0.012 | 0.005 | 0.338 | 0.338 | 0.506 | 0.592 | 0.485 | 0.095 | 0.058 |
| Resample Up Down Sample | 0.709 | 0.028 | 0.026 | 0.001 | 0.095 | 0.011 | 0.028 | 0.306 | 0.022 | 0.004 | 0.058 |
| Resample Voxel Size | 0.733 | 0.058 | 0.031 | 0.001 | 0.095 | 0.101 | 0.158 | 0.291 | 0.123 | 0.077 | 0.067 |
| Threshold Image Mask | 0.987 | 0.123 | 0.077 | 0.007 | 0.263 | 0.095 | 0.14 | 0.485 | 0.115 | 0.058 | 0.372 |
| Threshold Mask | 0.987 | 0.123 | 0.077 | 0.007 | 0.263 | 0.095 | 0.14 | 0.485 | 0.115 | 0.058 | 0.372 |
| Bit Depth Rescale Range | 0.026 | 0.031 | 0.042 | 0.007 | 0.003 | 0.042 | 0.005 | 0.012 | 0.004 | 0.003 | 0.007 |
Table 3d.
The Calculated Wilcoxon T-test p-value of the Neighborhood Intensity Differences Radiomic Feature
| preprocessing filters in IBEX software |
NID Wilcoxon Sign-rank test p-value | ||||||||||
|---|---|---|---|---|---|---|---|---|---|---|---|
| Honeycomb 20% | Honeycomb 30% | Honeycomb 40% | Honeycomb 50% | Sycamore Wood1 | Rubber Particles | Dense Cork | Solid Acrylic | Natural Cork | Plaster Resin | Water | |
| Average Smooth | 0.138 | 0.225 | 0.138 | 0.138 | 0.5 | 0.5 | 0.5 | 0.5 | 0.138 | 0.5 | 0.5 |
| Edge Preserve Smooth3D | 0.138 | 0.893 | 0.893 | 0.138 | 0.5 | 0.138 | 0.5 | 0.225 | 0.5 | 0.5 | 0.5 |
| Gaussian Smooth | 0.138 | 0.225 | 0.138 | 0.138 | 0.5 | 0.138 | 0.225 | 0.5 | 0.138 | 0.225 | 0.5 |
| Gaussian Smooth3D | 0.138 | 0.225 | 0.138 | 0.138 | 0.5 | 0.138 | 0.225 | 0.5 | 0.138 | 0.5 | 0.5 |
| Median Smooth | 0.138 | 0.138 | 0.138 | 0.138 | 0.5 | 0.138 | 0.225 | 0.225 | 0.345 | 0.225 | 0.5 |
| Wiener Smooth | 0.138 | 0.225 | 0.138 | 0.138 | 0.5 | 0.5 | 0.5 | 0.345 | 0.5 | 0.5 | 0.5 |
| Adapt Hist Equalization Enhance3D | 0.138 | 0.345 | 0.5 | 0.5 | 0.225 | 0.5 | 0.5 | 0.225 | 0.5 | 0.138 | 0.225 |
| Hist Equalization Enhance | 0.225 | 0.5 | 0.5 | 0.345 | 0.225 | 0.5 | 0.5 | 0.225 | 0.5 | 0.138 | 0.225 |
| Blind Deblur | 0.225 | 0.138 | 0.893 | 0.893 | 0.893 | 0.138 | 0.138 | 0.893 | 0.138 | 0.893 | 0.686 |
| Gaussian Deblur | 0.225 | 0.138 | 0.138 | 0.225 | 0.5 | 0.5 | 0.138 | 0.5 | 0.138 | 0.5 | 0.893 |
| Laplacian Filter | 0.893 | 0.225 | 0.225 | 0.225 | 0.225 | 0.893 | 0.225 | 0.893 | 0.225 | 0.225 | 0.225 |
| Log Filter | 0.08 | 0.225 | 0.08 | 0.5 | 0.08 | 0.5 | 0.5 | 0.225 | 0.5 | 0.5 | 0.345 |
| X Edge Enhance | 0.138 | 0.138 | 0.138 | 0.138 | 0.08 | 0.138 | 0.138 | 0.225 | 0.138 | 0.225 | 0.225 |
| Y Edge Enhance | 0.138 | 0.138 | 0.138 | 0.138 | 0.686 | 0.138 | 0.138 | 0.225 | 0.138 | 0.345 | 0.225 |
| Resample Up Down Sample | 0.893 | 0.138 | 0.138 | 0.138 | 0.225 | 0.5 | 0.138 | 0.225 | 0.5 | 0.225 | 0.225 |
| Resample Voxel Size | 0.138 | 0.138 | 0.138 | 0.138 | 0.225 | 0.138 | 0.138 | 0.225 | 0.5 | 0.225 | 0.225 |
| Threshold Image Mask | 0.109 | 0.285 | 1 | 1 | 0.655 | 0.109 | 1 | 0.715 | 0.593 | 0.593 | 0.715 |
| Threshold Mask | 0.109 | 0.285 | 1 | 1 | 0.655 | 0.109 | 1 | 0.715 | 0.593 | 0.593 | 0.715 |
| Bit Depth Rescale Range | 0.5 | 0.345 | 0.345 | 0.345 | 0.345 | 0.225 | 0.345 | 0.5 | 0.345 | 0.345 | 0.893 |
For pre-processing filters and texture cartridge, the majority of the feature category p-value magnitude alters at random. The GLRLM and NID feature categories, as well as the mean and median p-values of the 19 preprocessing filters, are statistically insignificant. Whereas the intensity histogram feature category features of honeycomb 30%, 40%, and 50% texture cartridge mean, and median p-values are statistically significant, so is the GLCM feature category features of honeycomb 40% and 50% texture, as shown in Figure 4a.
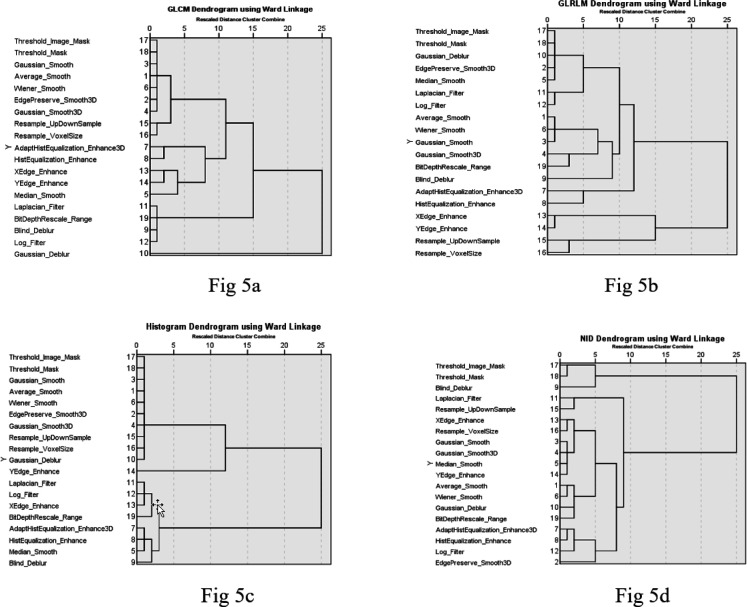
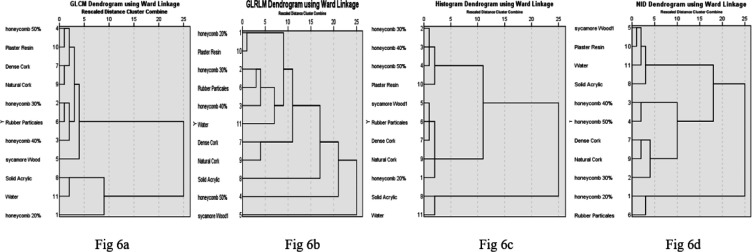
Figures 5a-5d demonstrate dendrogram with hierarchical clustering. Each category is made up of subgroups that are all the same size due to the cluster’s scaling. In terms of similarity and comparability, the pre-processor has been sub-grouped as follows in the four-feature category: GLCM -7 sub-groups, GLRLM -8 sub-groups, Intensity histogram -6 sub-groups, and at last NID -10 sub-groups. Similarly, the pre-processed features were hierarchically clustered based on image textures, with GLCM having 7 related texture sub-groups, GLRLM having 8 similar texture sub-groups, intensity histogram having 5 sub-groups, and NID having 7 sub-groups. Furthermore, the dense and natural cork image texture features in our assessment exhibit a closed link in all four feature categories presented in Figures 6a -6d. The texture feature of water and solid acrylic, however, remains in the same cluster branches of the subgroups in three of the four feature categories except GLRLM. The last observation indicated synchronized cluster branches of dendrograms of rubber partial Cartridge textures with honeycomb in the GLCM, GLRLM, and NID categories; intensity histogram category cluster branches to dense cork and sycamore wood.
Figure 5.
Hierarchical Clustering Dendrogram of 19 Preprocessing Filters which were Used on the CCR Phantom. a, GLCM; b, GLRLM; c, Histogram; d, NID are each feature category connectivity clusters of pre-processor grouped based on distances matrix
Figure 6.
Hierarchical clustering dendrogram of 11 CCR phantom Texture cartridges grouped based on Wilcoxon T-test p-value for 4 feature categories. a, GLCM; b, GLRLM; c, Histogram; d, NID
Discussion
The phantom study analysis refers to Tables 3a–3d and Figures 4a–6d, which illustrated the impacts of image pre-processing on different textures like fine, regular directional, smooth, rough, homogenous, and nondirectional CT image radiomic characteristics. The phantom results highlight radiomic texture features dependence on CT image texture and pre-processing impact on texture patterns.
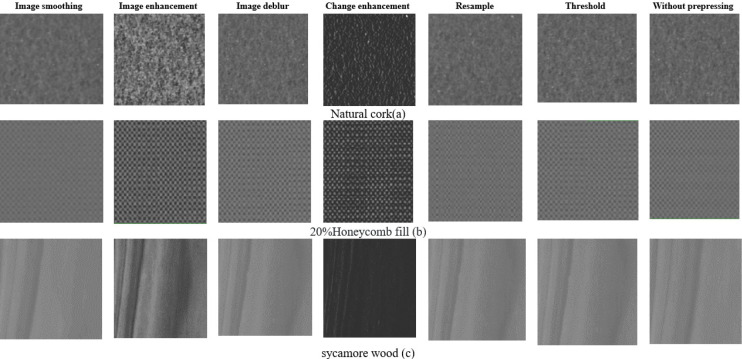
The discussion also clarified observations about radiomic feature fluctuation between pre- processed and unprocessed images. Since the variability measure aids in understanding tumour heterogeneity and its effects on tumour response to radiation treatment, the phantom study will aid to understand the variability of tumour texture during therapy management. Simultaneously, to monitor the therapeutic response, the radiomic texture features were investigated to determine the texture-dependent aspects of the pre-processing filters. On the account of identifying the pre-processing impact on various textures, we have utilized a single CT image set, as multiple CT image set tends to create image noise due to differences in slice thickness, tube potential difference (kVp), and tube current-time product (mAs). Figure 3 shows the visual impact of the various image preprocessing effects on a different texture when compared to its non-processed. The Wilcoxon T-test p-value was used to compare and quantify the pre-processed CCR phantom texture cartridge image ROIs features with their non-pre-processed image features. Finally, this study also reveals that the texturing features are likely dependent on the type of the pre-processes filter, texture Cartridges ROIs segment, and radiomic feature category.
Figure 3.
CCR Phantom Cartridges are a) Natural cork, b) 20% Honeycomb fill c) sycamore wood, visual changes with different preprocessing filets
Figure 4c box plot illustrates, the first-order intensity histogram category features had significant changes in most of the pre-processing filters on the 30%,40%, and 50% honeycomb fill features. This honeycomb ROI texture pattern appears regular and exhibits both high and low-intensity values as the periodic textures have similar and recurring intensity HU values. Likewise, during image feature enhancement process the lower-intensity image feature information could be get lost, similar effects were noticed in the Plaster Resin ROI texture of the phantom, as it has repeating smooth-regular textures patterns. The insignificant p-value in the GLRLM and NID feature categories is shown by the box plots in Figure 4b and 4d, respectively. This is because both feature categories include a large dependence emphasis and a small dependence emphasis, which reflect on the heterogeneity and homogeneity, respectively. In addition, these features include gray-level non-uniformity and dependence uniformity, which reflects the similarity in grey levels and in gray-level dependencies throughout a ROI, respectively (Zwanenburg et al., 2020; Sun C et al., 1983).
Figure 4c.
Box Plot Whisper for Preprocessed and Non-Preprocessed Histogram Features Related Sample Wilcoxon T-test p-value Comparison of CCR Phantom Different Texture Cartridges
Figure 4b.
Box Plot Whisper for Preprocessed and Non-Preprocessed GLRLM Features Related Sample Wilcoxon T-test p-value Comparison of CCR Phantom Different Texture Cartridges
The mean p-value of the honeycomb 50% texture ROI exhibits higher importance than the mean p-values of the other phantom ROIs, as seen in the box plot in Figure 4a and table 3a of the GLCM feature category. These significant changes can be attributed to the ROI unit density as well as its textural patterns. GLCM category features emphasize Gray-level differences between pixels or voxels belonging to a pixel or voxel pair (Zwanenburg et al., 2020; Haralick R M et al., 1973). This is because GLCM has traits like entropy (Gray-level inhomogeneity) and energy (angular second moment), which show Gray-level order and difference. GLCM image uniformity, meaning it assumes bigger values for smaller differences in grey tone within the paired element. Within the GLCM group, contrast and uniformity have a strong but negative correlation. Because of this, small differences in image features that have a high contrast 50% honeycomb ROI are reduced during image augmentation. A broad HU dispersion is offered by the wood ROI insert. A broad HU range indicates that there was a substantial difference in pixel intensity which resulted in the formation of a large-scale matrix during the feature calculation. As a result, the impacts of pre-processing were less substantial in the feature category, as seen in Figures 4a-4d. Figures 5a-5d demonstrates that the image smoothing filters that grouped together in the HCA dendrogram shared the same ward linkage. Because of the smoothing effect, the homogeneous components in the cartridges created far less noise. Because all the pre-processed filters were applied to the same image set, the amount of noise that was introduced was significantly reduced. The GLRLM and NID feature categories were not significantly influenced by the image pre-processing, as shown in tables 3b and 3d. However, the Resample Up Down Sample and Resample Voxel Size pre-processing technique has considerably overdone the radiomic characteristics on the textures of honeycomb fill 30%, 40%, and 50%, rubber particles, and dense cork ROIs. The resample algorithm can make high-quality images out of images with a low resolution and a lot of noise in them. This modification of radiomic features ultimately results in the invalidation of the predictive radiomic (Moummad et al., 2021).
Table 3b.
The Calculated Wilcoxon T-test p-value of the Gray Level Run Length Matrix Radiomic Feature
| preprocessing filters in IBEX software | GLRLM Wilcoxon sign-rank test p-value | ||||||||||
|---|---|---|---|---|---|---|---|---|---|---|---|
| Honeycomb 20% | Honeycomb 30% | Honeycomb 40% | Honeycomb 50% | Sycamore Wood | Rubber Particles | Dense Cork | Solid Acrylic | Natural Cork | Plaster Resin | Water | |
| Average Smooth | 0.657 | 0.477 | 0.477 | 0.859 | 0.859 | 0.477 | 0.657 | 0.328 | 0.657 | 0.534 | 0.594 |
| Edge Preserve Smooth3D | 0.657 | 0.477 | 0.424 | 0.062 | 0.859 | 0.477 | 0.657 | 0.477 | 0.657 | 0.534 | 0.594 |
| Gaussian Smooth | 0.477 | 0.477 | 0.594 | 0.534 | 0.859 | 0.477 | 0.657 | 0.328 | 0.657 | 0.534 | 0.594 |
| Gaussian Smooth3D | 0.534 | 0.477 | 0.477 | 0.477 | 0.328 | 0.477 | 0.657 | 0.859 | 0.657 | 0.534 | 0.594 |
| Median Smooth | 0.594 | 0.477 | 0.424 | 0.004 | 0.859 | 0.477 | 0.657 | 0.328 | 0.657 | 0.534 | 0.657 |
| Wiener Smooth | 0.594 | 0.477 | 0.477 | 0.859 | 0.859 | 0.477 | 0.657 | 0.328 | 0.657 | 0.534 | 0.594 |
| Adapt Hist Equalization Enhance3D | 0.131 | 0.328 | 0.657 | 0.11 | 0.79 | 0.79 | 0.11 | 0.374 | 1 | 0.062 | 0.041 |
| Hist Equalization Enhance | 0.131 | 0.131 | 0.657 | 0.286 | 0.657 | 0.248 | 0.594 | 0.859 | 0.79 | 0.11 | 0.477 |
| Blind Deblur | 0.534 | 1 | 1 | 0.317 | 0.722 | 1 | 0.317 | 0.317 | 0.317 | 0.317 | 1 |
| Gaussian Deblur | 0.477 | 0.424 | 0.722 | 0.11 | 0.859 | 0.424 | 0.657 | 0.328 | 0.657 | 0.534 | 0.722 |
| Laplacian Filter | 0.534 | 0.477 | 0.477 | 0.374 | 0.722 | 0.477 | 0.477 | 0.131 | 0.477 | 0.534 | 0.286 |
| Log Filter | 0.534 | 0.477 | 0.477 | 0.062 | 0.534 | 0.477 | 0.477 | 0.131 | 0.477 | 0.534 | 0.155 |
| X Edge Enhance | 0.477 | 0.155 | 0.594 | 0.859 | 0.929 | 0.477 | 0.11 | 0.182 | 0.11 | 0.534 | 0.213 |
| Y Edge Enhance | 0.477 | 0.155 | 0.594 | 0.859 | 0.859 | 0.477 | 0.11 | 0.182 | 0.11 | 0.534 | 0.155 |
| Resample Up Down Sample | 0.075 | 0.075 | 0.021 | 0.016 | 0.859 | 0.016 | 0.11 | 0.328 | 0.11 | 0.182 | 0.534 |
| Resample Voxel Size | 0.091 | 0.05 | 0.026 | 0.026 | 0.79 | 0.091 | 0.033 | 1 | 0.075 | 0.182 | 0.328 |
| Threshold Image Mask | 0.477 | 0.477 | 0.657 | 0.11 | 0.859 | 0.477 | 0.657 | 0.328 | 0.657 | 0.534 | 0.594 |
| Threshold Mask | 0.477 | 0.477 | 0.657 | 0.11 | 0.859 | 0.477 | 0.657 | 0.328 | 0.657 | 0.534 | 0.594 |
| Bit Depth Rescale Range | 0.657 | 0.859 | 0.929 | 0.424 | 0.424 | 0.424 | 0.424 | 0.657 | 0.657 | 0.374 | 0.722 |
As can be shown in Table 3c, the application of both the Laplacian Filter and the Log Filter as a pre-processing step considerably improves the histogram category features of the CCR phantom CT image texture. To emphasise characteristics in a dynamic contrast-enhanced CT investigation of colorectal cancer, (Ganeshan et al., 2011) employed Gaussian filters in combination with a Laplacian edge detector (LoG). Other research (Goh et al., 2011; Coroller et al., 2015) indicated that the best-performing predictive characteristics were based on LoG filters. As can be seen in Tables 3a and 3c, the Bit Depth Rescale Range pre-processing procedure had an influence on the histogram, and the GLCM category had a significant p-value. The grey level intensity of a single pixel, pair of pixels, or voxel determines the images features. Rescaling the bit depth lessens the volatility of Gabor edge-based features, finally reducing the covariate shift between datasets. This unequivocally demonstrates that decreasing the local intensity disparity enables these features to quantify the fluctuations in edge. Additionally, the Bit Depth Rescale pre-processing approach contributes to the identification of survival disparities between high-risk and low-risk patient groups (Um et al., 2019). Pre-processing image enhancement is mainly used for improving the visual impression of images.
Table3c.
The Calculated Wilcoxon T-test p-value of the Intensity Histogram Radiomic Feature
| preprocessing filters in IBEX software |
Histogram Wilcoxon Sign-rank test p-value | ||||||||||
|---|---|---|---|---|---|---|---|---|---|---|---|
| Honeycomb 20% | Honeycomb 30% | Honeycomb 40% | Honeycomb 50% | Sycamore Wood | Rubber Particles | Dense Cork | Solid Acrylic | Natural Cork | Plaster Resin | Water | |
| Average Smooth | 0.196 | 0.006 | 0.007 | 0.002 | 0.345 | 0.345 | 0.422 | 0.917 | 0.345 | 0.011 | 0.753 |
| Edge Preserve Smooth3D | 0.196 | 0.006 | 0.007 | 0.002 | 0.382 | 0.345 | 0.422 | 0.917 | 0.345 | 0.033 | 0.753 |
| Gaussian Smooth | 0.221 | 0.009 | 0.007 | 0.002 | 0.345 | 0.345 | 0.422 | 0.917 | 0.345 | 0.011 | 0.917 |
| Gaussian Smooth3D | 0.196 | 0.007 | 0.007 | 0.002 | 0.382 | 0.345 | 0.422 | 0.917 | 0.311 | 0.016 | 0.753 |
| Median Smooth | 0.279 | 0.007 | 0.007 | 0.002 | 0.249 | 0.345 | 0.507 | 0.196 | 0.345 | 0.011 | 0.196 |
| Wiener Smooth | 0.196 | 0.006 | 0.007 | 0.002 | 0.345 | 0.345 | 0.422 | 0.917 | 0.345 | 0.011 | 0.753 |
| Adapt Hist Equalization Enhance3D | 0.345 | 0.007 | 0.007 | 0.007 | 0.311 | 0.221 | 0.133 | 0.007 | 0.152 | 0.007 | 0.009 |
| Hist Equalization Enhance | 0.345 | 0.009 | 0.007 | 0.007 | 0.311 | 0.221 | 0.116 | 0.007 | 0.101 | 0.007 | 0.009 |
| Blind Deblur | 0.6 | 0.013 | 0.173 | 0.345 | 0.016 | 0.007 | 0.007 | 0.003 | 0.007 | 0.003 | 0.002 |
| Gaussian Deblur | 0.279 | 0.009 | 0.007 | 0.002 | 0.345 | 0.345 | 0.422 | 0.917 | 0.382 | 0.009 | 0.308 |
| Laplacian Filter | 0.001 | 0.001 | 0.002 | 0.006 | 0.002 | 0.002 | 0.007 | 0.006 | 0.007 | 0.007 | 0.006 |
| Log Filter | 0.001 | 0.001 | 0.002 | 0.006 | 0.002 | 0.001 | 0.007 | 0.006 | 0.007 | 0.007 | 0.006 |
| X Edge Enhance | 0.007 | 0.249 | 0.002 | 0.068 | 0.002 | 0.221 | 0.002 | 0.015 | 0.249 | 0.002 | 0.002 |
| Y Edge Enhance | 1 | 0.273 | 0.441 | 0.004 | 1 | 1 | 1 | 1 | 0.273 | 1 | 0.11 |
| Resample Up Down Sample | 0.033 | 0.009 | 0.007 | 0.002 | 0.345 | 0.345 | 0.422 | 0.861 | 0.345 | 0.046 | 0.917 |
| Resample Voxel Size | 0.064 | 0.013 | 0.007 | 0.002 | 0.345 | 0.1 | 0.507 | 0.917 | 0.345 | 0.046 | 0.917 |
| Threshold Image Mask | 0.279 | 0.009 | 0.007 | 0.002 | 0.345 | 0.345 | 0.422 | 0.917 | 0.345 | 0.011 | 0.917 |
| Threshold Mask | 0.279 | 0.009 | 0.007 | 0.002 | 0.345 | 0.345 | 0.422 | 0.917 | 0.345 | 0.011 | 0.917 |
| Bit Depth Rescale Range | 0.002 | 0.002 | 0.002 | 0.002 | 0.006 | 0.002 | 0.002 | 0.311 | 0.002 | 0.249 | 0.507 |
In the first order, the features of the histogram are calculated directly from the images and include standard metrics such as the mean, median, and standard deviation. Because the intensity distributions of the histograms for rubber particle, Sycamore Wood, and Dense Cork were similar to one another, the three of them were shown in Figure 6c as belonging to the same cluster. In other observations, shown in Figures 6a–6d, it was found that the random texture cartridges for the dense and natural cork ROI clustered together in the same subgroup for each of the four feature categories. Similarly, it was observed that the water and solid acrylic texture free cartridges exhibited a similar pattern. The spatial and angular correlations between the variations in image intensity are used to construct GLCM features (Haralick RM et al., 973). According to Galloway MM (1975), GLRLM features are used to explain patterns in the run length or the number of successive voxels that have the same intensity. The terms coarseness and contrast are examples of NID attributes that represent human perceptible features (Amadasun M et al., 1989). Mackin et al., (2018) concluded that the minimum texture, such as acrylic, has feature values that are highly reliant on noise. (ROI) that did contain texture displayed the influence of different pre-processing filter variations, and these variations could be seen in the histogram and the GLCM category features. (HCA) of the four categories shows that the changes in the cluster groups indicate that the first order and second order categories of each try to find a uniqueness of the single pixel information and the neighbourhood pixel information in such a way that the filters and textures were arranged in each category.
According to our findings, different features react differently to changes in image texturing, feature category, and pre-processing technique. The Laplacian Filter, Log Filter, Resample, and Bit Depth Rescale Range filters, in particular, improved the majority of the ROI’s textural feature variance. Similarly, image features such as the texture patterns of a regular directional honeycomb and a smooth 3D-printed plaster resin can be altered by pre-processing. The variance induced by the image texture pattern and the pre-processing procedure was particularly prominent in the histogram and GLCM feature categories. Additionally, the purpose of this study is to determine which image pre-processing methods are best for harmonizing textual information in CT for the usage of reliable radiomics algorithms across a variety of tissue types.
Author Contribution Statement
All authors contributed equally in this study.
Acknowledgements
None.
References
- Amadasun M, King R et al. Textural features corresponding to textural properties Systems Man and Cybernetics. IEEE Transactions on. 1989;19: 1264–74. [Google Scholar]
- Altazi BA, Zhang GG, Fernandez DC, et al. Reproducibility of F18-FDG PET radiomic features for different cervical tumor segmentation methods, gray-level discretization, and reconstruction algorithms. J Appl Clin Med Phys. 2017;18:32–48. doi: 10.1002/acm2.12170. [DOI] [PMC free article] [PubMed] [Google Scholar]
- Bagher‐Ebadian H, Siddiqui F, Liu C, et al. On the impact of smoothing and noise on robustness of CT and CBCT radiomics features for patients with head and neck cancers. Med Phys. 2017;44:1755–70. doi: 10.1002/mp.12188. [DOI] [PubMed] [Google Scholar]
- Bailly C, Bodet-Milin C, Couespel S et al. 2016) Revisiting the robustness of PET-based textural features in the context of multi-centric trials. PLoS One. 11:e0159984. doi: 10.1371/journal.pone.0159984. [DOI] [PMC free article] [PubMed] [Google Scholar]
- Bayanati H, E Thornhill R, Souza CA, et al. Quantitative CT texture and shape analysis: can it differentiate benign and malignant mediastinal lymph nodes in patients with primary lung cancer? Eur Radiol. 2015;25:480–7. doi: 10.1007/s00330-014-3420-6. [DOI] [PubMed] [Google Scholar]
- Bernchou U, Hansen O, Schytte T, et al. Prediction of lung density changes after radiotherapy by cone beam computed tomography response markers and pre-treatment factors for non-small cell lung cancer patients. Radiother Oncol. 2015;117:17–22. doi: 10.1016/j.radonc.2015.07.021. [DOI] [PubMed] [Google Scholar]
- Bertelsen A, Schytte T, Bentzen SM, et al. Radiation dose response of normal lung assessed by Cone Beam CT - a potential tool for biologically adaptive radiation therapy. Radiother Oncol. 2011;100:351–5. doi: 10.1016/j.radonc.2011.08.012. [DOI] [PubMed] [Google Scholar]
- Coroller TP, Grossmann P, Hou Y, et al. CT-based radiomic signature predicts distant metastasis in lung adenocarcinoma. Radiotherapy Oncol. 2015;114:345–50. doi: 10.1016/j.radonc.2015.02.015. [DOI] [PMC free article] [PubMed] [Google Scholar]
- Galloway MM. Texture analysis using gray level run lengths. Computer graphics and image processing. 1975;4:172–9. [Google Scholar]
- Ganeshan B, Burnand K, Young R, et al. Dynamic contrast-enhanced texture analysis of the liver: initial assessment in colorectal cancer. Invest Radiol. 2011;46:160–8. doi: 10.1097/RLI.0b013e3181f8e8a2. [DOI] [PubMed] [Google Scholar]
- Goh V, Ganeshan B, Nathan P, et al. Assessment of response to tyrosine kinase inhibitors in metastatic renal cell cancer: CT texture as a predictive biomarker. Radiology. 2011;261:165–71. doi: 10.1148/radiol.11110264. [DOI] [PubMed] [Google Scholar]
- Lambin P, Rios‐Velazquez E, Leijenaar R, et al. Radiomics: extracting more information from medical images using advanced feature analysis. Eur J Cancer. 2012;48:441–6. doi: 10.1016/j.ejca.2011.11.036. [DOI] [PMC free article] [PubMed] [Google Scholar]
- Lambin P, Leijenaar RTH, Deist TM, et al. Radiomics: the bridge between medical imaging and personalized medicine. Nat Rev Clin Oncol. 2017;14:749–62. doi: 10.1038/nrclinonc.2017.141. [DOI] [PubMed] [Google Scholar]
- Lecler A, Duron L, Balvay D, et al. Combining multiple magnetic resonance imaging sequences provides independent reproducible radiomics features. Sci Rep. 2019;9:2068. doi: 10.1038/s41598-018-37984-8. [DOI] [PMC free article] [PubMed] [Google Scholar]
- Leijenaar RTH, Nalbantov G, Carvalho S, et al. The effect of SUV discretization in quantitative FDG-PET Radiomics: the need for standardize methodology in tumor texture analysis. Sci Rep. 2015;5:11075. doi: 10.1038/srep11075. [DOI] [PMC free article] [PubMed] [Google Scholar]
- Mackin D, Ger R, Dodge C et al. Effect of tube current on computed tomography radiomic features. Sci Rep. 2018;8:2354. doi: 10.1038/s41598-018-20713-6. [DOI] [PMC free article] [PubMed] [Google Scholar]
- Moummad I, Jaudet C, Lechervy A, et al. The Impact of Resampling and Denoising Deep Learning Algorithms on Radiomics in Brain Metastases MRI. Cancers (Basel) 2021;14:36. doi: 10.3390/cancers14010036. [DOI] [PMC free article] [PubMed] [Google Scholar]
- Shafiq-ul-Hassan M, Zhang GG, Latifi K, et al. Intrinsic dependencies of CT radiomic features on voxel size and number of gray levels. Med Phys. 2017;44:1050–62. doi: 10.1002/mp.12123. [DOI] [PMC free article] [PubMed] [Google Scholar]
- Sun C, Wee WG. Neighboring gray level dependence matrix for texture classification. Comput Vis Graph Image Process. 1983;23:341–52. [Google Scholar]
- Um H, Tixier F, Bermudez D, et al. Impact of image preprocessing on the scanner dependence of multi-parametric MRI radiomic features and covariate shift in multi-institutional glioblastoma datasets. Phys Med Biol. 2019;64:165011. doi: 10.1088/1361-6560/ab2f44. [DOI] [PubMed] [Google Scholar]
- Weiss GJ, Ganeshan B, Miles KA, et al. Noninvasive image texture analysis differentiates K-ras mutation from pan-wildtype NSCLC and is prognostic. PLoS One. 2014;9:e100244. doi: 10.1371/journal.pone.0100244. [DOI] [PMC free article] [PubMed] [Google Scholar]
- Wichtmann B, Attenberger U, Harder FM, et al. Influence of image processing on the robustness of radiomic features derived from magnetic resonance imaging—a phantom study. ISMRM . 2018:5. [Google Scholar]
- Yip SS, Aerts HJ. Applications and limitations of radiomics. Phys Med Biol. 2016;61:150–66. doi: 10.1088/0031-9155/61/13/R150. [DOI] [PMC free article] [PubMed] [Google Scholar]
- Zwanenburg A, Leger S, Agolli L, et al. Assessing robustness of radiomic features by image perturbation. Sci Rep. 2019;9:614. doi: 10.1038/s41598-018-36938-4. [DOI] [PMC free article] [PubMed] [Google Scholar]


