. 2023 Sep 12;12:e85867. doi: 10.7554/eLife.85867

Figure 6. Annual genotype and antimicrobial resistance (AMR) frequencies by isolating lab, for South Asian countries with multiple data sources.

Labs shown are those with ≥20 isolates; and years shown for each lab are those with N≥5 isolates from that year. (a) Bars are coloured to indicate annual genotype prevalence, as per inset legend. (b) Lines indicate annual frequencies of key AMR profiles, coloured by isolating laboratory as per inset legend. MDR, multidrug resistant; XDR, extensively drug resistant; CipNS, ciprofloxacin non-susceptible; CipR, ciprofloxacin resistant; CefR, ceftriaxone resistant. See Supplementary file 9 for three-letter laboratory code master list.

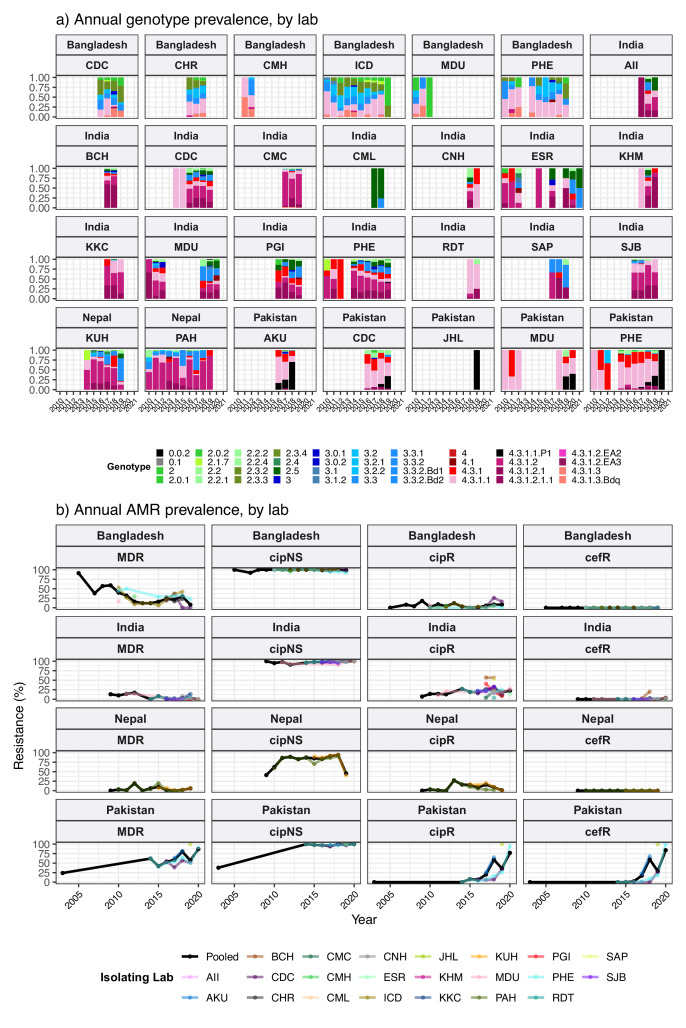
Figure 6.

Figure 6—figure supplement 1. Genotype prevalence estimated from different data sources, for South Asian countries.

Figure 6—figure supplement 1.

For source laboratories with N≥20 isolates. Lines show 95% confidence interval for each proportion (prevalence) estimate; solid circles highlight the pooled point estimate for national prevalence in each country. Lines are coloured by country as per the inset legend. See Supplementary file 9 for three-letter laboratory code master list.
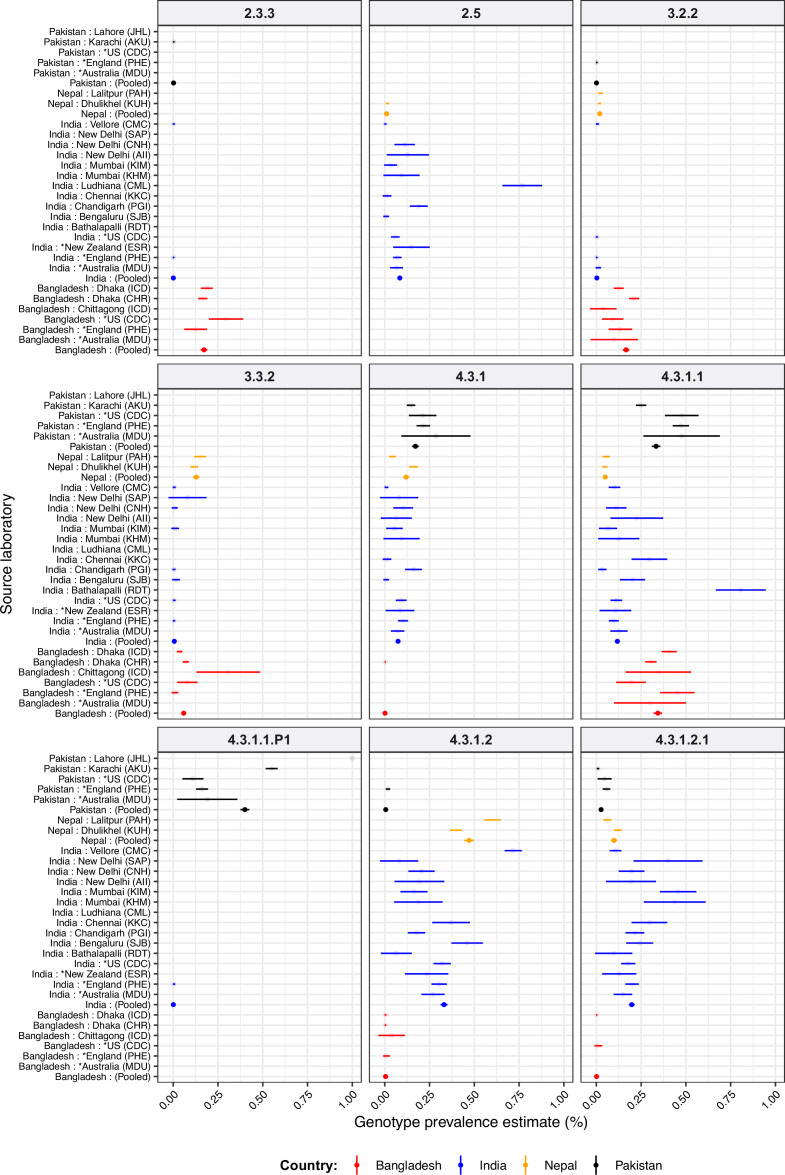
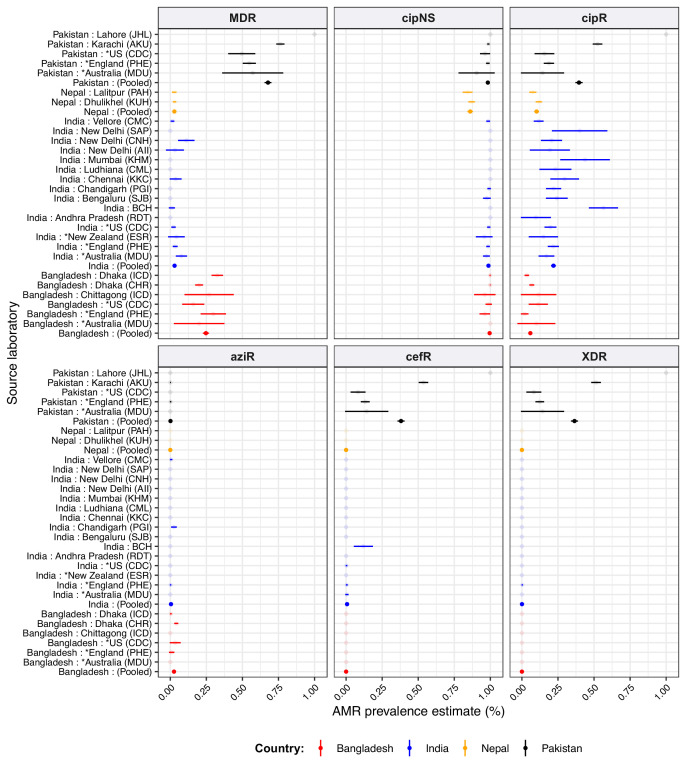
Figure 6—figure supplement 2. Antimicrobial resistance (AMR) prevalence estimated from different sources, for South Asian countries.

Figure 6—figure supplement 2.

For source laboratories with N≥20 isolates from which to estimate prevalence. Lines show 95% confidence interval for each proportion (prevalence) estimate; solid circles highlight the pooled point estimate for national prevalence in each country. Lines are coloured by country as per the inset legend. See Supplementary file 9 for three-letter laboratory code master list.