

SUMMARY
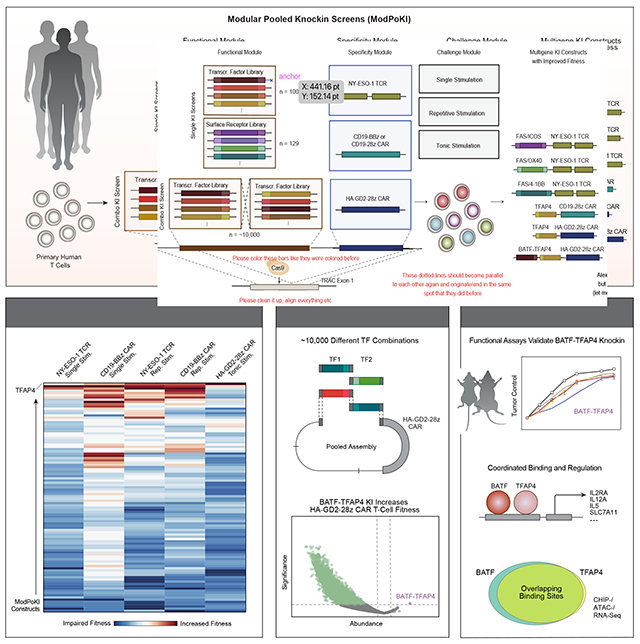
Chronic stimulation can cause T-cell dysfunction and limit efficacy of cellular immunotherapies. Improved methods are required to compare large numbers of synthetic knockin sequences to reprogram cell functions. Here, we developed Modular Pooled Knockin Screening (ModPoKI), an adaptable platform for modular construction of DNA knockin libraries using barcoded multicistronic adaptors. We built two ModPoKI libraries of 100 transcription factors (TFs) and 129 natural and synthetic surface receptors. Over 30 ModPoKI screens across human TCR- and CAR-T cells in diverse conditions identified a transcription factor AP4 (TFAP4) construct that enhanced fitness of chronically-stimulated CAR-T cells and anti-cancer function in vitro and in vivo. ModPoKI’s modularity allowed us to generate a ~10,000-member library of TF combinations. Non-viral knockin of a combined BATF-TFAP4 polycistronic construct enhanced fitness. Overexpressed BATF and TFAP4 co-occupy and regulate key gene targets to reprogram T-cell function. ModPoKI facilitates discovery of complex gene constructs to program cellular functions.
Graphical Abstract
In Brief
Modular Pooled Knockin Screening (ModPoKI) is an adaptable platform that enables evaluation of hundreds to thousands of different T-cell constructs for engineered cellular immunotherapies.
INTRODUCTION
T cells expressing transgenic T-cell receptors (TCRs) or chimeric antigen receptors (CARs) have emerged as powerful treatment options for some malignancies.1–3 However, T-cell function can fail as a result of chronic stimulation.4,5 Chronically-stimulated T cells can differentiate into dysfunctional states characterized by expression of inhibitory receptors (e.g., PD-1, LAG-3, TIM-3), reduced proliferation and cytokine production, and altered transcriptome and chromatin landscapes.6–11 T-cell dysfunction with hallmarks of exhaustion has been identified as a major contributor to poor treatment response.12 Thus, engineering therapeutic T cells with improved fitness in contexts that otherwise predispose T cells to dysfunction - including chronic stimulation and tonic signaling - is a promising strategy to improve clinical responses.
Advances in genome engineering have offered numerous approaches to increase T-cell fitness. One approach is to tune CAR regulation/signaling by targeted CAR integration under promoter regulation of the endogenous TCR alpha constant chain (TRAC)13 or by screening co-stimulatory domains to identify favorable CAR designs.14–16 A second approach uses CRISPR/Cas9 to ablate genes that restrict durable T-cell function. CRISPR/Cas9-mediated knockout (KO) of inhibitory receptors – starting with PD1 - has been attempted in clinical trials.17 Loss-of-function screens continue to nominate perturbations that increase T-cell fitness such as KO of Regnase-1 and/or Roquin,18–20 Pfpn2,21 SOCS122 or RASA2.23,24 Third, gain-of-function screens using CRISPR activation (CRISPRa)25 or lentiviral libraries of open reading frames (ORFs) have revealed promising perturbations such as overexpression of Lymphotoxin Beta Receptor (LTBR).26 However, these gain-of-function screening approaches were not combined with antigen-specific TCRs or CARs in primary human T cells at scale, and CRISPRa screens cannot test synthetic gene products.
A promising approach is to engineer the state of TCR-/CAR-T cells by direct modulation of transcriptional regulators or through synthetic surface receptors (SRs) that alter cellular responses to external cues. For example, overexpression of AP-1/ATF transcription factors (TFs) c-JUN or BATF can improve CAR T-cell function.27,28 Numerous groups designed synthetic genes encoding “switch” receptors that convert inhibitory into activating signals by fusing domains of inhibitory receptors (e.g., PD-1) to activating domains (e.g., CD28).29–31 An array of synthetic receptors including CD200R/CD28 and TIM-3/CD28 have been developed,32,33 but systematic analysis is required to learn the rules that govern which domain pairings are most effective. More broadly, a modular screening approach is required to discover combinations of TFs or SRs that can be coupled with specific TCRs/CARs to improve functional performance.
Targeted CRISPR-mediated knockin screens not only allow for testing of constructs at specific loci, but also overcome several limitations of pooled lenti-/retroviral screening approaches: viral recombination;34 semi-random integration;35,36 and variable integration numbers. We previously developed a non-viral pooled knockin (PoKI) platform and screened a 36-member library in combination with an NY-ESO-1-specific TCR.37 However, scaling of this approach was impeded by substantial barcode/construct misassignment due to template switching, which limited library size and adaptability.
Here we developed Modular Pooled Knockin (ModPoKI) to screen up to thousands of synthetic sequences combined with clinically relevant TCR/CAR genes at targeted genomic sites.38,39 Barcoded adaptors facilitate pooled cloning, quantification by amplicon-sequencing and compatibility with single-cell sequencing. We generated a 100-member TF library, a 129-member SR library and a ~10,000-member combinatorial TFxTF library. Using bead stimulation, target-cell stimulation, repetitive stimulation and tonic signaling assays, we performed >30 unique screens. The screens nominated multi-gene constructs that improved T-cell fitness, including a TFAP4 and BATF multi-gene knockin where TFAP4 and BATF overexpression work coordinately to shape gene expression and T-cell function. Overall, these studies highlight large-scale ModPoKI screens as a powerful method to accelerate programming of cell states with enhanced durability and therapeutic functions.
RESULTS
ModPoKI Enables Pooled Knockin of Hundreds of Multi-Gene Constructs
Recent studies have indicated that reprogramming T-cell states by overexpressing transcription factors (TFs) can enhance therapeutic function.27,28 Here, we screened 100 TFs (and related proteins) and 129 surface receptors (SRs) in the setting of different TCR/CAR specificities and diverse biological contexts (Figure 1A) to provide a systematic resource of gene constructs for improved T-cell functionality.
Figure 1. ModPoKI Screens to Identify Therapeutic Candidates.
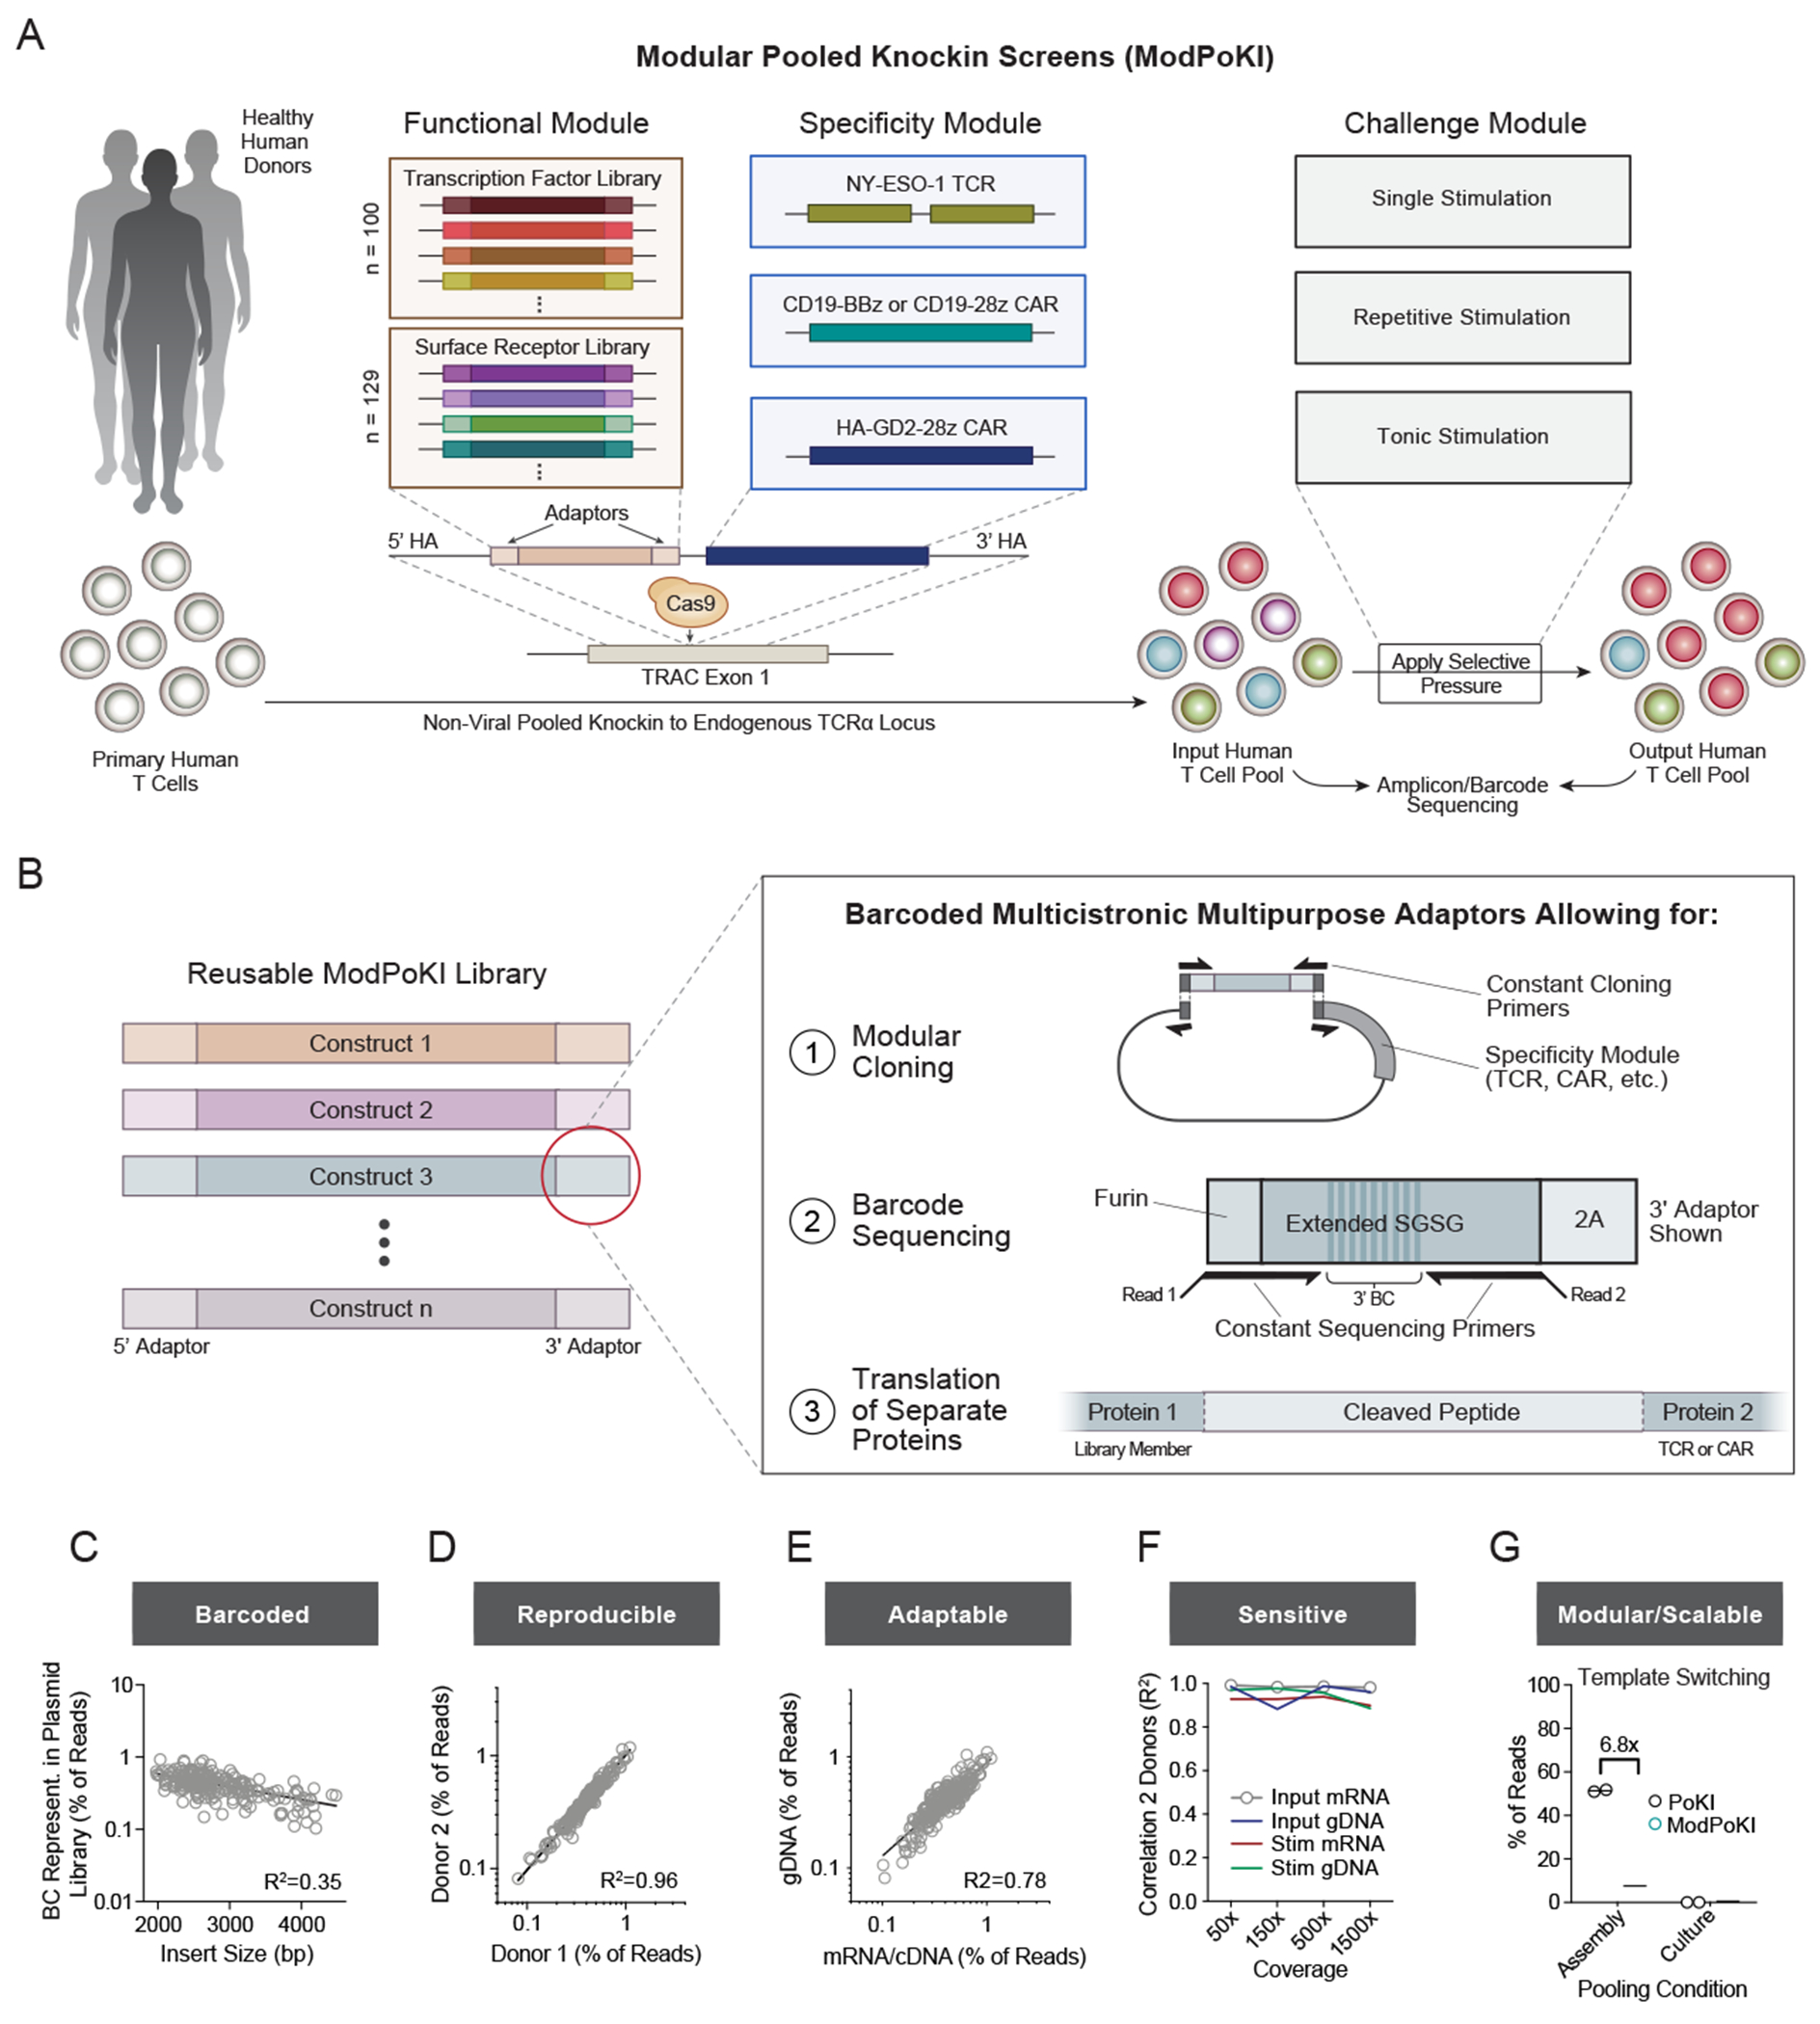
(A) Schematic illustration of the ModPoKI platform.
(B) Barcoded multicistronic adaptors allowed for modular cloning, barcode-sequencing and translation of separate proteins. A furin sequence was included to help remove 2A residues from the upstream gene product.41,42
(C) Barcode representation in the plasmid library (100 TFs, 129 SRs). N = 2 replicates. Indicated insert size does not include homology arms.
(D) Sequencing of the 5’ BC from gDNA after ModPoKI was reproducible across n = 2 human donors (7 days after electroporation).
(E) Correlation between gDNA and mRNA/cDNA barcode-sequencing for one exemplary donor (7 days after electroporation). The second donor confirmed strong correlation (R2=0.76).
(F) Donors were highly correlated across cell coverage ranges, sequencing strategies and experimental conditions (input cells (day 7 after electroporation) vs cells after 4 days of CD3/CD28 bead-stimulation (day 11)).
(G) A pilot two-member library of the NY-ESO-1 TCR plus GFP vs RFP was pooled at the plasmid assembly stage or after separate electroporation (Figure S1I). T cells were sorted for TCR knockin and GFP or RFP positivity. Percentage of correctly assigned barcodes was determined by amplicon-sequencing (3’ barcode of mRNA/cDNA). The amount of template switching was calculated, extrapolated for an n > 200-member library37 and compared to the previous PoKI version.37 Bars represent mean. N = 2 donors.
Panels C-F include data from NY-ESO-1 TCR TF and SR libraries.
R2 was calculated using nonlinear regression (semilog (C) or log-log line model (D-F), GraphPad Prism).
In our previously developed PoKI screening platform37, we had observed incorrect barcode/construct assignment due to template switching that prevented pooling at early stages and complicated scaling and adaptability. Template switching refers to a phenomenon where knockin sequences are not correctly associated with their identifying barcode.40 PoKI uses PCR to generate dsDNA templates from pooled plasmid libraries for homology-directed repair (HDR). During PCR amplification, the polymerase can terminate between barcode and sequence of interest, resulting in an incomplete product that can serve as a primer in the next cycle to produce a chimera of the gene of interest with an unrelated barcode. In addition, the polymerase can jump between templates during elongation.40 As we now aimed to screen hundreds of T-cell constructs in combination with various specificities (CAR/TCR), we developed ModPoKI (Figure 1A).
We generated constructs with multicistronic adaptors that were placed between the DNA sequences of the functional module (TF/SR) and the specificity module (CAR/TCR) and consisted of barcode-bearing linkers and cleavage sites (Figures 1B, S1A–C) including a furin sequence to help remove 2A residues from the upstream gene product.41,42 Each library member received two unique barcodes to determine construct identity at the genomic DNA or mRNA/cDNA level (Methods), an approach that could enable >37 million possible combinatorial barcodes. Double-stranded HDR templates were generated from the pooled plasmid libraries by PCR and then non-virally integrated into the human TRAC locus using CRISPR/Cas9 ribonucleoprotein (RNP) (Figure S1D).38 85% of the expressed insertions were calculated to be monoallelic (Figure S1E). The resulting ModPoKI system is barcoded (Figures 1C, S1F), reproducible across donors (Figures 1D, S1G) and adaptable between mRNA/cDNA and gDNA barcode-sequencing (Figures 1E, S1H). It is highly sensitive (Figure 1F) and modular/scalable due to reduced template switching (<10%), likely due to reduced distance between the barcode and gene insert (Figures 1G, S1I). Pooled knockin single-cell RNA-sequencing with barcode-sequencing (ModPoKI-Seq) at low coverage confirmed strong correlation of barcode and gene expression (Figure S2A). In summary, ModPoKI screens enable rapid evaluation of hundreds of T-cell constructs for engineered immunotherapies.
Design of Large Synthetic Libraries for ModPoKI Screens
We designed two libraries to reprogram T-cell function through TF overexpression or altered SR signaling. The TF library consisted of 100 members encompassing different TF families (Figure S2B) including known regulators of T-cell proliferation, TFs that increase anti-tumor functions, and TFs with unknown functions in immunotherapy. We covered TFs predominantly expressed in CD4 and CD8 T cells, including TFs that are dynamically regulated upon T-cell activation (Figure S2C, https://dice-database.org/). We also incorporated TFs that are predominantly expressed in monocytes, NK and B cells to determine if subsets of these could be used to “synthetically” program improved T-cell fitness (Figure S2C, Table S1A).
The SR library included mostly synthetic chimeric receptors (“switch receptors”) in which the extracellular domain of an inhibitory checkpoint, death or other TNF receptor superfamily member was fused to an intracellular domain of an activating receptor to convert inhibitory ligand-receptor interactions into activating signals (Figure S2B). We used a modular design in which a variety of different extracellular domains were combined with either 4-1BB, CD28, ICOS or other intracellular activation domains. Taken together, the SR library comprises both published switch receptors and >80 fusion receptors alongside chemokine, cytokine, metabolic receptors (e.g., metabolite transporters) and stimulatory molecules (Table S1B).
Discovery of Constructs to Promote Fitness of Stimulated T Cells
We first aimed to identify constructs that could be integrated into the endogenous TRAC locus to enhance T-cell fitness following a single re-stimulation. The 1G4 95:LY variant of the NY-ESO-1 TCR (which functions independently of the CD4 or CD8 co-receptor43) was introduced into bulk T cells in combination with the TF or SR library. The KI T-cell pool was subjected to various signals including CD3-only stimulation, CD3/CD28 bead-based stimulation, excessive CD3/CD28 stimulation or stimulation with NY-ESO-1+ target cells (A375 melanoma cells naturally expressing NY-ESO-1/HLA-A2 or Nalm-6 leukemia cells transduced with HLA-A2/NY-ESO-1) (Figure 2A). RNA was isolated, transcribed into cDNA and barcode amplicon-sequencing was performed to compare the abundance of each construct in the input and output populations. KI of basic leucine zipper (bZIP) TFs (BATF, BATF3) or helix-loop-helix TFs (ID2, ID3) had strong effects on T-cell fitness (Figures 2B–C, S2D). Among the top negative hits were EOMES, required for effector differentiation44 and associated with exhaustion in anti-tumor T cells,45 and NFATC1, which can promote exhaustion in CD8+ T cells (Figures 2B–C, S2E).9 Interestingly, BATF KI provided an advantage even in the absence of re-stimulation, suggesting potential stimulation-independent effects.
Figure 2. Single Stimulation ModPoKI Screens Reveal Known and Previously Undescribed Candidates.
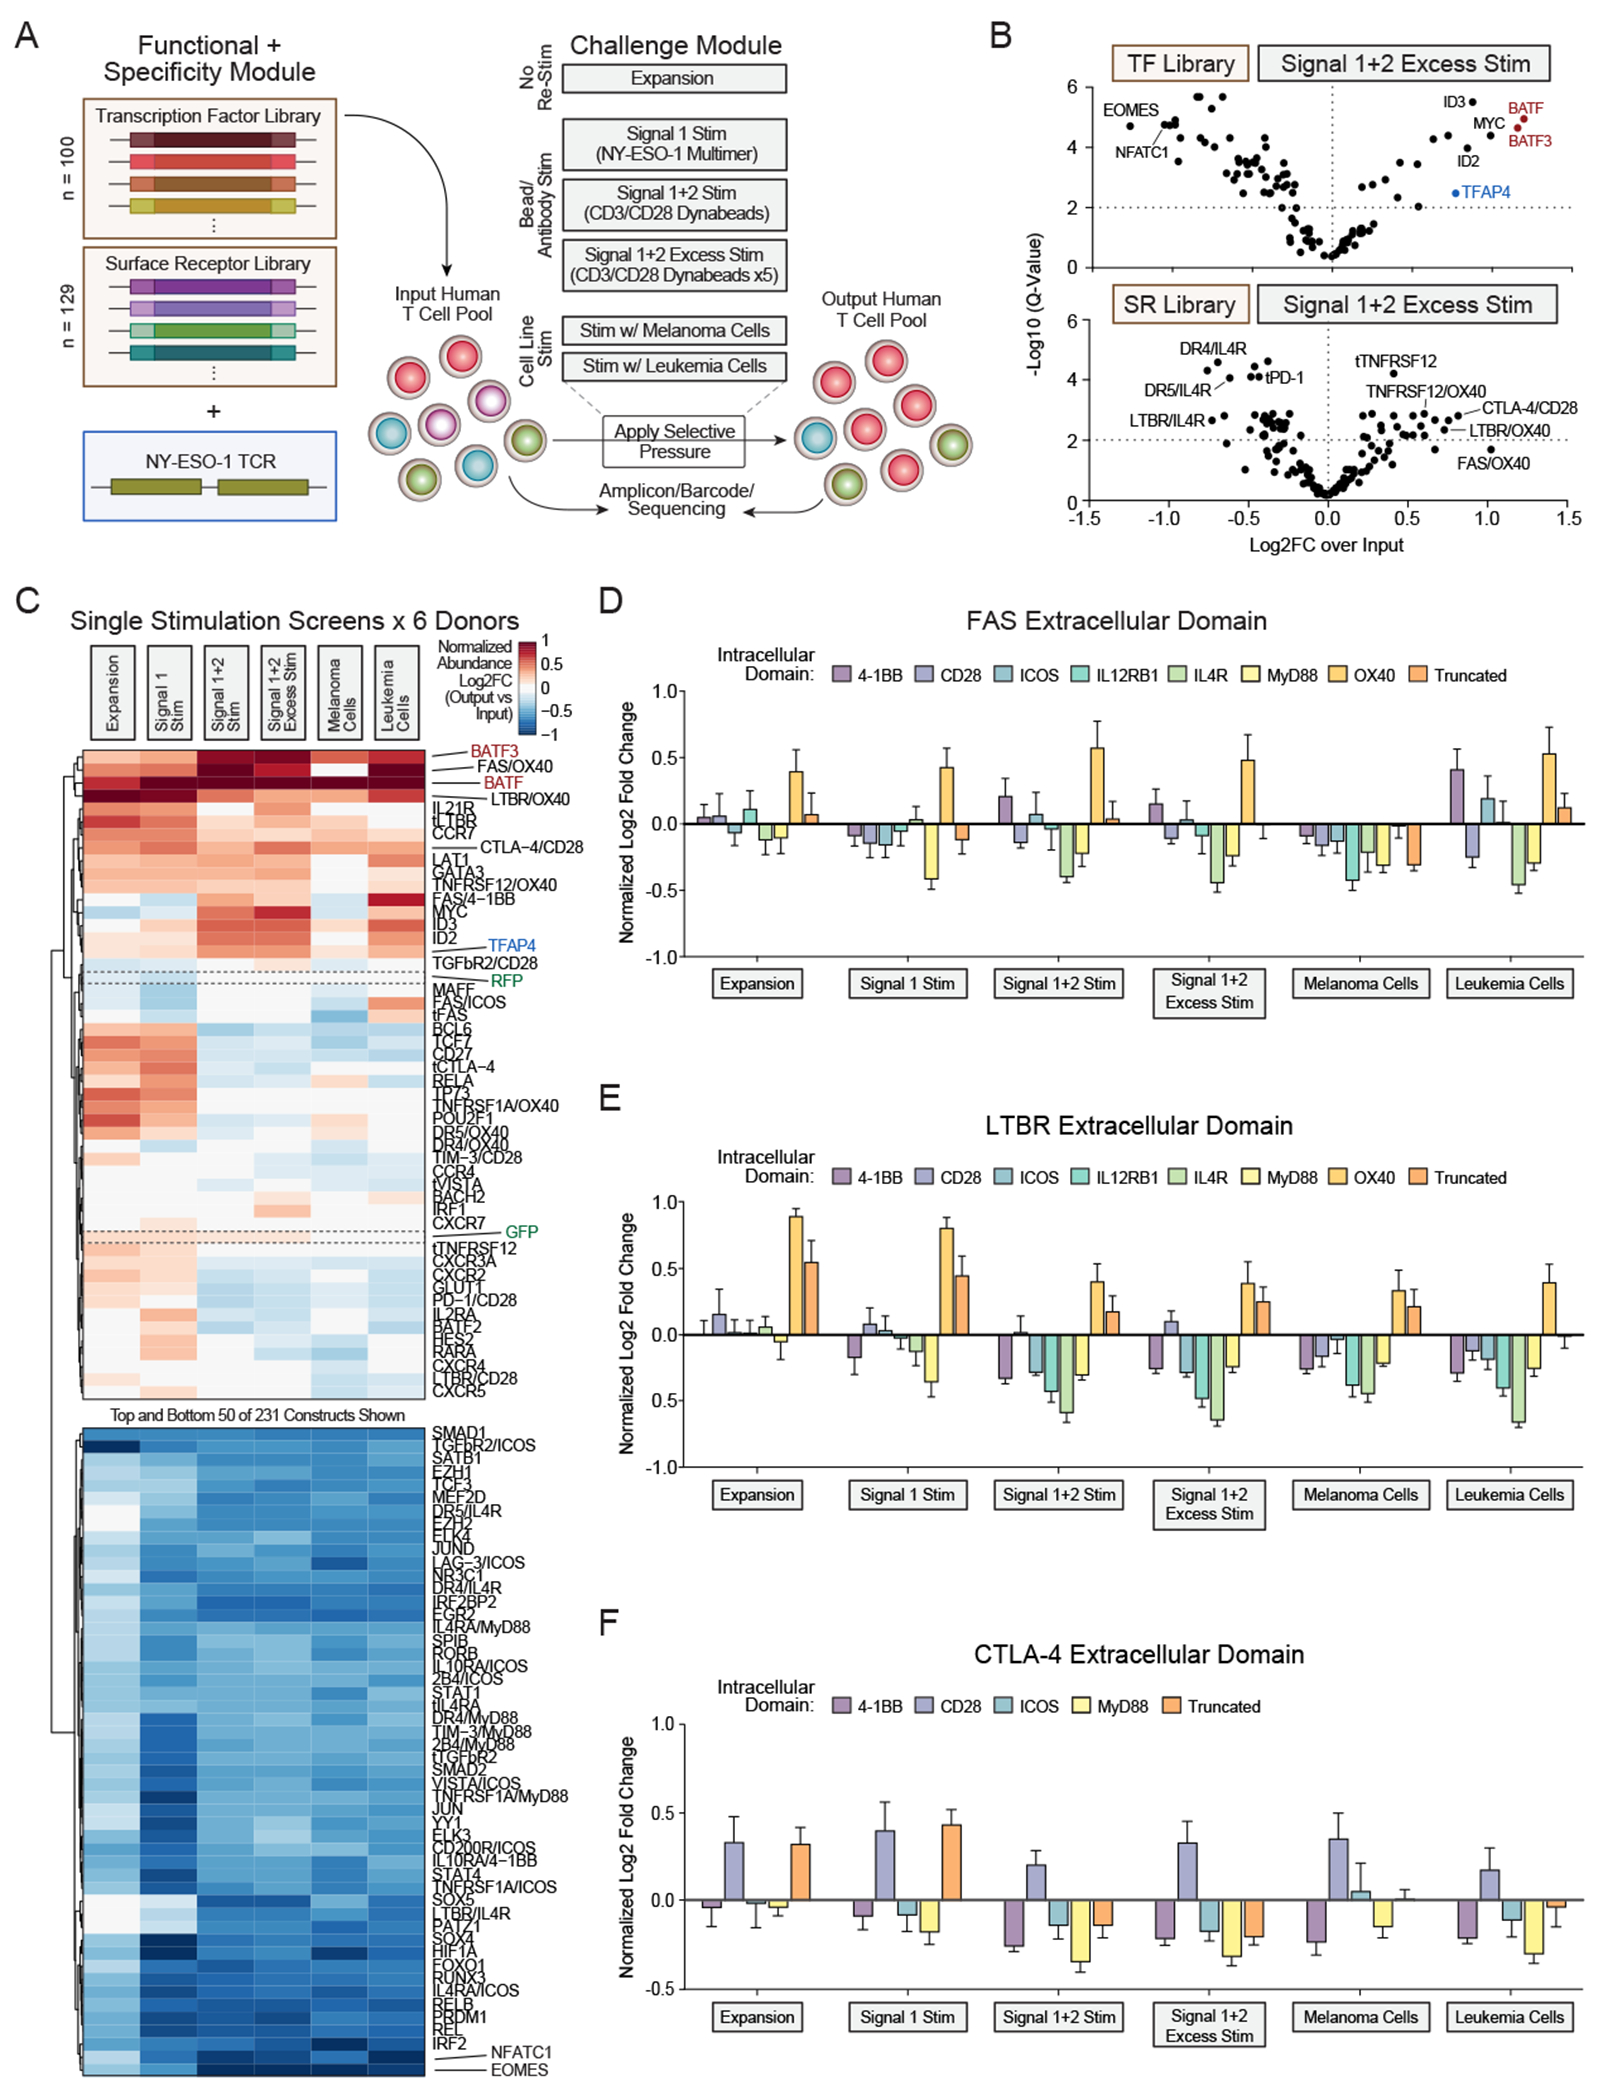
(A) ModPoKI screens were performed in primary human T cells using the NY-ESO-1 TCR TF and SR libraries. Signal 1 Stim = anti-CD3 antibody, Signal 1+2 Stim = CD3/CD28 beads (1:1 bead:cell ratio), Signal 1+2 Excess Stim = CD3/CD28 beads (5:1 bead:cell ratio), Melanoma Cells = A375s, Leukemia Cells = Nalm-6 (overexpressing HLA-A2/NY-ESO-1).
(B) Amplicon/barcode-sequencing was performed before and after excessive CD3/CD28 stimulation to determine log2FC in construct abundance (after vs before stim). FDR was calculated using the Benjamini-Krieger-Yekutieli method.
(C) Representation of T-cell constructs was evaluated prior to and after different stimulation conditions.
(D-F) Effect of the intracellular domains of FAS, LTBR and CTLA-4 switch receptors was analyzed.
N = 6 donors (B-F).
Mean + SEM log2FC over input population is shown. Log2FC was normalized to abundance of RFP/GFP controls and to fit on a scale from −1 to +1 for comparability (C-F).
KI of SR library members could also modulate T-cell fitness upon stimulation. Notably, upon excessive stimulation, a subset of receptor fusions (e.g., LTBR/OX40 and TNFRSF12/OX40) enhanced T-cell fitness (Figures 2B–C, S2F–G). Another hit was CTLA-4/CD28, the mouse version of which was shown to increase efficacy of donor-lymphocyte infusions in preclinical models.46,47 Fusion receptor FAS/OX40 strongly promoted T-cell abundance across multiple screening conditions. Overall, FAS, LTBR, and CTLA-4 extracellular domains tended to perform best (Figure 2C). OX40 intracellular domains performed well with both FAS and LTBR extracellular domains (Figures 2D–E). Interestingly, CD28 was the only intracellular domain tested that increased abundance with the CTLA-4 extracellular domain (Figure 2F). Validation analyses revealed that FAS fusion proteins can increase the cytotoxic potential of NY-ESO-1 TCR-T cells during co-culture with Nalm-6 leukemia cells (Figures S3A–F). Interestingly, FAS fusion proteins seemed to perform better in co-culture with Nalm-6 cells compared to co-culture with A375 melanoma cells (Figure 2C), which could be explained by higher FASL levels on T cells after co-culture with Nalm-6 (Figure S3G). Arrayed validation across different synthetic FAS constructs revealed large differences in surface expression level, although all constructs shared the same extracellular and transmembrane FAS domain (Figure S3A). FAS constructs with higher surface expression tended to perform better in the ModPoKI screen (Figure S3B), which highlights the platform’s ability to test chimeric protein design and ensure proper expression, localization and function. In summary, these highly parallelized functional assays have potential to inform design of fusion receptors that confer context-specific benefits to T-cell therapies.
Repetitive Stimulation Screens Discover that TFAP4 KI Improves Persistent T-Cell Fitness
Therapeutic T cells must maintain persistent function through multiple rounds of target recognition if they are to clear large tumor burdens. Unfortunately, repetitive stimulation can lead to T-cell dysfunction. To discover constructs that can promote persistent T-cell fitness, we performed a repetitive stimulation screen and transferred the T-cell pool to fresh cancer cells every 48h for five consecutive stimulations (Figure 3A). Pilot experiments with a control KI (NY-ESO-1 TCR plus tNGFR, truncated Nerve Growth Factor Receptor) confirmed that repetitive stimulations with cancer cells drive enrichment of NY-ESO-1 antigen-specific cells (Figure S3H) and increasingly differentiated T-cell phenotypes (Figure 3B). PD-1 expression, which can be induced by T-cell stimulation, increased after one stimulation and then decreased over time similar to what was observed in related studies.23 Notably, LAG-3 and TIM-3 (co-inhibitory receptors)48 remained elevated through multiple rounds of stimulation, and CD39 and TOX (markers of exhaustion)49–52 increased gradually (Figures 3C, S3I). RNA-seq confirmed increased TOX expression, along with decreases from peak levels in CD62L (SELL), Granzyme B (GZMB) and IFN-g (IFNG) expression over time, consistent with cellular dysfunction (Figures S3J–L). This in vitro model with repetitive exposure to cancer cells provides opportunities to discover KI constructs that enhance persistent T-cell fitness.
Figure 3. ModPoKI Screens Identify Highly Functional T-Cell Constructs after Repetitive Stimulation.
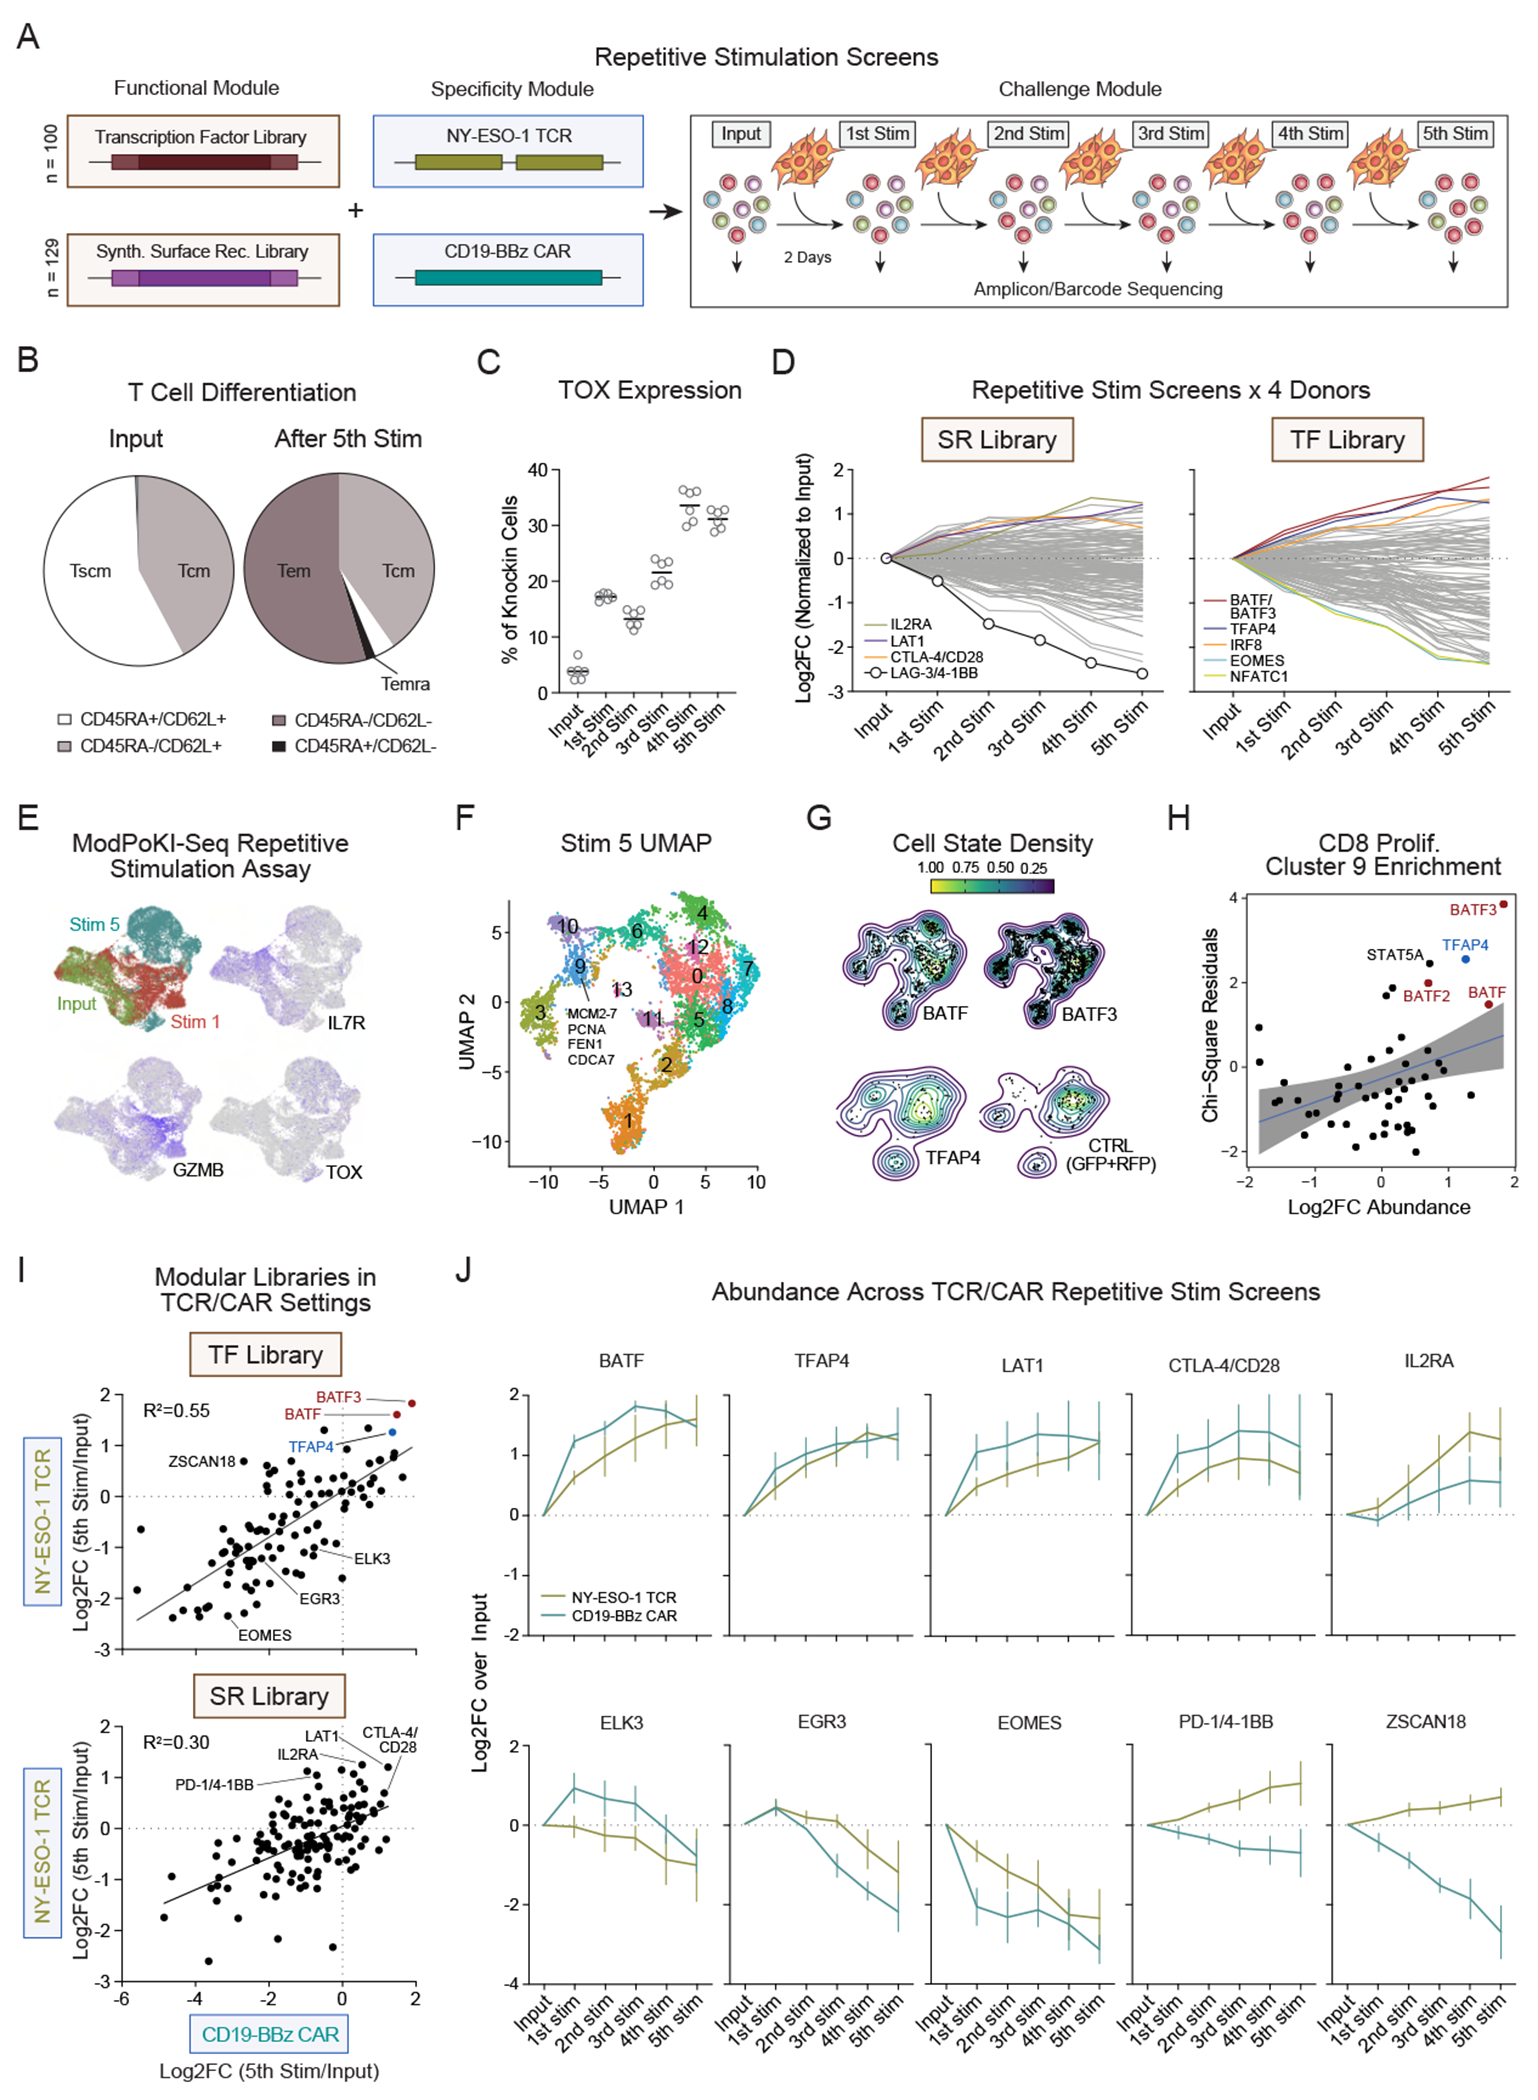
(A) Schematic illustration of the repetitive stimulation screens.
(B) Control T cells (tNGFR NY-ESO-1 TCR) were generated and subjected to repetitive stimulation to evaluate T-cell phenotype.
(C) Intranuclear expression of TOX was measured by flow cytometry (tNGFR NY-ESO-1 TCR). Bars represent mean.
(D) ModPoKI T cells were generated using the NY-ESO-1 TCR SR and TF libraries. Average log2FC of construct abundance compared to input population is shown.
(E) The TF library (with NY-ESO-1 TCR) was knocked into T cells and single-cell RNA-sequencing with barcode-sequencing (ModPoKI-Seq) was performed. UMAP shows overexpression of hallmark genes at the input stage, after one and five stimulations with targets.
(F) Semi-supervised clustering of single cells based on gene expression after five stimulations. Cluster 9 cells expressed hallmarks of proliferating CD8 cells. Highlighted hallmark genes were derived from top 30 differentially expressed genes.
(G) Density plot of top candidates compared to control knockins (GFP,RFP) after five stimulations.
(H) Chi-square residuals for cluster 9 enrichment (proliferating CD8 cells, threshold >30 cells/knockin after 5 stimulations) were compared to abundance log2FC in bulk screens. N = 2 donors for ModPoKI-Seq screen, n = 4 donors for bulk screens. Enrichment of KIs in other clusters is depicted in Figure S4D.
(I) CD19-BBz CAR TF and SR libraries were generated by pooled assembly. Repetitive stimulation CAR screening hits were compared to TCR screening hits. Nonlinear regression (line model, GraphPad Prism) was used to determine R2.
(J) Abundance log2FC (output vs input) was compared between CAR vs TCR repetitive stimulation screens. Mean + SEM shown.
N = 2 donors in technical triplicates (B-C), n = 4 donors (D), n = 2 donors (E-G), n = 4 donors for TCR screens and n = 3 donors for CAR screens (I-J).
We introduced the SR or TF library in combination with the NY-ESO-1 TCR into primary human T cells via ModPoKI and monitored construct abundance throughout repetitive stimulation. Constructs in the SR library encoding the high-affinity IL-2R subunit (IL2RA) and the amino acid transporter LAT1 increased in abundance after five stimulations with target cells, highlighting that overexpression of natural surface receptors can induce durable fitness in T cells challenged by repetitive stimulation (Figures 3D, S3M–N).
In the TF screen, BATF and BATF3 strongly promoted T-cell fitness over multiple stimulations. In contrast, EOMES and NFATC1 constructs dropped out suggesting that they limit persistent T-cell fitness (Figures 3D, S3M–N). KI of transcription factor AP4 (TFAP4) emerged as a new hit in the repetitive stimulation assay that had only mild effects in single stimulation screens. TFAP4 is a basic helix-loop-helix (bHLH) TF that has been studied primarily in the context of murine viral infections where it is crucial for sustained T-cell activation and expansion.53 In summary, these results nominated promising constructs and highlight the importance of testing candidate KIs in experimental contexts designed to assess persistent T-cell fitness.
We next molecularly characterized the effects of TF KIs in the repetitive stimulation challenge. We coupled ModPoKI with single-cell RNA-seq (ModPoKI-Seq) to discover transcriptomic profiles promoted by 100 TF KIs. We performed ModPoKI-Seq at the input stage, after one stimulation and after five stimulations with targets. The input population, stim 1 and stim 5 populations clustered separately with expected expression of hallmark genes (Figure 3E). The best-performing KIs in the fitness screens promoted relatively modest transcriptional changes relative to controls (GFP/RFP), while worse-performing constructs often caused a higher variance in gene expression (Figures S4A–B). To examine the more subtle beneficial transcriptional changes, we performed semi-supervised clustering of transcriptomes after five stimulations with target cells. This revealed a cluster of CD8 cells characterized by high expression of genes associated with proliferation (Cluster 9), where cells were most strongly enriched for the KIs of top hits in our repetitive stimulation screen including BATF3 and TFAP4 (Figures 3F–H, S4C–D). Key TF hits did not appear to influence fitness by consistently altering TRAC transcript levels, although TFAP4 KI modestly increased TCR protein levels (Figures S4E–I). ModPoKI-Seq during repetitive stimulation can offer mechanistic insights into gene programs – TFs and downstream target genes – that can be modulated to promote persistent T-cell function.
ModPoKI pooled assembly allowed us to combine the same TF and SR libraries with a CD19-BBz CAR (Figure S5A). We observed good correlation of hits when comparing NY-ESO-1 TCR with CD19-BBz CAR screens (Figures 3I–J, S5B). KI of BATF, BATF3, TFAP4 or a CTLA-4/CD28 chimeric receptor all promoted durable fitness of CD19-BBz CAR-T cells in the repetitive stimulation assays, as they had with NY-ESO-1 TCR-T cells (Figures 3I–J). EOMES KI again dropped out with repetitive stimulation (Figure 3J). Interestingly, we identified TFs that had increased abundance after a single stimulation but failed to maintain this advantage after repetitive stimulations (e.g., EGR3, ELK3). While many constructs overall performed similarly when combined with a CAR vs a TCR, we observed some constructs (e.g., PD-1/4-1BB, ZSCAN18) that had different kinetics in the CAR vs TCR screens (Figures 3J, S5C–E). We performed an additional repetitive stimulation screen using a CD19-28z CAR to assess if different constructs would enhance fitness of a CAR with a different intracellular domain (CD28-zeta vs 4-1BB-zeta) (Figures S5F–K). Chimeric receptors with 4-1BB intracellular domains tended to perform better in this context, suggesting combinatorial effects of 4-1BB and CD28 signals or disadvantageous effects of excessive 4-1BB signaling (Figure S5H). In summary, repetitive stimulation screens highlighted constructs that preferentially promote durable fitness through multiple rounds of target-cell recognition. Differences in the performance of gene KIs paired with CD19-BBz vs CD19-28z CARs vs TCRs further underscore the importance of screening with the exact therapeutic construct that will later be used in the clinic.
TFAP4 KI Improves T-Cell Fitness During Chronic Stimulation
In addition to facing repetitive stimulation, CAR-T cells are challenged by tonic signaling, which can also promote T-cell dysfunction.54 In order to discover synthetic constructs that promote T-cell fitness during tonic signaling, we combined our libraries with the high-affinity GD2-28z CAR (HA-GD2-28z) demonstrated to drive an “exhaustion-like” state through tonic signaling.28 Although the HA-GD2-28z CAR might drive a less dysfunctional phenotype when placed under TRAC promoter control compared to retroviral delivery, we did observe tonic activation, decreased memory markers (CCR7, LEF1) and increased levels of dysfunction markers (TOX, LAG3, HAVCR2 (TIM-3), ENTPD1 (CD39)) on HA-GD2-28z CARs (Figures S6A–C). We performed ModPoKI of the HA-GD2-28z CAR with the SR (Figures S6D–E) or the TF library (Figure 4A). In the TF library, TFAP4 was distinctive in its strong enrichment trajectory in the HA-GD2-28z CAR screen (Figure 4B). While constructs containing BATF and BATF3 showed increased abundance across multiple screens, TFAP4-overexpressing constructs were more clearly enriched in chronic stimulation settings that promote dysfunction, especially with the tonic-signaling HA-GD2-28z CAR.
Figure 4. ModPoKI across Dysfunction Screens Nominates Candidate TFAP4.
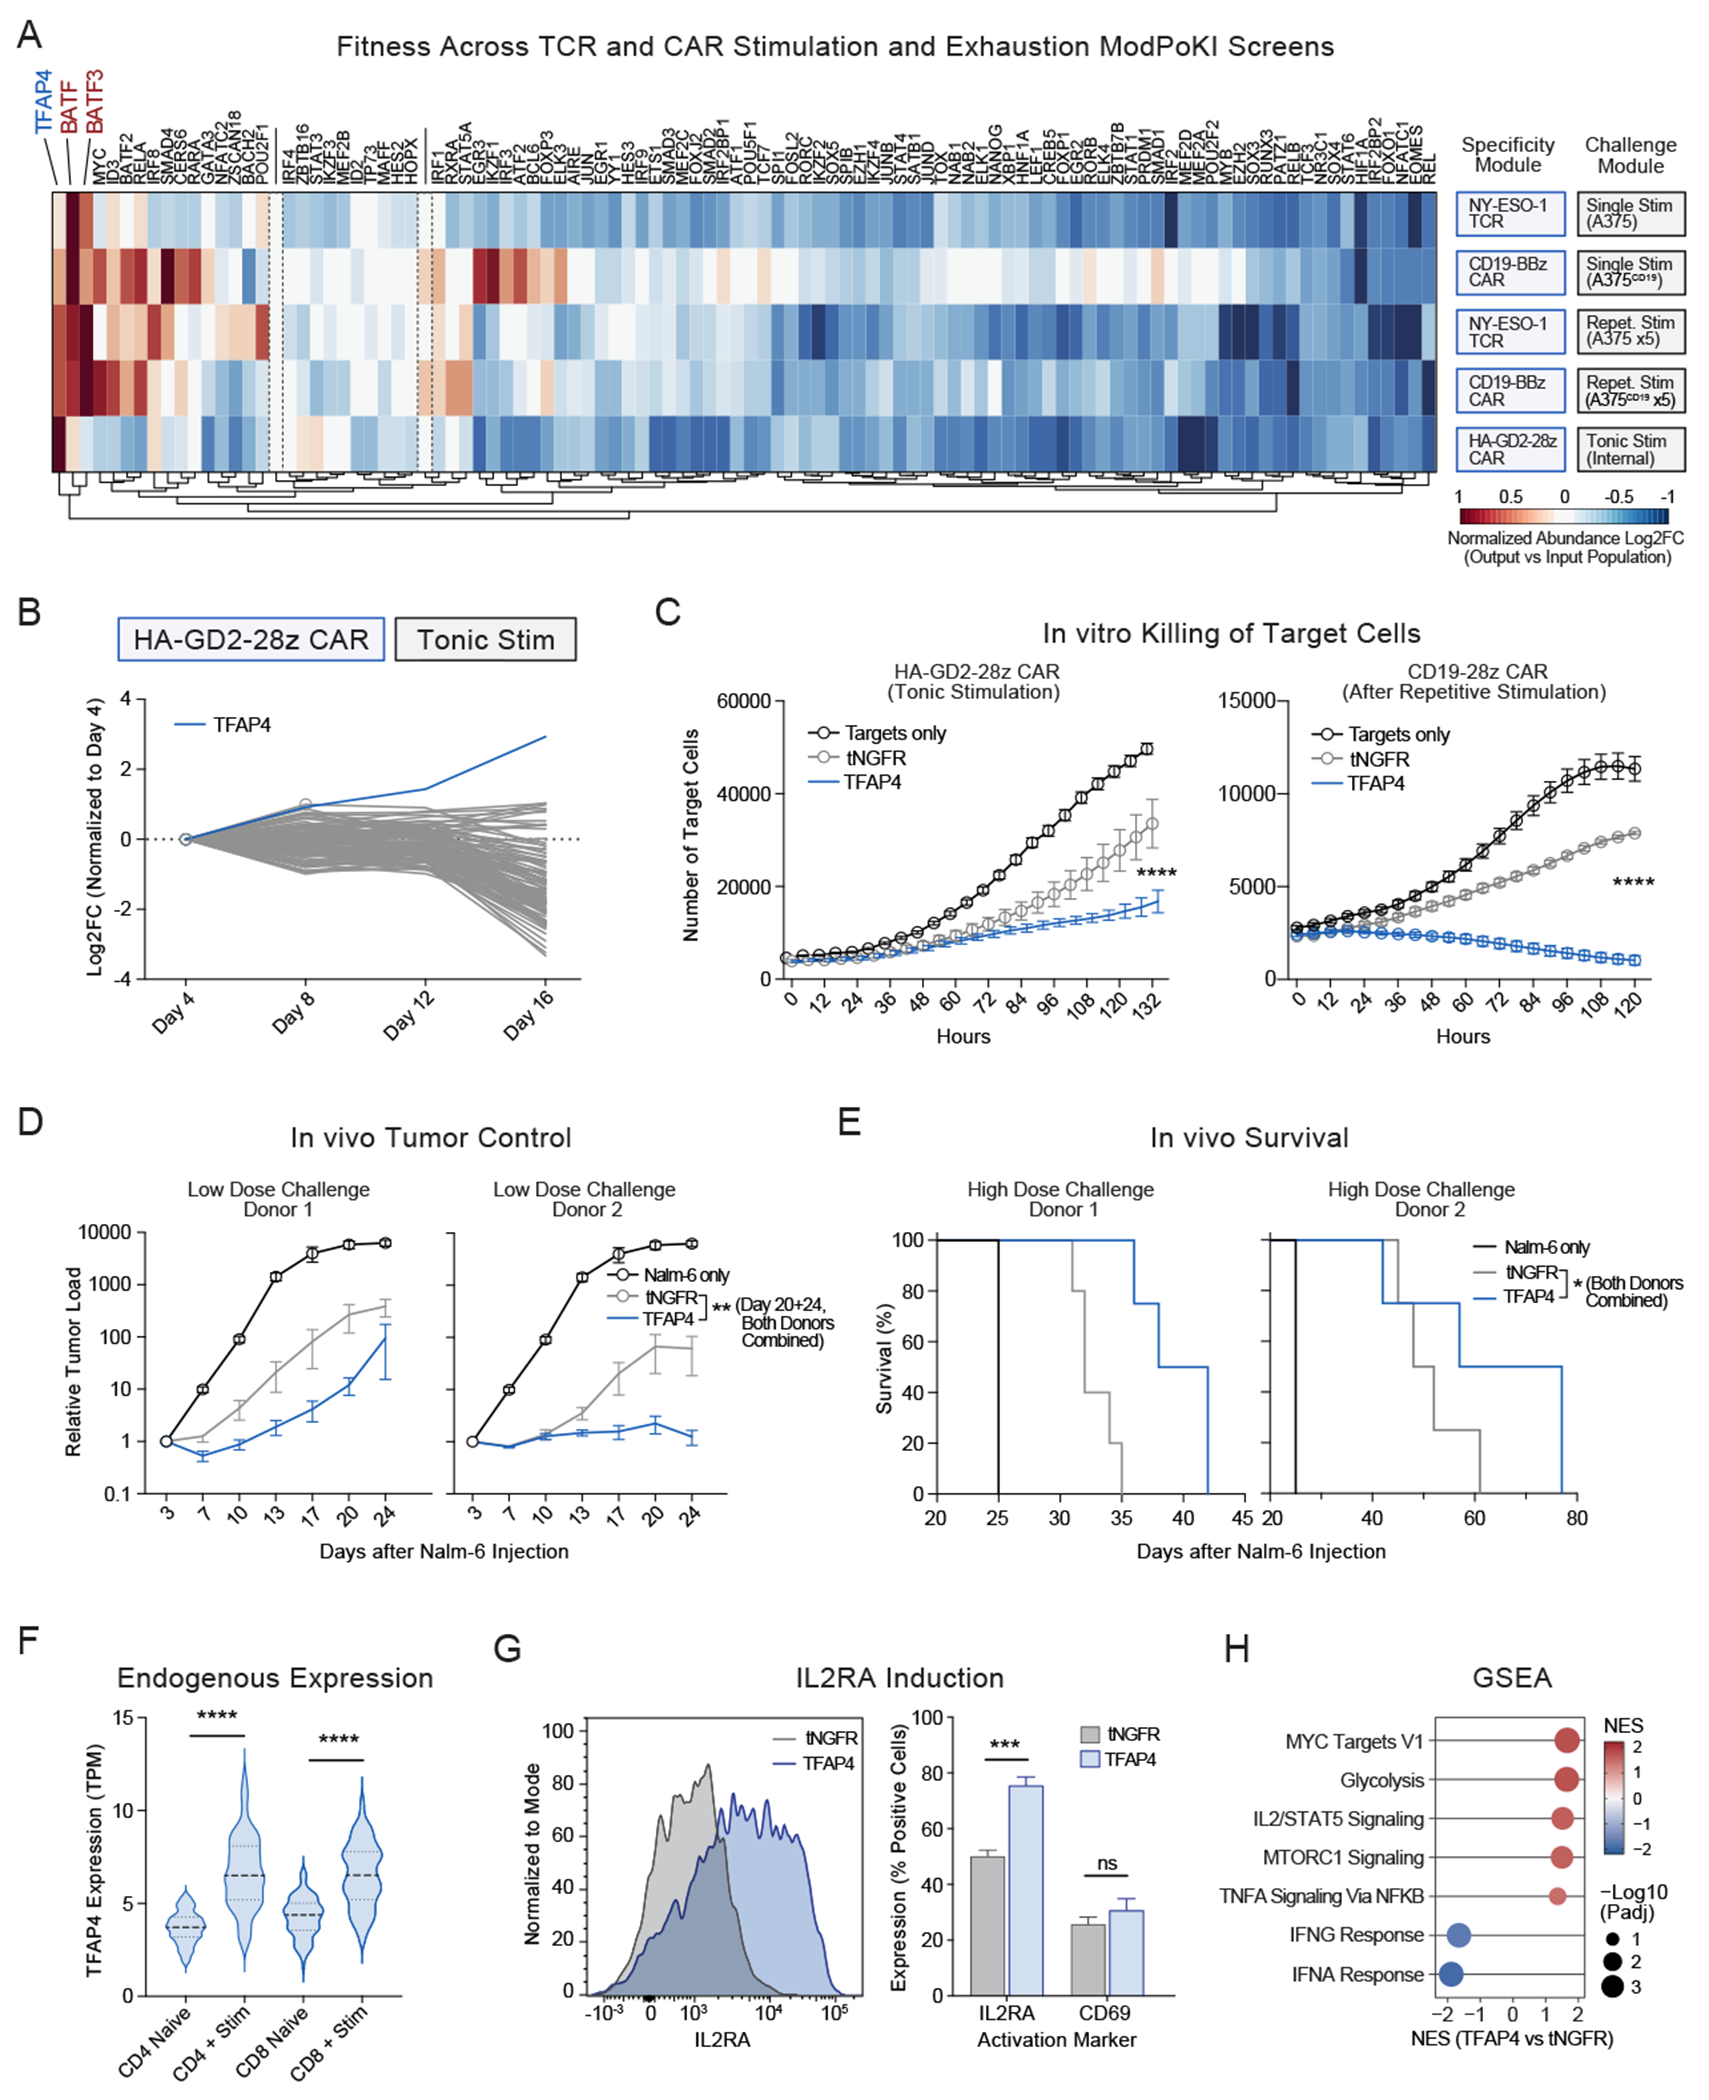
(A) ModPoKI screens with the TF library were performed in NY-ESO-1 TCR and CD19-BBz CAR (single or repetitive stimulation) or HA-GD2-28z CAR (tonic stimulation) T cells. As the HA-GD2-28z CAR provides tonic stimulation, HA-GD2-28z CAR T cells were cultured without addition of targets. Abundance log2FC is shown. Heatmap was normalized based on controls (RFP/GFP) and to fit on a scale from −1 to +1. N ≥ 3 donors/screen.
(B) Log2FC in the HA-GD2-28z CAR screen shows strong progressive enrichment of TFAP4 KI cells. Mean of n = 4 donors.
(C) Single knockin of the HA-GD2-28z or CD19-28z CAR with TFAP4 or control (tNGFR) was performed and cancer-cell killing was analyzed (Incucyte). CD19-28z CARs were pre-stimulated with targets five times. N = 2 donors/experiment in technical triplicates (HA-GD2-28z CAR) or quadruplicates (CD19-28z CAR). Two-way ANOVA was performed including Holm-Sidak’s test as described in the Methods. Significance at last timepoint (TFAP4 vs tNGFR) is shown; E:T ratio 1:4 (left) and 1:1 (right panel).
(D) NSG mice were challenged with 0.5e6 Nalm-6/GFP/Luc/GD2 cells and treated with 1e6 HA-GD2-28z CAR+ T cells. Cancer growth was analyzed by bioluminescence imaging. Two T-cell donors are shown (5 mice/donor/construct). Multiple unpaired t-test (TFAP4 vs tNGFR) with Holm-Sidak’s test was performed (both donors combined).
(E) NSG mice were challenged with 1e6 Nalm-6/GFP/Luc/GD2 cells and treated with 3e6 HAGD2-28z CAR+ T cells. Survival analysis for mice treated with CAR-T cells from two donors is shown (≥4 mice/donor/construct). COX regression was performed (TFAP4 vs tNGFR, both donors combined).
(F) Expression of endogenous TFAP4 in naïve vs activated T cells in published RNA-seq data (https://dice-database.org/). Unpaired t-test was performed.
(G) IL2RA and CD69 expression on HA-GD2-28z CAR-T cells was analyzed on day 8 after electroporation. Multiple t-test was performed including Holm Sidak’s test. N = 2 donors in technical duplicates.
(H) RNA-sequencing of HA-GD2-28z CAR-T cells with TFAP4 or tNGFR KI was performed 7 days after electroporation. N = 2 donors.
Mean + SEM shown (C-D, G).
We next performed arrayed KIs of CARs in combination with TFAP4 or a control (tNGFR) for deeper characterization and validation of potential benefits. First, we confirmed that TFAP4 HA-GD2-28z CARs expand more than co-cultured control T cells over time (Figures S6F–H). We next co-cultured GD2+ cancer cells with HA-GD2-28z CAR-T cells and observed that the TFAP4 KI constructs improved killing capacity across multiple effector:target (E:T) ratios (Figures 4C, S6I). Effects of non-viral KI of the TFAP4 and HA-GD2-28z CAR polycistron under TRAC promoter control differed from effects of retroviral transduction. With retroviral transduction, TFAP4 still enhanced killing capacity in vitro, but we did not observe increased fitness and cytokine release as we did with TRAC-targeted KI (Figures S7A–C). We also assessed effects on non-viral TRAC KI of a CD19-28z CAR. CD19-28z CAR-T cells demonstrated dysfunctional cancer-cell killing in vitro after multiple rounds of stimulation (Figure S7D), which was mitigated by TFAP4 KI (Figures 4C, S7E–G). Lastly, recognizing potential safety concerns, we confirmed that TFAP4 KI CD19-28z CARs spared CD19 negative targets (Figure S7H) and did not show antigen-independent proliferation (Figure S7I).
We next evaluated in vivo killing capacity conferred by TFAP4 KI in NSG mice that were challenged with Nalm-6/GFP/Luc/GD2 leukemia (Figure 4D). TFAP4 KI CAR-T cells enhanced leukemia control and survival in experiments using T cells from two human donors compared to controls (Figures 4D–E). In summary, TFAP4 KI promotes persistent and antigen-dependent anti-cancer T-cell function.
We next evaluated the phenotypic changes induced by TFAP4 KI in human T cells. First, we confirmed that non-viral TFAP4 KI can increase TFAP4 expression beyond physiologic levels at transcript (Figures S8A–B) and protein levels (Figures S8C–D). TFAP4 is a direct target of MYC expressed after T-cell activation (Figure 4F).55 TFAP4 expression is regulated by TCR and IL-2R signals and mediates sustained T-cell proliferation.53 We observed that synthetic TFAP4 KI resulted in increased levels of IL2RA (CD25) and promoted a gene signature enriched in the IL-2/STAT5 signaling pathway (Figures 4G–H, S8E–F). TFAP4’s potential to increase surface expression of IL2RA was confirmed in an independent ModPoKI screen, in which HA-GD2-28z CAR-T cells with the TF library were sorted for IL2RA high/low expression and TFAP4 was the most enriched TF KI in the IL2RA high bin (Figures S8G–H). RNA-seq also revealed increased levels of MYC target genes, IFN-g, and effector cytokine production, while it showed decreased IFN-g response genes (Figure 4H). Crucially, increases in IFN-g and IL-2 secretion were dependent on the presence of antigen-positive targets (Figures S8I–J). These results suggest that TFAP4 KI mediates increased proliferation and antigen-dependent cytokine production, and can promote T-cell states with enhanced fitness in the context of chronic stimulation.
Combinatorial ModPoKI Screens to Uncover Synergistic TF Combinations
TFs can act in combination to reprogram cells to desirable cell states.56 We wondered if we could discover combinations of TFs that enhance T-cell fitness during tonic signaling. Analyzing pairwise combinations of 100 different TFs requires I) library sizes (~10,000 members) that have not been tested before in this setting, and II) knockin of large constructs, especially when combined with a CAR (average construct size ~5.5kb plus homology arms) and thus cannot be performed readily with AAV (adeno-associated virus) HDR templates due to packaging limitations. We thus adapted our ModPoKI platform for large-scale combinatorial knockin screens (Figures 5A, S9A–B, Methods). We created a ~10,000-member library (100 TFs plus two controls combined with 100 TFs plus two controls, Table S1C) cloned in constructs with the tonically signaling HA-GD2-28z CAR (Methods). HDR templates were generated and non-viral KI of the library into the TRAC locus of primary human T cells was performed. Notably, the constructs spanned a large size range from ~3.3 to ~8.2 kb. The fusion region between TF1 and TF2 served as a barcode to identify abundance and orientation (TF1 vs TF2) (Figures S9C–E). Amplicon-sequencing of the plasmid pool and the T-cell pool confirmed representation of >99% of the constructs, despite expected construct size-dependent effects (Figures 5B–C). Since dropout of constructs was an effect of insert size, large constructs could be spiked in to increase representation in future ModPoKI versions. Nonetheless, we were able to generate pooled libraries with thousands of different members and successfully achieved diverse KIs, including constructs as large as ~7.6kb based on barcode-sequencing.
Figure 5. Combinatorial ModPoKI Screens Uncover Efficient TF Combinations.

(A) Schematic illustration of combinatorial ModPoKI to screen ~10,000 TF combinations.
(B) Barcode-sequencing of the TFxTF plasmid library showed size-dependent representation, but confirmed that >99% of constructs were represented after pooled assembly.
(C) Knockin percentage of combinatorial constructs was analyzed in the cell pool on day 4 after electroporation by barcode-sequencing and showed >99% representation of the ~10,000 constructs.
(D) The TFxTF combinatorial library in combination with the HA-GD2-28z CAR was knocked into primary human T cells. Cells were sorted on day 4 and 16 after electroporation and log2FC in barcode abundance was assessed. Statistics were calculated using DESeq2. To create the volcano plot, the two possible construct orientations (e.g., BATF-TFAP4 and TFAP4-BATF) were combined. The right panel shows data for various KI combinations (barcodes for constructs with both orientations included as bars x two donors).
N = 2 donors (C-D). Linear regression was performed (lm function, RStudio) (B-C).
Since ModPoKI cells expanded in culture due to HA-GD2-28z CAR tonic signaling, we compared the abundance of each TFxTF combination after 16 days in culture to its baseline abundance on day 4 after electroporation. Most TFxTF combinations were depleted from the pool over time, consistent with previous evidence that major transcriptional changes can be detrimental to fitness (Figures S4A–B). Analysis of the constructs that increased the most in relative abundance highlighted that several of the top performing constructs included combinations of TFAP4 and BATF (or BATF3) suggesting that TFAP4 and BATF(3) are key TFs that can coordinately drive increased T-cell fitness during repetitive simulations (Figures 5D, S9E). Analysis of biological replicate screens performed in cells from two human donors identified TFAP4 and BATF combination constructs (TFAP4-BATF and BATF-TFAP4) as the most significantly increased in abundance (Figure 5D). In summary, these data show that large-scale combinatorial knockin screens are feasible using the ModPoKI platform and can help create an atlas of combinatorial KI constructs with potential to enhance therapeutic T cells.
Combined BATF-TFAP4 KI Induces Favorable T-Cell States
To assess the benefit of KI constructs combining BATF and TFAP4, we next generated specific knockin constructs with the HA-GD2-28z CAR and: 1) BATF-TFAP4 combination, 2) single TF + control (RFP-TFAP and BATF-RFP), or 3) control + control (RFP-tNGFR). We performed competitive fitness assays to assess if the combination outperformed the individual KIs. BATF-TFAP4 KI cells were co-cultured at a ~50:50 ratio with single TF (+ control) KI cells and relative abundance was monitored (Figure 6A). KI cells with the BATF-TFAP4 combinatorial construct outcompeted both the RFP-TFAP4 and the BATF-RFP control KI cells. The relative benefit of the BATF-TFAP4 combination to BATF KI alone was more pronounced than the benefit compared to TFAP4 KI alone, hinting that the majority of fitness benefit (although not all of it) is conferred by TFAP4. Consistent with the effects of single TFAP4 KI constructs, we found increased levels of IL2RA expression in TFAP4-containing combinatorial constructs (Figures 6B, S9F). When analyzing the phenotype of HA-GD2-28z CARs 14 days after electroporation, we observed that control (RFP-tNGFR) and BATF KI (BATF-RFP) T cells had high percentages of terminally differentiated effector memory (TEMRA) cells, whereas the phenotypes of TFAP4 KI cells (RFP-TFAP4 and BATF-TFAP4) were shifted toward memory states with significantly reduced percentages of TEMRA cells (Figures 6C–D).
Figure 6. Combinatorial BATF-TFAP4 Knockin Induces Favorable T-Cell Programs.
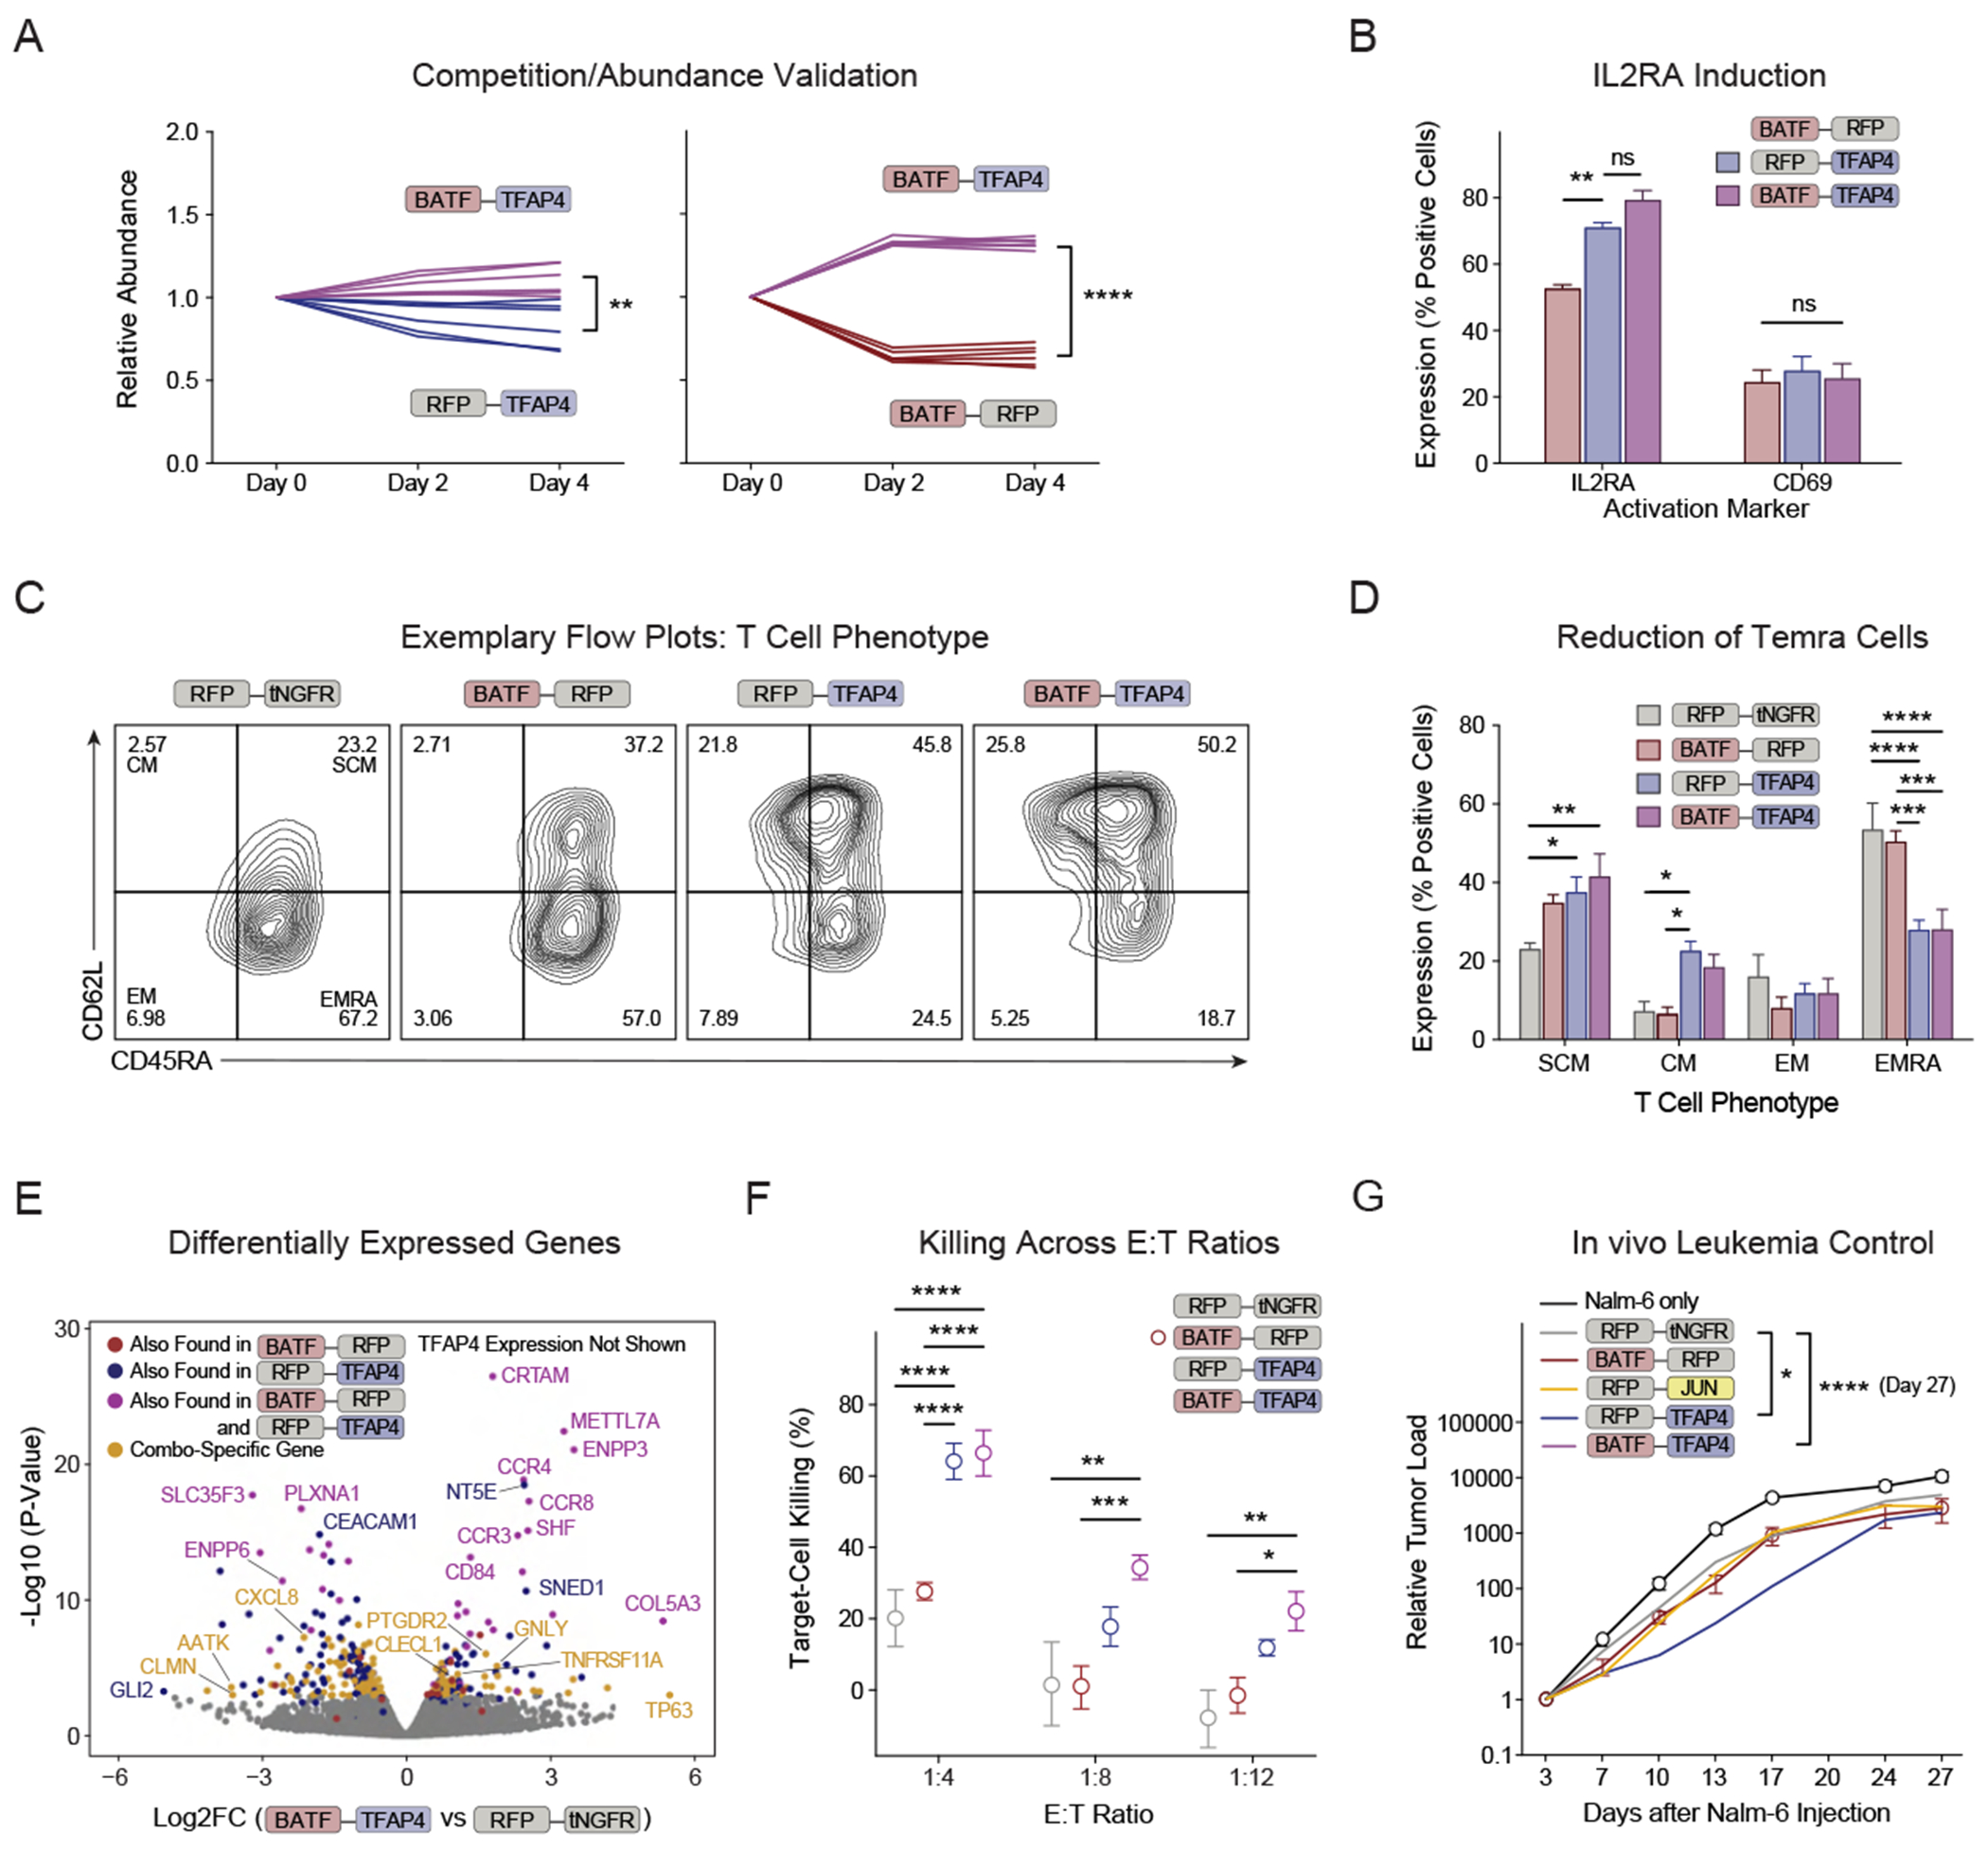
(A) Competitive fitness assays with combinatorial knockin constructs (HA-GD2-28z CAR) were performed (data normalized to day 0, unpaired t-test performed on day 4).
(B) Activation marker expression was analyzed on HA-GD2-28z CARs 8 days after electroporation. 2-way ANOVA with Holm-Sidak’s correction was performed.
(C) Exemplary flow cytometry for phenotypic markers 14 days after electroporation.
(D) Phenotypic analysis of combinatorial KI HA-GD2-28z CARs 14 days after electroporation. 2-way ANOVA with Holm-Sidak’s correction was performed.
(E) Differentially expressed genes in BATF-TFAP4 compared to RFP-tNGFR control KI HA-GD2-28z CARs were analyzed by RNA-seq 14 days after electroporation. The most differentially expressed gene was TFAP4 (not shown, log2FC 5.0, padj 6.03E-77). The color indicates if the respective gene was also found among the most differentially expressed genes when comparing TFAP4-RFP vs control, BATF-RFP vs control or in both of these comparisons. Highlighted in yellow are genes that were differentially expressed selectively in BATF-TFAP4 vs RFP-tNGFR KI. N = 2 donors.
(F) Combinatorial KI HA-GD2-28z CARs were co-cultured with Nalm-6/GFP/Luc/GD2 cells and target-cell killing was analyzed (Incucyte). Reduced number of replicates for RFP-tNGFR condition was due to low cell counts (Figures S10D–E). 2-way ANOVA with Holm-Sidak’s correction was performed as described in the Methods.
(G) NSG mice were injected with 0.5e6 Nalm-6/GFP/Luc/GD2 cells and treated with 1e6 HA-GD2-28z CAR+ cells. Leukemic load was determined by bioluminescence imaging. N = 2 T-cell donors, 2-5 mice/donor/group. Donors are shown separately in Figure S10F. 2-way ANOVA with Holm Sidak’s test was performed to compare all constructs against the control (RFP-tNGFR) (both donors combined).
N = 2 donors in technical duplicates (B, D) or triplicates (A, F). Mean (+ SEM) shown (A-B, D, F-G).
We next evaluated the transcriptional effects of the BATF-TFAP4 combination. Correlation analysis between the respective tested condition and control (RFP-tNGFR) showed that BATF-TFAP4 KI cells behaved more similarly to RFP-TFAP4 than to BATF-RFP KI cells (Figures S9G–H). BATF-TFAP4 KI cells had even less correlation with RFP-JUN KI cells, suggesting that the transcriptional program promoted by BATF-TFAP4 is divergent from the previously reported JUN-driven program.28 Some genes including CCR3, CCR4 and CCR8 were induced by BATF-TFAP4, BATF-RFP and RFP-TFAP4 KI (relative to control cells). However, the combined BATF-TFAP4 KI also promoted differential expression of a variety of genes highlighted in yellow that were not differentially affected by either BATF or TFAP4 KI alone (Figures 6E, S10A–C). Taken together, these results suggest that combinatorial knockin of BATF and TFAP4 can drive both overlapping but also distinct transcriptional changes compared to single BATF or TFAP4 KIs to promote a fitness advantage in the HA-GD2-28z CAR model of tonic signaling.
The TFAP4 single KI construct had improved killing capacity of HA-GD2-28z CARs in vitro and in vivo. Next, we assessed if the BATF-TFAP4 combinatorial KI could further enhance the anti-cancer function of HA-GD2-28z CARs since this combination had conferred an added fitness benefit. In both, in vitro co-culture assays (Figures 6F, S10D–E) and an in vivo NSG xenograft model (Figures 6G, S10F), BATF-TFAP4 KI CAR-T cells performed best to control leukemia growth (significantly better than control KI and with a trend toward better control than the TFAP4 single KI).
BATF Facilitates TFAP4-Mediated Transcriptional Rewiring
To understand how TFAP4 alone, or in combination with BATF promotes T-cell function, we performed an independent set of RNA-seq, ChIP-seq and ATAC-seq experiments. For the first analysis, TFAP4 HA-GD2-28z CAR T cells were compared to control tNGFR HA-GD2-28z CAR T cells. We identified 2,232 TFAP4 KI-regulated genes (Figure 7A) for which we annotated TFAP4 KI-regulated open chromatin regions (OCRs) that bind TFAP4 (Figures S11A–B). T-cell fitness genes such as IL2RA, IL12A and MYC were upregulated in TFAP4 KI cells, while markers of dysfunctional cell states such as CD244 (2B4), CXCR6 and HAVCR2 (TIM-3) were repressed (Figure 7A). Accordingly, pathway analysis showed enrichment in eIF2 signaling (playing a critical role in translation initiation) and pathways involved in biosynthesis of substrates that are essential during cell division (Figure 7B). Prediction of the top upstream regulators of TFAP4 KI-regulated gene sets identified IL-2, MYC and the TCR (Figure 7C). Taken together, TFAP4 facilitates T-cell proliferation, and importantly, restrains overactivation and exhaustion of T cells (via repression of short-lived effector genes, e.g., NFATC3, KLRC2, and KLRB1; and markers of exhaustion, e.g., CXCR6, HAVCR2, and CD244). ChIP-/ATAC-seq indicated that TFAP4 binds to promoters and gene-proximal enhancers around regulated genes and exhibits chromatin-remodeling activity (Figure S11A). Directly regulated genes include IL2RA, RUNX1, IL12A (all upregulated) and HAVCR2 (TIM-3, downregulated) (Figures 7D). IL2RA stood out as one of the primary drivers of the phenotypic effects of TFAP4 due to TFAP4’s direct binding and chromatin remodeling activity at the IL2RA locus (Figure 7D) that led to increased IL2RA expression on RNA (Figures 7A, 7D) and protein level (Figures 4G, S8E–H). To evaluate whether increased IL2RA KI alone can phenocopy the effect of TFAP4 KI, we compared TFAP4 with IL2RA single KIs. While IL2RA KI increased cytotoxicity of HA-GD2-28z CARs including increased release of some cytokines, TFAP4 KI had a much stronger effect on both cytokine levels and cytotoxicity (Figures S11C–D). In summary, TFAP4 is a TF with chromatin remodeling activities that balances/optimizes T-cell behavior by enhancing the proliferative capacity of T cells, while restraining markers of exhaustion.
Figure 7. BATF Facilitates TFAP4-Mediated Epigenomic Reprogramming.
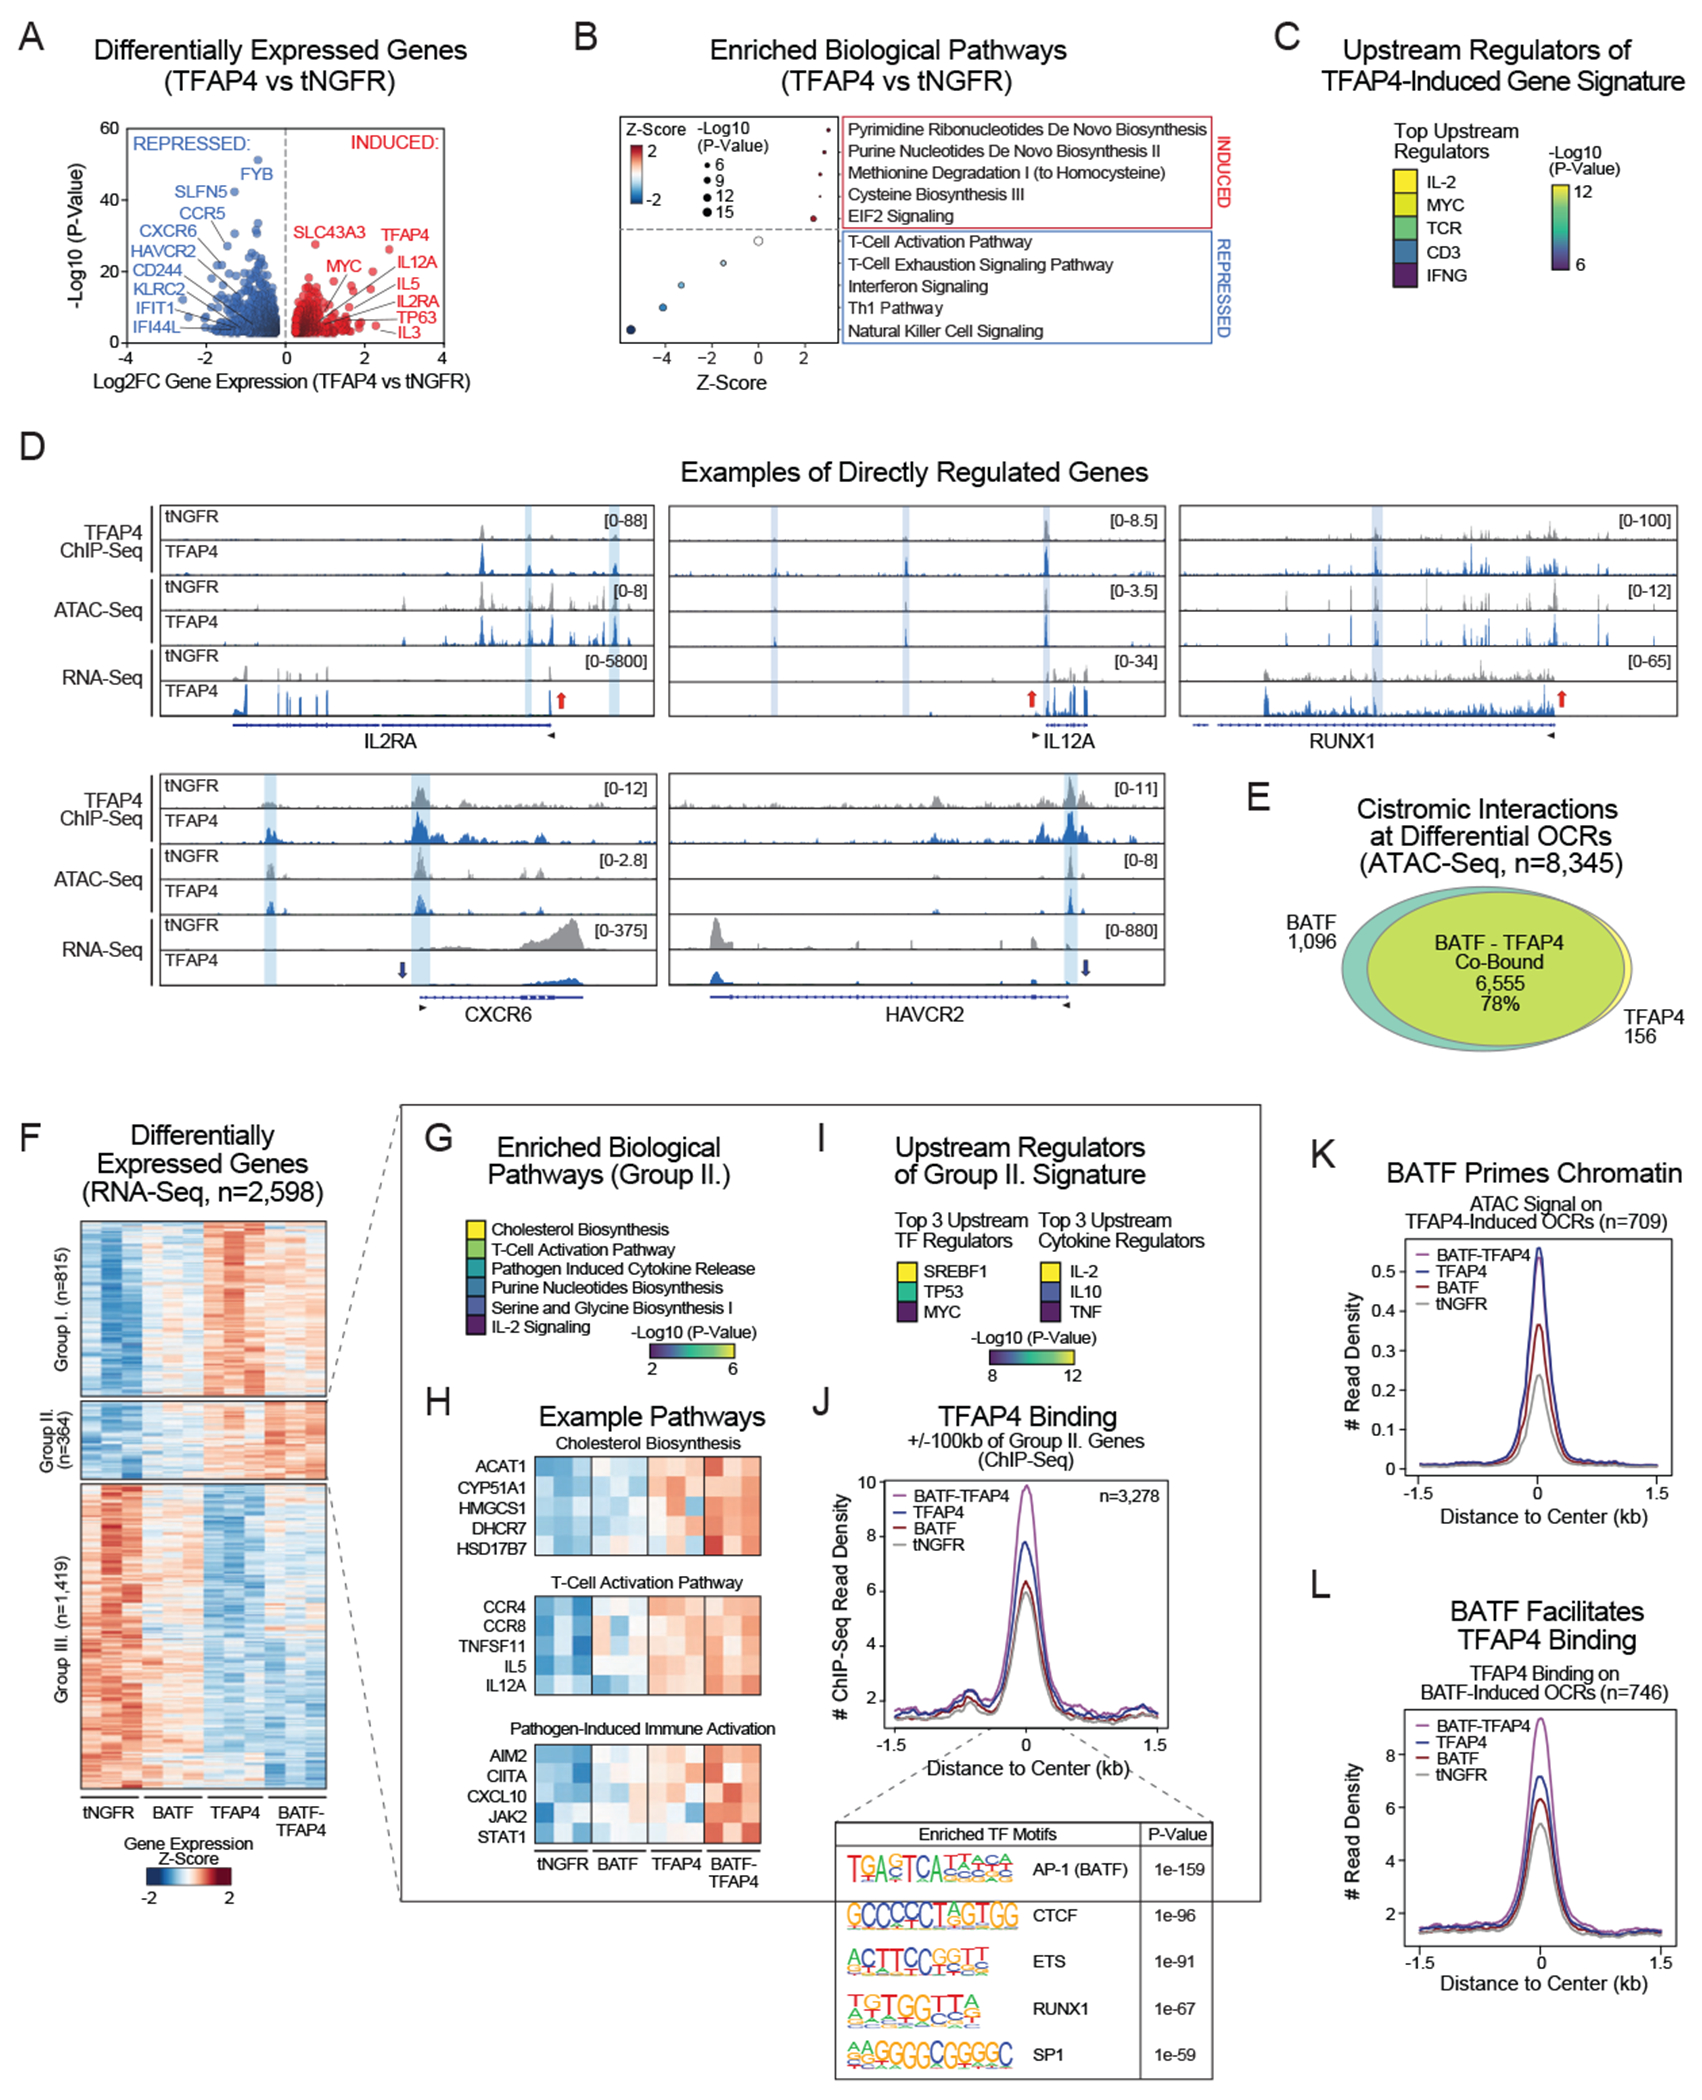
(A) Differentially expressed genes in RNA-seq of TFAP4 vs tNGFR HA-GD2-28z CAR-T cells 14 days after electroporation.
(B) Pathway analysis of the differentially expressed genes by QIAGEN Ingenuity Pathway Analysis (IPA). Top 5 enriched pathways are shown for induced/repressed genes.
(C) Upstream regulator analysis of the TFAP4 KI-regulated gene signature by QIAGEN IPA. Top 5 hits are shown.
(D) Examples of ChIP-/ATAC-/RNA-seq tracks at genomic loci regulated by TFAP4 KI.
(E) Venn diagram depicts genome occupancy of BATF and/or TFAP4 (CHIP-seq) at differential open chromatin regions (OCRs).
(F) Heatmap depicts the differentially expressed genes across indicated conditions. Gene groups were defined by k-means clustering and describe distinct expression patterns: Group I. Induced by TFAP4 KI and dampened by BATF KI; Group II. Induced by TFAP4 KI and potentiated by BATF-TFAP4 KI; Group III. Repressed by both TFAP4 and BATF.
(G) Pathway analysis of Group II genes by QIAGEN IPA. Top 5 enriched pathways are shown.
(H) Gene expression heatmaps depict example genes from the top 3 biological pathways (panel G).
(I) Upstream regulator analysis of the Group II gene signature by QIAGEN IPA. Top 3 TF and cytokine hits are shown.
(J) Metagene plot of normalized TFAP4 ChIP-seq signal at TFAP4 peaks +/−100kb around transcription start sites of Group II genes with corresponding motif analysis.
(K) Metagene plot of normalized ATAC-seq signal at TFAP4 KI-induced OCRs.
(L) Metagene plot of normalized TFAP4 ChIP-seq signal at BATF KI-induced OCRs.
(A, E-F) FDR < 0.05, log2FC ≥ 0.5.
(A-D) include TFAP4 vs tNGFR single KI HA-GD2-28z CARs. (E) summarizes data from all ChIPseq conditions (TFAP4, BATF, tNGFR single KI and BATF-TFAP4 combinatorial KI HA-GD2-28z CARs). (F-I) include RNA-seq from RFP-tNGFR (“tNGFR”), BATF-RFP (“BATF”), RFP-TFAP4 (“TFAP4”) and BATF-TFAP4 HA-GD2-28z CARs. (J+L) show ChIP-seq data from TFAP4, BATF and tNGFR single KI and BATF-TFAP4 combinatorial KI HA-GD2-28z CARs. (K) shows ATACseq from RFP-tNGFR (“tNGFR”), BATF-RFP (“BATF”), RFP-TFAP4 (“TFAP4”) and BATF-TFAP4 HA-GD2-28z CARs. N = 3 donors.
Evaluating potential coordinated effects of BATF and TFAP4, we observed that KI of these TFs has robust chromatin remodeling activities affecting chromatin accessibility at 8,345 locations across the genome. Among these, they cooperatively open 2,256 genomic regions (Group II), where we found strong enrichment for the TFAP4 DNA binding motif (ATAC-seq; Figure S11E). CHIP-seq revealed remarkable co-occupancy by BATF and TFAP4 at chromatin sites where accessibility was altered by BATF and/or TFAP4 KI (78% of regions filtered for differential OCRs, Figure S7E) (Figures 7E, S11F). Analysis of the two TFs’ effects on gene expression also revealed their cooperative – either additive, or synergistic – role in regulating 364 genes (Figure 7F, Group II). Pathway analysis showed that these genes are constituents of T-cell activation and cholesterol biosynthesis pathways (Figures 7G–H). Consistent with this, upstream regulator analysis predicted SREBF1 as the top TF regulator of Group II genes, a key activator of cholesterol metabolism (Figure 7I). Cholesterol biosynthesis is important for membrane regeneration during cell proliferation. Moreover, an increase in cell membrane cholesterol can lead to more efficient formation of the immunological synapse.57 Next, we annotated TFAP4-bound genomic regions to Group II genes and found that BATF KI greatly facilitated the binding of TFAP4 (Figure 7J). BATF can open chromatin regions at TFAP4-bound sites and thus prime the chromatin for TFAP4 (Figures 7K–L, S11G–H). This cooperation via BATF-mediated chromatin priming and facilitated TFAP4 binding was also observed in loci that solely get induced by TFAP4 KI, including IL12A, IL5 and SLC7A11 (cystine/glutamate antiporter) (Figure S11I). Taken together, our results suggest that BATF supports TFAP4 function through two non-exclusive mechanisms: 1) BATF-mediated chromatin priming at TFAP4 binding sites; and 2) BATF-facilitated TFAP4 binding, which is likely at least partially the result of BATF’s chromatin priming activities. Therefore, together, BATF and TFAP4 increase T-cell fitness and reduce dysfunction in therapeutic T cells, especially in the context of tonic signaling or chronic antigen stimulation.
DISCUSSION
T-cell dysfunction resulting from chronic stimulation can limit long-term success of adoptive cell therapies.4,5 To discover knockin constructs that can improve T-cell functions, we designed non-viral ModPoKI screening. ModPoKI uses targeted integration at defined genomic sites. We chose to target the TRAC locus as it is functionally monoallelic (~85% in this system, see Figure S1E), knockin can replace the endogenous antigen specificity, the endogenous regulatory elements can drive expression of transgenic CARs/TCRs mimicking expression of endogenous TCRs, and integration of CAR sequences into the TRAC locus can reduce T-cell exhaustion.13,45,58 Although efficiency of non-viral ModPoKI is currently lower than viral transduction, KI rates can be increased further, e.g. with single-stranded DNA templates and/or NHEJ inhibitors.59 We observed different effects of TFs when retroviral vectors were used to introduce CAR and TF constructs into non-targeted sites with heterologous promoters versus non-viral KI under TRAC promoter control. These results underscore the importance of testing genetic modifications in the same genomic context that will eventually be employed therapeutically in order to identify lead synthetic constructs with the greatest potential for cell therapies. As cell therapies increasingly rely on targeted modification,60,61 ModPoKI is optimized uniquely to compare functional properties of synthetic KI designs at defined genomic loci.
In order to clear large tumor burdens, therapeutic T cells have to maintain persistent function throughout chronic stimulation from repetitive antigen encounter and/or tonic signaling. Previous efforts focusing on viral overexpression of bZIP TFs have shown enhanced function of GD2, HER2 or CD19 CAR-T cells with improved expansion potential, diminished terminal differentiation or enrichment of tumor-infiltrating lymphocytes.27,28 Other approaches have investigated how loss of function of either TFs (e.g., KO of NR4A TFs or IKZF3)11,35,62,63 or epigenetic reprogramming (e.g., KO of DNMT3A or knockdown/KO of TET2)64,65 can help increase CAR T-cell functionality. Using the ModPoKI platform in combination with repetitive CAR/TCR stimulation or tonic signaling, we found that KI of TFAP4 can promote proliferative, stem cell-like and central memory states. Studies in mice have reported that Tfap4 is a Myc-induced TF that maintains Myc-initiated activation and expansion programs in T cells to control microbial infections.55 In mice, Tfap4 is regulated by TCR and IL-2 signals and gene-deletion studies indicate that it fine tunes clonal T-cell expansion.53 Tfap4 has been studied primarily in the context of murine viral infections where it was not essential for short-term virus elimination, but was crucial in situations where infection could only be controlled by sustained activity of antigen-specific T cells.53 These findings align with our discovery that beneficial effects of TFAP4 KI constructs are most pronounced after repetitive stimulations or tonic activation. While IL2RA appears to be one of the strongest phenotypic drivers of TFAP4 KI-induced effects, isolated IL2RA KI cannot phenocopy the distinct transcriptional program driven by TFAP4. Chromatin analyses indicated that BATF KI primes chromatin at TFAP4 binding sites and facilitates TFAP4’s DNA binding capacity. Taken together, BATF KI facilitates TFAP4 KI-augmented T-cell fitness during chronic stimulation to maintain durable T-cell functionality.
Safety profiles need to be assessed carefully for candidate genetic modifications to promote enhanced expansion and function of cellular therapies. Chromosomal abnormalities have been observed after double strand break-inducing genetic engineering. Although T cells with chromosomal abnormalities often have a fitness disadvantage, strategies to decrease the frequency of cells with chromosomal abnormalities such as sorting for certain surface markers can be considered.66 Another concern is uncontrolled proliferation as recently observed in Tet2 KO CAR T cells characterized by sustained BATF3 expression.65 Our screens did suggest a possible role for BATF increasing T-cell abundance in the absence of re-stimulation. Notably, we did not observe proliferation, cytokine release or in vitro killing by TFAP4 KI CAR-T cells in the absence of the CAR antigen, safety concerns may eventually warrant additional safety tests and perhaps the use of regulatable “kill” switches or synthetic circuits to control expression levels of the transgene.67–69 Looking forward, ModPoKI could be useful to accelerate the design of these more complex logic-gated synthetic programs to enhance therapeutic safety profiles.
Unbiased genome-wide screens now serve as powerful tools to identify candidates for gene modification in T cells. We recently developed a platform for genome-wide CRISPRa screens in primary human T cells.25 However, CRISPRa approaches cannot be immediately translated to the clinic, as they require sustained expression of endonuclease-dead Cas9 which results in immunogenicity. Nevertheless, genome-wide CRISPRa screens can be used to nominate genes or pathways that can then be assessed with ModPoKI screens at the appropriate therapeutic locus. For example, both CRISPRa and ORF screens recently nominated overexpression of LTBR to enhance T-cell function.25,26 Here, ModPoKI screens revealed LTBR can be engineered into a chimeric receptor (e.g., an LTBR/OX40 fusion protein) that can be knocked into cells along with a TCR/CAR to improve fitness. In contrast to CRISPRa screens, ModPoKI allows for screening of both natural and synthetic genes in multicistronic CAR/TCR constructs that can be readily moved toward clinical application without dependence on constant Cas9 expression.
While we have focused on cell fitness as measured by abundance, ModPoKI can be adapted toward more complex phenotypes such as cytokine production or T-cell infiltration into a tumor in vivo. In the future, ModPoKI screens should be readily adaptable to different CARs or TCRs and even newer synthetic receptors such as HITs (HLA-independent TCRs)70, STARs (synthetic T-cell receptor and antigen receptors)71 or SNIPRs (synthetic intramembrane proteolysis receptors) and SynNotch receptors67,68. Furthermore, future screens can be performed in regulatory T cells to facilitate the development of treatments for autoimmunity or inflammatory diseases, or in gamma-delta T cells. The integration site could be modified to loci distinct from the TRAC locus, and we anticipate that ModPoKI will be powerful in designing novel gene programs for NK-cell, B-cell and myeloid-cell therapies, iPS cell-derived therapies and beyond. Looking forward, ModPoKI will accelerate candidate selection and design optimization of synthetic constructs for basic biological discovery and a diverse array of cellular therapies.
Limitations of the Study
In this study, we achieved proof-of-concept of large-scale ModPoKI in vitro focusing on melanoma and leukemia models. Future studies could utilize ModPoKI to perform in vivo screens in more challenging contexts such as solid tumor xenografts. These studies will benefit from ongoing efforts to improve KI efficiencies, which will enable more complex ModPoKI screens.59 Recent advances in murine T cell-specific AAV variants72 could even enable ModPoKI screens in immunocompetent models with established tumor microenvironments. Technically, strict measures are required to minimize artifacts due to PCR contamination of barcodes; changing the barcodes used in arrayed validation experiments is one strategy that could be useful. Overall, future ModPoKI experiments will have opportunities to build on the lessons of these studies to explore larger sequence spaces – including more synthetic gene constructs – across disease models with more fidelity to human pathology.
STAR METHODS
RESOURCE AVAILABILITY
Lead Contact
Further information and requests for resources and reagents should be directed to and will be fulfilled by the lead contact, Alexander Marson (alexander.marson@ucsf.edu).
Materials Availability
Plasmids generated in this study have been deposited to Addgene or are available upon request.
Data and Code Availability
Bulk RNA-seq, combined ATAC-, ChIP- and RNA-seq and ModPoKI-Seq datasets have been deposited at GEO and are publicly available as of the date of publication. Accession numbers are listed in the key resources table. This paper also analyzes existing, publicly available data. Accession numbers are also listed in the key resources table. Screening data and DNA sequences are shown in Tables S1–2. Original code has been deposited to Zenodo (10.5281/zenodo.8015657). Additional information required to reanalyze the data reported in this paper is available from the lead contact upon request.
Key resources table
| REAGENT or RESOURCE | SOURCE | IDENTIFIER |
|---|---|---|
| Antibodies | ||
| Alexa Fluor 647 AffiniPure F(ab’)2 Fragment Goat Anti-Mouse IgG, F(ab’)2 fragment specific | Jackson ImmunoResearch | Cat#115-606-072; RRID:AB_2338928 |
| APC anti-human CD271 (NGFR) Antibody | Biolegend | Cat#345108; RRID:AB_10645515 |
| APC anti-human CD279 (PD-1) Antibody | Biolegend | Cat#329908; RRID:AB_940475 |
| APC anti-human CD86 Antibody | Biolegend | Cat#305412; RRID:AB_493231 |
| APC Mouse Anti-Human CD178 | BD | Cat#564262; RRID:AB_2738714 |
| APC Mouse IgG1, k Isotype Control | BD | Cat#555751; RRID:AB_398613 |
| BD Pharmingen PE Mouse anti-Human CD39 | BD | Cat#555464; RRID:AB_395856 |
| Brilliant Violet 421 anti-human CD25 Antibody | Biolegend | Cat#302630; RRID:AB_11126749 |
| Brilliant Violet 421 anti-human CD366 (Tim-3) Antibody | Biolegend | Cat#345008; RRID:AB_11218598 |
| Brilliant Violet 421 anti-human CD69 Antibody | Biolegend | Cat#310930; RRID:AB_2561909 |
| Brilliant Violet 421 anti-human CD8a Antibody | Biolegend | Cat#301036; RRID:AB_10960142 |
| Brilliant Violet 421 anti-human CD95 (Fas) Antibody | Biolegend | Cat#305624; RRID:AB_2561830 |
| Brilliant Violet 421 anti-human TCRa/b Antibody | Biolegend | Cat#306722; RRID:AB_2562805 |
| Brilliant Violet 421 Mouse IgG1, k Isotype Ctrl Antibody | Biolegend | Cat#400158; RRID:AB_11150232 |
| Brilliant Violet 711 anti-human CD137 (4-1BB) Antibody | Biolegend | Cat#309832; RRID:AB_2650991 |
| Brilliant Violet 711 anti-human CD19 Antibody | Biolegend | Cat#302246; RRID:AB_2562065 |
| Brilliant Violet 711 anti-human CD45RA Antibody | Biolegend | Cat#304138; RRID:AB_2563815 |
| Brilliant Violet 711 anti-human CD80 Antibody | Biolegend | Cat#305236; RRID:AB_2734270 |
| Brilliant Violet 711 anti-human CD86 Antibody | Biolegend | Cat#305440; RRID:AB_2565835 |
| Brilliant Violet 711 anti-human TCR a/b Antibody | Biolegend | Cat#306740; RRID:AB_2783169 |
| Brilliant Violet 711 Mouse IgG2b, k Isotype Ctrl Antibody | Biolegend | Cat#400354 |
| BUV395 Mouse Anti-Human CD4 | BD | Cat#563550; RRID:AB_2738273 |
| BUV737 Mouse Anti-Human CD8 | BD | Cat#612754; RRID:AB_2870085 |
| BV421 Mouse IgG1, k Isotype Control | BD | Cat#562438; RRID:AB_11207319 |
| BV650 Mouse Anti-Human CD62L | BD | Cat#563808; RRID:AB_2738433 |
| BV711 Mouse Anti-Human IL-2 | BD | Cat#563946; RRID:AB_2738501 |
| CD223 (LAG-3) Monoclonal Antibody (3DS223H), PerCP-eFluor 710, eBioscience | Thermo Fisher Scientific | Cat#46-2239-42; RRID:AB_2573732 |
| eBioscience Fixable Viability Dye eFluor 780 | Thermo Fisher Scientific | Cat#65-0865-18 |
| FITC anti-human CD271 (NGFR) Antibody | Biolegend | Cat#345104; RRID:AB_2282828 |
| FITC anti-human CD4 Antibody | Biolegend | Cat#344604; RRID:AB_1937227 |
| FITC anti-human TCR a/b Antibody | Biolegend | Cat#306706; RRID:AB_314644 |
| Myc-Tag (9B11) Mouse mAb (Alexa Fluor 647 Conjugate) | Cell Signaling Technology | Cat#2233; RRID:AB_823474 |
| Pacific Blue anti-human TNF-α Antibody | Biolegend | Cat#502920; RRID:AB_528965 |
| PE anti-HA.11 Epitope Tag Antibody | Biolegend | Cat#901518; RRID:AB_2629623 |
| PE anti-human CD25 Antibody | Biolegend | Cat#302606; RRID:AB_314276 |
| PE anti-human CD62L Antibody | Biolegend | Cat#304806; RRID:AB_314466 |
| PE anti-human CD95 (Fas) Antibody | Biolegend | Cat#305608; RRID:AB_314546 |
| PE Mouse Anti-Human IFN-γ | BD | Cat#554701; RRID:AB_395518 |
| PE Mouse IgG1, k Isotype Ctrl Antibody | Biolegend | Cat#400112; RRID:AB_2847829 |
| PE Streptavidin | BD | Cat#349023 |
| PE-Cy7 Mouse Anti-Human CD25 | BD | Cat#557741; RRID:AB_396847 |
| PE-Cy7 Mouse Anti-Human CD8 | BD | Cat#335787; RRID:AB_399966 |
| PE/Cyanine 7 anti-human CD258 (LIGHT) Antibody | Biolegend | Cat#318708; RRID:AB_2721660 |
| PE/Cyanine 7 anti-human CD271 (NGFR) Antibody | Biolegend | Cat#345110; RRID:AB_11203542 |
| PE/Cyanine 7 anti-human CD80 Antibody | Biolegend | Cat#305218; RRID:AB_2076148 |
| PE/Cyanine7 anti-human TCR a/b Antibody | Biolegend | Cat#306720; RRID:AB_10639947 |
| PE/Cyanine7 Mouse IgG2b, k Isotype Ctrl Antibody | Biolegend | Cat#400326 |
| PerCP anti-human CD69 Antibody | Biolegend | Cat#310928; RRID:AB_10679124 |
| PerCP Mouse IgG1, k Isotype Ctrl Antibody | Biolegend | Cat#400148 |
| PerCP/Cyanine5.5 anti-human CD4 Antibody | Biolegend | Cat#317428; RRID:AB_1186122 |
| TOX Antibody, anti-human/mouse, APC, REAfinity | Miltenyi Biotec | Cat#130-118-335; RRID:AB_2751485 |
| violetFluor 450 Anti-Human CD45RA (HI100) | Tonbo | Cat#75-0458-T100; RRID:AB_2621951 |
| Bacterial and virus strains | ||
| Endura Competent Cells, Lucigen | VWR | Cat#60242-2 |
| NEB Stable Competent E.coli | New England Biolabs | Cat#C3040H |
| Stbl3 Competent Cells | Berkeley MacroLab | N/A |
| Biological samples | ||
| Human Peripheral Blood Leukopak, Fresh | Stemcell | N/A |
| Trima Residual | Vitalant | Cat#RE202 |
| Chemicals, peptides, and recombinant proteins | ||
| AMPure XP Reagent, 5 mL | Beckman Coulter | Cat#A63880 |
| BATF ChIP Antibody | Brookwood Biomedical | Cat#PAB4003 |
| Biotinylated Human CD19 Protein, Fc Tag, ultra sensitivity | ACROBiosystems | Cat#CD9-H8259 |
| Cas9 protein | Berkeley MacroLab | N/A |
| crRNA TRAC 2 sequence AGAGTCTCTCAGCTGGTACA | Dharmacon | N/A |
| CTS (Cell Therapy Systems) Dynabeads | Thermo Fisher Scientific | Cat#40203D |
| D-Luciferin, Potassium Salt | Gold Biotechnology | Cat#LUCK-10G |
| Dextramer- HLA-A*0201/SLLMWITQV-APC | Immudex | Cat#WB3247-APC |
| Dextramer- HLA-A*0201/SLLMWITQV-PE | Immudex | Cat#WB3247-PE |
| DSG Crosslinker 1 gram | ProteoChem | Cat#c1104-1gm |
| eBioscience Brefeldin A Solution (1000X) | Thermo Fisher Scientific | Cat#00-4506-51 |
| Gibson Assembly Master Mix - 50 rxns | New England Biolabs | Cat#E2611L |
| Glucose Solution | Thermo Fisher Scientific | Cat#A2494001 |
| GlycoBlue Coprecipitant (15 mg/mL) | Thermo Fisher Scientific | Cat#AM9516 |
| Invitrogen Recombinant Proteinase K Solution (20mg/mL) | Thermo Fisher Scientific | Cat#AM2548 |
| KAPA HiFi HS RM | Roche | Cat#07958935001 |
| Lipofectamine 3000 Transfection Reagent | Thermo Fisher Scientific | Cat#L3000150 |
| Maxima H Minus Reverse Transcriptase | Thermo Fisher Scientific | Cat#EP0753 |
| NEBNext Ultra II Q5 Master Mix | New England Biolabs | Cat#M0544L |
| NEBuilder HiFi DNA Assembly Master Mix | New England Biolabs | Cat#E2621S |
| Opti-MEM I Reduced Serum Medium | Thermo Fisher Scientific | Cat#31985088 |
| Phenol:Chloroform:Isoamyl Alcohol 25:24:1, Saturated with 10mM Tris, pH 8.0, 1mM EDTA | MilliporeSigma | Cat#P3803-400ML |
| Pierce 16% Formaldehyde (w/v), Methanol-free | Thermo Fisher Scientific | Cat#28906 |
| Poly-L-glutamic acid | Alamanda Polymers | Cat#26247-79-0 |
| Poly-L-ornithine solution | MilliporeSigma | Cat#P4957-50ML |
| Dynabeads Protein A for Immunoprecipitation | Invitrogen | Cat#10002D |
| Recombinant Human IL-15 GMP Protein, CF 25ug | R&D Systems | Cat#247-GMP-025 |
| Recombinant Human IL-2 GMP Protein, CF | R&D Systems | Cat#202-GMP-01M |
| Recombinant Human IL-7 GMP Protein, CF 25ug | R&D Systems | Cat#BT-007-GMP025 |
| RetroNectin Recombinant Human Fibronectin Fragment | Takara Bio | Cat#T100B |
| RNAse A, Dnase and protease-free (10mg/mL) | Thermo Fisher Scientific | Cat#EN0531 |
| Sera-Mag magnetic speedbeads | Thermo Fisher Scientific | Cat#09-981-123 |
| SPRIselect | Beckman Coulter | Cat#B23318 |
| tracrRNA | Dharmacon | Cat#U-002005-1000 |
| TRI Reagent | MilliporeSigma | Cat#93289-25ML |
| TRIzol Reagent | Thermo Fisher Scientific | Cat#15596018 |
| X-Vivo 15 | Lonza | Cat#BE02-060Q |
| Critical commercial assays | ||
| CellTrace Violet Cell Proliferation Kit, for flow cytometry | Thermo Fisher Scientific | Cat#C34557 |
| Chromium Single Cell 5’ Reagent Kit, v1 chemistry | 10x Genomics | Cat#PN-1000166 |
| EasySep Human T Cell Isolation Kit | Stemcell | Cat#100-0695 |
| EasySep Human TCR Alpha/Beta Depletion Kit | Stemcell | Cat#17847 |
| eBioscience Foxp3 / Transcription Factor Staining Buffer Set | Thermo Fisher Scientific | Cat#00-5523-00 |
| FIX & PERM Cell Fixation & Cell Permeabilization Kit | Thermo Fisher Scientific | Cat#GAS004 |
| LEGENDplex Human CD8/NK Panel (13-plex) with Filter Plate | Biolegend | Cat#740267 |
| MiniSeq High Output Reagent Kit (150-cycles) | Illumina | Cat#FC-420-1002 |
| Nextera Chromium i7 Sample Indices N Set A | 10x Genomics | Cat#PN-3000262 |
| Nextera XT DNA Library Preparation Kit | Illumina | Cat#FC-131-1096 |
| NextSeq 500/550 High Output Kit v2.5 (75 Cycles) | Illumina | Cat#20024906 |
| NextSeq 500/550 Mid Output Kit v2.5 (150 Cycles) | Illumina | Cat#20024904 |
| Ovation RNA-Seq System V2 | Tecan | Cat#7102-32 |
| Ovation Ultralow V2 DNA-Seq Library Preparation Kit | Tecan | Cat#0344NB-A01 |
| P3 Primary Cell 96-well Nucleofector Kit (960 RCT) | Lonza | Cat#V4SP-3960 |
| Phusion High-Fidelity PCR Master Mix with HF Buffer | New England Biolabs | Cat#M0531L |
| Qubit 1X dsDNA HS Assay Kit | Fisher Scientific | Cat#Q33231 |
| Deposited data | ||
| Bulk RNA-seq, combined ATAC-, ChIP- and RNA-seq and ModPoKI-Seq datasets | This paper | GEO: GSE232824 |
| DICE dataset | https://dice-database.org/ | |
| Bulk RNA-seq | Carnevale et al.23 | GEO: GSE204862 |
| Experimental models: Cell lines | ||
| A375 | ATCC | CRL-1619; RRID:CVCL 0132 |
| A375/CD19 | ATCC, then modified to express CD19 Carnevale et al.23 | N/A |
| A375/RFP/CD19 | ATCC, then modified to express RFP and CD19 Carnevale et al.23 Roth et al.37 | N/A |
| GP2-293 cells from Retro-X Universal Packaging System | Takara Bio | Cat#631530; RRID:CVCL_WI48 |
| Nalm-6/GFP/Luc | Justin Eyquem | N/A |
| Nalm-6/GFP/Luc/CD19KO | Justin Eyquem | N/A |
| Nalm-6/GFP/Luc/GD2 | Crystal Mackall and Robbie Majzner | N/A |
| Nalm-6/GFP/Luc/HLA-A2/NY-ESO-1 | Justin Eyquem | N/A |
| Experimental models: Organisms/strains | ||
| Mouse: NOD/SCID/IL2Rg-null (NSG) | The Jackson Laboratory | Stock#005557; RRID:IMSR_JAX:005557 |
| Oligonucleotides | ||
| See Table ST1D for oligonucleotides. | This paper | |
| Recombinant DNA | ||
| See Table ST1A–C for recombinant DNA (libraries). | This paper | |
| Software and algorithms | ||
| Adobe Illustrator | Adobe | N/A |
| FlowJo | BD | N/A |
| GraphPad Prism | GraphPad Software | N/A |
| Incucyte Live Cell Analysis System | Sartorius | N/A |
| Ingenuity Upstream Regulator Analysis in IPA | Qiagen | N/A |
| IVIS Spectrum In Vivo Imaging System | Perkin Elmer | N/A |
| RStudio | RStudio | N/A |
EXPERIMENTAL MODEL AND STUDY PARTICIPANT DETAILS
Mouse Strains
NOD/SCID/IL2Rg-null (NSG) mice were purchased from Jackson Laboratory (#005557). 8-12-week-old female mice were used and mouse experiments were performed under an approved UCSF Institutional Animal Care and Use Committee protocol and according to regulatory standards. Mice were housed with a 12 h/12 h light/dark cycle and food/water available ad libitum.
Cell Lines
All cell lines were maintained in sterile conditions in a 5% CO2 incubator at 37C. Cell lines have been regularly tested for absence of mycoplasma and have been STR-typed. The Nalm-6 (ATCC CRL-3273) cell line used in the TCR single stimulation screens had been previously modified to express the NY-ESO-1 antigen on HLA-A2 (in addition to GFP/Luc). In addition to these edited Nalm-6 cells, A375s (ATCC CRL-1619) with or without nuclear RFP expression and with CD19 (SFFV promoter knocked in upstream of endogenous CD19) or without CD19 expression (WT) as well as Nalm-6 cells with and without CD19 expression were used. Nalm-6/GFP/Luc/GD2 were a kind gift from the Mackall lab (Stanford) and were reported to have an STR profile that was a ~60% match to Nalm-6, suggesting some degree of mutation/heterogeneity. GP2-293 cells were purchased from Takara Bio (#631458). Unless otherwise noted, A375s were cultured in complete RPMI media consisting of Gibco RPMI 1640 media (Thermo Fisher Scientific) supplemented with 5% fetal calf serum (FCS, Sigma-Aldrich, St. Louis, Missouri, USA), Penicillin-Streptomycin (Pen/Strep), L-Glutamine, MEM Non-Essential Amino Acids (NEAA), HEPES and Sodium Pyruvate (all Thermo Fisher Scientific). Unless otherwise noted, Nalm-6 cells were cultured in complete RPMI media plus 2-Mercaptoethanol (beta-ME, Thermo Fisher Scientific). Unless otherwise noted, GP2-293 cells (Takara Bio) were cultured in complete DMEM consisting of DMEM, high glucose (Thermo Fisher Scientific) supplemented with 10% FCS, Pen/Strep, L-Glutamine, HEPES, NEAA and Sodium Pyruvate.
Primary Cells
Human T cells were isolated from leukapheresis products (Leukopaks, Stemcell, samples collected with approved Stemcell IRB) or TRIMA Apheresis (Blood Centers of the Pacific, San Francisco) of male and female donors using EasySep Human T Cell Isolation Kit (Stemcell). For (sc)RNA-/ATAC-/ChIP-seq analyses, Leukopaks from Stemcell were used as starting material. T cells were cultured in X-VIVO 15 media (Lonza Bioscience) supplemented with 5% fetal bovine serum (FBS), 50 μM beta-ME (Thermo Fisher Scientific), and 10 mM N-Acetyl-L-Cysteine (NAC, VWR) with different amounts of cytokines as indicated below.
METHOD DETAILS
Isolation and Culture of Primary Human T Cells
T-cell isolation was done as previously described.37 Briefly, human T cells were isolated from leukapheresis products (Leukopaks, Stemcell, samples collected with approved Stemcell IRB) or TRIMA Apheresis (Blood Centers of the Pacific, San Francisco) using EasySep Human T Cell Isolation Kit (Stemcell). The use of human material is approved by the UCSF Committee on Human Research (CHR #13-11950). T cells were cultured in X-VIVO 15 media (Lonza Bioscience) supplemented with 5% fetal bovine serum (FBS), 50 μM beta-ME (Thermo Fisher Scientific), and 10 mM NAC (VWR). Prior to electroporation, T cells were stimulated for 48 hours at 1e6 cells per ml of media containing 500 U/ml IL-2 (R&D Systems), 5 ng/ml IL-7 (R&D Systems), 5 ng/ml IL-15 (R&D Systems), and CTS (Cell Therapy Systems) CD3/CD28 Dynabeads (Thermo Fisher Scientific, bead:cell ratio 1:1). After nucleofection, T cells were cultured in X-VIVO 15 media containing 500 U/ml IL-2 unless otherwise stated and split every two to four days.
Generation of Plasmid Libraries for Pooled KI
The 231 constructs included in the pooled knockin library (Tables S1A–B) were designed using the Twist Bioscience codon optimization tool and were commercially synthesized and cloned (Twist Bioscience) into a custom pUC19 plasmid containing the NY-ESO-1 TCR sequence (except for HIF1A, JUN and TCF7 constructs that were cloned individually using gBlocks Gene Fragments (Integrated DNA Technologies)). Twist Bioscience sequence-verified all 227 constructs after synthesis and cloning. However, we sequenced 96/228 constructs using Primordium Labs and found that one construct had a 719bp duplication resulting in a frameshift with predicted absent TCR/CAR expression (tBTLA) and one plasmid had a mixed sequence of the expected WT sequence and a 34bp duplication (IRF2). Individual pooled plasmid libraries were created by pooling single construct plasmids into respective libraries (transcription factors and related proteins, 100 members; surface receptor constructs, 129 members; controls, 2) or in one complete pool. The CD19 CAR plasmid pools were created in a pooled assembly fashion by amplifying constructs from the TCR plasmid pool as a DNA template. PCR amplification (Kapa Hot Start polymerase, Roche) produced a pooled library of amplicons with small overhangs homologous to a pUC19 plasmid containing the CD19 CAR HDR sequences. The amplicon pool was treated with DpnI restriction enzyme (New England Biolabs, NEB) to remove residual circular TCR plasmids, bead purified (Sera-Mag SpeedBeads), and eluted into H2O. We then used Gibson Assembly (NEB) to construct plasmid pools containing all 231 library members and knockin controls, plus the new CAR sequence. The CD19 CAR plasmid pools were bead-purified, transformed into Endura electrocompetent cells (Lucigen) and maxiprepped (Plasmid Plus Midi or Maxi Kit, Qiagen) for further use. The HA-GD2-28z CAR libraries were generated in a similar way. While the NY-ESO-1 TCR libraries were pooled at the plasmid stage (plasmids were synthesized individually), all other plasmid libraries in this project (CD19-BBz and −28z CAR, HA-GD2-28z CAR, combinatorial library) were generated by pooled Gibson assembly of the plasmids. The CD19 CAR consisted of an FMC63 scFv, a CD8 spacer and transmembrane domain and 4-1BB or CD28 co-stimulatory domains followed by a CD3z domain. A MYC-tag was included in between the spacer and the FMC63 domain to facilitate detection. The high-affinity GD2-28z CAR (HA-GD2-28z CAR) sequence was kindly provided by Crystal Mackall and Robbie Majzner, Stanford.28 The HA-GD2-28z CAR consisted of a 14G2a scFv E101K with an IgG1 spacer, parts of CD28 extracellular, transmembrane and intracellular domains followed by CD3z. Primer sequences are listed in Table S1D. TCR and CAR sequences are listed in Table S1E.
Generation of Combinatorial Libraries for Pooled KI
The combinatorial HA-GD2-28z CAR plasmid libraries were generated by pooled Gibson assembly of a HA-GD2-28z CAR pUC19 backbone as well as TF insert 1 and TF insert 2. The backbone included the published HA-GD2-28z CAR sequence28 with CD28 co-stimulation and mutations in the IgG1 CH2 region to increase tonic signaling73 (kindly provided by Crystal Mackall and Robbie Majzner as described above). The inserts were PCR-amplified out of the pre-existing TF library using primers that removed the 5’ barcode of the first insert and the 3’ barcode of the second insert and added a constant linker in between the two combinatorial inserts. The HA-GD2-28z CAR backbone, the pools of insert 1 and the pools of insert 2 were assembled using NEBuilder HiFi DNA Assembly Master Mix (NEB). Thus, a DNA site was created which consisted of the 3’ barcode of the TF in the 1st position, a constant linker (linker 2 – linker 1 junction) and the 5’ barcode of the TF in the 2nd position, creating a unique combinatorial barcode for each TFxTF combination (Table S1C). The assembled product was bead-purified using Sera-Mag SpeedBeads (Thermo Fisher Scientific), transformed into Endura electrocompetent cells (Lucigen) and midi- or maxiprepped (Plasmid Plus Midi or Maxi Kit, Qiagen) for further use. Primer sequences are listed in Table S1D.
Homology Directed Repair Templates (HDRTs)
HDRTs were produced as previously described.37 In brief, TCR or CAR plasmid pools were used as templates for PCR amplification (KAPA HiFi HotStart ReadyMix, Roche) to generate double-stranded DNA templates including truncated Cas9 target sequences.39 Templates were bead-purified as described above and eluted into H2O. The concentrations of eluted HDRTs were normalized to 500-1,000 ng/μL. HDRT amplification was confirmed by gel electrophoresis in a 1.0% agarose gel. The templates for arrayed knockin of the different single constructs or combinations during the validation stage were generated in a similar way. Instead of libraries, single constructs served as templates for the PCRs. In all cases, primers were used that added a truncated Cas9 target sequence.39
Cas9 RNP Electroporation
Electroporation was done as previously described.37 In brief, to produce ribonucleoproteins (RNPs), crRNA and tracrRNA (stock 160μM, both Dharmacon) were mixed 1:1 by volume, and annealed by incubation at 37C for 30 min to form an 80 μM guide RNA (gRNA) solution. Poly-L-glutamic acid (PGA, stock 125 mg/ml, Sigma) was mixed with gRNA at 0.8:1 volume ratio prior to complexing with Cas9-NLS (QB3 Macrolab) for final volume ratio gRNA:PGA:Cas9 of 1:0.8:1.39 These were incubated at 37C for 15 min to form a 14.3 μM RNP solution. RNPs and HDRTs were mixed with T cells before electroporation (3.5 μl of RNP with 500 ng - 1 μg=1 μL of HDRT). Bulk T cells were resuspended in electroporation buffer P3 (Lonza Bioscience) at 0.75e6 cells per 20 μl (per well) and transferred to a 96-well electroporation plate together with 4.5 μL of RNP/HDRT mix per well. Pulse code EH115 was used on a 4D-Nucleofector 96-well Unit (Lonza Bioscience). Cells were rescued in X-VIVO 15 without cytokines for 15 min and then cultured in X-VIVO 15 with 500 U/ml IL-2.
Flow Cytometry and FACS
For flow cytometric analysis, T cells were centrifuged at 300g for 5 min and resuspended in flow buffer (PBS/2%FCS) containing the respective antibody mix (see key resources table). For NY-ESO-1 TCR constructs, cells were stained for 12 min with Dextramer-HLA-A*0201/SLLMWITQV-PE (Immudex) before adding surface antibodies. For HA-GD2-28z CAR constructs, cells were stained for 15 min at 4C with Alexa Fluor 647 AffiniPure F(ab’)2 Fragment Goat Anti-Mouse IgG, F(ab’)2 fragment specific (Jackson ImmunoResearch), washed once with flow buffer (PBS with 2mM EDTA), resuspended in 100ul 2% mouse serum in PBS, incubated for 10 min at 4C, and washed again before surface stain antibodies were added. After another 10 min incubation, cells were washed again and resuspended in wash buffer, then analyzed on an Attune NxT Flow Cytometer (Thermo Fisher Scientific) or BD LSRFortessa (BD Biosciences). For CD19 CAR constructs, detection through the integrated MYC-tag was done according to the manufacturer’s instructions (MYC-tag (9B11) Mouse mAb (Alexa Fluor 647 Conjugate), Cell Signaling Technology). Flow plots were analyzed using FlowJo software.
Single Stimulation Screens
One day prior to set-up of the screen, 2.5e6 A375s were plated per T75 flask in complete RPMI media (RPMI plus NEAA, Glutamine, Hepes, Pen/Strep, sodium pyruvate (all Thermo Fisher Scientific) and 10% FCS (Sigma-Aldrich, St. Louis, Missouri, USA)) assuming that they double within 24 hours. One day later (= seven days after electroporation), edited T-cell pools were counted and washed once. 10e6 T cells were transferred to TRI Reagent (Sigma-Aldrich) representing the input population for amplicon-sequencing. 10e6 T cells per screening condition were transferred to one T75 flask in 20 ml of X-VIVO 15 (Lonza Bioscience) supplemented with 5% FCS, beta-ME (Thermo Fisher Scientific), NAC (VWR) and 50 U/ml IL-2 (Proleukin). For A375 conditions, cRPMI was removed and flasks were filled up with 20 ml of X-VIVO 15 plus additives and 10e6 T cells. For Nalm-6 conditions, 5e6 Nalm-6 cells were added per T75 flask. In the stimulation conditions, T cells were stimulated with Dynabeads CD3/CD28 CTS (Thermo Fisher Scientific) at a 1:1 bead: cell ratio (“signal 1+2 stim”) ora 5:1 ratio (“signal 1+2 excess stim”). For CD3 stimulation only (“signal 1 stim” condition), T cells were incubated with NY-ESO-1 specific dextramer (Immudex) for 12 min at RT (1:50 dilution), washed once and transferred to a T75 flasks. After two days, 10 ml of X-VIVO 15 were added to all conditions including supplements and 50 U/ml IL-2. Another two days later, cells were counted and 10e6 cells were transferred to TRI Reagent (Sigma-Aldrich) for RNA isolation and amplicon-sequencing. The Nalm-6 cell line used in the TCR single stimulation screens had been previously modified to express the NY-ESO-1 antigen on HLA-A2 (in addition to GFP/Luc). All screening results can be found in Table S2.
Repetitive and Tonic Stimulation Screens
One day prior to the start of the repetitive stimulation screen, A375 cells were counted and transferred to 24-well plates (50,000 cells per well in 1 ml of complete RPMI media) assuming that they double within 24 hours. One day later, edited T-cell pools were counted and 10e6 cells were frozen in TRI Reagent (Sigma-Aldrich) for amplicon-sequencing (input population). Media of the A375 cells was removed. 100,000 edited T cells (NY-ESO-1 multimer or CAR positive, ~1:1 effector:target ratio) were transferred to each well of the 24-well plate and co-cultured with the A375 cells in 2 ml of X-VIVO 15 containing supplements plus 50 U/ml IL-2. 24 hours later, fresh A375 cells were plated as described above. One day later, media of the new A375 plate was removed and replaced by 1 ml of fresh X-VIVO 15 plus 1 ml of the T-cell suspension from the first plate including 50 U/ml IL-2 calculated on the total volume per well. The rest of the T cells were counted and 10e6 cells were transferred to TRI Reagent (Sigma-Aldrich) for amplicon-sequencing. The procedure was repeated every other day for a total number of five stimulations with target cells. Multiple wells of the 24-well plates were used per screen to reach cell coverage. For tonic signaling screens, the HA-GD2-28z CAR libraries were knocked into T cells. HA-GD2-28z CAR-T cells were not stimulated with target cells as the HA-GD2-28z CAR is known to drive tonic activation. Cells were harvested on day 4, 8, 12 and 16 after electroporation and transferred to TRI Reagent (Sigma-Aldrich). Combinatorial tonic signaling screens were performed in a similar way (harvest day 4 and day 16). When working with CD19 CARs in combination with A375 cells, we used CD19 overexpressing A375 cells (SFFV promoter knocked in upstream of endogenous CD19). All screening results can be found in Table S2.
FACS-Based Screen on IL2RA Expression
T cells were activated on day 0 and electroporated with the HA-GD2-28z CAR TF library two days later as described above. On day 8 after electroporation, T cells were stained for TCRab-BV711, Fab-AF647 (CAR detection) and CD25/IL2RA-BV421. For sorting, cells were gated on lymphocytes, singlets, TCRab-/CAR+ cells and then sorted based on the top and bottom ~20% of IL2RA expression. 500,000 cells per bin and donor were sorted. RNA was isolated and further processed for amplicon-sequencing as described below. Log2FC of the construct representation in the IL2RA high vs low bin was calculated.
Barcode/Amplicon-Sequencing
Genomic DNA (pilots) or RNA (unless otherwise noted) was isolated from input and output population. DNA isolation was performed with either Quick-DNA kits (Zymo Research) or conventional phenol chloroform extraction. Briefly, cells were resuspended in ChIP lysis buffer (1% SDS, 50 mM Tris, pH 8, 10 mM EDTA) and NaCl, then incubated overnight. After RNAse A and proteinase K treatment, cells were mixed with Phenol:Chloroform:Isoamyl Alcohol (25:24:1, Sigma) and separated using gel phase lock tubes. The DNA was washed with isopropanol and ethanol. For RNA extraction, Direct-zol RNA kits were used (Zymo Research). RNA was reverse transcribed into cDNA using Maxima H Minus Reverse Transcriptase (Thermo Fisher Scientific). The sequencing library was generated by two PCRs. PCR1 was performed using KAPA HiFi HotStart ReadyMix (Roche) for 18 cycles. Amplicons from PCR1 were bead-purified. For PCR2, NEB Next Ultra II Q5 polymerase (NEB) was used for 10 cycles to append P5 and P7 Illumina sequencing adaptors. The PCR2 product was bead-purified, normalized libraries were pooled across samples and sequenced on a MiniSeq (MiniSeq High Output Kit) or NextSeq500 (Mid or High Output Kit, all Illumina). Barcode distribution was analyzed and log2 fold change of barcode representation in output vs input population was calculated to detect changes in abundance. Primer sequences are shown in Table S1D. Primers were purchased from Integrated DNA Technologies (IDT). In our experience, PCR products (e.g., for HDR template generation of validation constructs) can easily contaminate NGS libraries for barcode-sequencing. Therefore, we performed all ModPoKI screens using very strict pre/post PCR separation measures to minimize PCR contamination. However, we had to exclude and repeat some experiments and sequencing runs due to evidence of PCR contamination.
Retrovirus Generation and Retroviral Transduction
Retroviral plasmids were amplified using NEB Stable Competent cells (NEB). To generate retrovirus for comparative analyses between CRISPR KI T cells and retrovirally transduced T cells, GP2-293 cells (Takara Bio) were cultured on poly-D-lysine-coated plates (BioCoat, Corning) and transfected with RD114 and the transfer plasmid (both kindly provided by Crystal Mackall and Robbie Majzner, Stanford) using Lipofectamine 3000 Transfection Reagent (Thermo Fisher Scientific). Opti-MEM (Thermo Fisher Scientific) media supplemented with 5% FCS, Pen/Strep, L-Glutamine, NEAA and Sodium Pyruvate was used during transfection and virus production. Media was replaced 24h after transfection, viral supernatant was harvested 48h and 72h after transfection, centrifuged at 300g for 5min to remove cell debris and frozen at −80C until further use. T cells were activated as described above and transduced on Retronectin-coated plates (Takara) by spinfection two days later as previously described.28 In brief, virus was centrifuged on Retronectin-coated plates at 3200 rpm for 2h at 32C. Supernatant was removed and T cells were added at 0.5e6/ml in X-VIVO 15 containing 5% FCS, beta-ME, NAC and 500U/ml IL-2. Plate was spun at 1200 rpm for 2min. T cells were washed 48h after transduction.
Competition Assay
For validations, after arrayed knockin of the different constructs (either derived from the original Twist Biosciences library, from de novo gene synthesis by GenScript or Integrated DNA Technologies (IDT) or cloned from existing DNA fragments/plasmids and amplified in Stbl3 Competent Cells (MacroLab)), T cells were sorted and a competition assay was set up on day 8-10 after electroporation. T cells were cultured at a ~50:50 ratio with control T cells in X-VIVO 15 containing 5% FCS, beta-ME, NAC and 50 U/ml IL-2. The cell ratio was confirmed by flow analysis of the cell mixes and exact percentage of control T cells was determined at baseline level (NGFR expression). Changes in cell ratio were normalized based on percentages on day 0 of the assay.
Activation Marker and Phenotype Analysis
For HA-GD2-28z CAR validation assays, activation marker expression (4-1BB, IL2RA, CD69) was analyzed by flow cytometry on day 8 after electroporation. CD62L/CD45RA expression levels were analyzed by flow cytometry 14 days after electroporation.
Proliferation Analysis
For proliferation analyses with CD19-28z CAR-T cells as shown in Figure S7I, T cells were sorted for CAR expression (MYC-tag) on day 6 after electroporation. Three days later, they were stained using CellTrace Violet Cell Proliferation Kit (Thermo Fisher Scientific) according to the manufacturer’s instructions and either cultured alone or co-cultured with CD19 KO Nalm-6 cells or CD19 positive Nalm-6 cells at a 1:1 E:T ratio in XVivo15 media with supplements and 50U/ml IL-2. 72 hours later, cells were stained with live/dead, CD4 and CD8 antibodies and T cells were analyzed by flow cytometry.
For proliferation analyses using the NY-ESO-1 TCR-, CD19-BBz and CD19-28z CAR-T cells as shown in Figures S5C–D, T cells were not sorted for CAR/TCR expression since the different sorting strategies (multimer for TCR vs MYC-tag or recombinant CD19 for CARs) could influence the outcome of the assay. KI rates were analyzed <24h before setting up the proliferation assay. 7 days after electroporation, T cells were stained using the CellTrace Violet Cell Proliferation Kit (Thermo Fisher Scientific) according to the manufacturer’s instructions and co-cultured with CD19-expressing A375 cells at a 1:1 E:T ratio in XVivo15 media with supplements and 50U/ml IL-2. 72 hours later, cells were stained with live/dead, TCRab, CD4 and CD8 antibodies in addition to NY-ESO-1 multimer (TCR setting) or recombinant CD19 (CAR setting) and T cells were analyzed by flow cytometry. For staining with recombinant CD19, biotinylated CD19 (AcroBiosystems) was incubated for 1h at RT, washed twice and then detected by addition of Streptavidin-PE (BD).
RNA-Sequencing (Bulk RNA-Seq)
For control TCR vs CAR RNA-seq experiments (Figures S3J–L), a dataset from published work from our group was analyzed (GSE204862).23 For HA-GD2-28z CAR vs CD19-28z CAR vs CD19-BBz CAR comparisons, edited T cells were sorted on day 6 and day 15 after electroporation (control constructs with tNGFR and the respective TCR/CAR), and stored in TRI Reagent (Sigma-Aldrich). RNA was isolated using Direct-zol RNA kits (Zymo Research). Library preparation and sequencing was performed by the QB3-Berkeley Genomics core labs. Total RNA quality as well as poly-dT enriched mRNA quality were assessed on an Agilent 2100 Bioanalyzer. Libraries were prepared using the KAPA RNA Hyper Prep kit (Roche KK8581). Truncated universal stub adapters were ligated to cDNA fragments, which were then extended via PCR using unique dual indexing primers into full length Illumina adapters. Library quality was checked on an AATI (now Agilent) Fragment Analyzer. Library molarity was measured via quantitative PCR with the KAPA Library Quantification Kit (Roche KK4824) on a BioRad CFX Connect thermal cycler. Libraries were then pooled by molarity and sequenced on an Illumina NovaSeq 6000 S4 flowcell for 2 x 150 cycles, targeting at least 25M reads per sample. Fastq files were generated and demultiplexed using Illumina BCL Convert, on a server running CentOS Linux 7. Kallisto was used to map the reads to the human reference transcriptome and genes with zero counts in more than 80% of samples were removed from the analysis. For HA-GD2-28z CAR validation experiments (Figures 4H, S9G–H, S10A–C), edited cells were sorted for CAR+/TCR− expression on day 7 (single inserts) or on day 6 and day 14 (combo inserts) after electroporation. On day 14, one part of the sorted population was stored in TRI Reagent for RNA-seq (Sigma-Aldrich), the other part was stimulated with Nalm-6/GFP/Luc/GD2 cells at a 1:1 E:T ratio. After 24h, the stimulated T cells were sorted again for CAR+/TCR− cells and stored in TRI Reagent (Sigma-Aldrich). RNA was isolated and sequenced as described above. DESeq2 R package was used for differential gene expression, fgsea package for gene set enrichment analysis (GSEA) with MSigDB v7.2 hallmark gene sets as reference gene lists. Nalm-6/GFP/Luc/GD2 were a kind gift from the Mackall lab (Stanford) and were reported to have an STR profile that was a ~60% match to Nalm-6, suggesting some degree of mutation/heterogeneity.
For combined ATAC-/ChIP-/RNA-seq (Figures 7, S11A–B, S11E–I), RNA was isolated from 2e5 sorted CAR-T cells by standard, TRIzol-based RNA precipitation method as follows. Cells were resuspended in 1 ml TRIzol (Ambion). Chloroform was added (200 μL) to this lysate and extensively vortexed to achieve a homogenous mixture; then, it was incubated for 3 minutes at room temperature before centrifugation at 14,000g at 4C for 15 min. Aqueous layer was collected from the top and transferred into a new tube (~550 μL), 1 μL GylcoBlue (Ambion) was added, and the RNA was precipitated with equal volume of 2-propanol for 20 min at room temperature. RNA precipitates were centrifuged at 16,000g for 15 min at 4C and supernatant was carefully discarded without disturbing the GlycoBlue-stained blue RNA pellet. RNA pellet was washed with 1 ml 75% EtOH and after the wash, dissolved in 30 μL nuclease-free water. RNA concentration was determined by nanodrop, and RNA quality was determined by Agilent Bioanalyzer. Approximately 50 ng RNA was reverse-transcribed to cDNA and second strand was synthesized by the Ovation RNA-seq System V2 (Tecan) according to the manufacturer’s recommendations. Double-stranded DNA was subjected to isothermal amplification and was purified with Ampure XP beads. DNA was quantified by Qubit and 80 ng DNA was used for sequencing library construction with the Ovation Ultralow Library System V2 (Tecan) using 8 PCR cycles according to the manufacturer’s recommendations. Libraries were sequenced with Illumina Novaseq 6000, using paired-end 75bp read configuration. The sequencing data was processed using version 3.9 of the nf-core RNA-seq pipeline (https://nf-co.re/rnaseq). Fastq quality control was performed using FastQC, and filtered reads were trimmed with Trim Galore software. The resulting trimmed fastq files were aligned to the hg38 human genome using STAR, and Salmon was used to generate a gene-by-sample count matrix for downstream analysis. Differential analysis of gene expression was performed using the DESeq2 package, with an absolute log2 fold change of ≥ 0.5 and FDR < 0.05. Batch effects by donor were corrected with the removeBatchEffect function in the limma library. A heatmap was created by aggregating differential genes, standardizing expressions with z-scores across samples, and clustering them using the k-means clustering algorithm with Pearson correlation as the distance metric. Pathway analysis of the differential genes and grouped genes was performed using QIAGEN Ingenuity Pathway Analysis.
ATAC-Sequencing
ATAC-seq was performed by using 1e5 sorted CAR-T cells from each condition. Nuclei were isolated with ATAC Lysis Buffer (10 mM Tris-HCl pH 7.4, 10 mM NaCl, 3 mM MgCl2, 0.1% IGEPAL). Nuclei were subjected to tagmentation using Nextera DNA Library Preparation Kit (Illumina). After tagmentation, DNA was purified with MinElute PCR Purification Kit (Qiagen). Tagmented DNA was then amplified with Phusion high-fidelity PCR master mix (NEB) using 14 PCR cycles. Amplified libraries were purified again with MinElute PCR Purification Kit. Fragment distribution of libraries was assessed with Agilent Bioanalyzer and libraries were sequenced on a Novaseq 6000 platform with 150bp paired-end sequencing. The ATAC-seq libraries were processed using the pepatac pipeline (http://pepatac.databio.org/), with default options. The fastq files were first trimmed to remove adapter sequences, and then prealigned to the mitochondrial genome to exclude mitochondrial reads. Furthermore, multimapping reads aligning to repetitive regions of the genome were filtered out to ensure the accuracy of downstream analysis. After these initial steps, Bowtie2 was used to align the reads to the hg38 genome. Samtools was then employed to identify uniquely aligned reads, and Picard was used to remove the duplicate reads. The resulting deduplicated aligned BAM file was used for downstream analysis.
The identification of peaks in individual samples was performed using MACS2, and these peaks were compiled and resized into a standard non-overlapping 500bp width consensus peak set. The peak-sample count matrix was generated using ChrAccR with the default parameters of the run_atac function. Signal tracks for individual samples were then generated using the bamSitesToWig.py function in the pepatac pipeline. Finally, these tracks were merged by group using WiggleTools to produce a comprehensive view of the data across all the samples.
The peak-sample count matrix was analyzed with the DESeq2 package. Batch effects by donor were corrected with the removeBatchEffect function in the limma library. Differential peaks across different conditions were called using DESeq2 with an absolute log2 fold change greater than 0.5 and an FDR less than 0.05. A heatmap was created by aggregating differential peaks across conditions, standardizing peak signals using z-score across samples, and clustering using k-means clustering algorithms. Motif enrichment analysis of TFAP4 in peaks of each group was performed with Fisher’s exact test. Chromatin accessibility and TFAP4 ChIP binding signal histograms and heatmaps of group peaks were generated using signal tracks with featureAlignedDistribution in the ChIPseeker package, and the tornadoplot package with a 3kb window around peaks.
ChIP-Sequencing
ChIP-seq was performed as previously described with the following modifications.74 Sorted CAR-T cells (5e6) were double crosslinked by 50 mM DSG (disuccinimidyl glutarate, ProteoChem) for 30 min followed by 10 min of 1% formaldehyde. Formaldehyde was quenched by the addition of glycine. Nuclei were isolated using ChIP lysis buffer (1% Triton x-100, 0.1% SDS, 150 mM NaCl, 1 mM EDTA, and 20 mM Tris, pH 8.0). Nuclei were sheared with Covaris sonicator using the following setup: Fill level – 10, Duty Cycle – 5, PIP – 140, Cycles/Burst – 200, Time – 4 min. Sheared chromatin was immunoprecipitated overnight with the following antibodies: BATF (brookwoodbiomedical – pab4003), TFAP4 (kind gift from Takeshi Egawa’s group).75 Antibody chromatin complexes were pulled down with Protein A magnetic beads and washed once in IP wash buffer I. (1% Triton, 0.1% SDS, 150 mM NaCl, 1 mM EDTA, 20 mM Tris, pH 8.0, and 0.1% NaDOC), twice in IP wash buffer II. (1% Triton, 0.1% SDS, 500 mM NaCl, 1 mM EDTA, 20 mM Tris, pH 8.0, and 0.1% NaDOC), once in IP wash buffer III. (0.25 M LiCl, 0.5% NP-40, 1mM EDTA, 20 mM Tris, pH 8.0, 0.5% NaDOC) and once in TE buffer (10 mM EDTA and 200 mM Tris, pH 8.0). DNA was eluted from the beads by vigorous shaking for 20 minutes in elution buffer (100 mM NaHCO3, 1% SDS). DNA was decrosslinked overnight at 65C and purified with MinElute PCR purification kit (Qiagen). DNA was quantified by Qubit and 10 ng DNA was used for sequencing library construction with the Ovation Ultralow Library System V2 (Tecan) using 12 PCR cycles according to the manufacturer’s recommendations. Libraries were sequenced with Illumina Nextseq 550, using paired-end 75bp read configuration. Sequencing adapters were trimmed using Trimmomatic. The reads were aligned to the hg38 reference genome using Bowtie2 with the --very-sensitive option. The resulting BAM files were sorted by genomic coordinates using Samtools to remove PCR duplicates. Duplicates after alignment and sorting were marked and removed by Picard. Bed files were generated from bam files with bamToBed and intersected with the hg38 blacKlist. The bed files were used as input for genomeCoverageBed in the Bedtools package, and the output bedgraph files were normalized by total fragments and converted to bigwig files using bedGraphToBigWig in the UCSC tools. Peaks were called from the bed file using MACS2 with a false discovery threshold of 0.05 (-q 0.05). A non-overlapping consensus peak set was created by iteratively eliminating overlapping peaks with lower significance across all samples. A peak-by-sample matrix was created by counting overlaps of reads in each sample with the consensus peak set. Differential peak analysis was carried out on the peak-by-sample count matrix with an absolute log2 fold change threshold of 0.5 and a p-value threshold of 0.05. Motif enrichment of differential binding sites was performed with findMotifsGenome.pl using default parameters.
Integrative Analysis (RNA-, ATAC- and ChIP-Seq)
Chromatin accessibility and TFAP4 ChIP binding signal histograms and heatmaps around the TSS of differentially expressed genes were generated using featureAlignedDistribution in the ChIPseeker package and the tornadoplot package, respectively. A 3kb window was used to aggregate ATAC and ChIP track signals at differentially accessible sites around the upstream and downstream 100 kb of the TSS. findMotifsGenome.pl in the Homer package was used to perform motif enrichment of the differentially accessible sites around the TSS.
Modular Pooled Knockin Sequencing (ModPoKI-Seq)
PoKI-Seq was performed as previously published.37 Briefly, since the knockin barcodes were closer to the 5’ end of the transcript compared to the previous PoKI design, Chromium Single Cell 5’ Reagent Kit, v1 chemistry (10x Genomics) was used according to the manufacturer’s protocol. NY-ESO-1 TCR-positive cells were sorted by FACS, counted and resuspended at 1,000 cells/μL in PBS with 1% FCS. After GEM (Gel Bead-In Emulsions) recovery, the mRNA library was converted to cDNA, amplified for 11 cycles, and quantified with Agilent Bioanalyzer High Sensitivity. 75% of the amplified cDNA material was carried through for transcriptome library preparation according to the manufacturer’s protocol. The remaining 25% of amplified cDNA was used for amplicon-sequencing of the knockin barcodes. The cDNA was enriched for knockin barcodes using a nested PCR strategy with Kapa HiFi HotStart Ready Mix (Roche) for 8 cycles per round. For the first PCR, 0.5μM each of ModPoKI_Seq_1_forw primer and ModPoKI_Seq_1_rev primer was used. Amplified products were purified with 0.8x SPRIselect Reagent Kit (Beckman Coulter) and eluted in 10μL nuclease-free water. The libraries were further enriched with a second PCR using 0.5μM each of ModPoKI_Seq_2_forw primer and ModPoKI_Seq_2_rev primer. Amplified products were purified with 0.8x SPRIselect Reagent Kit (Beckman Coulter) and eluted in 15μL nuclease-free water. Lastly, index PCR was performed with Kapa HiFi HotStart Ready Mix (Roche) for 8 cycles with 2.5μL each Nextera Chromium i7 Sample Indices N Set A (PN 3000262) and 0.5μM ModPoKI_Seq_index primer. Amplified products were purified with 0.8x SPRIselect Reagent Kit (Beckman Coulter) and eluted in 45μL nuclease-free water. Samples were pooled and sequenced on a NovaSeq S4 flow cell with 20% PhiX using read parameters 30x8x98. Fastq files were mapped to the human transcriptome (10x Genomics Cell Ranger, v5.0.0) and a custom knockin barcode reference and analyzed using Seurat (v4.1.1).76 A small fraction (<0.4%) of A375 target cells forming a distinct cluster were removed from the dataset after manual inspection. All screening results can be found in Table S2.
Intracellular Cytokine Assay and Legendplex
T cells were stimulated with target cells at a 1:1 E:T ratio for 24h. Cells were spun down and supernatant was frozen for Legendplex analysis (LEGENDplex Human CD8/NK Panel 13-plex, BioLegend, performed according to the manufacturer’s information). 1x Brefeldin A (Thermo Fisher Scientific) was added to the culture for 4 hours. Cells were stained for surface markers and intracellular cytokines (see key resources table) using the FIX & PERM Cell Fixation & Cell Permeabilization Kit (Thermo Fisher Scientific) according to the manufacturer’s information. For HA-GD2-28z CAR assays, Nalm-6/GFP/Luc/GD2 were used as target cells (kind gift from the Mackall Lab, as described above). For CD19 CAR assays, A375s with CD19 (SFFV promoter knocked in upstream of endogenous CD19) and without CD19 expression (WT) or Nalm-6 cells with and without CD19 expression (CD19 knockout) were used.
TOX Stain
Intracellular TF stains were done using the eBioscience Foxp3/ Transcription Factor Staining Buffer Set (Thermo Fisher Scientific) according to the supplier’s information. A list of flow antibodies is provided in the key resources table.
In Vitro Killing Assay
For Incucyte assays with Nalm-6/GFP/Luc/GD2 (gift from the Mackall Lab, as described above), flat bottom 96-well plates were coated with 50μl; of 0.01% poly-L-ornithine (PLO) solution (Sigma) for 1 hour. PLO was removed and plates were dried for 30-60 min. 10,000 Nalm-6/GFP/Luc/GD2 per well were mixed with sorted T cells in various effector:target (E:T) ratios. For Incucyte assays with A375 target cells (RFP+), 1,500 A375 cells were plated into flat bottom 96-well plates 24h before start of the assay. T cells were added in various E:T ratios one day later (assuming that the A375 cells doubled within 24h). The assay media consisted of X-VIVO 15 as described above, supplemented with 500 U/ml IL-2 and 1X Glucose Solution (Thermo Fisher Scientific). Cell counts were analyzed every six hours using the Incucyte Live Cell Analysis System (Essen BioScience). When working with CD19 CARs in combination with A375 cells, we used CD19 overexpressing A375 cells (SFFV promoter knocked in upstream of endogenous CD19). When using 384-well plates instead of 96-well plates for Incucyte analysis, cell counts and volumes were scaled down accordingly (1,750 Nalm-6/GFP/Luc/GD2 cells or 260 A375/RFP cells per well).
In Vivo Mouse Model
NOD/SCID/IL2Rg-null (NSG) mice were purchased from Jackson Laboratory. 8-12 weeks old female mice were used and mouse experiments were performed under an approved UCSF Institutional Animal Care and Use Committee protocol. For tumor control and survival analyses, mice were injected IV with Nalm-6/GFP/Luc/GD2 cells (gift from the Mackall Lab, as described above) on day 0. Three days later, edited human T cells were injected IV (T-cell count was calculated based on CAR+ T cells). Nalm-6 and T-cell doses are indicated in the Figure legends. As the GD2+ Nalm-6 CAR model is known for outgrowth of antigen-negative28 and antigen-positive tumors that can occur in body cavities especially after injection of low tumor/T-cell numbers and complicate endpoint analysis, we used higher tumor/T-cell doses for survival analyses to increase number of mice with clear clinical endpoint due to leukemia progression (hind limb paralysis) in contrast to solid tumor formation in body cavities that is challenging to detect and quantify. T cells were TCR-depleted one day before injection using EasySep Human TCR Alpha/Beta Depletion Kit (Stemcell) to avoid Graft-versus-Host disease in the mice by unedited cells. Knockin rates were adjusted between groups by adding TCR-negative T cells without CAR knockin right before injection. These cells were generated simultaneously with the therapeutic cells from the same donor and treated the same way except no HDR template was added during electroporation. For imaging, 200 μL (3 mg) of D-Luciferin Potassium Salt (Gold BioTechnology) were injected IP and mice were imaged using an IVIS Spectrum In Vivo Imaging System (PerkinElmer) once/twice per week.
QUANTIFICATION AND STATISTICAL ANALYSIS
Statistical details for all experiments can be found in the Figure legends. For Incucyte experiments, significance was calculated using 2-way ANOVA with multiple-testing correction (Holm-Sidak) across all timepoints (timeline plots) or across E:T ratios (plots depicting multiple E:T ratios) leading to differences in p values between the two plot types. Ns = not significant, * <0.05, **<0.01, ***<0.001, ****<0.0001. Illustrations were done using Adobe Illustrator.
Supplementary Material
Figure S1. Design and Quality Control Metrics of ModPoKI Libraries, Related to Figure 1.
(A) To create flexible ModPoKI libraries of sequences that can be integrated into “a functional module” site in pooled knockin templates along with a replaceable antigen receptor in the “specificity module site,” we developed barcoded multicistronic multipurpose adaptors consisting of a 2A site in combination with a DNA barcode. Using degenerate bases, two barcodes per TF/SR member were hidden in the extended SGSG linker of both the 5’ and 3’ adaptor. The adaptors served as binding sites for the constant cloning primers during pooled library assembly and for the constant sequencing primers for barcode readout by amplicon-sequencing. In contrast to the previous PoKI approach that had a ~600bp distance between barcode and gene of interest,37 barcodes of ModPoKI constructs were designed to be in close proximity to the gene insert (20-60bp) to reduce template switching during PCR.40
(B) We synthesized (Twist Bioscience) the initial two ModPoKI libraries, consisting of 100 TFs (and related proteins) and 129 SRs plus controls in combination with the NY-ESO-1 TCR. Using the 5’ and 3’ cloning primers (ModPoKI_Cloning_Insert_forw/rev), the inserts were amplified in a pooled PCR reaction and then integrated by pooled Gibson assembly into the final plasmid backbone that contained the specificity module (e.g., CD19- or HA-GD2-28z CAR) as well as the homology arms (HAs). The 5’ homology arm contained DNA mismatches to allow amplicon-sequencing off the gDNA without sequencing the dsDNA template.37 HDR templates were generated by pooled PCR resulting in double-stranded ModPoKI HDRT (homology-directed repair template) libraries.
(C) The ModPoKI HDRT libraries were used for pooled non-viral knockin into exon 1 of the TRAC locus by ribonucleoprotein (RNP) electroporation of Cas9, a TRAC-targeting gRNA complex, and the templates. The readout of the screens was performed by either sequencing of gDNA, mRNA/cDNA or using commercially available scRNA reagents (see Methods).
(D) Exemplary flow cytometry assessment after knockin of an NY-ESO-1 TCR tNGFR construct including the barcoded multicistronic adaptor sequences into primary human T cells.
(E) Biallelic knockin rates were calculated based on the observed percentage of GFP/RFP double positive cells after knockin of a 2-member GFP/RFP library. The predicted percentage of biallelic knockins was substantially lower than in the previous PoKI approach (15.3% in ModPoKI vs 24.4% in the previous PoKI approach).37 Predicted percentage of biallelic insertions = observed % double positive cells x2. N = 2 donors.
(F) A mild negative correlation between construct size and library representation was observed in the HDR template pool (mean of n = 4 replicates shown) and of knockin reads in six human donors (day 7 after electroporation, mean is shown). Insert size refers to the number of base pairs that gets inserted into the genomic DNA (without the constructs’ homology arms). R2 was calculated using nonlinear regression (semilog line model, GraphPad Prism). 100 TF and 129 SR library members shown.
(G) Sequencing of the 3’ BC from mRNA/cDNA was highly reproducible across biological replicates (day 7 after electroporation). N = 2 donors, one per axis. R2 was calculated using nonlinear regression (log-log line model, GraphPad Prism).
(H) Correlation between gDNA and mRNA/cDNA barcode-sequencing strategies. 5’ BCs sequenced off gDNA and 3’ BCs sequenced off mRNA/cDNA from the same pooled knockin donor were well-correlated after stimulation with CD3/CD28 beads for 4 days (day 7-11 after electroporation) and after a repetitive stimulation with target cells (A375 stimulation x5 in the CD19-28z CAR model). One donor per screen is shown. Results from a second donor were also correlated (R2=0.66 and 0.76, respectively). R2 was calculated using nonlinear regression (log-log line model, GraphPad Prism). TF and SR libraries shown.
(I) A pilot library of an NY-ESO-1-specific TCR plus GFP vs RFP was pooled at the plasmid assembly stage or after separate electroporation. T cells were sorted for TCR knockin and GFP or RFP positivity and percentage of correctly assigned barcodes was determined by amplicon-sequencing (3’ barcode was sequenced off of mRNA/cDNA). Percent reads with correctly assigned barcodes in sorted populations was notably improved in the new version (ModPoKI) over PoKI37 when pooling at the assembly state. Amount of template switching was calculated for the n = 2-member library and compared to the previous version of the pooled KI platform.37 The ModPoKI platform led to 5.6x decreased observed template switching in the n = 2-member library (extrapolated data for the n > 200-member library shown in Figure 1G). Bars represent mean. N = 2 donors.
All primer sequences are listed in Table S1D.
Figure S2. Characterization of ModPoKI Libraries and Single Stimulation ModPoKI Screen Hits, Related to Figures 1–2.
(A) The TF library in combination with the NY-ESO-1 TCR specificity module was knocked into primary human T cells. Cells were sorted for NY-ESO-1 TCR expression and ModPoKI-Seq (barcode-sequencing and transcriptome-sequencing) was performed. Cell identity (based on barcode-sequencing) was well-correlated with transcript expression of the knocked in TF confirming successful knockin and overexpression on RNA level. TF constructs that were codon-optimized or showed no barcode/transcript expression were removed from the analysis. N = 2 donors.
(B) Percent of total reads of pooled knockin libraries in six human donors. TF and SR libraries were knocked in as one large library and subsequently computationally separated into individual libraries for analysis. Construct barcodes were consistently well-represented with even library distribution.
(C) Endogenous expression of the TF library members based on published RNA-seq data (DICE dataset, https://dice-database.org/). Expression was scaled by column. SOX3 was excluded from the heatmap since it had no expression in the cell types shown according to the DICE database.
(D-G) Pooled knockin with constructs encoding the TF or SR library in combination with the NY-ESO-1 TCR was performed in primary human T cells. Resulting cells were subjected to the screens described in Figure 2. Log2 fold change in abundance for top and bottom hits (based on excessive stimulation) across single stimulation screens is shown (normalized to abundance of GFP and RFP controls and to fit on a scale from +1 to −1). N = 6 donors. Mean + SEM shown.
Figure S3. FAS Fusion Protein Validations and Repetitive Stimulation ModPoKI Screens, Related to Figures 2–3
(A) Constructs with NY-ESO-1 TCR in combination with different FAS-containing surface receptors were knocked into T cells. FAS surface expression levels detected by flow cytometry on day 7 after electroporation revealed a broad range of expression although all tested FAS proteins had the same FAS-derived extracellular and transmembrane domains and only differed in the intracellular domain. Results from one exemplary donor out of three donors are shown.
(B) FAS fusion proteins with high expression on the cell surface tended to perform better in pooled knockin screens (NY-ESO-1 TCR single stimulation screen with Nalm-6 co-culture average log2FC vs average GeoMean FI of FAS expression in flow cytometry is shown). Data of the six FAS proteins depicted in Figure S3A are shown. N = 6 donors for screen data, n = 3 donors for flow data. Nonlinear regression (line model) was performed (GraphPad Prism).
(C) SR constructs in combination with the NY-ESO-1 TCR were knocked into T cells. T cells were sorted and co-cultured with NY-ESO-1-expressing Nalm-6 target cells at a 1:1 E:T ratio for 24 hours. Intracellular cytokine stain was performed 4 hours after BrefeldinA addition. N = 3 donors in technical duplicates. Mean + SEM is shown. RM one-way ANOVA (vs tNGFR) with Geisser-Greenhouse correction and Holm Sidak’s test was performed (GraphPad Prism).
(D) Interferon-gamma (IFN-g) and Granzyme B concentrations in co-culture supernatants derived from the co-cultures described in panel C were analyzed using LEGENDplex Human CD8/NK Panel. N = 3 donors in technical duplicates. Mean + SEM is shown. RM one-way ANOVA (vs tNGFR) with Geisser-Greenhouse correction and with Holm Sidak’s test was performed (GraphPad Prism).
(E) SR constructs in combination with the NY-ESO-1 TCR were knocked into T cells. T cells were sorted and co-cultured with RFP- and NY-ESO-1-expressing Nalm-6 target cells at a 1:4 E:T ratio. Killing was evaluated using Incucyte analysis. N = 3 donors in technical triplicates. Mean + SEM is shown. Significance at the last imaging timepoint is shown. Two-way ANOVA with Holm Sidak’s test was performed to determine statistical significance as described in the Methods.
(F) The NY-ESO-1 TCR in combination with tNGFR was knocked into T cells. Surface expression of FASL, LIGHT (LTBR ligand), CD80 and CD86 (CD28 and CTLA-4 ligands) was evaluated on T cells with and without 24 hours of CD3/CD28 stimulation (1:1 cells:bead ratio vs 1:5 cells:bead ratio) using flow cytometry. N = 2 donors in technical duplicates. Mean + SEM is shown.
(G) FAS (CD95) and FASL surface expression was analyzed on A375 melanoma and Nalm-6 leukemia cells (left panel) and on tNGFR NY-ESO-1 TCR KI T cells co-cultured with A375 melanoma cells or Nalm-6 leukemia cells for 24 hours (right panel). Technical duplicates (left panel) and N = 3 donors in technical duplicates (right panel), one exemplary donor/measurement shown, respectively.
(H) Control T cells (NY-ESO-1 TCR plus tNGFR) were subjected to the repetitive stimulation screen described in Figure 3A. Knockin percentage (NGFR+) was determined by flow cytometry during the course of the assay and compared to T cells without re-stimulation. N = 2 donors in technical triplicates. Mean + SEM is shown.
(I) Surface expression of inhibitory molecules LAG-3, PD-1, TIM-3 and CD39 was analyzed by flow cytometry through the course of the repetitive stimulation assay. N = 2 donors in technical triplicates for LAG-3, PD-1 and TIM-3. N = 4 donors in technical duplicates for CD39. Mean + SEM shown.
(J) Control T cells (NY-ESO-1 TCR or CD19-BBz CAR plus tNGFR) were generated and bulk RNA-seq analysis was performed at every timepoint of the repetitive stimulation assay as previously reported (GSE204862).23 Principal component analysis is shown. N = 3 donors.
(K) Bulk RNA-seq (GSE204862)23 revealed progressive induction of CD69 during the repetitive stimulation assay while IL2RA and TNFRSF9 expression peaked relatively early and then decreased. N = 3 donors. Mean + SEM shown.
(L) A variety of other transcript markers of T-cell phenotype, effector function and T-cell dysfunction were analyzed in RNA-seq data and compared between CAR and TCR control T cells (GSE204862)23. N = 3 donors. Mean + SEM shown.
(M) The TF and SR libraries were knocked into primary human T cells in combination with the NY-ESO-1 TCR and subjected to the repetitive stimulation assay. Mean log2FC (output vs input) is shown. N = 4 donors. Top and bottom 30 of 231 constructs are shown.
(N) Relationship between insert size and repetitive screening result (log2FC of 5th stim vs input abundance in NY-ESO-1 TCR repetitive stimulation screen). Indicated insert size does not include homology arms. Nonlinear regression (line model) was performed (GraphPad Prism). N = 4 donors.
Figure S4. Repetitive Stimulation ModPoKI-Seq Screening Data, Related to Figure 3
(A) The 100-member TF library was knocked into primary human T cells from n = 2 donors in combination with the NY-ESO-1 TCR. ModPoKI-Seq (single-cell transcriptome coupled with KI barcode-sequencing) was performed. Heatmap shows differentially expressed genes (stim 5 vs stim 1) of the different knockins (threshold >30 cells per knockin after 5 stimulations).
(B) Log2FC bins were generated based on abundance log2FC in the bulk NY-ESO-1 TCR repetitive stimulation fitness screen and compared to the correlation in gene expression with controls (RFP/GFP) in ModPoKI-Seq. Best-performing knockins in fitness screens showed highest correlation coefficients with controls. N = 2 donors for ModPoKI-Seq screen, n = 4 donors for bulk fitness screen.
(C) Correlation between cluster enrichment in ModPoKI-Seq (threshold >30 cells per knockin after 5 stimulations) and abundance log2FC in bulk repetitive TCR stimulation fitness screens revealed highest correlation score for enrichment in the CD8 proliferating cluster 9. N = 2 donors for ModPoKI-Seq screen, n = 4 donors for bulk fitness screen.
(D) Chi-square residuals for enrichment in cluster 0-13 (threshold >30 cells/knockin after 5 stimulations) were compared to abundance log2FC in the bulk screens. N = 2 donors for ModPoKI-Seq screen, n = 4 donors for bulk abundance screen. Clusters are shown in order of correlation with abundance log2FC in bulk repetitive TCR stimulation fitness screens (see panel C).
(E) TRAC expression levels were compared across the TF library using ModPoKI-Seq screening data at input, after 1st stimulation and after 5th stimulation with target cells. Dotted line shows average TRAC expression at the respective timepoint. N = 2 donors.
(F) To validate TCR expression of key hit TFAP4 on protein level, TCRab expression of TFAP4 vs tNGFR NY-ESO-1 TCR KI T cells was analyzed by flow cytometry during the repetitive stimulation assay. Cells were gated on NY-ESO-1 multimer+/TCRab+ T cells. N = 3 donors in technical triplicates.
(G) Exemplary flow cytometry plot of the data prior to stimulation shown in panel F comparing TCRab protein expression of TFAP4 vs tNGFR KI T cells. Cells were gated on NY-ESO-1 multimer+/TCRab+ T cells.
(H) NY-ESO-1 multimer staining of TFAP4 vs tNGFR NY-ESO-1 TCR KI T cells was analyzed by flow cytometry during the repetitive stimulation assay. Cells were gated on NY-ESO-1 multimer+/TCRab+ T cells. N = 3 donors in technical triplicates.
(I) Average normalized TF expression (based on ModPoKI-Seq data) vs insert length is depicted and showed no correlation. N = 2 donors. Nonlinear regression (line model) was performed (GraphPad Prism).
Figure S5. Construction of CD19 CAR Libraries and Construct Performance in Repetitive Stimulation Screens, Related to Figure 3
(A) To generate the CD19 CAR libraries, a CAR plasmid containing the TRAC-derived homology arms, the CD19-BBz CAR (FMC63) as well as constant linkers was generated and linearized by PCR. The TFs/SRs plus constant linkers were amplified from the TCR library by PCR. The CAR backbone plus TF/SR inserts were linked using pooled Gibson assembly. Representation of different library constructs was analyzed by amplicon-sequencing of the plasmid pools, the HDR template libraries and the T-cell pool seven days after non-viral knockin (input population for the screens). Results from TF library are shown. N = 1 for CAR plasmid, n = 2 for TCR plasmid, n ≥ 3 for HDR templates and input population (individual donors). R2 was calculated using nonlinear regression (log-log line model, GraphPad Prism).
(B) Log2 fold changes in abundance were compared between the CAR and the TCR repetitive stimulation screen and showed comparable trends for most constructs. While IRF8 increased in abundance over time, JUN did not show a significant increase in abundance. Interestingly, control construct tCTLA-4 trended to increase after initial stimulations but dropped out later in the assay (in contrast to e.g., CTLA-4/CD28 fusion, see Figure 3J). N = 4 donors for TCR screens, n = 3 donors for CD19-BBz CAR screens. Mean + SEM shown.
(C) T cells were electroporated with PD-1/4-1BB or tNGFR in combination with either the NY-ESO-1 TCR, a CD19-BBz or a CD19-28z CAR. T cells were stained with CellTrace Violet and co-cultured with CD19- and NY-ESO-1-expressing A375 melanoma cells at a 1:1 E:T ratio. Evaluation was performed 72 hours later (gated on CAR+/TCRab- or NY-ESO-1 multimer+/TCRab+ T cells). N = 2 donors in technical duplicates. Statistical significance was calculated using two-way ANOVA with Holm Sidak’s test. Mean + SEM shown.
(D) T cells were electroporated with ZSCAN18 or tNGFR in combination with either the NY-ESO-1 TCR, a CD19-BBz or a CD19-28z CAR. T cells were stained with CellTrace Violet and co-cultured with CD19- and NY-ESO-1-expressing A375 melanoma cells at a 1:1 E:T ratio. Evaluation was performed 72 hours later. N = 2 donors in technical duplicates. Statistical significance was calculated using two-way ANOVA with Holm Sidak’s test. Mean + SEM shown.
(E) T cells were electroporated with ZSCAN18 or tNGFR in combination with either the NY-ESO-1 TCR, a CD19-BBz or a CD19-28z CAR. ZSCAN18 and tNGFR KI T cells were mixed at a ~50:50 ratio and co-cultured with CD19- and NY-ESO-1-expressing A375 melanoma cells in analogy to the repetitive stimulation protocols. %tNGFR positive cells was determined before and after every repetitive stimulation step. The divergent behavior of ZSCAN18 constructs in the CD19-BBz CAR vs NY-ESO-1 TCR setting observed in the screens was confirmed in single knockin validation studies hinting at a context-dependent effect of ZSCAN18. Relative changes in abundance were calculated. N = 2 donors in technical duplicates. Mean + SEM shown.
(F) TF and SR libraries were combined with a CD19 CAR with CD28 intracellular domain (CD19-28z CAR). Single stimulation and repetitive stimulation screens with CD19-expressing A375 melanoma cells were performed, similar to the screens with the CD19-BBz CAR. Log2FC of output vs input was calculated and normalized based on controls GFP and RFP and to fit on a scale from −1 to +1. Top and bottom 50 of 231 constructs are shown. N = 3 donors for repetitive stimulation screens and n = 2 donors for single stimulation screens (due to insufficient coverage in the third donor).
(G) CD19-28z CAR repetitive stimulation screens were compared to CD19-BBz CAR and NY-ESO-1 TCR repetitive stimulation screens. TF and SR library results are shown separately. Unnormalized log2FC of representation in 5th stim vs input population is shown. N = 3 donors for CAR screens and n = 4 donors for TCR screens. In the SR library plots (third and fourth plot), exemplary 4-1BB- or CD28-containing fusion proteins in the upper left or lower right quadrant are shown to highlight the divergent behavior of the different fusion proteins in CD19-BBz vs CD19-28z models. Nonlinear regression (line model) was used to determine statistical significance (GraphPad Prism).
(H) Performance of CD28- and 4-1BB-based fusion receptors in CD19-28z and CD19-BBz CAR T-cell screens. Plot shows fusion proteins with a positive log2FC (5th stimulation vs input population) in any or both of the two screens. 4-1BB-based fusion proteins tended to perform better in CD19-28z CARs compared to CD19-BBz CARs. Statistical significance was calculated using unpaired t-test. N = 3 donors per screen, mean unnormalized log2FC is shown.
(I-J) Exemplary fusion proteins and their screen performance across five stimulations and both CAR models. Unnormalized log2FC mean + SEM shown, n = 3 donors per screen.
(K) Performance of BATF and TFAP4 KI constructs across five stimulations in the CD19-BBz and CD19-28z CAR screens. Unnormalized log2FC mean + SEM shown, n = 3 donors per screen.
Figure S6. Characteristics of Different CARs Under TRAC Promoter Control and HA-GD2-28z SR Screen with Validations, Related to Figure 4.
(A-B) RNA-seq was performed on HA-GD2-28z CAR-T cells, CD19-BBz CAR-T cells and CD19-28z CAR-T cells 6 days and 15 days after electroporation. On day 15, HA-GD2-28z CAR-T cells showed decreased levels of early T-cell differentiation/memory markers CCR7 and LEF1 and increased levels of dysfunction markers TOX, LAG3, HAVCR2 (TIM-3) and ENTPD1 (CD39). N = 3 donors. Statistical significance in B was analyzed using two-way ANOVA with Holm Sidak’s test. Mean + SEM shown.
(C) Flow cytometric analysis of HA-GD2-28z CAR+ vs bystander CAR− cells reveal elevated expression of activation markers 4-1BB, IL2RA and CD69 on CAR-T cells even in the absence of target cells 8 days after electroporation, consistent with tonic CAR signaling similar to what was previously described.28 N = 2 donors in technical triplicates. Mean + SEM shown.
(D) A ModPoKI screen with the SR library was performed in HA-GD2-28z CAR-T cells. As the HA-GD2-28z CAR provides tonic stimulation, HA-GD2-28z CAR-T cells were cultured without addition of target cells. Log2FC in abundance is shown (compared to day 4 of culture). Heatmap was normalized based on controls (RFP/GFP) and to fit on a scale from +1 to −1. Top and bottom 40 out of 131 constructs are shown. N = 4 donors.
(E) Log2 fold changes in the HA-GD2-28z CAR SR library screen are shown (no further normalization). Mean of n = 4 donors.
(F) The HA-GD2-28z CAR was knocked into human T cells in combination with either TFAP4 or a control construct (tNGFR). Cells were sorted for CAR+/TCR− cells and TFAP4 and tNGFR T cells were co-cultured at a ~50:50 ratio. Relative abundance of the NGFR+ cells was analyzed over time by flow cytometry. N = 2 donors in technical duplicates. Unpaired t-test was used to calculate statistical significance on day 8.
(G-H) To exclude that cellular effects are dependent on specific barcodes linked to KI constructs, we swapped the TFAP4 and BATF barcodes with the tNGFR barcodes. T cells were electroporated with HA-GD2-28z CAR constructs and conventional TFAP4/tNGFR sequences or TFAP4/tNGFR sequences with swapped barcodes (G). Cells were sorted and TFAP4 and tNGFR KI cells were co-cultured at a ~50:50 ratio. Relative abundance over time (tNGFR positive vs tNGFR negative cells) was analyzed and confirmed that the fitness effect of TFAP4 KI was not barcode-specific. The same analyses were done for BATF KI (H). N = 2 donors in technical triplicates.
(I) tNGFR or TFAP4 HA-GD2-28z CAR-T cells were co-cultured with GD2+ target cells (Nalm-6/GFP/Luc/GD2) at various effector:target (E:T) ratios. Number of remaining target cells was calculated using the Incucyte system. N = 2 donors in technical triplicates. Two-way ANOVA was used to calculate statistical significance including Holm-Sidak’s test as described in the Methods. Significance at last timepoint (132 hours) shown. Mean + SEM shown. Left panel shows 1:10 E:T ratio. Only significance between TFAP4 vs tNGFR is shown.
Figure S7. Comparison with Retroviral System and Extended TFAP4 Validation Data, Related to Figure 4.
(A) The HA-GD2-28z CAR in combination with tNGFR, BATF, JUN or TFAP4 was expressed using either the non-viral KI system or a retroviral transduction system. Cells were sorted on CAR expression and BATF, JUN and TFAP4 overexpressing cells were co-cultured with tNGFR overexpressing cells at a ~50:50 ratio. Relative abundance (tNGFR positive vs negative cells) was analyzed over the course of 18 days. TRAC knockin strategy is shown in the upper panel, retroviral transduction is shown in the lower panel. N = 3 donors in technical triplicates. Two-way ANOVA with Holm Sidak’s test was performed (GraphPad Prism).
(B) Cells were generated and sorted as described in panel A and co-cultured with GD2-expressing Nalm-6 cells for 24 hours. TRAC knockin strategy is shown in the upper panel, retroviral transduction is shown in the lower panel. Intracellular cytokine expression was analyzed by flow cytometry. N = 3 donors in technical duplicates. One-way ANOVA (vs tNGFR) with Holm Sidak’s test was performed (GraphPad Prism). Mean+SEM shown.
(C) Cells were generated and sorted as described in panel A and co-cultured with GD2-expressing Nalm-6 cells in an Incucyte analysis. TRAC knockin strategy is shown in the upper panel (E:T ratio 1:8), retroviral transduction is shown in the lower panel (E:T ratio 1:8). N = 3 donors in technical triplicates. Two-way ANOVA (vs tNGFR) with Holm Sidak’s test was performed to analyze statistical significance as described in the Methods. Mean+SEM shown.
(D) tNGFR CD19-28z CAR-T cells were co-cultured with CD19+ target cells (Nalm-6) with or without prior 5x repetitive stimulation (CD19 positive A375s). Killing capacity of tNGFR CD19-28z CAR-T cells was markedly decreased after going through repetitive stimulation. N = 2 donors in technical quadruplicates. Multiple unpaired t-test was performed to determine statistical significance including Holm-Sidak’s test as described in the Methods. Significance at last timepoint (114 hours) shown. E:T ratio = 1:2. Mean + SEM shown.
(E) The CD19-28z CAR in combination with tNGFR or TFAP4 was knocked into human T cells and co-cultured with CD19+ target cells (Nalm-6) at various E:T ratios. Number of remaining target cells/cancer-cell killing was analyzed using the Incucyte system across various E:T ratios. N = 2 donors in technical quadruplicates. Two-way ANOVA was used to calculate statistical significance including Holm-Sidak’s test as described in the Methods. Significance at last timepoint (114 hours) shown. Mean + SEM shown. Left panel shows 1:2 E:T ratio.
(F) T cells were generated as described in panel E, subjected to the repetitive stimulation assay (five stimulations with A375s) and then co-cultured with CD19+ target cells one more time (Nalm-6). Again, CD19-28z CAR-T cells with synthetic TFAP4 knockin were better able to control tumor cell growth. N = 2 donors in technical quadruplicates. Two-way ANOVA was used to calculate statistical significance including Holm-Sidak’s test as described in the Methods. Significance at last timepoint (120 hours) shown. Mean + SEM shown. Left plot shows 1:2 E:T ratio.
(G) T cells were generated as described in panel E, subjected to the repetitive stimulation assay and then co-cultured with CD19+ target cells one more time (stimulations and final co-culture were with adherent cell line A375 that was modified to express CD19). Again, CD19-28z CAR-T cells with synthetic TFAP4 knockin were better able to control tumor-cell growth. N = 2 donors in technical quadruplicates. Two-way ANOVA was used to calculate statistical significance including Holm-Sidak’s test as described in the Methods. Significance at last timepoint (120 hours) shown. Mean + SEM shown. Left plot shows 1:1 E:T ratio.
(H) tNGFR or TFAP4 CD19-28z CAR-T cells were co-cultured with CD19 negative target cells (A375). No elevated unspecific killing of the TFAP4 compared to the tNGFR construct was observed. Two-way ANOVA was used to calculate statistical significance including Holm-Sidak’s test as described in the Methods. Significance at last timepoint (84 hours) shown. Left plot shows 1:4 E:T ratio. N = 2 donors in technical triplicates. Mean + SEM shown.
(I) TFAP4 or tNGFR KI CD19-28z CAR-T cells were stained with CellTrace Violet and either cultured without targets or co-cultured with CD19 negative or CD19 positive target cells (Nalm-6) for 72 hours. Reduced CTV signal indicates increased proliferation of TFAP4 KI T cells after co-culture with CD19 positive targets, but not after co-culture with CD19 negative targets or after culturing them without target cells. N = 2 donors in ≥ 2 technical replicates. Paired t-test was performed (GraphPad Prism). Mean + SEM shown. The histogram (right panel) shows exemplary CTV signal after co-culture with CD19 positive target cells for one out of two donors.
Only significance between TFAP4 vs tNGFR is shown in E-H.
Figure S8. Extended TFAP4 Validation Data and IL2RA FACS-Sorted Screen in HA-GD2-28z CAR-T cells, Related to Figure 4.
(A) Endogenous TFAP4 expression was analyzed by bulk RNA-seq throughout the repetitive stimulation assay using the NY-ESO-1 TCR or CD19-BBz CAR system and compared to endogenous TFAP4 levels when culturing the HA-GD2-28z CAR (tonic activation). While TFAP4 expression peaked after the 2nd stimulation in the TCR model, it was more heterogenous in the CD19-BBz CAR model and decreased over time in the HA-GD2-28z CAR model. N = 3 donors for the NY-ESO-1 TCR and CD19-BBz CAR, n = 2 donors for the HA-GD2-28z CAR. Mean + SEM shown.
(B) TFAP4 transcript overexpression resulting from TFAP4 KI as determined by ModPoKI-Seq (see Figure S2A, NY-ESO-1 TCR). Mean normalized TFAP4 expression of TFAP4 KI T cells vs cells with KIs of the included other constructs is shown. N = 2 donors.
(C) To determine protein expression levels of TFAP4 in TFAP4 KI T cells, we generated TFAP4 HA-GD2-28z CAR constructs with an N terminal HA-tagged TFAP4 and a C terminal HA-tagged TFAP4. GeoMean FI of intracellular HA-tag expression is shown for conventional tNGFR HAGD2-28z CAR KI cells vs N-terminally tagged (HA-TFAP4) and C-terminally tagged (TFAP4-HA) TFAP4 HA-GD2-28z CAR KI cells 10 days after electroporation. Mean + SEM shown. N = 2 donors in technical triplicates. Statistical significance was calculated using one-way ANOVA with Holm Sidak’s test.
(D) Exemplary flow cytometry data of the experiment described in panel C for one out of two donors 10 days after electroporation is shown (intracellular HA expression). Cells were gated on CAR+/TCRab− expression.
(E) GeoMean FI data of plot in Figure 4G is shown. IL2RA and CD69 expression on HA-GD2-28z CAR-T cells were analyzed by flow cytometry on day 8 after electroporation; TFAP4 KI led to increased IL2RA surface expression. Multiple t-test was performed to determine significance including Holm Sidak’s test. N = 2 donors in technical duplicates. Mean + SEM shown.
(F) Induction of IL2RA (a key phenotype of TFAP4 KI) was preserved after addition of an HA-tag to either the C or N terminus of TFAP KI construct. N = 3 donors in one to three technical replicates. Statistical significance was calculated using one-way ANOVA with Holm Sidak’s test.
(G) A FACS-based ModPoKI screen was performed to identify TFs that can affect IL2RA expression. ModPoKI was performed with the HA-GD2-28z CAR in combination with the TF library. Cells were FACS-sorted on day 8 after electroporation into top and bottom ~20% IL2RA expression bins. RNA was isolated and barcode amplicon-sequencing performed. N = 3 donors. Sorting strategy is shown for one exemplary donor.
(H) The IL2RA FACS-sorted screen was performed as described in panel G. Log2FC of construct representation in IL2RA high vs low bin was calculated and dataset was normalized based on GFP/RFP controls and to fit on a scale from −1 to 1. N = 3 donors, mean + SEM shown.
(I) Cytokine production and secretion of TFAP4 KI vs tNGFR KI HA-GD2-28z CAR-T cells were analyzed after 24h co-culture with GD2+ target cells by intracellular cytokine stain (left panel) and Legendplex analysis of the supernatant (right panels). N = 2 donors in >= 2 technical replicates. Multiple paired t-test was performed to determine statistical significance. Mean + SEM shown.
(J) TFAP4 or tNGFR KI CD19-28z CAR-T cells were co-cultured with either CD19 negative or CD19 positive target cells (A375 and Nalm-6). IFN-g and IL-2 production was evaluated by intracellular cytokine stain and confirmed elevated cytokine levels only in the presence of CD19 positive target cells. In the presence of CD19 negative target cells or in absence of target cells, TFAP4 KI CD19-28z CAR-T cells did not release increased amounts of IFN-g and IL-2 compared to the control. Multiple paired t-test was performed to determine statistical significance. N = 2 donors in technical triplicates. Mean + SEM shown.
Figure S9. Combinatorial Knockin Strategy and BATF-TFAP4 Validation Analyses, Related to Figures 5–6.
(A-B) Schematic illustration showing the pooled assembly approach used to generate a combinatorial library of the tonic signaling HA-GD2-28z CAR plus 100 TFs x 100 TFs resulting in a ~10,000-member library. The inserts for TF position 1 and 2 were separately generated by pooled PCRs off of the existing TF library. The backbone (consisting of the HA-GD2-28z CAR plus homology arms) and the two inserts were assembled in a pooled Hifi DNA assembly reaction resulting in the combinatorial ModPoKI plasmid library. Double-stranded HDR template was generated by pooled PCR followed by non-viral pooled knockin into primary human T cells. The resulting sequences between the two TFs (combinatorial barcoded multicistronic adaptor) can be used to read out the identity of the constructs (see Methods).
(C) Exemplary knockin of a control construct containing the HA-GD2-28z CAR with tNGFR and RFP including the combinatorial barcoded multicistronic adaptor sequences into primary human T cells.
(D) To assess if the direction of the knockin influences expression levels, HA-GD2-28z CAR constructs including RFP-tNGFR (RFP in 1st position) and tNGFR-RFP (RFP in 2nd position) were generated and RFP expression was analyzed by flow cytometry on day 4 after electroporation. Exemplary flow cytometry plot from one donor out of two donors is shown, cells were gated on CAR+/TCRab− T cells.
(E) The TFxTF combinatorial ModPoKI library was knocked into primary human T cells. As the HA-GD2-28z CAR provides tonic signaling, T cells were cultured without addition of target cells. Cells were sorted on day 4 and day 16 after electroporation and the log2FC over time was calculated (day 16/day 4). Log2FC for the top 10 combinatorial TFxTF constructs is shown and compared to controls. N = 2 donors. Panel shows data for various KI combinations (with barcodes for constructs with both orientations included as bars x two donors).
(F) Data from Figure 6B shown as GeoMean FI instead of percent positive. The data from the single knockin tNGFR HA-GD2-28z CAR construct were added to illustrate that the BATF-TFAP4 KI construct increases levels of IL2RA surface expression beyond baseline. Mean + SEM shown. Two-way ANOVA with Holm Sidak’s test was performed to analyze statistical significance. N = 2 donors in technical duplicates.
(G) Different combinatorial validation constructs were knocked into primary human T cells as described in Figure 6. Bulk RNA-seq was performed 14 days after electroporation. Differentially expressed genes between BATF-TFAP4 KI and RFP-tNGFR KI HA-GD2-28z CAR-T cells are plotted. N = 2 donors.
(H) Log2 fold changes in gene expression between the tested KI condition and control KI (RFP-tNGFR) were compared between BATF-TFAP4 KI and the other constructs. Correlation analyses indicated that BATF-TFAP4 KIs were most similar in gene expression changes with RFP-TFAP4 and BATF-RFP, while the correlation between BATF-TFAP4 KI cells and RFP-JUN KI cells was lower. N = 2 donors. Statistics were done using linear regression (lm function in RStudio).
Figure S10. Extended BATF-TFAP4 Validation Data, Related to Figure 6.
(A-C) Gene set enrichment analyses of the BATF-TFAP4 combinatorial construct compared to RFP-tNGFR (A), RFP-TFAP4 (B) or BATF-RFP (C) without and with addition of GD2+ target cells for 24h is shown (day 14 vs day 15 after electroporation, respectively). Notably, after stimulation with target cells, the gene sets involved in fatty acid metabolism, glycolysis, oxidative phosphorylation and IL2/STAT5 signaling were enriched in genes differentially expressed between BATF-TFAP4 cells compared to RFP-tNGFR cells. N = 2 donors.
(D) Combinatorial KI HA-GD2-28z CAR-T cells were co-cultured with Nalm-6/GFP/Luc/GD2 target cells and target-cell killing was analyzed via Incucyte. BATF-TFAP4 combinatorial KI HA-GD2-28z CAR-T cells trended toward improved performance relative to other combinatorial KI HA-GD2-28z CAR-T cells in terms of in vitro killing capacity. N = 2 donors in technical triplicates. Reduced number of replicates for RFP-tNGFR condition was due to low cell counts (see panel E). Two-way ANOVA with Holm Sidak’s test was performed to analyze significance as described in the Methods. Significance at the last imaging timepoint is shown; mean + SEM shown.
(E) Data from Figure 6F divided by donors and with more E:T ratios. N = 3 for all conditions in donor 1. N = 3 for BATF-TFAP4, RFP-TFAP4 and BATF-RFP condition in donor 2. Due to low cell counts, RFP-tNGFR only has one datapoint in E:T 1:8 and 1:12 and no datapoint in the other E:T ratios for donor 2. Mean + SEM shown in all conditions with N > 1.
(F) Data from Figure 6G divided by donors. Mean + SEM shown.
Figure S11. BATF Facilitates TFAP4-Mediated Increases in T-Cell Fitness, Related to Figure 7
(A) HA-GD2-28z CAR-T cells with single or combinatorial knockin of BATF and/or TFAP4 vs controls were generated, sorted for CAR+/TCRab− T cells and subjected to RNA-seq, ATAC-seq and TFAP4 and BATF ChIP-seq 14 days after electroporation. Metagene plot of normalized (#) TFAP4 ChIP-seq signal intensity (top) and ATAC-seq signal intensity (bottom) at TFAP4 KIregulated chromatin regions (opening or closing) in the indicated conditions. FDR < 0.05, log2FC ≥ 0.5.
(B) Heatmap shows differential TFAP4 binding sites in tNGFR vs. TFAP4 HA-GD2-28z KI CART cells. N = 3 donors; FDR < 0.05, log2FC ≥ 0.5. De novo TF motif analysis by Homer at induced and unchanged TFAP4-bound genomic regions is shown.
(C) tNGFR, TFAP4 or IL2RA HA-GD2-28z KI CAR-T cells were co-cultured with GD2-expressing Nalm-6 cells. TFAP4 KI significantly increased cytotoxic capacity compared to IL2RA KI. Two-way ANOVA was used to determine statistical significance including Holm-Sidak’s test as described in the Methods. Significance at the last timepoint (192 hours) is shown. N = 3 donors in technical triplicates. Mean + SEM shown. Left plot shows 1:16 E:T ratio. Only significance between TFAP4 vs IL2RA, IL2RA vs tNGFR and TFAP4 vs tNGFR is shown.
(D) tNGFR, TFAP4 or IL2RA HA-GD2-28z KI CAR-T cells were co-cultured with GD2-expressing Nalm-6 cells at a 1:1 E:T ratio. Cytokine concentrations in co-culture supernatants were analyzed using LEGENDplex Human CD8/NK Panel. N = 3 donors in technical triplicates. Mean + SEM is shown. One-way ANOVA was used to calculate statistical significance between TFAP4, IL2RA and tNGFR KIs including Holm-Sidak’s test.
(E) Heatmap representation of differentially accessible open chromatin regions (OCRs) in the indicated conditions (left). OCR groups were defined by k-means clustering and describe distinct chromatin accessibility patterns, as follows: Group I. Accessibility is induced by TFAP4 KI and not affected by BATF KI; Group II. Accessibility is induced by TFAP4 KI and further increased by BATF-TFAP4 combination KI; Group III. Accessibility is induced by TFAP4 KI, but decreased by BATF-TFAP4 combination KI; and Group IV. Accessibility is reduced in all conditions compared to tNGFR control KI. N = 3 donors; FDR < 0.05, log2FC ≥ 0.5. Metagene plot of normalized (#) ATAC-seq (middle) and TFAP4 ChIP-seq (right) signal intensity in the four groups of OCRs in the indicated conditions. Pie charts represent the percentage of OCRs bound by TFAP4. Targeted TFAP4 motif analysis in the four OCR groups is shown (bottom table; p-values were calculated by Fisher’s exact test).
(F) Venn diagram depicts the global cistromic interactions between BATF and TFAP4 in KI T cells across all conditions (tNGFR, TFAP4, BATF, BATF-TFAP4). Cistrome comprises all detected genome sites bound by BATF and/or TFAP4 as assessed by ChIP-seq. FDR < 0.05, log2FC ≥ 0.5.
(G) Tornado plots depict ATAC-seq read distribution at TFAP4 KI-induced OCRs in a +/− 1kb window around the summits of ATAC-seq peaks in the indicated conditions (related to metagene plot in Figure 7K).
(H) Tornado plots depict TFAP4 ChIP-seq read distribution at BATF KI-induced OCRs in a +/− 1kb window around the summits of ATAC-seq peaks in the indicated conditions (related to metagene plot in Figure 7L).
(I) Genome browser examples with ChIP-seq, ATAC-seq, and RNA-seq tracks at genomic loci where TFAP4 KI and BATF KI induce gene expression and chromatin accessibility (in the highlighted genomic regions - light blue), and BATF KI facilitates the binding of TFAP4. Gene examples (IL12A, IL5, and SLC7A11) are derived from Group II genes from Figure 7F.
Panels A-B include data on TFAP4 vs tNGFR single KI HA-GD2-28z CARs. Panel F summarizes data from all ChIP-seq conditions (TFAP4, BATF, tNGFR HA-GD2-28z CAR single KIs and BATF-TFAP4 HA-GD2-28z CAR combinatorial KIs). Panels E, G and I include RNA-seq and/or ATAC-seq from RFP-tNGFR (labeled as tNGFR), BATF-RFP (labeled as BATF), RFP-TFAP4 (labeled as TFAP4) and BATF-TFAP4 HA-GD2-28z CARs. Panel H shows ChIP-seq data from TFAP4, BATF and tNGFR single KI HA-GD2-28z CARs and BATF-TFAP4 combinatorial KI HA-GD2-28z CARs.
Table S1. DNA Sequences
(A) TF Library DNA Sequences. DNA sequences of the 100-member TF library including adaptor sequences and information on known functionality in T cells.
(B) SR Library DNA Sequences. DNA sequences of the 129-member SR library including adaptor sequences and information on switch receptor design.
(C) TFxTF Library DNA Sequences. DNA sequences of the combinatorial TFxTF library including adaptor sequences.
(D) Primer Sequences. Cloning and sequencing primers used in this study.
(E) TCR and CAR Sequences. Sequences of the NY-ESO-1 TCR, CD19-BBz CAR, CD19-28z CAR and HA-GD2-28z CAR used in this study.
Table S2. Screening Data
(A) TF Library Screening Data. Log2FC screening data of the TF library across TCR/CAR specificities and challenge modules.
(B) SR Library Screening Data. Log2FC screening data of the SR library across TCR/CAR specificities and challenge modules.
(C) ModPoKI-Seq Screen Data. Enrichment of the different NY-ESO-1 TCR KI constructs across the 14 clusters shown in Figure S7D.
(D) TFxTF Library Screening Data. Log2FC screening data of the TFxTF library in the HA-GD2-28z CAR tonic signaling screen.
Highlights:
Pooled knockin of hundreds of TFs/surface receptors combined with different TCRs/CARs
Chronic stimulation screens discover programs to improve T-cell persistence
Combinatorial knockin screens with ~10,000 transcription factor combinations
BATF-TFAP4 dual knockin construct improves CAR T-cell fitness and function
ACKNOWLEDGMENTS
We thank all members of the Marson Lab; Chris Jeans (QB3 MacroLab); Vinh Nguyen; Camillia Azimi, Jacob W. Freimer, Maya Acre, Mineto Ota, Zachary Steinhart, Brian Shy, Vivasvan Vykunta and Sebastian Blaeschke for helpful suggestions; Stacie Dodgson for critical input; Sarah Pyle for illustrations; Jennifer Okano, Jackie Sawin, Jon Woo and Ron Manlapaz for generous assistance; UCSF Parnassus Flow CoLab (RRID:SCR_018206, DRC Center Grant NIH P30 DK063720, NIH S10 1S10OD021822-01); Gladstone Flow Core (NIH S10 RR028962, James B. Pendleton Charitable Trust, DARPA); LARC, QB3 Genomics (UC Berkeley) RRID:SCR_022170, UCSF CAT (UCSF PBBR, RRP IMIA, and NIH 1S10OD028511-01); Crystal Mackall and Robbie Majzner for HA-GD2-28z sequences, Nalm-6/GFP/Luc/GD2 and retroviral plasmids; Takeshi Egawa for providing TFAP4 antibody. T.L.R. was supported by the UCSF Medical Scientist Training Program (T32GM007618), UCSF Endocrinology Training Grant (T32 DK007418), and the NIDDK (F30DK120213). T.N.Y was supported by the NIH Institutional Research Service Award in Molecular and Cellular Mechanisms in Cancer under NCI Training Grant 5T32CA108462. J.C. was supported by NIH/NCI K08, 1K08CA252605-01, a Burroughs Wellcome Fund Career Award for Medical Scientists, and the Lydia Preisler Shorenstein Donor Advised Fund. F.B. was supported by the Care-for-Rare Foundation, the German Research Foundation (DFG) and the Emerging Investigators EHA-EBMT Joint Fellowship Award in the Field of Cell Therapy and Immunotherapy (EBMT, EHA, Gilead and Kite). T.F. was supported by the German Research Foundation (DFG) –SFB-TRR338/1 2021 –452881907. A.T.S. was supported by a Career Award for Medical Scientists (Burroughs Wellcome Fund), a Lloyd J. Old STAR Award (Cancer Research Institute), a Pew-Stewart Scholars in Cancer Research Award, and the Parker Institute for Cancer Immunotherapy. A.M. received funding from the Simons Foundation, Career Award for Medical Scientists, a Lloyd J. Old STAR Award (Cancer Research Institute), Parker Institute for Cancer Immunotherapy, Innovative Genomics Institute, National Institutes of Health grants P30 DK063720 and S10 1S10OD021822-01 (both Parnassus Flow Cytometry Core, A.M.). A.M. was an investigator at Chan Zuckerberg Biohub and received gifts from the Byers family, Barbara Bakar, Karen Jordan and Elena Radutzky. R.S. was supported by the Austrian Exchange Service, Austrian Society of Laboratory Medicine and the Max Kade Foundation. This work was supported by National Institutes of Health grant S10 RR028962 and NCI grant 1R01CA276368-01, the Parker Institute for Cancer Immunotherapy, the Cancer League and the James B. Pendleton Charitable Trust.
DECLARATION OF INTERESTS
F.B. received research awards (Gilead and Kite and Bristol Myers Squibb Foundation Immunonkologie). E.S. was an advisor for Arsenal Biosciences. J.E. is a compensated co-founder at Mnemo Therapeutics and compensated scientific advisor to Cytovia Therapeutics. J.E owns stocks in Mnemo Therapeutica and Cytovia Therapeutics. J.E. has received a consulting fee from Casdin Capital. The Eyquem lab has received research support from Cytovia Therapeutic and Takeda. T.L.R is a compensated co-founder, member of the scientific advisory board, and previously worked as the CSO of Arsenal Biosciences. A.T.S. is a founder of Immunai and Cartography Biosciences and receives research funding from Allogene Therapeutics and Merck Research Laboratories. C.T.M. is a compensated Bio+Health Venture Fellow at Andreessen Horowitz. A.M. is a co-founder of Arsenal Biosciences, Spotlight Therapeutics, and Survey Genomics, serves on the boards of directors at Spotlight Therapeutics and Survey Genomics, is a board observer (and former member of the board of directors) at Arsenal Biosciences, is a member of the scientific advisory boards of Arsenal Biosciences, Spotlight Therapeutics, Survey Genomics, NewLimit, Amgen, Tenaya, and Lightcast, owns stock in Arsenal Biosciences, Spotlight Therapeutics, NewLimit, Survey Genomics, PACT Pharma, Tenaya, and Lightcast and has received fees from Arsenal Biosciences, Spotlight Therapeutics, Survey Genomics, NewLimit, 23andMe, PACT Pharma, Juno Therapeutics, Tenaya, Lightcast, GLG, Gilead, Trizell, Vertex, Merck, Amgen, Genentech, AlphaSights, Rupert Case Management, Bernstein, and ALDA. A.M. is an investor in and informal advisor to Offline Ventures and a client of EPIQ. The Marson laboratory received research support from Juno Therapeutics, Epinomics, Sanofi, GlaxoSmithKline, Gilead and Anthem. T.L.R., F.B., A.M., R.A., Y.C., C.M. and E.S. are listed on patent applications related to this work.
Inclusion and Diversity
We support inclusive, diverse, and equitable conduct of research.
Footnotes
Publisher's Disclaimer: This is a PDF file of an unedited manuscript that has been accepted for publication. As a service to our customers we are providing this early version of the manuscript. The manuscript will undergo copyediting, typesetting, and review of the resulting proof before it is published in its final form. Please note that during the production process errors may be discovered which could affect the content, and all legal disclaimers that apply to the journal pertain.
REFERENCES
- 1.Esensten JH, Bluestone JA, and Lim WA (2017). Engineering Therapeutic T Cells: From Synthetic Biology to Clinical Trials. Annu Rev Pathol 12, 305–330. 10.1146/annurev-pathol-052016-100304. [DOI] [PMC free article] [PubMed] [Google Scholar]
- 2.Fesnak AD, June CH, and Levine BL (2016). Engineered T cells: the promise and challenges of cancer immunotherapy. Nat Rev Cancer 16, 566–581. 10.1038/nrc.2016.97. [DOI] [PMC free article] [PubMed] [Google Scholar]
- 3.June CH, and Sadelain M (2018). Chimeric Antigen Receptor Therapy. N Engl J Med 379, 64–73. 10.1056/NEJMra1706169. [DOI] [PMC free article] [PubMed] [Google Scholar]
- 4.Delgoffe GM, Xu C, Mackall CL, Green MR, Gottschalk S, Speiser DE, Zehn D, and Beavis PA (2021). The role of exhaustion in CAR T cell therapy. Cancer Cell 39, 885–888. 10.1016/j.ccell.2021.06.012. [DOI] [PubMed] [Google Scholar]
- 5.Schietinger A, Delrow JJ, Basom RS, Blattman JN, and Greenberg PD (2012). Rescued tolerant CD8 T cells are preprogrammed to reestablish the tolerant state. Science 335, 723–727. 10.1126/science.1214277. [DOI] [PMC free article] [PubMed] [Google Scholar]
- 6.Doering TA, Crawford A, Angelosanto JM, Paley MA, Ziegler CG, and Wherry EJ (2012). Network analysis reveals centrally connected genes and pathways involved in CD8+ T cell exhaustion versus memory. Immunity 37, 1130–1144. 10.1016/j.immuni.2012.08.021. [DOI] [PMC free article] [PubMed] [Google Scholar]
- 7.Wherry EJ, and Kurachi M (2015). Molecular and cellular insights into T cell exhaustion. Nat Rev Immunol 15, 486–499. 10.1038/nri3862. [DOI] [PMC free article] [PubMed] [Google Scholar]
- 8.Man K, Gabriel SS, Liao Y, Gloury R, Preston S, Henstridge DC, Pellegrini M, Zehn D, Berberich-Siebelt F, Febbraio MA, et al. (2017). Transcription Factor IRF4 Promotes CD8(+) T Cell Exhaustion and Limits the Development of Memory-like T Cells during Chronic Infection. Immunity 47, 1129–1141 e1125. 10.1016/j.immuni.2017.11.021. [DOI] [PubMed] [Google Scholar]
- 9.Martinez GJ, Pereira RM, Aijo T, Kim EY, Marangoni F, Pipkin ME, Togher S, Heissmeyer V, Zhang YC, Crotty S, et al. (2015). The transcription factor NFAT promotes exhaustion of activated CD8(+) T cells. Immunity 42, 265–278. 10.1016/j.immuni.2015.01.006. [DOI] [PMC free article] [PubMed] [Google Scholar]
- 10.Sen DR, Kaminski J, Barnitz RA, Kurachi M, Gerdemann U, Yates KB, Tsao HW, Godec J, LaFleur MW, Brown FD, et al. (2016). The epigenetic landscape of T cell exhaustion. Science 354, 1165–1169. 10.1126/science.aae0491. [DOI] [PMC free article] [PubMed] [Google Scholar]
- 11.Chen J, Lopez-Moyado IF, Seo H, Lio CJ, Hempleman LJ, Sekiya T, Yoshimura A, Scott-Browne JP, and Rao A (2019). NR4A transcription factors limit CAR T cell function in solid tumours. Nature 567, 530–534. 10.1038/s41586-019-0985-x. [DOI] [PMC free article] [PubMed] [Google Scholar]
- 12.Fraietta JA, Lacey SF, Orlando EJ, Pruteanu-Malinici I, Gohil M, Lundh S, Boesteanu AC, Wang Y, O’Connor RS, Hwang WT, et al. (2018). Determinants of response and resistance to CD19 chimeric antigen receptor (CAR) T cell therapy of chronic lymphocytic leukemia. Nat Med 24, 563–571. 10.1038/s41591-018-0010-1. [DOI] [PMC free article] [PubMed] [Google Scholar]
- 13.Eyquem J, Mansilla-Soto J, Giavridis T, van der Stegen SJ, Hamieh M, Cunanan KM, Odak A, Gonen M, and Sadelain M (2017). Targeting a CAR to the TRAC locus with CRISPR/Cas9 enhances tumour rejection. Nature 543, 113–117. 10.1038/nature21405. [DOI] [PMC free article] [PubMed] [Google Scholar]
- 14.Di Roberto RB, Castellanos-Rueda R, Schlatter FS, Palianina D, Nguyen OTP, Kapetanovic E, Hierlemann A, Khanna N, and Reddy ST (2021). speedingCARs: accelerating the engineering of CAR T cells by signaling domain shuffling and single-cell sequencing. bioRxiv. [DOI] [PMC free article] [PubMed] [Google Scholar]
- 15.Goodman DB, Azimi CS, Kearns K, Garakani K, Garcia J, Patel N, Hwang B, Lee D, Park E, Ye CJ, et al. (2021). Pooled screening of CAR T cells identifies non-native signaling domains for next-generation immunotherapies. bioRxiv. [DOI] [PMC free article] [PubMed] [Google Scholar]
- 16.Kyung T, Gordon KS, Perez CR, Holec PV, Ramos A, Zhang AQ, Liu Y, Koch C, Starchenko A, Joughin B, et al. (2021). CaRPOOL: A library-based platform to rapidly identify next generation chimeric antigen receptors. bioRxiv. [Google Scholar]
- 17.Stadtmauer EA, Fraietta JA, Davis MM, Cohen AD, Weber KL, Lancaster E, Mangan PA, Kulikovskaya I, Gupta M, Chen F, et al. (2020). CRISPR-engineered T cells in patients with refractory cancer. Science 367. 10.1126/science.aba7365. [DOI] [PMC free article] [PubMed] [Google Scholar]
- 18.Zhao H, Liu Y, Wang L, Jin G, Zhao X, Xu J, Zhang G, Ma Y, Yin N, and Peng M (2021). Genome-wide fitness gene identification reveals Roquin as a potent suppressor of CD8 T cell expansion and anti-tumor immunity. Cell Rep 37, 110083. 10.1016/j.celrep.2021.110083. [DOI] [PubMed] [Google Scholar]
- 19.Wei J, Long L, Zheng W, Dhungana Y, Lim SA, Guy C, Wang Y, Wang YD, Qian C, Xu B, et al. (2019). Targeting REGNASE-1 programs long-lived effector T cells for cancer therapy. Nature 576, 471–476. 10.1038/s41586-019-1821-z. [DOI] [PMC free article] [PubMed] [Google Scholar]
- 20.Mai D, Johnson O, Reff J, Fan TJ, Scholler J, Sheppard NC, and June CH (2023). Combined disruption of T cell inflammatory regulators Regnase-1 and Roquin-1 enhances antitumor activity of engineered human T cells. Proc Natl Acad Sci U S A 120, e2218632120. 10.1073/pnas.2218632120. [DOI] [PMC free article] [PubMed] [Google Scholar]
- 21.LaFleur MW, Nguyen TH, Coxe MA, Yates KB, Trombley JD, Weiss SA, Brown FD, Gillis JE, Coxe DJ, Doench JG, et al. (2019). A CRISPR-Cas9 delivery system for in vivo screening of genes in the immune system. Nat Commun 10, 1668. 10.1038/s41467-019-09656-2. [DOI] [PMC free article] [PubMed] [Google Scholar]
- 22.Sutra Del Galy A, Menegatti S, Fuentealba J, Lucibello F, Perrin L, Helft J, Darbois A, Saitakis M, Tosello J, Rookhuizen D, et al. (2021). In vivo genome-wide CRISPR screens identify SOCS1 as intrinsic checkpoint of CD4(+) TH1 cell response. Sci Immunol 6, eabe8219. 10.1126/sciimmunol.abe8219. [DOI] [PubMed] [Google Scholar]
- 23.Carnevale J, Shifrut E, Kale N, Nyberg WA, Blaeschke F, Chen YY, Li Z, Bapat SP, Diolaiti ME, O’Leary P, et al. (2022). RASA2 ablation in T cells boosts antigen sensitivity and long-term function. Nature 609, 174–182. 10.1038/s41586-022-05126-w. [DOI] [PMC free article] [PubMed] [Google Scholar]
- 24.Shifrut E, Carnevale J, Tobin V, Roth TL, Woo JM, Bui CT, Li PJ, Diolaiti ME, Ashworth A, and Marson A (2018). Genome-wide CRISPR Screens in Primary Human T Cells Reveal Key Regulators of Immune Function. Cell 175, 1958–1971 e1915. 10.1016/j.cell.2018.10.024. [DOI] [PMC free article] [PubMed] [Google Scholar]
- 25.Schmidt R, Steinhart Z, Layeghi M, Freimer JW, Bueno R, Nguyen VQ, Blaeschke F, Ye CJ, and Marson A (2022). CRISPR activation and interference screens decode stimulation responses in primary human T cells. Science 375, eabj4008. 10.1126/science.abj4008. [DOI] [PMC free article] [PubMed] [Google Scholar]
- 26.Legut M, Gajic Z, Guarino M, Daniloski Z, Rahman JA, Xue X, Lu C, Lu L, Mimitou EP, Hao S, et al. (2022). A genome-scale screen for synthetic drivers of T cell proliferation. Nature 603, 728–735. 10.1038/s41586-022-04494-7. [DOI] [PMC free article] [PubMed] [Google Scholar]
- 27.Seo H, Gonzalez-Avalos E, Zhang W, Ramchandani P, Yang C, Lio CJ, Rao A, and Hogan PG (2021). BATF and IRF4 cooperate to counter exhaustion in tumor-infiltrating CAR T cells. Nat Immunol 22, 983–995. 10.1038/s41590-021-00964-8. [DOI] [PMC free article] [PubMed] [Google Scholar]
- 28.Lynn RC, Weber EW, Sotillo E, Gennert D, Xu P, Good Z, Anbunathan H, Lattin J, Jones R, Tieu V, et al. (2019). c-Jun overexpression in CAR T cells induces exhaustion resistance. Nature 576, 293–300. 10.1038/s41586-019-1805-z. [DOI] [PMC free article] [PubMed] [Google Scholar]
- 29.Blaeschke F, Stenger D, Apfelbeck A, Cadilha BL, Benmebarek MR, Mahdawi J, Ortner E, Lepenies M, Habjan N, Rataj F, et al. (2021). Augmenting anti-CD19 and anti-CD22 CAR T-cell function using PD-1-CD28 checkpoint fusion proteins. Blood Cancer J 11, 108. 10.1038/s41408-021-00499-z. [DOI] [PMC free article] [PubMed] [Google Scholar]
- 30.Liu H, Lei W, Zhang C, Yang C, Wei J, Guo Q, Guo X, Chen Z, Lu Y, Young KH, et al. (2021). CD19-specific Car T Cells that Express a PD-1/CD28 Chimeric Switch-Receptor are Effective in Patients with PD-L1-positive B-Cell Lymphoma. Clin Cancer Res 27, 473–484. 10.1158/1078-0432.CCR-20-1457. [DOI] [PubMed] [Google Scholar]
- 31.Liu X, Ranganathan R, Jiang S, Fang C, Sun J, Kim S, Newick K, Lo A, June CH, Zhao Y, and Moon EK (2016). A Chimeric Switch-Receptor Targeting PD1 Augments the Efficacy of Second-Generation CAR T Cells in Advanced Solid Tumors. Cancer Res 76, 1578–1590. 10.1158/0008-5472.CAN-15-2524. [DOI] [PMC free article] [PubMed] [Google Scholar]
- 32.Oda SK, Daman AW, Garcia NM, Wagener F, Schmitt TM, Tan X, Chapuis AG, and Greenberg PD (2017). A CD200R-CD28 fusion protein appropriates an inhibitory signal to enhance T-cell function and therapy of murine leukemia. Blood 130, 2410–2419. 10.1182/blood-2017-04-777052. [DOI] [PMC free article] [PubMed] [Google Scholar]
- 33.Zhao S, Wang C, Lu P, Lou Y, Liu H, Wang T, Yang S, Bao Z, Han L, Liang X, et al. (2021). Switch receptor T3/28 improves long-term persistence and antitumor efficacy of CAR-T cells. J Immunother Cancer 9. 10.1136/jitc-2021-003176. [DOI] [PMC free article] [PubMed] [Google Scholar]
- 34.Sack LM, Davoli T, Xu Q, Li MZ, and Elledge SJ (2016). Sources of Error in Mammalian Genetic Screens. G3 (Bethesda) 6, 2781–2790. 10.1534/g3.116.030973. [DOI] [PMC free article] [PubMed] [Google Scholar]
- 35.Fraietta JA, Nobles CL, Sammons MA, Lundh S, Carty SA, Reich TJ, Cogdill AP, Morrissette JJD, DeNizio JE, Reddy S, et al. (2018). Disruption of TET2 promotes the therapeutic efficacy of CD19-targeted T cells. Nature 558, 307–312. 10.1038/s41586-018-0178-z. [DOI] [PMC free article] [PubMed] [Google Scholar]
- 36.Cavazzana-Calvo M, Payen E, Negre O, Wang G, Hehir K, Fusil F, Down J, Denaro M, Brady T, Westerman K, et al. (2010). Transfusion independence and HMGA2 activation after gene therapy of human beta-thalassaemia. Nature 467, 318–322. 10.1038/nature09328. [DOI] [PMC free article] [PubMed] [Google Scholar]
- 37.Roth TL, Li PJ, Blaeschke F, Nies JF, Apathy R, Mowery C, Yu R, Nguyen MLT, Lee Y, Truong A, et al. (2020). Pooled Knockin Targeting for Genome Engineering of Cellular Immunotherapies. Cell 181, 728–744 e721. 10.1016/j.cell.2020.03.039. [DOI] [PMC free article] [PubMed] [Google Scholar]
- 38.Roth TL, Puig-Saus C, Yu R, Shifrut E, Carnevale J, Li PJ, Hiatt J, Saco J, Krystofinski P, Li H, et al. (2018). Reprogramming human T cell function and specificity with non-viral genome targeting. Nature 559, 405–409. 10.1038/s41586-018-0326-5. [DOI] [PMC free article] [PubMed] [Google Scholar]
- 39.Nguyen DN, Roth TL, Li PJ, Chen PA, Apathy R, Mamedov MR, Vo LT, Tobin VR, Goodman D, Shifrut E, et al. (2020). Polymer-stabilized Cas9 nanoparticles and modified repair templates increase genome editing efficiency. Nat Biotechnol 38, 44–49. 10.1038/s41587-019-0325-6. [DOI] [PMC free article] [PubMed] [Google Scholar]
- 40.Hanna RE, and Doench JG (2018). A case of mistaken identity. Nat Biotechnol 36, 802–804. 10.1038/nbt.4208. [DOI] [PubMed] [Google Scholar]
- 41.Fang J, Qian JJ, Yi S, Harding TC, Tu GH, VanRoey M, and Jooss K (2005). Stable antibody expression at therapeutic levels using the 2A peptide. Nat Biotechnol 23, 584–590. 10.1038/nbt1087. [DOI] [PubMed] [Google Scholar]
- 42.Fang J, Yi S, Simmons A, Tu GH, Nguyen M, Harding TC, VanRoey M, and Jooss K (2007). An antibody delivery system for regulated expression of therapeutic levels of monoclonal antibodies in vivo. Mol Ther 15, 1153–1159. 10.1038/sj.mt.6300142. [DOI] [PubMed] [Google Scholar]
- 43.Robbins PF, Li YF, El-Gamil M, Zhao Y, Wargo JA, Zheng Z, Xu H, Morgan RA, Feldman SA, Johnson LA, et al. (2008). Single and dual amino acid substitutions in TCR CDRs can enhance antigen-specific T cell functions. J Immunol 180, 6116–6131. 10.4049/jimmunol.180.9.6116. [DOI] [PMC free article] [PubMed] [Google Scholar]
- 44.Pearce EL, Mullen AC, Martins GA, Krawczyk CM, Hutchins AS, Zediak VP, Banica M, DiCioccio CB, Gross DA, Mao CA, et al. (2003). Control of effector CD8+ T cell function by the transcription factor Eomesodermin. Science 302, 1041–1043. 10.1126/science.1090148. [DOI] [PubMed] [Google Scholar]
- 45.Li J, He Y, Hao J, Ni L, and Dong C (2018). High Levels of Eomes Promote Exhaustion of Anti-tumor CD8(+) T Cells. Front Immunol 9, 2981. 10.3389/fimmu.2018.02981. [DOI] [PMC free article] [PubMed] [Google Scholar]
- 46.Park HB, Lee JE, Oh YM, Lee SJ, Eom HS, and Choi K (2017). CTLA4-CD28 chimera gene modification of T cells enhances the therapeutic efficacy of donor lymphocyte infusion for hematological malignancy. Exp Mol Med 49, e360. 10.1038/emm.2017.104. [DOI] [PMC free article] [PubMed] [Google Scholar]
- 47.Shin JH, Park HB, Oh YM, Lim DP, Lee JE, Seo HH, Lee SJ, Eom HS, Kim IH, Lee SH, and Choi K (2012). Positive conversion of negative signaling of CTLA4 potentiates antitumor efficacy of adoptive T-cell therapy in murine tumor models. Blood 119, 5678–5687. 10.1182/blood-2011-09-380519. [DOI] [PubMed] [Google Scholar]
- 48.Anderson AC, Joller N, and Kuchroo VK (2016). Lag-3, Tim-3, and TIGIT: Co-inhibitory Receptors with Specialized Functions in Immune Regulation. Immunity 44, 989–1004. 10.1016/j.immuni.2016.05.001. [DOI] [PMC free article] [PubMed] [Google Scholar]
- 49.Gupta PK, Godec J, Wolski D, Adland E, Yates K, Pauken KE, Cosgrove C, Ledderose C, Junger WG, Robson SC, et al. (2015). CD39 Expression Identifies Terminally Exhausted CD8+ T Cells. PLoS Pathog 11, e1005177. 10.1371/journal.ppat.1005177. [DOI] [PMC free article] [PubMed] [Google Scholar]
- 50.Khan O, Giles JR, McDonald S, Manne S, Ngiow SF, Patel KP, Werner MT, Huang AC, Alexander KA, Wu JE, et al. (2019). TOX transcriptionally and epigenetically programs CD8(+) T cell exhaustion. Nature 571, 211–218. 10.1038/s41586-019-1325-x. [DOI] [PMC free article] [PubMed] [Google Scholar]
- 51.Scott AC, Dundar F, Zumbo P, Chandran SS, Klebanoff CA, Shakiba M, Trivedi P, Menocal L, Appleby H, Camara S, et al. (2019). TOX is a critical regulator of tumour-specific T cell differentiation. Nature 571, 270–274. 10.1038/s41586-019-1324-y. [DOI] [PMC free article] [PubMed] [Google Scholar]
- 52.Alfei F, Kanev K, Hofmann M, Wu M, Ghoneim HE, Roelli P, Utzschneider DT, von Hoesslin M, Cullen JG, Fan Y, et al. (2019). TOX reinforces the phenotype and longevity of exhausted T cells in chronic viral infection. Nature 571, 265–269. 10.1038/s41586-019-1326-9. [DOI] [PubMed] [Google Scholar]
- 53.Chou C, Pinto AK, Curtis JD, Persaud SP, Cella M, Lin CC, Edelson BT, Allen PM, Colonna M, Pearce EL, et al. (2014). c-Myc-induced transcription factor AP4 is required for host protection mediated by CD8+ T cells. Nat Immunol 15, 884–893. 10.1038/ni.2943. [DOI] [PMC free article] [PubMed] [Google Scholar]
- 54.Long AH, Haso WM, Shern JF, Wanhainen KM, Murgai M, Ingaramo M, Smith JP, Walker AJ, Kohler ME, Venkateshwara VR, et al. (2015). 4-1BB costimulation ameliorates T cell exhaustion induced by tonic signaling of chimeric antigen receptors. Nat Med 21, 581–590. 10.1038/nm.3838. [DOI] [PMC free article] [PubMed] [Google Scholar]
- 55.Jung P, Menssen A, Mayr D, and Hermeking H (2008). AP4 encodes a c-MYC-inducible repressor of p21. Proc Natl Acad Sci U S A 105, 15046–15051. 10.1073/pnas.0801773105. [DOI] [PMC free article] [PubMed] [Google Scholar]
- 56.Hosokawa H, and Rothenberg EV (2021). How transcription factors drive choice of the T cell fate. Nat Rev Immunol 21, 162–176. 10.1038/s41577-020-00426-6. [DOI] [PMC free article] [PubMed] [Google Scholar]
- 57.Yang W, Bai Y, Xiong Y, Zhang J, Chen S, Zheng X, Meng X, Li L, Wang J, Xu C, et al. (2016). Potentiating the antitumour response of CD8(+) T cells by modulating cholesterol metabolism. Nature 531, 651–655. 10.1038/nature17412. [DOI] [PMC free article] [PubMed] [Google Scholar]
- 58.Schober K, Muller TR, Gokmen F, Grassmann S, Effenberger M, Poltorak M, Stemberger C, Schumann K, Roth TL, Marson A, and Busch DH (2019). Orthotopic replacement of T-cell receptor alpha- and beta-chains with preservation of near-physiological T-cell function. Nat Biomed Eng 3, 974–984. 10.1038/s41551-019-0409-0. [DOI] [PubMed] [Google Scholar]
- 59.Shy BR, Vykunta VS, Ha A, Talbot A, Roth TL, Nguyen DN, Pfeifer WG, Chen Y, Blaeschke F, Shifrut E, et al. (2022). High-yield genome engineering in primary cells using a hybrid ssDNA repair template and small-molecule cocktails. Nat Biotechnol. [DOI] [PMC free article] [PubMed] [Google Scholar]
- 60.Foy SP, Jacoby K, Bota DA, Hunter T, Pan Z, Stawiski E, Ma Y, Lu W, Peng S , Wang CL, et al. (2023). Non-viral precision T cell receptor replacement for personalized cell therapy. Nature 615, 687–696. 10.1038/s41586-022-05531-1. [DOI] [PMC free article] [PubMed] [Google Scholar]
- 61.Zhang J, Hu Y, Yang J, Li W, Zhang M, Wang Q, Zhang L, Wei G, Tian Y, Zhao K, et al. (2022). Non-viral, specifically targeted CAR-T cells achieve high safety and efficacy in B-NHL. Nature 609, 369–374. 10.1038/s41586-022-05140-y. [DOI] [PMC free article] [PubMed] [Google Scholar]
- 62.Zou Y, Liu B, Li L, Yin Q, Tang J, Jing Z, Huang X, Zhu X, and Chi T (2022). IKZF3 deficiency potentiates chimeric antigen receptor T cells targeting solid tumors. Cancer Lett 524, 121–130. 10.1016/j.canlet.2021.10.016. [DOI] [PubMed] [Google Scholar]
- 63.Liu X, Wang Y, Lu H, Li J, Yan X, Xiao M, Hao J, Alekseev A, Khong H, Chen T , et al. (2019). Genome-wide analysis identifies NR4A1 as a key mediator of T cell dysfunction. Nature 567, 525–529. 10.1038/s41586-019-0979-8. [DOI] [PMC free article] [PubMed] [Google Scholar]
- 64.Prinzing B, Zebley CC, Petersen CT, Fan Y, Anido AA, Yi Z, Nguyen P, Houke H, Bell M, Haydar D, et al. (2021). Deleting DNMT3A in CAR T cells prevents exhaustion and enhances antitumor activity. Sci Transl Med 13, eabh0272. 10.1126/scitranslmed.abh0272. [DOI] [PMC free article] [PubMed] [Google Scholar]
- 65.Jain N, Zhao Z, Feucht J, Koche R, Iyer A, Dobrin A, Mansilla-Soto J, Yang J, Zhan Y, Lopez M, et al. (2023). TET2 guards against unchecked BATF3-induced CAR T cell expansion. Nature 615, 315–322. 10.1038/s41586-022-05692-z. [DOI] [PMC free article] [PubMed] [Google Scholar]
- 66.Nahmad AD, Reuveni E, Goldschmidt E, Tenne T, Liberman M, Horovitz-Fried M, Khosravi R, Kobo H, Reinstein E, Madi A, et al. (2022). Frequent aneuploidy in primary human T cells after CRISPR-Cas9 cleavage. Nat Biotechnol 40, 1807–1813. 10.1038/s41587-022-01377-0. [DOI] [PMC free article] [PubMed] [Google Scholar]
- 67.Hyrenius-Wittsten A, Su Y, Park M, Garcia JM, Alavi J, Perry N, Montgomery G, Liu B, and Roybal KT (2021). SynNotch CAR circuits enhance solid tumor recognition and promote persistent antitumor activity in mouse models. Sci Transl Med 13. 10.1126/scitranslmed.abd8836. [DOI] [PMC free article] [PubMed] [Google Scholar]
- 68.Zhu I, Liu R, Garcia JM, Hyrenius-Wittsten A, Piraner DI, Alavi J, Israni DV, Liu B, Khalil AS, and Roybal KT (2022). Modular design of synthetic receptors for programmed gene regulation in cell therapies. Cell 185, 1431–1443 e1416. 10.1016/j.cell.2022.03.023. [DOI] [PMC free article] [PubMed] [Google Scholar]
- 69.Brandt LJB, Barnkob MB, Michaels YS, Heiselberg J, and Barington T (2020). Emerging Approaches for Regulation and Control of CAR T Cells: A Mini Review. Front Immunol 11, 326. 10.3389/fimmu.2020.00326. [DOI] [PMC free article] [PubMed] [Google Scholar]
- 70.Mansilla-Soto J, Eyquem J, Haubner S, Hamieh M, Feucht J, Paillon N, Zucchetti AE, Li Z, Sjostrand M, Lindenbergh PL, et al. (2022). HLA-independent T cell receptors for targeting tumors with low antigen density. Nat Med 28, 345–352. 10.1038/s41591-021-01621-1. [DOI] [PMC free article] [PubMed] [Google Scholar]
- 71.Liu Y, Liu G, Wang J, Zheng ZY, Jia L, Rui W, Huang D, Zhou ZX, Zhou L, Wu X, et al. (2021). Chimeric STAR receptors using TCR machinery mediate robust responses against solid tumors. Sci Transl Med 13. 10.1126/scitranslmed.abb5191. [DOI] [PubMed] [Google Scholar]
- 72.Nyberg WA, Ark J, To A, Clouden S, Reeder G, Muldoon JJ, Chung JY, Xie WH, Allain V, Steinhart Z, et al. (2023). An evolved AAV variant enables efficient genetic engineering of murine T cells. Cell 186, 446–460 e419. 10.1016/j.cell.2022.12.022. [DOI] [PMC free article] [PubMed] [Google Scholar]
- 73.Watanabe N, Bajgain P, Sukumaran S, Ansari S, Heslop HE, Rooney CM, Brenner MK, Leen AM, and Vera JF (2016). Fine-tuning the CAR spacer improves T-cell potency. Oncoimmunology 5, e1253656. 10.1080/2162402X.2016.1253656. [DOI] [PMC free article] [PubMed] [Google Scholar]
- 74.Daniel B, Balint BL, Nagy ZS, and Nagy L (2014). Mapping the genomic binding sites of the activated retinoid X receptor in murine bone marrow-derived macrophages using chromatin immunoprecipitation sequencing. Methods Mol Biol 1204, 15–24. 10.1007/978-1-4939-1346-6_2. [DOI] [PubMed] [Google Scholar]
- 75.Egawa T, and Littman DR (2011). Transcription factor AP4 modulates reversible and epigenetic silencing of the Cd4 gene. Proc Natl Acad Sci U S A 108, 14873–14878. 10.1073/pnas.1112293108. [DOI] [PMC free article] [PubMed] [Google Scholar]
- 76.Butler A, Hoffman P, Smibert P, Papalexi E, and Satija R (2018). Integrating single-cell transcriptomic data across different conditions, technologies, and species. Nat Biotechnol 36, 411–420. 10.1038/nbt.4096. [DOI] [PMC free article] [PubMed] [Google Scholar]
Associated Data
This section collects any data citations, data availability statements, or supplementary materials included in this article.
Supplementary Materials
Figure S1. Design and Quality Control Metrics of ModPoKI Libraries, Related to Figure 1.
(A) To create flexible ModPoKI libraries of sequences that can be integrated into “a functional module” site in pooled knockin templates along with a replaceable antigen receptor in the “specificity module site,” we developed barcoded multicistronic multipurpose adaptors consisting of a 2A site in combination with a DNA barcode. Using degenerate bases, two barcodes per TF/SR member were hidden in the extended SGSG linker of both the 5’ and 3’ adaptor. The adaptors served as binding sites for the constant cloning primers during pooled library assembly and for the constant sequencing primers for barcode readout by amplicon-sequencing. In contrast to the previous PoKI approach that had a ~600bp distance between barcode and gene of interest,37 barcodes of ModPoKI constructs were designed to be in close proximity to the gene insert (20-60bp) to reduce template switching during PCR.40
(B) We synthesized (Twist Bioscience) the initial two ModPoKI libraries, consisting of 100 TFs (and related proteins) and 129 SRs plus controls in combination with the NY-ESO-1 TCR. Using the 5’ and 3’ cloning primers (ModPoKI_Cloning_Insert_forw/rev), the inserts were amplified in a pooled PCR reaction and then integrated by pooled Gibson assembly into the final plasmid backbone that contained the specificity module (e.g., CD19- or HA-GD2-28z CAR) as well as the homology arms (HAs). The 5’ homology arm contained DNA mismatches to allow amplicon-sequencing off the gDNA without sequencing the dsDNA template.37 HDR templates were generated by pooled PCR resulting in double-stranded ModPoKI HDRT (homology-directed repair template) libraries.
(C) The ModPoKI HDRT libraries were used for pooled non-viral knockin into exon 1 of the TRAC locus by ribonucleoprotein (RNP) electroporation of Cas9, a TRAC-targeting gRNA complex, and the templates. The readout of the screens was performed by either sequencing of gDNA, mRNA/cDNA or using commercially available scRNA reagents (see Methods).
(D) Exemplary flow cytometry assessment after knockin of an NY-ESO-1 TCR tNGFR construct including the barcoded multicistronic adaptor sequences into primary human T cells.
(E) Biallelic knockin rates were calculated based on the observed percentage of GFP/RFP double positive cells after knockin of a 2-member GFP/RFP library. The predicted percentage of biallelic knockins was substantially lower than in the previous PoKI approach (15.3% in ModPoKI vs 24.4% in the previous PoKI approach).37 Predicted percentage of biallelic insertions = observed % double positive cells x2. N = 2 donors.
(F) A mild negative correlation between construct size and library representation was observed in the HDR template pool (mean of n = 4 replicates shown) and of knockin reads in six human donors (day 7 after electroporation, mean is shown). Insert size refers to the number of base pairs that gets inserted into the genomic DNA (without the constructs’ homology arms). R2 was calculated using nonlinear regression (semilog line model, GraphPad Prism). 100 TF and 129 SR library members shown.
(G) Sequencing of the 3’ BC from mRNA/cDNA was highly reproducible across biological replicates (day 7 after electroporation). N = 2 donors, one per axis. R2 was calculated using nonlinear regression (log-log line model, GraphPad Prism).
(H) Correlation between gDNA and mRNA/cDNA barcode-sequencing strategies. 5’ BCs sequenced off gDNA and 3’ BCs sequenced off mRNA/cDNA from the same pooled knockin donor were well-correlated after stimulation with CD3/CD28 beads for 4 days (day 7-11 after electroporation) and after a repetitive stimulation with target cells (A375 stimulation x5 in the CD19-28z CAR model). One donor per screen is shown. Results from a second donor were also correlated (R2=0.66 and 0.76, respectively). R2 was calculated using nonlinear regression (log-log line model, GraphPad Prism). TF and SR libraries shown.
(I) A pilot library of an NY-ESO-1-specific TCR plus GFP vs RFP was pooled at the plasmid assembly stage or after separate electroporation. T cells were sorted for TCR knockin and GFP or RFP positivity and percentage of correctly assigned barcodes was determined by amplicon-sequencing (3’ barcode was sequenced off of mRNA/cDNA). Percent reads with correctly assigned barcodes in sorted populations was notably improved in the new version (ModPoKI) over PoKI37 when pooling at the assembly state. Amount of template switching was calculated for the n = 2-member library and compared to the previous version of the pooled KI platform.37 The ModPoKI platform led to 5.6x decreased observed template switching in the n = 2-member library (extrapolated data for the n > 200-member library shown in Figure 1G). Bars represent mean. N = 2 donors.
All primer sequences are listed in Table S1D.
Figure S2. Characterization of ModPoKI Libraries and Single Stimulation ModPoKI Screen Hits, Related to Figures 1–2.
(A) The TF library in combination with the NY-ESO-1 TCR specificity module was knocked into primary human T cells. Cells were sorted for NY-ESO-1 TCR expression and ModPoKI-Seq (barcode-sequencing and transcriptome-sequencing) was performed. Cell identity (based on barcode-sequencing) was well-correlated with transcript expression of the knocked in TF confirming successful knockin and overexpression on RNA level. TF constructs that were codon-optimized or showed no barcode/transcript expression were removed from the analysis. N = 2 donors.
(B) Percent of total reads of pooled knockin libraries in six human donors. TF and SR libraries were knocked in as one large library and subsequently computationally separated into individual libraries for analysis. Construct barcodes were consistently well-represented with even library distribution.
(C) Endogenous expression of the TF library members based on published RNA-seq data (DICE dataset, https://dice-database.org/). Expression was scaled by column. SOX3 was excluded from the heatmap since it had no expression in the cell types shown according to the DICE database.
(D-G) Pooled knockin with constructs encoding the TF or SR library in combination with the NY-ESO-1 TCR was performed in primary human T cells. Resulting cells were subjected to the screens described in Figure 2. Log2 fold change in abundance for top and bottom hits (based on excessive stimulation) across single stimulation screens is shown (normalized to abundance of GFP and RFP controls and to fit on a scale from +1 to −1). N = 6 donors. Mean + SEM shown.
Figure S3. FAS Fusion Protein Validations and Repetitive Stimulation ModPoKI Screens, Related to Figures 2–3
(A) Constructs with NY-ESO-1 TCR in combination with different FAS-containing surface receptors were knocked into T cells. FAS surface expression levels detected by flow cytometry on day 7 after electroporation revealed a broad range of expression although all tested FAS proteins had the same FAS-derived extracellular and transmembrane domains and only differed in the intracellular domain. Results from one exemplary donor out of three donors are shown.
(B) FAS fusion proteins with high expression on the cell surface tended to perform better in pooled knockin screens (NY-ESO-1 TCR single stimulation screen with Nalm-6 co-culture average log2FC vs average GeoMean FI of FAS expression in flow cytometry is shown). Data of the six FAS proteins depicted in Figure S3A are shown. N = 6 donors for screen data, n = 3 donors for flow data. Nonlinear regression (line model) was performed (GraphPad Prism).
(C) SR constructs in combination with the NY-ESO-1 TCR were knocked into T cells. T cells were sorted and co-cultured with NY-ESO-1-expressing Nalm-6 target cells at a 1:1 E:T ratio for 24 hours. Intracellular cytokine stain was performed 4 hours after BrefeldinA addition. N = 3 donors in technical duplicates. Mean + SEM is shown. RM one-way ANOVA (vs tNGFR) with Geisser-Greenhouse correction and Holm Sidak’s test was performed (GraphPad Prism).
(D) Interferon-gamma (IFN-g) and Granzyme B concentrations in co-culture supernatants derived from the co-cultures described in panel C were analyzed using LEGENDplex Human CD8/NK Panel. N = 3 donors in technical duplicates. Mean + SEM is shown. RM one-way ANOVA (vs tNGFR) with Geisser-Greenhouse correction and with Holm Sidak’s test was performed (GraphPad Prism).
(E) SR constructs in combination with the NY-ESO-1 TCR were knocked into T cells. T cells were sorted and co-cultured with RFP- and NY-ESO-1-expressing Nalm-6 target cells at a 1:4 E:T ratio. Killing was evaluated using Incucyte analysis. N = 3 donors in technical triplicates. Mean + SEM is shown. Significance at the last imaging timepoint is shown. Two-way ANOVA with Holm Sidak’s test was performed to determine statistical significance as described in the Methods.
(F) The NY-ESO-1 TCR in combination with tNGFR was knocked into T cells. Surface expression of FASL, LIGHT (LTBR ligand), CD80 and CD86 (CD28 and CTLA-4 ligands) was evaluated on T cells with and without 24 hours of CD3/CD28 stimulation (1:1 cells:bead ratio vs 1:5 cells:bead ratio) using flow cytometry. N = 2 donors in technical duplicates. Mean + SEM is shown.
(G) FAS (CD95) and FASL surface expression was analyzed on A375 melanoma and Nalm-6 leukemia cells (left panel) and on tNGFR NY-ESO-1 TCR KI T cells co-cultured with A375 melanoma cells or Nalm-6 leukemia cells for 24 hours (right panel). Technical duplicates (left panel) and N = 3 donors in technical duplicates (right panel), one exemplary donor/measurement shown, respectively.
(H) Control T cells (NY-ESO-1 TCR plus tNGFR) were subjected to the repetitive stimulation screen described in Figure 3A. Knockin percentage (NGFR+) was determined by flow cytometry during the course of the assay and compared to T cells without re-stimulation. N = 2 donors in technical triplicates. Mean + SEM is shown.
(I) Surface expression of inhibitory molecules LAG-3, PD-1, TIM-3 and CD39 was analyzed by flow cytometry through the course of the repetitive stimulation assay. N = 2 donors in technical triplicates for LAG-3, PD-1 and TIM-3. N = 4 donors in technical duplicates for CD39. Mean + SEM shown.
(J) Control T cells (NY-ESO-1 TCR or CD19-BBz CAR plus tNGFR) were generated and bulk RNA-seq analysis was performed at every timepoint of the repetitive stimulation assay as previously reported (GSE204862).23 Principal component analysis is shown. N = 3 donors.
(K) Bulk RNA-seq (GSE204862)23 revealed progressive induction of CD69 during the repetitive stimulation assay while IL2RA and TNFRSF9 expression peaked relatively early and then decreased. N = 3 donors. Mean + SEM shown.
(L) A variety of other transcript markers of T-cell phenotype, effector function and T-cell dysfunction were analyzed in RNA-seq data and compared between CAR and TCR control T cells (GSE204862)23. N = 3 donors. Mean + SEM shown.
(M) The TF and SR libraries were knocked into primary human T cells in combination with the NY-ESO-1 TCR and subjected to the repetitive stimulation assay. Mean log2FC (output vs input) is shown. N = 4 donors. Top and bottom 30 of 231 constructs are shown.
(N) Relationship between insert size and repetitive screening result (log2FC of 5th stim vs input abundance in NY-ESO-1 TCR repetitive stimulation screen). Indicated insert size does not include homology arms. Nonlinear regression (line model) was performed (GraphPad Prism). N = 4 donors.
Figure S4. Repetitive Stimulation ModPoKI-Seq Screening Data, Related to Figure 3
(A) The 100-member TF library was knocked into primary human T cells from n = 2 donors in combination with the NY-ESO-1 TCR. ModPoKI-Seq (single-cell transcriptome coupled with KI barcode-sequencing) was performed. Heatmap shows differentially expressed genes (stim 5 vs stim 1) of the different knockins (threshold >30 cells per knockin after 5 stimulations).
(B) Log2FC bins were generated based on abundance log2FC in the bulk NY-ESO-1 TCR repetitive stimulation fitness screen and compared to the correlation in gene expression with controls (RFP/GFP) in ModPoKI-Seq. Best-performing knockins in fitness screens showed highest correlation coefficients with controls. N = 2 donors for ModPoKI-Seq screen, n = 4 donors for bulk fitness screen.
(C) Correlation between cluster enrichment in ModPoKI-Seq (threshold >30 cells per knockin after 5 stimulations) and abundance log2FC in bulk repetitive TCR stimulation fitness screens revealed highest correlation score for enrichment in the CD8 proliferating cluster 9. N = 2 donors for ModPoKI-Seq screen, n = 4 donors for bulk fitness screen.
(D) Chi-square residuals for enrichment in cluster 0-13 (threshold >30 cells/knockin after 5 stimulations) were compared to abundance log2FC in the bulk screens. N = 2 donors for ModPoKI-Seq screen, n = 4 donors for bulk abundance screen. Clusters are shown in order of correlation with abundance log2FC in bulk repetitive TCR stimulation fitness screens (see panel C).
(E) TRAC expression levels were compared across the TF library using ModPoKI-Seq screening data at input, after 1st stimulation and after 5th stimulation with target cells. Dotted line shows average TRAC expression at the respective timepoint. N = 2 donors.
(F) To validate TCR expression of key hit TFAP4 on protein level, TCRab expression of TFAP4 vs tNGFR NY-ESO-1 TCR KI T cells was analyzed by flow cytometry during the repetitive stimulation assay. Cells were gated on NY-ESO-1 multimer+/TCRab+ T cells. N = 3 donors in technical triplicates.
(G) Exemplary flow cytometry plot of the data prior to stimulation shown in panel F comparing TCRab protein expression of TFAP4 vs tNGFR KI T cells. Cells were gated on NY-ESO-1 multimer+/TCRab+ T cells.
(H) NY-ESO-1 multimer staining of TFAP4 vs tNGFR NY-ESO-1 TCR KI T cells was analyzed by flow cytometry during the repetitive stimulation assay. Cells were gated on NY-ESO-1 multimer+/TCRab+ T cells. N = 3 donors in technical triplicates.
(I) Average normalized TF expression (based on ModPoKI-Seq data) vs insert length is depicted and showed no correlation. N = 2 donors. Nonlinear regression (line model) was performed (GraphPad Prism).
Figure S5. Construction of CD19 CAR Libraries and Construct Performance in Repetitive Stimulation Screens, Related to Figure 3
(A) To generate the CD19 CAR libraries, a CAR plasmid containing the TRAC-derived homology arms, the CD19-BBz CAR (FMC63) as well as constant linkers was generated and linearized by PCR. The TFs/SRs plus constant linkers were amplified from the TCR library by PCR. The CAR backbone plus TF/SR inserts were linked using pooled Gibson assembly. Representation of different library constructs was analyzed by amplicon-sequencing of the plasmid pools, the HDR template libraries and the T-cell pool seven days after non-viral knockin (input population for the screens). Results from TF library are shown. N = 1 for CAR plasmid, n = 2 for TCR plasmid, n ≥ 3 for HDR templates and input population (individual donors). R2 was calculated using nonlinear regression (log-log line model, GraphPad Prism).
(B) Log2 fold changes in abundance were compared between the CAR and the TCR repetitive stimulation screen and showed comparable trends for most constructs. While IRF8 increased in abundance over time, JUN did not show a significant increase in abundance. Interestingly, control construct tCTLA-4 trended to increase after initial stimulations but dropped out later in the assay (in contrast to e.g., CTLA-4/CD28 fusion, see Figure 3J). N = 4 donors for TCR screens, n = 3 donors for CD19-BBz CAR screens. Mean + SEM shown.
(C) T cells were electroporated with PD-1/4-1BB or tNGFR in combination with either the NY-ESO-1 TCR, a CD19-BBz or a CD19-28z CAR. T cells were stained with CellTrace Violet and co-cultured with CD19- and NY-ESO-1-expressing A375 melanoma cells at a 1:1 E:T ratio. Evaluation was performed 72 hours later (gated on CAR+/TCRab- or NY-ESO-1 multimer+/TCRab+ T cells). N = 2 donors in technical duplicates. Statistical significance was calculated using two-way ANOVA with Holm Sidak’s test. Mean + SEM shown.
(D) T cells were electroporated with ZSCAN18 or tNGFR in combination with either the NY-ESO-1 TCR, a CD19-BBz or a CD19-28z CAR. T cells were stained with CellTrace Violet and co-cultured with CD19- and NY-ESO-1-expressing A375 melanoma cells at a 1:1 E:T ratio. Evaluation was performed 72 hours later. N = 2 donors in technical duplicates. Statistical significance was calculated using two-way ANOVA with Holm Sidak’s test. Mean + SEM shown.
(E) T cells were electroporated with ZSCAN18 or tNGFR in combination with either the NY-ESO-1 TCR, a CD19-BBz or a CD19-28z CAR. ZSCAN18 and tNGFR KI T cells were mixed at a ~50:50 ratio and co-cultured with CD19- and NY-ESO-1-expressing A375 melanoma cells in analogy to the repetitive stimulation protocols. %tNGFR positive cells was determined before and after every repetitive stimulation step. The divergent behavior of ZSCAN18 constructs in the CD19-BBz CAR vs NY-ESO-1 TCR setting observed in the screens was confirmed in single knockin validation studies hinting at a context-dependent effect of ZSCAN18. Relative changes in abundance were calculated. N = 2 donors in technical duplicates. Mean + SEM shown.
(F) TF and SR libraries were combined with a CD19 CAR with CD28 intracellular domain (CD19-28z CAR). Single stimulation and repetitive stimulation screens with CD19-expressing A375 melanoma cells were performed, similar to the screens with the CD19-BBz CAR. Log2FC of output vs input was calculated and normalized based on controls GFP and RFP and to fit on a scale from −1 to +1. Top and bottom 50 of 231 constructs are shown. N = 3 donors for repetitive stimulation screens and n = 2 donors for single stimulation screens (due to insufficient coverage in the third donor).
(G) CD19-28z CAR repetitive stimulation screens were compared to CD19-BBz CAR and NY-ESO-1 TCR repetitive stimulation screens. TF and SR library results are shown separately. Unnormalized log2FC of representation in 5th stim vs input population is shown. N = 3 donors for CAR screens and n = 4 donors for TCR screens. In the SR library plots (third and fourth plot), exemplary 4-1BB- or CD28-containing fusion proteins in the upper left or lower right quadrant are shown to highlight the divergent behavior of the different fusion proteins in CD19-BBz vs CD19-28z models. Nonlinear regression (line model) was used to determine statistical significance (GraphPad Prism).
(H) Performance of CD28- and 4-1BB-based fusion receptors in CD19-28z and CD19-BBz CAR T-cell screens. Plot shows fusion proteins with a positive log2FC (5th stimulation vs input population) in any or both of the two screens. 4-1BB-based fusion proteins tended to perform better in CD19-28z CARs compared to CD19-BBz CARs. Statistical significance was calculated using unpaired t-test. N = 3 donors per screen, mean unnormalized log2FC is shown.
(I-J) Exemplary fusion proteins and their screen performance across five stimulations and both CAR models. Unnormalized log2FC mean + SEM shown, n = 3 donors per screen.
(K) Performance of BATF and TFAP4 KI constructs across five stimulations in the CD19-BBz and CD19-28z CAR screens. Unnormalized log2FC mean + SEM shown, n = 3 donors per screen.
Figure S6. Characteristics of Different CARs Under TRAC Promoter Control and HA-GD2-28z SR Screen with Validations, Related to Figure 4.
(A-B) RNA-seq was performed on HA-GD2-28z CAR-T cells, CD19-BBz CAR-T cells and CD19-28z CAR-T cells 6 days and 15 days after electroporation. On day 15, HA-GD2-28z CAR-T cells showed decreased levels of early T-cell differentiation/memory markers CCR7 and LEF1 and increased levels of dysfunction markers TOX, LAG3, HAVCR2 (TIM-3) and ENTPD1 (CD39). N = 3 donors. Statistical significance in B was analyzed using two-way ANOVA with Holm Sidak’s test. Mean + SEM shown.
(C) Flow cytometric analysis of HA-GD2-28z CAR+ vs bystander CAR− cells reveal elevated expression of activation markers 4-1BB, IL2RA and CD69 on CAR-T cells even in the absence of target cells 8 days after electroporation, consistent with tonic CAR signaling similar to what was previously described.28 N = 2 donors in technical triplicates. Mean + SEM shown.
(D) A ModPoKI screen with the SR library was performed in HA-GD2-28z CAR-T cells. As the HA-GD2-28z CAR provides tonic stimulation, HA-GD2-28z CAR-T cells were cultured without addition of target cells. Log2FC in abundance is shown (compared to day 4 of culture). Heatmap was normalized based on controls (RFP/GFP) and to fit on a scale from +1 to −1. Top and bottom 40 out of 131 constructs are shown. N = 4 donors.
(E) Log2 fold changes in the HA-GD2-28z CAR SR library screen are shown (no further normalization). Mean of n = 4 donors.
(F) The HA-GD2-28z CAR was knocked into human T cells in combination with either TFAP4 or a control construct (tNGFR). Cells were sorted for CAR+/TCR− cells and TFAP4 and tNGFR T cells were co-cultured at a ~50:50 ratio. Relative abundance of the NGFR+ cells was analyzed over time by flow cytometry. N = 2 donors in technical duplicates. Unpaired t-test was used to calculate statistical significance on day 8.
(G-H) To exclude that cellular effects are dependent on specific barcodes linked to KI constructs, we swapped the TFAP4 and BATF barcodes with the tNGFR barcodes. T cells were electroporated with HA-GD2-28z CAR constructs and conventional TFAP4/tNGFR sequences or TFAP4/tNGFR sequences with swapped barcodes (G). Cells were sorted and TFAP4 and tNGFR KI cells were co-cultured at a ~50:50 ratio. Relative abundance over time (tNGFR positive vs tNGFR negative cells) was analyzed and confirmed that the fitness effect of TFAP4 KI was not barcode-specific. The same analyses were done for BATF KI (H). N = 2 donors in technical triplicates.
(I) tNGFR or TFAP4 HA-GD2-28z CAR-T cells were co-cultured with GD2+ target cells (Nalm-6/GFP/Luc/GD2) at various effector:target (E:T) ratios. Number of remaining target cells was calculated using the Incucyte system. N = 2 donors in technical triplicates. Two-way ANOVA was used to calculate statistical significance including Holm-Sidak’s test as described in the Methods. Significance at last timepoint (132 hours) shown. Mean + SEM shown. Left panel shows 1:10 E:T ratio. Only significance between TFAP4 vs tNGFR is shown.
Figure S7. Comparison with Retroviral System and Extended TFAP4 Validation Data, Related to Figure 4.
(A) The HA-GD2-28z CAR in combination with tNGFR, BATF, JUN or TFAP4 was expressed using either the non-viral KI system or a retroviral transduction system. Cells were sorted on CAR expression and BATF, JUN and TFAP4 overexpressing cells were co-cultured with tNGFR overexpressing cells at a ~50:50 ratio. Relative abundance (tNGFR positive vs negative cells) was analyzed over the course of 18 days. TRAC knockin strategy is shown in the upper panel, retroviral transduction is shown in the lower panel. N = 3 donors in technical triplicates. Two-way ANOVA with Holm Sidak’s test was performed (GraphPad Prism).
(B) Cells were generated and sorted as described in panel A and co-cultured with GD2-expressing Nalm-6 cells for 24 hours. TRAC knockin strategy is shown in the upper panel, retroviral transduction is shown in the lower panel. Intracellular cytokine expression was analyzed by flow cytometry. N = 3 donors in technical duplicates. One-way ANOVA (vs tNGFR) with Holm Sidak’s test was performed (GraphPad Prism). Mean+SEM shown.
(C) Cells were generated and sorted as described in panel A and co-cultured with GD2-expressing Nalm-6 cells in an Incucyte analysis. TRAC knockin strategy is shown in the upper panel (E:T ratio 1:8), retroviral transduction is shown in the lower panel (E:T ratio 1:8). N = 3 donors in technical triplicates. Two-way ANOVA (vs tNGFR) with Holm Sidak’s test was performed to analyze statistical significance as described in the Methods. Mean+SEM shown.
(D) tNGFR CD19-28z CAR-T cells were co-cultured with CD19+ target cells (Nalm-6) with or without prior 5x repetitive stimulation (CD19 positive A375s). Killing capacity of tNGFR CD19-28z CAR-T cells was markedly decreased after going through repetitive stimulation. N = 2 donors in technical quadruplicates. Multiple unpaired t-test was performed to determine statistical significance including Holm-Sidak’s test as described in the Methods. Significance at last timepoint (114 hours) shown. E:T ratio = 1:2. Mean + SEM shown.
(E) The CD19-28z CAR in combination with tNGFR or TFAP4 was knocked into human T cells and co-cultured with CD19+ target cells (Nalm-6) at various E:T ratios. Number of remaining target cells/cancer-cell killing was analyzed using the Incucyte system across various E:T ratios. N = 2 donors in technical quadruplicates. Two-way ANOVA was used to calculate statistical significance including Holm-Sidak’s test as described in the Methods. Significance at last timepoint (114 hours) shown. Mean + SEM shown. Left panel shows 1:2 E:T ratio.
(F) T cells were generated as described in panel E, subjected to the repetitive stimulation assay (five stimulations with A375s) and then co-cultured with CD19+ target cells one more time (Nalm-6). Again, CD19-28z CAR-T cells with synthetic TFAP4 knockin were better able to control tumor cell growth. N = 2 donors in technical quadruplicates. Two-way ANOVA was used to calculate statistical significance including Holm-Sidak’s test as described in the Methods. Significance at last timepoint (120 hours) shown. Mean + SEM shown. Left plot shows 1:2 E:T ratio.
(G) T cells were generated as described in panel E, subjected to the repetitive stimulation assay and then co-cultured with CD19+ target cells one more time (stimulations and final co-culture were with adherent cell line A375 that was modified to express CD19). Again, CD19-28z CAR-T cells with synthetic TFAP4 knockin were better able to control tumor-cell growth. N = 2 donors in technical quadruplicates. Two-way ANOVA was used to calculate statistical significance including Holm-Sidak’s test as described in the Methods. Significance at last timepoint (120 hours) shown. Mean + SEM shown. Left plot shows 1:1 E:T ratio.
(H) tNGFR or TFAP4 CD19-28z CAR-T cells were co-cultured with CD19 negative target cells (A375). No elevated unspecific killing of the TFAP4 compared to the tNGFR construct was observed. Two-way ANOVA was used to calculate statistical significance including Holm-Sidak’s test as described in the Methods. Significance at last timepoint (84 hours) shown. Left plot shows 1:4 E:T ratio. N = 2 donors in technical triplicates. Mean + SEM shown.
(I) TFAP4 or tNGFR KI CD19-28z CAR-T cells were stained with CellTrace Violet and either cultured without targets or co-cultured with CD19 negative or CD19 positive target cells (Nalm-6) for 72 hours. Reduced CTV signal indicates increased proliferation of TFAP4 KI T cells after co-culture with CD19 positive targets, but not after co-culture with CD19 negative targets or after culturing them without target cells. N = 2 donors in ≥ 2 technical replicates. Paired t-test was performed (GraphPad Prism). Mean + SEM shown. The histogram (right panel) shows exemplary CTV signal after co-culture with CD19 positive target cells for one out of two donors.
Only significance between TFAP4 vs tNGFR is shown in E-H.
Figure S8. Extended TFAP4 Validation Data and IL2RA FACS-Sorted Screen in HA-GD2-28z CAR-T cells, Related to Figure 4.
(A) Endogenous TFAP4 expression was analyzed by bulk RNA-seq throughout the repetitive stimulation assay using the NY-ESO-1 TCR or CD19-BBz CAR system and compared to endogenous TFAP4 levels when culturing the HA-GD2-28z CAR (tonic activation). While TFAP4 expression peaked after the 2nd stimulation in the TCR model, it was more heterogenous in the CD19-BBz CAR model and decreased over time in the HA-GD2-28z CAR model. N = 3 donors for the NY-ESO-1 TCR and CD19-BBz CAR, n = 2 donors for the HA-GD2-28z CAR. Mean + SEM shown.
(B) TFAP4 transcript overexpression resulting from TFAP4 KI as determined by ModPoKI-Seq (see Figure S2A, NY-ESO-1 TCR). Mean normalized TFAP4 expression of TFAP4 KI T cells vs cells with KIs of the included other constructs is shown. N = 2 donors.
(C) To determine protein expression levels of TFAP4 in TFAP4 KI T cells, we generated TFAP4 HA-GD2-28z CAR constructs with an N terminal HA-tagged TFAP4 and a C terminal HA-tagged TFAP4. GeoMean FI of intracellular HA-tag expression is shown for conventional tNGFR HAGD2-28z CAR KI cells vs N-terminally tagged (HA-TFAP4) and C-terminally tagged (TFAP4-HA) TFAP4 HA-GD2-28z CAR KI cells 10 days after electroporation. Mean + SEM shown. N = 2 donors in technical triplicates. Statistical significance was calculated using one-way ANOVA with Holm Sidak’s test.
(D) Exemplary flow cytometry data of the experiment described in panel C for one out of two donors 10 days after electroporation is shown (intracellular HA expression). Cells were gated on CAR+/TCRab− expression.
(E) GeoMean FI data of plot in Figure 4G is shown. IL2RA and CD69 expression on HA-GD2-28z CAR-T cells were analyzed by flow cytometry on day 8 after electroporation; TFAP4 KI led to increased IL2RA surface expression. Multiple t-test was performed to determine significance including Holm Sidak’s test. N = 2 donors in technical duplicates. Mean + SEM shown.
(F) Induction of IL2RA (a key phenotype of TFAP4 KI) was preserved after addition of an HA-tag to either the C or N terminus of TFAP KI construct. N = 3 donors in one to three technical replicates. Statistical significance was calculated using one-way ANOVA with Holm Sidak’s test.
(G) A FACS-based ModPoKI screen was performed to identify TFs that can affect IL2RA expression. ModPoKI was performed with the HA-GD2-28z CAR in combination with the TF library. Cells were FACS-sorted on day 8 after electroporation into top and bottom ~20% IL2RA expression bins. RNA was isolated and barcode amplicon-sequencing performed. N = 3 donors. Sorting strategy is shown for one exemplary donor.
(H) The IL2RA FACS-sorted screen was performed as described in panel G. Log2FC of construct representation in IL2RA high vs low bin was calculated and dataset was normalized based on GFP/RFP controls and to fit on a scale from −1 to 1. N = 3 donors, mean + SEM shown.
(I) Cytokine production and secretion of TFAP4 KI vs tNGFR KI HA-GD2-28z CAR-T cells were analyzed after 24h co-culture with GD2+ target cells by intracellular cytokine stain (left panel) and Legendplex analysis of the supernatant (right panels). N = 2 donors in >= 2 technical replicates. Multiple paired t-test was performed to determine statistical significance. Mean + SEM shown.
(J) TFAP4 or tNGFR KI CD19-28z CAR-T cells were co-cultured with either CD19 negative or CD19 positive target cells (A375 and Nalm-6). IFN-g and IL-2 production was evaluated by intracellular cytokine stain and confirmed elevated cytokine levels only in the presence of CD19 positive target cells. In the presence of CD19 negative target cells or in absence of target cells, TFAP4 KI CD19-28z CAR-T cells did not release increased amounts of IFN-g and IL-2 compared to the control. Multiple paired t-test was performed to determine statistical significance. N = 2 donors in technical triplicates. Mean + SEM shown.
Figure S9. Combinatorial Knockin Strategy and BATF-TFAP4 Validation Analyses, Related to Figures 5–6.
(A-B) Schematic illustration showing the pooled assembly approach used to generate a combinatorial library of the tonic signaling HA-GD2-28z CAR plus 100 TFs x 100 TFs resulting in a ~10,000-member library. The inserts for TF position 1 and 2 were separately generated by pooled PCRs off of the existing TF library. The backbone (consisting of the HA-GD2-28z CAR plus homology arms) and the two inserts were assembled in a pooled Hifi DNA assembly reaction resulting in the combinatorial ModPoKI plasmid library. Double-stranded HDR template was generated by pooled PCR followed by non-viral pooled knockin into primary human T cells. The resulting sequences between the two TFs (combinatorial barcoded multicistronic adaptor) can be used to read out the identity of the constructs (see Methods).
(C) Exemplary knockin of a control construct containing the HA-GD2-28z CAR with tNGFR and RFP including the combinatorial barcoded multicistronic adaptor sequences into primary human T cells.
(D) To assess if the direction of the knockin influences expression levels, HA-GD2-28z CAR constructs including RFP-tNGFR (RFP in 1st position) and tNGFR-RFP (RFP in 2nd position) were generated and RFP expression was analyzed by flow cytometry on day 4 after electroporation. Exemplary flow cytometry plot from one donor out of two donors is shown, cells were gated on CAR+/TCRab− T cells.
(E) The TFxTF combinatorial ModPoKI library was knocked into primary human T cells. As the HA-GD2-28z CAR provides tonic signaling, T cells were cultured without addition of target cells. Cells were sorted on day 4 and day 16 after electroporation and the log2FC over time was calculated (day 16/day 4). Log2FC for the top 10 combinatorial TFxTF constructs is shown and compared to controls. N = 2 donors. Panel shows data for various KI combinations (with barcodes for constructs with both orientations included as bars x two donors).
(F) Data from Figure 6B shown as GeoMean FI instead of percent positive. The data from the single knockin tNGFR HA-GD2-28z CAR construct were added to illustrate that the BATF-TFAP4 KI construct increases levels of IL2RA surface expression beyond baseline. Mean + SEM shown. Two-way ANOVA with Holm Sidak’s test was performed to analyze statistical significance. N = 2 donors in technical duplicates.
(G) Different combinatorial validation constructs were knocked into primary human T cells as described in Figure 6. Bulk RNA-seq was performed 14 days after electroporation. Differentially expressed genes between BATF-TFAP4 KI and RFP-tNGFR KI HA-GD2-28z CAR-T cells are plotted. N = 2 donors.
(H) Log2 fold changes in gene expression between the tested KI condition and control KI (RFP-tNGFR) were compared between BATF-TFAP4 KI and the other constructs. Correlation analyses indicated that BATF-TFAP4 KIs were most similar in gene expression changes with RFP-TFAP4 and BATF-RFP, while the correlation between BATF-TFAP4 KI cells and RFP-JUN KI cells was lower. N = 2 donors. Statistics were done using linear regression (lm function in RStudio).
Figure S10. Extended BATF-TFAP4 Validation Data, Related to Figure 6.
(A-C) Gene set enrichment analyses of the BATF-TFAP4 combinatorial construct compared to RFP-tNGFR (A), RFP-TFAP4 (B) or BATF-RFP (C) without and with addition of GD2+ target cells for 24h is shown (day 14 vs day 15 after electroporation, respectively). Notably, after stimulation with target cells, the gene sets involved in fatty acid metabolism, glycolysis, oxidative phosphorylation and IL2/STAT5 signaling were enriched in genes differentially expressed between BATF-TFAP4 cells compared to RFP-tNGFR cells. N = 2 donors.
(D) Combinatorial KI HA-GD2-28z CAR-T cells were co-cultured with Nalm-6/GFP/Luc/GD2 target cells and target-cell killing was analyzed via Incucyte. BATF-TFAP4 combinatorial KI HA-GD2-28z CAR-T cells trended toward improved performance relative to other combinatorial KI HA-GD2-28z CAR-T cells in terms of in vitro killing capacity. N = 2 donors in technical triplicates. Reduced number of replicates for RFP-tNGFR condition was due to low cell counts (see panel E). Two-way ANOVA with Holm Sidak’s test was performed to analyze significance as described in the Methods. Significance at the last imaging timepoint is shown; mean + SEM shown.
(E) Data from Figure 6F divided by donors and with more E:T ratios. N = 3 for all conditions in donor 1. N = 3 for BATF-TFAP4, RFP-TFAP4 and BATF-RFP condition in donor 2. Due to low cell counts, RFP-tNGFR only has one datapoint in E:T 1:8 and 1:12 and no datapoint in the other E:T ratios for donor 2. Mean + SEM shown in all conditions with N > 1.
(F) Data from Figure 6G divided by donors. Mean + SEM shown.
Figure S11. BATF Facilitates TFAP4-Mediated Increases in T-Cell Fitness, Related to Figure 7
(A) HA-GD2-28z CAR-T cells with single or combinatorial knockin of BATF and/or TFAP4 vs controls were generated, sorted for CAR+/TCRab− T cells and subjected to RNA-seq, ATAC-seq and TFAP4 and BATF ChIP-seq 14 days after electroporation. Metagene plot of normalized (#) TFAP4 ChIP-seq signal intensity (top) and ATAC-seq signal intensity (bottom) at TFAP4 KIregulated chromatin regions (opening or closing) in the indicated conditions. FDR < 0.05, log2FC ≥ 0.5.
(B) Heatmap shows differential TFAP4 binding sites in tNGFR vs. TFAP4 HA-GD2-28z KI CART cells. N = 3 donors; FDR < 0.05, log2FC ≥ 0.5. De novo TF motif analysis by Homer at induced and unchanged TFAP4-bound genomic regions is shown.
(C) tNGFR, TFAP4 or IL2RA HA-GD2-28z KI CAR-T cells were co-cultured with GD2-expressing Nalm-6 cells. TFAP4 KI significantly increased cytotoxic capacity compared to IL2RA KI. Two-way ANOVA was used to determine statistical significance including Holm-Sidak’s test as described in the Methods. Significance at the last timepoint (192 hours) is shown. N = 3 donors in technical triplicates. Mean + SEM shown. Left plot shows 1:16 E:T ratio. Only significance between TFAP4 vs IL2RA, IL2RA vs tNGFR and TFAP4 vs tNGFR is shown.
(D) tNGFR, TFAP4 or IL2RA HA-GD2-28z KI CAR-T cells were co-cultured with GD2-expressing Nalm-6 cells at a 1:1 E:T ratio. Cytokine concentrations in co-culture supernatants were analyzed using LEGENDplex Human CD8/NK Panel. N = 3 donors in technical triplicates. Mean + SEM is shown. One-way ANOVA was used to calculate statistical significance between TFAP4, IL2RA and tNGFR KIs including Holm-Sidak’s test.
(E) Heatmap representation of differentially accessible open chromatin regions (OCRs) in the indicated conditions (left). OCR groups were defined by k-means clustering and describe distinct chromatin accessibility patterns, as follows: Group I. Accessibility is induced by TFAP4 KI and not affected by BATF KI; Group II. Accessibility is induced by TFAP4 KI and further increased by BATF-TFAP4 combination KI; Group III. Accessibility is induced by TFAP4 KI, but decreased by BATF-TFAP4 combination KI; and Group IV. Accessibility is reduced in all conditions compared to tNGFR control KI. N = 3 donors; FDR < 0.05, log2FC ≥ 0.5. Metagene plot of normalized (#) ATAC-seq (middle) and TFAP4 ChIP-seq (right) signal intensity in the four groups of OCRs in the indicated conditions. Pie charts represent the percentage of OCRs bound by TFAP4. Targeted TFAP4 motif analysis in the four OCR groups is shown (bottom table; p-values were calculated by Fisher’s exact test).
(F) Venn diagram depicts the global cistromic interactions between BATF and TFAP4 in KI T cells across all conditions (tNGFR, TFAP4, BATF, BATF-TFAP4). Cistrome comprises all detected genome sites bound by BATF and/or TFAP4 as assessed by ChIP-seq. FDR < 0.05, log2FC ≥ 0.5.
(G) Tornado plots depict ATAC-seq read distribution at TFAP4 KI-induced OCRs in a +/− 1kb window around the summits of ATAC-seq peaks in the indicated conditions (related to metagene plot in Figure 7K).
(H) Tornado plots depict TFAP4 ChIP-seq read distribution at BATF KI-induced OCRs in a +/− 1kb window around the summits of ATAC-seq peaks in the indicated conditions (related to metagene plot in Figure 7L).
(I) Genome browser examples with ChIP-seq, ATAC-seq, and RNA-seq tracks at genomic loci where TFAP4 KI and BATF KI induce gene expression and chromatin accessibility (in the highlighted genomic regions - light blue), and BATF KI facilitates the binding of TFAP4. Gene examples (IL12A, IL5, and SLC7A11) are derived from Group II genes from Figure 7F.
Panels A-B include data on TFAP4 vs tNGFR single KI HA-GD2-28z CARs. Panel F summarizes data from all ChIP-seq conditions (TFAP4, BATF, tNGFR HA-GD2-28z CAR single KIs and BATF-TFAP4 HA-GD2-28z CAR combinatorial KIs). Panels E, G and I include RNA-seq and/or ATAC-seq from RFP-tNGFR (labeled as tNGFR), BATF-RFP (labeled as BATF), RFP-TFAP4 (labeled as TFAP4) and BATF-TFAP4 HA-GD2-28z CARs. Panel H shows ChIP-seq data from TFAP4, BATF and tNGFR single KI HA-GD2-28z CARs and BATF-TFAP4 combinatorial KI HA-GD2-28z CARs.
Table S1. DNA Sequences
(A) TF Library DNA Sequences. DNA sequences of the 100-member TF library including adaptor sequences and information on known functionality in T cells.
(B) SR Library DNA Sequences. DNA sequences of the 129-member SR library including adaptor sequences and information on switch receptor design.
(C) TFxTF Library DNA Sequences. DNA sequences of the combinatorial TFxTF library including adaptor sequences.
(D) Primer Sequences. Cloning and sequencing primers used in this study.
(E) TCR and CAR Sequences. Sequences of the NY-ESO-1 TCR, CD19-BBz CAR, CD19-28z CAR and HA-GD2-28z CAR used in this study.
Table S2. Screening Data
(A) TF Library Screening Data. Log2FC screening data of the TF library across TCR/CAR specificities and challenge modules.
(B) SR Library Screening Data. Log2FC screening data of the SR library across TCR/CAR specificities and challenge modules.
(C) ModPoKI-Seq Screen Data. Enrichment of the different NY-ESO-1 TCR KI constructs across the 14 clusters shown in Figure S7D.
(D) TFxTF Library Screening Data. Log2FC screening data of the TFxTF library in the HA-GD2-28z CAR tonic signaling screen.
Data Availability Statement
Bulk RNA-seq, combined ATAC-, ChIP- and RNA-seq and ModPoKI-Seq datasets have been deposited at GEO and are publicly available as of the date of publication. Accession numbers are listed in the key resources table. This paper also analyzes existing, publicly available data. Accession numbers are also listed in the key resources table. Screening data and DNA sequences are shown in Tables S1–2. Original code has been deposited to Zenodo (10.5281/zenodo.8015657). Additional information required to reanalyze the data reported in this paper is available from the lead contact upon request.
Key resources table
| REAGENT or RESOURCE | SOURCE | IDENTIFIER |
|---|---|---|
| Antibodies | ||
| Alexa Fluor 647 AffiniPure F(ab’)2 Fragment Goat Anti-Mouse IgG, F(ab’)2 fragment specific | Jackson ImmunoResearch | Cat#115-606-072; RRID:AB_2338928 |
| APC anti-human CD271 (NGFR) Antibody | Biolegend | Cat#345108; RRID:AB_10645515 |
| APC anti-human CD279 (PD-1) Antibody | Biolegend | Cat#329908; RRID:AB_940475 |
| APC anti-human CD86 Antibody | Biolegend | Cat#305412; RRID:AB_493231 |
| APC Mouse Anti-Human CD178 | BD | Cat#564262; RRID:AB_2738714 |
| APC Mouse IgG1, k Isotype Control | BD | Cat#555751; RRID:AB_398613 |
| BD Pharmingen PE Mouse anti-Human CD39 | BD | Cat#555464; RRID:AB_395856 |
| Brilliant Violet 421 anti-human CD25 Antibody | Biolegend | Cat#302630; RRID:AB_11126749 |
| Brilliant Violet 421 anti-human CD366 (Tim-3) Antibody | Biolegend | Cat#345008; RRID:AB_11218598 |
| Brilliant Violet 421 anti-human CD69 Antibody | Biolegend | Cat#310930; RRID:AB_2561909 |
| Brilliant Violet 421 anti-human CD8a Antibody | Biolegend | Cat#301036; RRID:AB_10960142 |
| Brilliant Violet 421 anti-human CD95 (Fas) Antibody | Biolegend | Cat#305624; RRID:AB_2561830 |
| Brilliant Violet 421 anti-human TCRa/b Antibody | Biolegend | Cat#306722; RRID:AB_2562805 |
| Brilliant Violet 421 Mouse IgG1, k Isotype Ctrl Antibody | Biolegend | Cat#400158; RRID:AB_11150232 |
| Brilliant Violet 711 anti-human CD137 (4-1BB) Antibody | Biolegend | Cat#309832; RRID:AB_2650991 |
| Brilliant Violet 711 anti-human CD19 Antibody | Biolegend | Cat#302246; RRID:AB_2562065 |
| Brilliant Violet 711 anti-human CD45RA Antibody | Biolegend | Cat#304138; RRID:AB_2563815 |
| Brilliant Violet 711 anti-human CD80 Antibody | Biolegend | Cat#305236; RRID:AB_2734270 |
| Brilliant Violet 711 anti-human CD86 Antibody | Biolegend | Cat#305440; RRID:AB_2565835 |
| Brilliant Violet 711 anti-human TCR a/b Antibody | Biolegend | Cat#306740; RRID:AB_2783169 |
| Brilliant Violet 711 Mouse IgG2b, k Isotype Ctrl Antibody | Biolegend | Cat#400354 |
| BUV395 Mouse Anti-Human CD4 | BD | Cat#563550; RRID:AB_2738273 |
| BUV737 Mouse Anti-Human CD8 | BD | Cat#612754; RRID:AB_2870085 |
| BV421 Mouse IgG1, k Isotype Control | BD | Cat#562438; RRID:AB_11207319 |
| BV650 Mouse Anti-Human CD62L | BD | Cat#563808; RRID:AB_2738433 |
| BV711 Mouse Anti-Human IL-2 | BD | Cat#563946; RRID:AB_2738501 |
| CD223 (LAG-3) Monoclonal Antibody (3DS223H), PerCP-eFluor 710, eBioscience | Thermo Fisher Scientific | Cat#46-2239-42; RRID:AB_2573732 |
| eBioscience Fixable Viability Dye eFluor 780 | Thermo Fisher Scientific | Cat#65-0865-18 |
| FITC anti-human CD271 (NGFR) Antibody | Biolegend | Cat#345104; RRID:AB_2282828 |
| FITC anti-human CD4 Antibody | Biolegend | Cat#344604; RRID:AB_1937227 |
| FITC anti-human TCR a/b Antibody | Biolegend | Cat#306706; RRID:AB_314644 |
| Myc-Tag (9B11) Mouse mAb (Alexa Fluor 647 Conjugate) | Cell Signaling Technology | Cat#2233; RRID:AB_823474 |
| Pacific Blue anti-human TNF-α Antibody | Biolegend | Cat#502920; RRID:AB_528965 |
| PE anti-HA.11 Epitope Tag Antibody | Biolegend | Cat#901518; RRID:AB_2629623 |
| PE anti-human CD25 Antibody | Biolegend | Cat#302606; RRID:AB_314276 |
| PE anti-human CD62L Antibody | Biolegend | Cat#304806; RRID:AB_314466 |
| PE anti-human CD95 (Fas) Antibody | Biolegend | Cat#305608; RRID:AB_314546 |
| PE Mouse Anti-Human IFN-γ | BD | Cat#554701; RRID:AB_395518 |
| PE Mouse IgG1, k Isotype Ctrl Antibody | Biolegend | Cat#400112; RRID:AB_2847829 |
| PE Streptavidin | BD | Cat#349023 |
| PE-Cy7 Mouse Anti-Human CD25 | BD | Cat#557741; RRID:AB_396847 |
| PE-Cy7 Mouse Anti-Human CD8 | BD | Cat#335787; RRID:AB_399966 |
| PE/Cyanine 7 anti-human CD258 (LIGHT) Antibody | Biolegend | Cat#318708; RRID:AB_2721660 |
| PE/Cyanine 7 anti-human CD271 (NGFR) Antibody | Biolegend | Cat#345110; RRID:AB_11203542 |
| PE/Cyanine 7 anti-human CD80 Antibody | Biolegend | Cat#305218; RRID:AB_2076148 |
| PE/Cyanine7 anti-human TCR a/b Antibody | Biolegend | Cat#306720; RRID:AB_10639947 |
| PE/Cyanine7 Mouse IgG2b, k Isotype Ctrl Antibody | Biolegend | Cat#400326 |
| PerCP anti-human CD69 Antibody | Biolegend | Cat#310928; RRID:AB_10679124 |
| PerCP Mouse IgG1, k Isotype Ctrl Antibody | Biolegend | Cat#400148 |
| PerCP/Cyanine5.5 anti-human CD4 Antibody | Biolegend | Cat#317428; RRID:AB_1186122 |
| TOX Antibody, anti-human/mouse, APC, REAfinity | Miltenyi Biotec | Cat#130-118-335; RRID:AB_2751485 |
| violetFluor 450 Anti-Human CD45RA (HI100) | Tonbo | Cat#75-0458-T100; RRID:AB_2621951 |
| Bacterial and virus strains | ||
| Endura Competent Cells, Lucigen | VWR | Cat#60242-2 |
| NEB Stable Competent E.coli | New England Biolabs | Cat#C3040H |
| Stbl3 Competent Cells | Berkeley MacroLab | N/A |
| Biological samples | ||
| Human Peripheral Blood Leukopak, Fresh | Stemcell | N/A |
| Trima Residual | Vitalant | Cat#RE202 |
| Chemicals, peptides, and recombinant proteins | ||
| AMPure XP Reagent, 5 mL | Beckman Coulter | Cat#A63880 |
| BATF ChIP Antibody | Brookwood Biomedical | Cat#PAB4003 |
| Biotinylated Human CD19 Protein, Fc Tag, ultra sensitivity | ACROBiosystems | Cat#CD9-H8259 |
| Cas9 protein | Berkeley MacroLab | N/A |
| crRNA TRAC 2 sequence AGAGTCTCTCAGCTGGTACA | Dharmacon | N/A |
| CTS (Cell Therapy Systems) Dynabeads | Thermo Fisher Scientific | Cat#40203D |
| D-Luciferin, Potassium Salt | Gold Biotechnology | Cat#LUCK-10G |
| Dextramer- HLA-A*0201/SLLMWITQV-APC | Immudex | Cat#WB3247-APC |
| Dextramer- HLA-A*0201/SLLMWITQV-PE | Immudex | Cat#WB3247-PE |
| DSG Crosslinker 1 gram | ProteoChem | Cat#c1104-1gm |
| eBioscience Brefeldin A Solution (1000X) | Thermo Fisher Scientific | Cat#00-4506-51 |
| Gibson Assembly Master Mix - 50 rxns | New England Biolabs | Cat#E2611L |
| Glucose Solution | Thermo Fisher Scientific | Cat#A2494001 |
| GlycoBlue Coprecipitant (15 mg/mL) | Thermo Fisher Scientific | Cat#AM9516 |
| Invitrogen Recombinant Proteinase K Solution (20mg/mL) | Thermo Fisher Scientific | Cat#AM2548 |
| KAPA HiFi HS RM | Roche | Cat#07958935001 |
| Lipofectamine 3000 Transfection Reagent | Thermo Fisher Scientific | Cat#L3000150 |
| Maxima H Minus Reverse Transcriptase | Thermo Fisher Scientific | Cat#EP0753 |
| NEBNext Ultra II Q5 Master Mix | New England Biolabs | Cat#M0544L |
| NEBuilder HiFi DNA Assembly Master Mix | New England Biolabs | Cat#E2621S |
| Opti-MEM I Reduced Serum Medium | Thermo Fisher Scientific | Cat#31985088 |
| Phenol:Chloroform:Isoamyl Alcohol 25:24:1, Saturated with 10mM Tris, pH 8.0, 1mM EDTA | MilliporeSigma | Cat#P3803-400ML |
| Pierce 16% Formaldehyde (w/v), Methanol-free | Thermo Fisher Scientific | Cat#28906 |
| Poly-L-glutamic acid | Alamanda Polymers | Cat#26247-79-0 |
| Poly-L-ornithine solution | MilliporeSigma | Cat#P4957-50ML |
| Dynabeads Protein A for Immunoprecipitation | Invitrogen | Cat#10002D |
| Recombinant Human IL-15 GMP Protein, CF 25ug | R&D Systems | Cat#247-GMP-025 |
| Recombinant Human IL-2 GMP Protein, CF | R&D Systems | Cat#202-GMP-01M |
| Recombinant Human IL-7 GMP Protein, CF 25ug | R&D Systems | Cat#BT-007-GMP025 |
| RetroNectin Recombinant Human Fibronectin Fragment | Takara Bio | Cat#T100B |
| RNAse A, Dnase and protease-free (10mg/mL) | Thermo Fisher Scientific | Cat#EN0531 |
| Sera-Mag magnetic speedbeads | Thermo Fisher Scientific | Cat#09-981-123 |
| SPRIselect | Beckman Coulter | Cat#B23318 |
| tracrRNA | Dharmacon | Cat#U-002005-1000 |
| TRI Reagent | MilliporeSigma | Cat#93289-25ML |
| TRIzol Reagent | Thermo Fisher Scientific | Cat#15596018 |
| X-Vivo 15 | Lonza | Cat#BE02-060Q |
| Critical commercial assays | ||
| CellTrace Violet Cell Proliferation Kit, for flow cytometry | Thermo Fisher Scientific | Cat#C34557 |
| Chromium Single Cell 5’ Reagent Kit, v1 chemistry | 10x Genomics | Cat#PN-1000166 |
| EasySep Human T Cell Isolation Kit | Stemcell | Cat#100-0695 |
| EasySep Human TCR Alpha/Beta Depletion Kit | Stemcell | Cat#17847 |
| eBioscience Foxp3 / Transcription Factor Staining Buffer Set | Thermo Fisher Scientific | Cat#00-5523-00 |
| FIX & PERM Cell Fixation & Cell Permeabilization Kit | Thermo Fisher Scientific | Cat#GAS004 |
| LEGENDplex Human CD8/NK Panel (13-plex) with Filter Plate | Biolegend | Cat#740267 |
| MiniSeq High Output Reagent Kit (150-cycles) | Illumina | Cat#FC-420-1002 |
| Nextera Chromium i7 Sample Indices N Set A | 10x Genomics | Cat#PN-3000262 |
| Nextera XT DNA Library Preparation Kit | Illumina | Cat#FC-131-1096 |
| NextSeq 500/550 High Output Kit v2.5 (75 Cycles) | Illumina | Cat#20024906 |
| NextSeq 500/550 Mid Output Kit v2.5 (150 Cycles) | Illumina | Cat#20024904 |
| Ovation RNA-Seq System V2 | Tecan | Cat#7102-32 |
| Ovation Ultralow V2 DNA-Seq Library Preparation Kit | Tecan | Cat#0344NB-A01 |
| P3 Primary Cell 96-well Nucleofector Kit (960 RCT) | Lonza | Cat#V4SP-3960 |
| Phusion High-Fidelity PCR Master Mix with HF Buffer | New England Biolabs | Cat#M0531L |
| Qubit 1X dsDNA HS Assay Kit | Fisher Scientific | Cat#Q33231 |
| Deposited data | ||
| Bulk RNA-seq, combined ATAC-, ChIP- and RNA-seq and ModPoKI-Seq datasets | This paper | GEO: GSE232824 |
| DICE dataset | https://dice-database.org/ | |
| Bulk RNA-seq | Carnevale et al.23 | GEO: GSE204862 |
| Experimental models: Cell lines | ||
| A375 | ATCC | CRL-1619; RRID:CVCL 0132 |
| A375/CD19 | ATCC, then modified to express CD19 Carnevale et al.23 | N/A |
| A375/RFP/CD19 | ATCC, then modified to express RFP and CD19 Carnevale et al.23 Roth et al.37 | N/A |
| GP2-293 cells from Retro-X Universal Packaging System | Takara Bio | Cat#631530; RRID:CVCL_WI48 |
| Nalm-6/GFP/Luc | Justin Eyquem | N/A |
| Nalm-6/GFP/Luc/CD19KO | Justin Eyquem | N/A |
| Nalm-6/GFP/Luc/GD2 | Crystal Mackall and Robbie Majzner | N/A |
| Nalm-6/GFP/Luc/HLA-A2/NY-ESO-1 | Justin Eyquem | N/A |
| Experimental models: Organisms/strains | ||
| Mouse: NOD/SCID/IL2Rg-null (NSG) | The Jackson Laboratory | Stock#005557; RRID:IMSR_JAX:005557 |
| Oligonucleotides | ||
| See Table ST1D for oligonucleotides. | This paper | |
| Recombinant DNA | ||
| See Table ST1A–C for recombinant DNA (libraries). | This paper | |
| Software and algorithms | ||
| Adobe Illustrator | Adobe | N/A |
| FlowJo | BD | N/A |
| GraphPad Prism | GraphPad Software | N/A |
| Incucyte Live Cell Analysis System | Sartorius | N/A |
| Ingenuity Upstream Regulator Analysis in IPA | Qiagen | N/A |
| IVIS Spectrum In Vivo Imaging System | Perkin Elmer | N/A |
| RStudio | RStudio | N/A |