

Abstract
Aim:
The presence of two or more publications that report on overlapping patient cohorts poses a challenge for quantitatively synthesizing real-world evidence (RWE) studies. Thus, we evaluated eight approaches for handling such related publications in network meta-analyses (NMA) of RWE studies.
Methods:
Bayesian NMAs were conducted to estimate the annualized relapse rate (ARR) of disease-modifying therapies in multiple sclerosis. The NMA explored the impact of hierarchically selecting one pivotal study from related publications versus including all of them while adjusting for correlations.
Results:
When selecting one pivotal study from related publications, the ARR ratios were mostly similar regardless of the pivotal study selected. When including all related publications, there were shifts in the point estimates and the statistical significance.
Conclusion:
An a priori hierarchy should guide the selection among related publications in NMAs of RWE. Sensitivity analyses modifying the hierarchy should be considered for networks with few or small studies.
Keywords: dimethyl fumarate, disease-modifying therapies, multiple sclerosis, network meta-analysis, real-world evidence
Plain language summary
What is this article about?
Real-world evidence (RWE) studies are increasingly recognized as important data source in guiding clinical care and regulatory submissions. However, when synthesizing the evidence originating from RWE studies, different analyses of the same data source are identified often. To avoid the double-counting of patients in network meta-analysis, we investigated different approaches for synthesizing the evidence from such related publications.
What were the results?
When selecting a single pivotal publication by prioritizing different selection criteria (sample size, number of therapies evaluated, type of publication, or follow-up time), results were fairly similar. In the scenarios that included all related publications (instead of selecting single pivotal study), the overall conclusions sometimes changed inappropriately, even when correcting for correlations between publications.
What do the results mean?
When analyzing RWE data in a network meta-analysis, we recommend establishing selection criteria for choosing pivotal publications prior to quantitatively synthesizing the evidence from RWE studies.
Tweetable abstract
This study in multiple sclerosis examines approaches for handling related publications in network meta-analyses of real-world evidence and recommends establishing an a priori hierarchy for selection.
The evaluation of health technologies has been traditionally undertaken using randomized clinical trials (RCTs), which are considered the gold standard for evaluating the comparative efficacy of medical interventions [1]. Although the design of RCTs enables the generation of robust scientific evidence of therapeutic interventions, their internal validity is sometimes achieved at the expense of external validity (i.e., generalizability of findings) [2]. Moreover, given the limited follow-up times and logistical challenges, RCTs may be inappropriate to evaluate certain outcomes (e.g., rare but serious adverse events) or rare disease conditions [3]. Real-world evidence (RWE) studies, which address some of the aforementioned limitations, corresponds to the evidence about the potential benefits and harms of medical products derived from data collected in the real-world setting [4,5]. RWE studies, such as patient registries, medical claims database analyses, electronic health records, chart reviews, and prospective cohort studies, are playing an increasing role in healthcare decision making. In addition, several regulatory and reimbursement bodies have recognized the value of RWE studies in support of regulatory and health technology reimbursement submissions [6].
While several frameworks have been developed [5,7] or are under development [8] to guide the incorporation of RWE data in regulatory or reimbursement filings, it is crucial to address certain methodological challenges that may emerge while synthesizing the evidence originating from RWE studies. While RWE studies may be regarded as complementary to RCTs, there are several potential sources of bias that need to be carefully examined such as the selection of comparators, study time periods, drug exposure measurement, evaluation of study outcomes, and adjustment methods [9]. In addition, when conducting a systematic literature review (SLR) of RWE studies, it is common for related publications eligible for inclusion in a network meta-analysis (NMA) to be based on the same data source [10]. Since double-counting patients in a meta-analysis overestimates the precision of the results and can introduce bias, it is standard practice to include only one (instead of all) of the related publications [11]. In NMAs of randomized trials, data selection is fairly straightforward and can, for instance, focus on the pivotal study publication. However, RWE studies originating from the same database may have been generated by entirely different investigators, often adopting different design and analysis choices. This makes it difficult to identify a “pivotal” publication to include in the NMA. Double-counting studies has been established as a problem in classical meta-analyses [10]. In the emerging field of NMAs of RWE, studies typically have not addressed whether related publications were identified and how a pivotal study was selected [12–14].
The presence of multiple related publications per database poses a challenge for the adequate conduct of NMAs of RWE. This situation is particularly problematic when publications report competing results (e.g., treatment effect estimates) for the target population, intervention(s), comparator(s), and outcome of interest for the NMA. Including these publications without considering their relatedness may increase the risk of obtaining biased or overly precise treatment effect estimates. Furthermore, should the treatment effect estimates in the related publications differ, the selection of the paper to include may have substantive impacts on the NMA results. In the absence of a validated framework to guide investigators in their selection of the more adequate publication, the impact of following different prioritization criteria remains unknown. Accordingly, it is crucial to evaluate the impact of various methods that may be used in selecting related publications in NMAs of RWE.
To this end, we used the data of a previously conducted SLR and NMA of RWE evaluating the comparative effectiveness of disease-modifying therapies (DMTs) for multiple sclerosis (MS) [15]. We conducted a set of scenario analyses that demonstrated the impact of utilizing different criteria for selecting among related publications with competing data to include in the analysis of NMAs of RWE. We also examined alternative analytic techniques for including all related publications to understand the impact of double-counting patients and efforts to attempt to correct for this.
The case study is based on an SLR in MS, a chronic progressive disorder of the central nervous system that is associated with neurodegeneration from immune-mediated inflammation, demyelination, and damage of axons [16,17]. Relapse-remitting MS (RRMS), the most common clinical phenotype, is characterized by the development of relapses, or attacks or new or old neurological symptoms such as problems with balance, coordination, eyesight, bladder control, cognition, or sensation followed by some degree of recovery [18,19]. RRMS is managed by controlling symptoms and slowing progression using DMTs which have been shown to alter the course of MS [20,21]. One of the primary outcomes in measuring the effectiveness of DMTs is the annualized relapse rate (ARR), which is calculated by the annualizing the number of MS relapses per patient over the study period. Over the last few years, there has been a surge in RWE studies evaluating DMTs in patients with MS. These studies provide an invaluable insight into the comparative effectiveness of DMTs in routine clinical practice. Thus, pooling the evidence from such studies can provide clinicians, regulatory agencies, and reimbursement bodies additional information on the comparative effectiveness and tolerability of DMTs in more diverse cohorts of patients not otherwise accessible via the controlled settings of RCTs. Nevertheless, it is important to employ the adequate methodological techniques that ensure robust and reliable synthesis of the available evidence.
Methods
Systematic literature review
The results of this SLR have been published elsewhere [15]. Briefly, a comprehensive SLR was conducted to identify RWE studies comparing the efficacy of DMTs in RRMS [22]. The search strategy included medical subject headings and free-text terms related to MS, DMTs, and RWE study designs (Supplementary Tables 1 & 2). Searches were conducted in MEDLINE and Embase and screening was conducted following pre-defined eligibility population, interventions, comparisons, outcomes, and study design criteria (PICOS; Supplementary Table 3).
Related publications were identified via the unique database analyzed (i.e., claims database or registry). Within each set of related publications by database, instances of competing data were identified based on overlap in the patient population (treatment-exposed vs treatment-naive), study years, and treatments compared. Related publications with different populations or study years were not considered as reporting on competing data. Because NMAs are driven by relative effects between treatments, related publications examining the same treatments were considered to have competing data only if they evaluated two or more of the same treatments.
NMA & statistical methods
We evaluated the comparative effectiveness of DMTs in reducing the risk of relapse by estimating the ARR in studies that reported data on two patient populations: (1) studies enrolling a mixed population of patients with MS who were treatment-naive and patients who have been treated previously with one or more DMTs (henceforth “mixed prior treatment patient population”) and (2) studies enrolling only patients with MS who were previously treated with one or more DMTs (henceforth “previously treated patient population”). Other outcomes (including the time to first relapse and six-month confirmed disability progression) and patient populations (treatment-naive) were also considered; however, only two analytic scenarios were selected based on the robustness of the datasets in terms of the availability of related publications.
The relative efficacy of the DMTs for ARR was evaluated using a Bayesian NMA with weakly informative prior distributions. We employed a random-effects model to account for potential heterogeneity between the included populations and study designs. Pooled estimates for ARR were presented as rate ratios (RR) with 95% credible intervals (CrI). Results were considered statistically significant (i.e., sometimes referred to as “statistically conclusive” in the Bayesian setting) where the 95% CrI did not include 1.0. We assessed the networks for heterogeneity using I2 tests in classical frequentist meta-analyses and considering the estimates for τ2 (i.e., the between-study standard deviation of the treatment effect, expressed as log RR). Network inconsistency was evaluated and investigated by comparing the direct and indirect estimates of treatment effect. All Bayesian analyses were conducted in OpenBUGS (version 3.2.3).
Analysis scenarios
We considered eight approaches for handling related publications in an NMA. In the base-case scenario, a single related publication was selected for inclusion in the analysis if it had the most recent cohort, regardless of the methodological strength (as expressed by the Good Research for Comparative Effectiveness [GRACE] assessment). If the studies had the same years of enrollment or study years were not reported, journal articles were selected over conference abstracts. If the publication types were the same, studies with a longer period of follow-up were selected (Table 1).
Table 1. . Analytic scenarios.
| Scenarios | Hierarchy for related publications selection criteria |
|---|---|
| Base case | Most recent cohort, journal article, and longer follow-up period |
| Alternate publications | |
|---|---|
| A | Study quality (per GRACE assessment)† |
| B | Larger sample size† |
| C | More DMTs† |
| D | Study quality, larger sample size, and more DMTs† |
| E | None (other eligible studies with no discernible strengths) |
| All Related Publications | |
|---|---|
| No correlation | N/A |
| With correlation | N/A |
If competing studies did not vary based on this specific criterion, the base-case criteria were followed.
DMT: Disease-modifying treatment; GRACE: Good Research for Comparative Effectiveness; N/A: Not applicable.
Scenario analyses using alternate publications were conducted by prioritizing different study criteria over those described above. This allowed for related publications previously excluded due to the above criteria to be included instead. These analytic scenarios (A to E), representing the first group of scenario analysis, are summarized in Table 1. In scenario A, priority was given to studies with higher quality based on the GRACE assessment. In scenarios B and C, studies with larger sample sizes and more DMTs were respectively selected. In scenario D, a hierarchical approach was followed whereby the preference was given to studies with higher quality, however, for studies with similar quality, the one with the larger sample size was prioritized. For those with the same sample size, the study with more DMTs was selected. In cases where a related publication had no discernible strengths over the related publication selected for the base case (and therefore no hierarchy could be derived to justify selecting the pivotal study over related publications), the analyses were run including these studies to demonstrate the full span of possible results across the body of literature (“scenario E”). Across the base-case and alternate analytic scenarios, each related publication available for each network is included in at least one analysis.
In the second group of “All Related Publications” analytic scenarios, analyses were conducted where all related publications were included regardless of competing data (Table 1). These analyses were conducted to evaluate the impact of ignoring competing data when conducting NMAs of RWE. Furthermore, these analyses were repeated assuming various levels of correlation between the related publications to determine whether accounting for correlation can potentially reduce any bias created by double-counting patients.
Statistical approach for the inclusion of all related publications
For the “all related publications” analytic scenario in which no correlation was considered (i.e., ignoring correlation), related publications (e.g., Kalincik [23] and Spelman [24] from “MSBase” database) were coded as separate/independent studies (the only correlation that was accounted for was between the estimates of different contrasts in the same publication, assumed 0.50). However, for the other “all related publications” analytic scenario in which correlation was accounted for, the databases were treated as independent/unique studies and related publications were treated as parts (nested data) of unique studies. Given the impossibility of estimating a specific correlation between the results in any two given related publications, the analyses specified moderate correlations between the estimates of contrasts. In this scenario, we considered:
A correlation of 0.50 between the same contrast (e.g., teriflunomide [TERI] vs dimethyl fumarate [DMF]) in different related publications.
A correlation of 0.50 between the different contrasts (e.g., fingolimod [FTY] vs DMF and TERI vs DMF) in the same publication.
A correlation of 0.25 between the different contrasts (e.g., FTY vs DMF and TERI vs DMF) in different related publications originating from one database (e.g., MSBase).
Results
Following the completion of searches and screening, the SLR included 60 publications with treatment effect estimates derived from 19 unique databases (Supplementary Figure 1). These included 18 publications from 12 unique databases in which the comparative effectiveness of DMTs in patients with mixed prior treatment history were reported. Eleven publications from seven unique databases reported the findings in previously treated patients. Overall, an estimated total of 38,787 patients with mixed prior treatment history and 21,198 previously treated patients were included. Two databases had related publications with competing data (Hersh [25,26] and MSBase [23,24,27]) in the mixed prior treatment population, and three databases (MSBase [28–30], PharMetrics [31,32], and Truven [33,34]) had related publications with competing data in the previously treated population. The specific publications that were selected in each analysis scenario for both patient populations are described in Table 2, with network connections shown in Figures 1 & 2. The study characteristics and outcomes of included studies are presented in Table 3.
Table 2. . Studies contributing data to NMA scenarios.
| Database |
Base case†
|
A |
B |
C |
D |
E |
All related publications |
Ref. |
|---|---|---|---|---|---|---|---|---|
| Mixed prior treatment | ||||||||
| AMSTR |
Guger 2018; Guger 2018 |
Base case |
Base case |
Base case |
Base case |
Base case |
Base case |
[35,36] |
| Danish MS Registries |
Buron 2018; Koch-Henriksen, 2017 |
Base case |
Base case |
Base case |
Base case |
Base case |
Base case |
[37,38] |
| EFFECT |
Sloane, 2017; Chan 2017 |
Base case |
Base case |
Base case |
Base case |
Base case |
Base case |
[39,40] |
| French retrospective cohort |
Conde, 2019 |
Base case |
Base case |
Base case |
Base case |
Base case |
Base case |
[41] |
| Hersh |
Hersh, 2017 |
Base case |
Hersh, 2016 |
Base case |
Hersh, 2016 |
Base case |
Hersh, 2017, Hersh 2016 |
[25,26] |
| MSBase |
Kalincik, 2019 |
Spelman, 2016 |
Base case |
Spelman, 2016 |
Spelman, 2016 |
Kalincik, 2017 |
Kalincik 2019, Kalincik 2017, Spelman 2016 |
[23,24,27] |
| MSBase/ALEM |
Kalincik, 2017 |
Base case |
Base case |
Base case |
Base case |
Base case |
Base case |
[42] |
| NTD |
Braune, 2018 |
Base case |
Base case |
Base case |
Base case |
Base case |
Base case |
[43] |
| PharMetrics |
Bergvall, 2013 |
Base case |
Base case |
Base case |
Base case |
Base case |
Base case |
[44] |
| San Raffaele |
Moiola, 2018 |
Base case |
Base case |
Base case |
Base case |
Base case |
Base case |
[45] |
| SFCTHIR |
Lorscheider, 2017 |
Base case |
Base case |
Base case |
Base case |
Base case |
Base case |
[46] |
| Truven | Boster, 2017 | Base case | Base case | Base case | Base case | Base case | Base case | [47] |
| Previously treated | ||||||||
|---|---|---|---|---|---|---|---|---|
| Baroncini |
Baroncini, 2016 |
Base case |
Base case |
Base case |
Base case |
Base case |
Base case |
[48] |
| Ernst |
Ernst, 2017 |
Base case |
Base case |
Base case |
Base case |
Base case |
Base case |
[49] |
| MSBase |
He, 2015; Spelman, 2018 |
He, 2015, Kalincik, 2015 |
Base case |
Base case |
He, 2015, Kalincik, 2015 |
Base case |
He, 2015, Spelman, 2018, Kalincik, 2015 |
[28–30] |
| MSBase/TOP |
Spelman, 2015 |
Base case |
Base case |
Base case |
Base case |
Base case |
Base case |
[50] |
| PharMetrics |
Bergvall, 2014 |
Base case |
Base case |
Base case |
Base case |
Bergvall, 2013 |
Bergvall, 2014, Bergvall, 2013 |
[31,32] |
| SFCTHIR |
Lorscheider, 2018 |
Base case |
Base case |
Base case |
Base case |
Base case |
Base case |
[51] |
| Truven | Ontaneda, 2018 | Base case | Boster, 2016 | Boster, 2016 | Boster, 2016 | Base case | Ontaneda, 2018; Boster, 2016 | [33,34] |
Related publications with no competing data were included together in the base-case analysis.
ALEM: Alemtuzumab; AMSTR: Austrian MS Treatment Registry; NTD: NeuroTransData; SFCTHIR: Swiss Federation for Common Tasks of Health Insurances Registry; TOP: TYSABRI Observational Program.
Figure 1. . Mixed prior treatment evidence network.

Related publications are displayed in grey color.
*IFN/GA corresponds to patients who received any IFN or GA; this does not include the other IFN or GA treatment arms which were reported and analyzed separately.
ALEM: Alemtuzumab; AMSTR: Austrian MS Treatment Registry; DMF: Dimethyl fumarate; FTY: Fingolimod; GA: Glatiramer acetate; IFN: Interferon betas; NTD: NeuroTransData; NTZ: Natalizumab; SFCTHIR: Swiss Federation for Common Tasks of Health Insurances Registry; TERI: Teriflunomide.
Figure 2. . Previously treated evidence network.
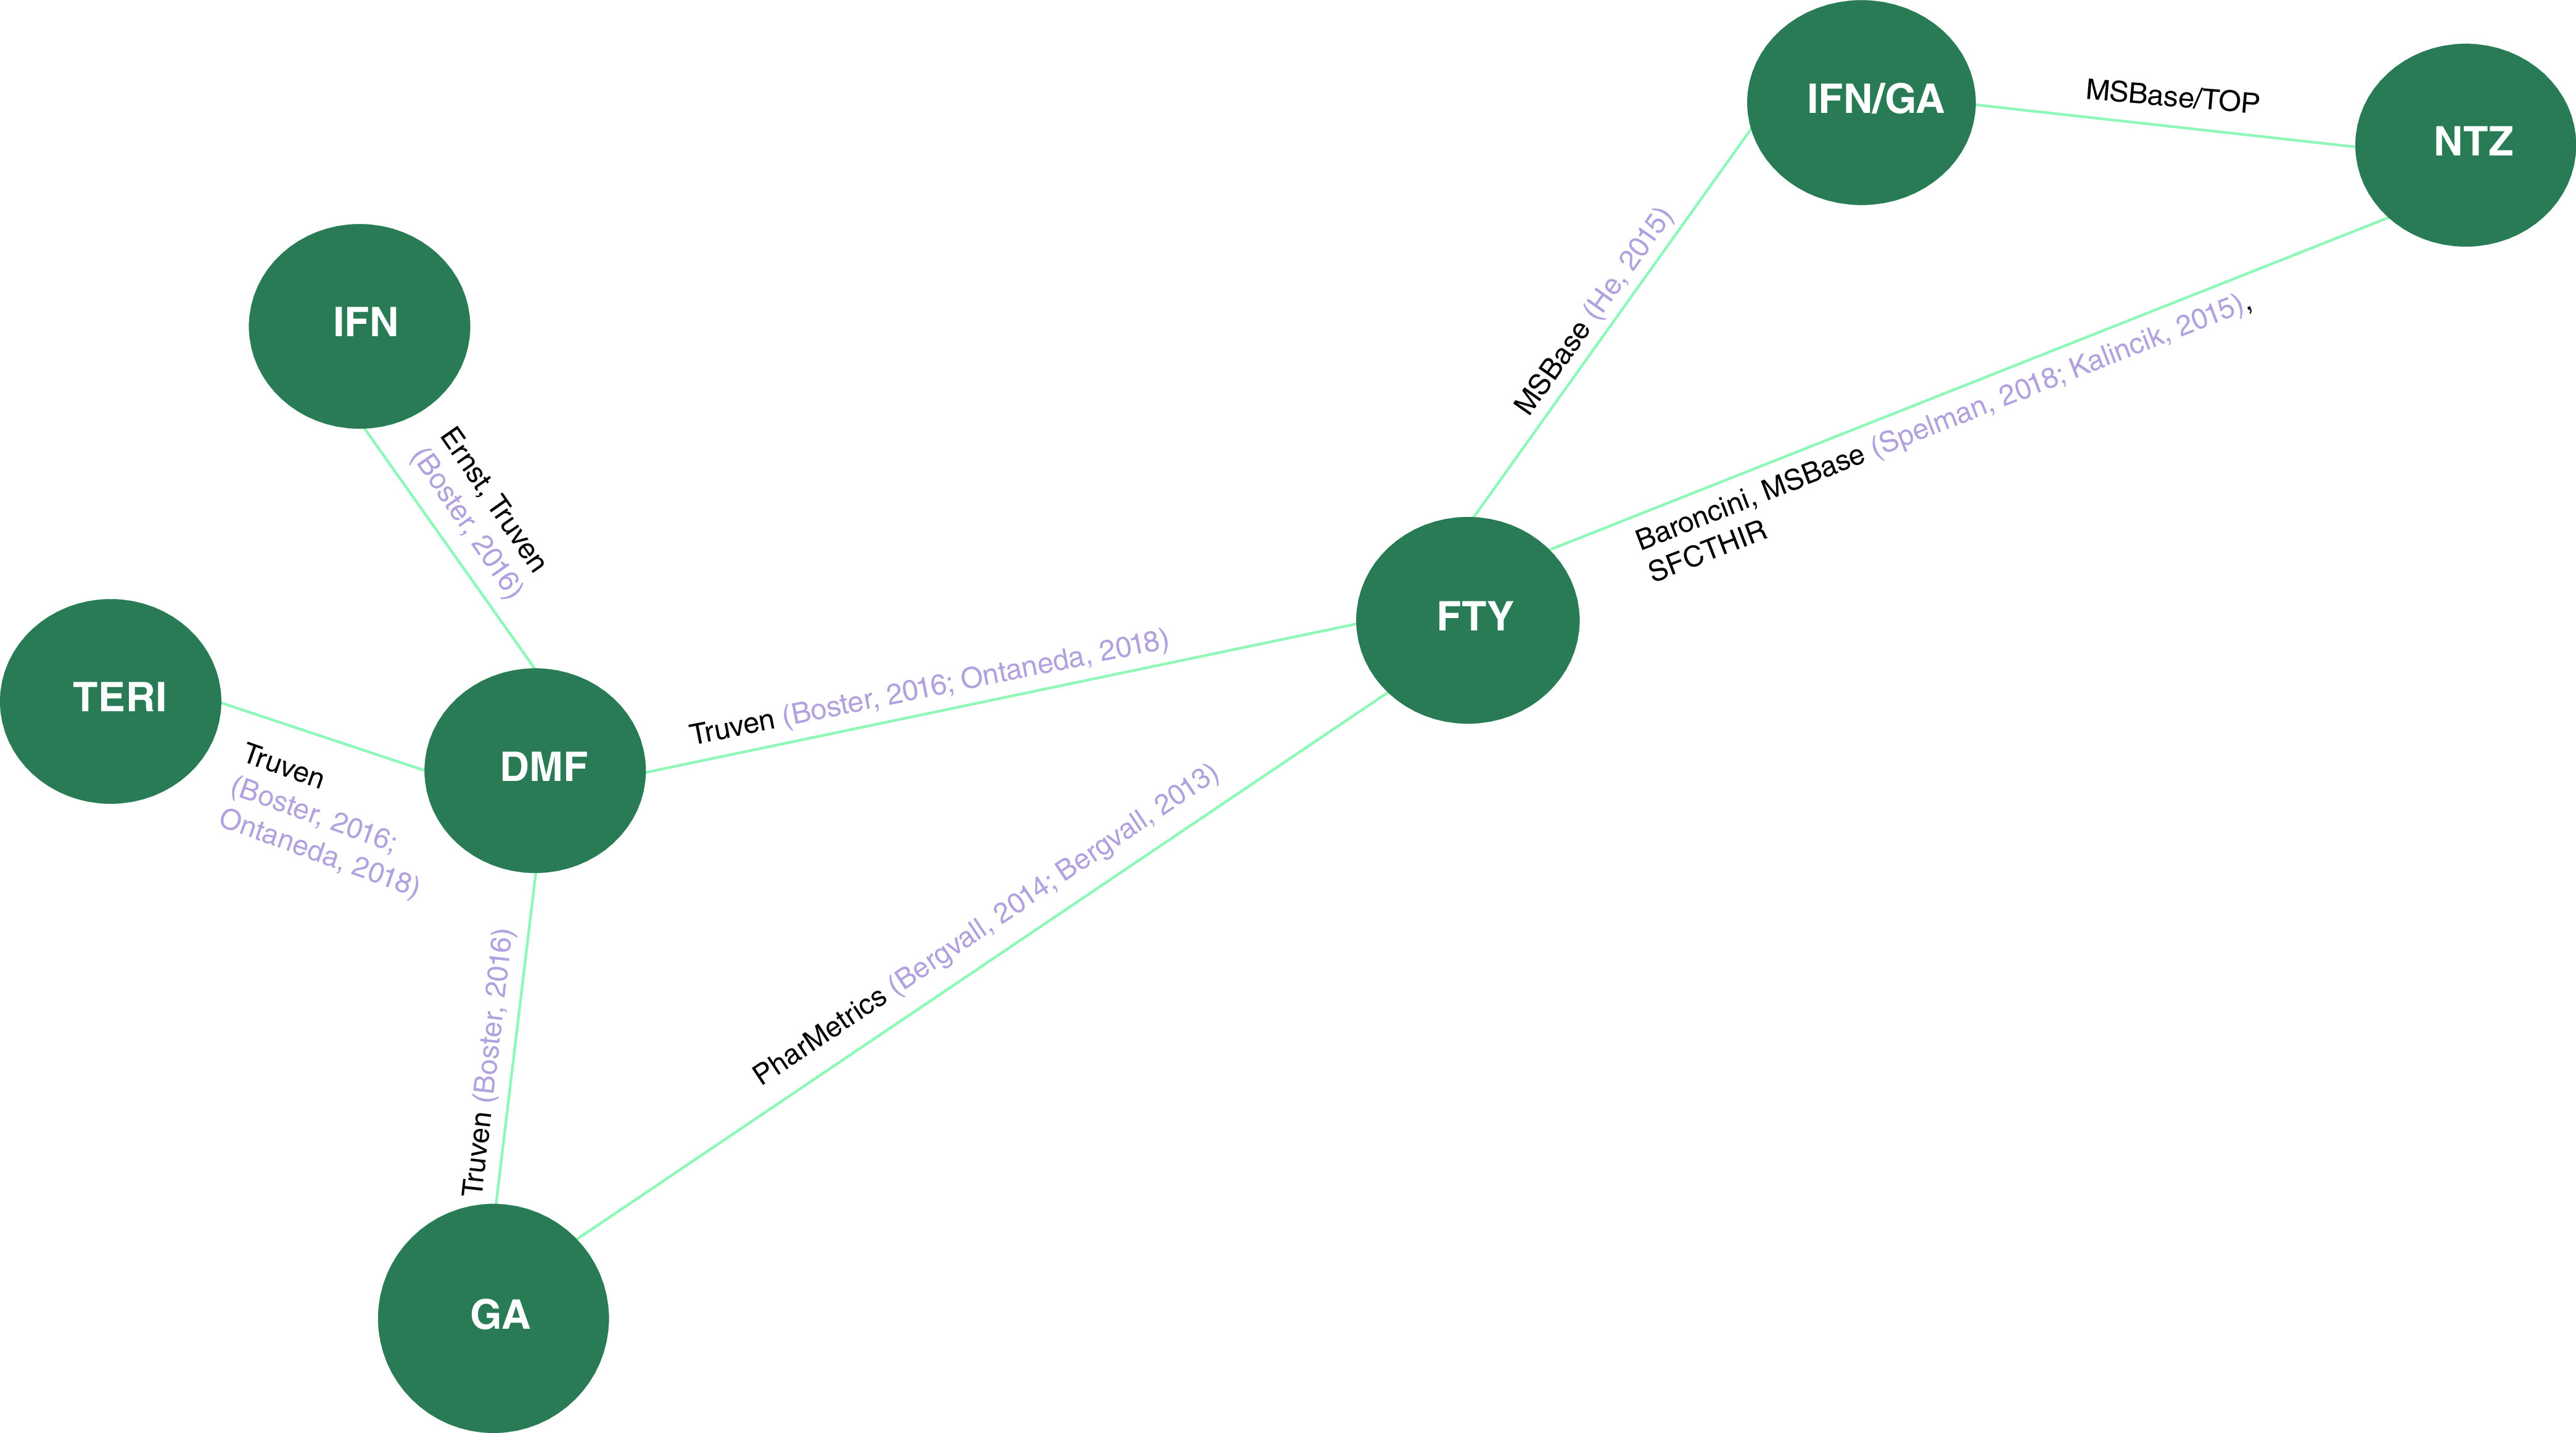
Related publications are displayed in grey color.
DMF: Dimethyl fumarate; FTY: Fingolimod; GA: Glatiramer acetate; IFN: Interferon beta; NTZ: Natalizumab; SFCTHIR: Swiss Federation for Common Tasks of Health Insurances Registry; TERI: Teriflunomide; TOP: TYSABRI Observational Program.
Table 3. . Study characteristics and outcomes.
| Database name, study (year) |
Publication type |
Years of enrollment |
Sample size enrolled |
Follow-up duration or period |
ARR, Mean (95% CI); [ARR, Rate Ratio (95% CI)]‡ |
Study quality (per GRACE assessment) |
Ref. |
|---|---|---|---|---|---|---|---|
| Mixed prior treatment populations | |||||||
| AMSTR, Guger (2018) |
Journal article |
2011–NR |
588 |
2 years |
FTY: 0.19 (SD: 0.45) NTZ: 0.12 (SD: 0.28) |
High quality |
[35] |
| AMSTR, Guger (2018) |
Conference presentation |
2014–NR |
1165 |
At least 12 months |
FTY: 0.21 (0.13–0.28); [1.01 (0.53–1.94) vs DMF] TERI: 0.19 (0.08–0.30); [0.92 (0.42–2.03) vs DMF] DMF: 0.20 (0.10–0.31) |
Low quality |
[36] |
| Danish MS Registries, Buron (2018) |
Conference presentation |
NR–May 2018 |
2236 |
Mean 1.9 – 2.4 years† |
DMF: 0.09 (0.07–0.12); [0.58 (0.46–0.73)] TERI: 0.16 (0.13–0.20) |
Medium quality |
[37] |
| Danish MS Registries, Koch-Henriksen (2017) |
Journal article |
July 2011–March 2015 |
1379 |
NR |
[NTZ vs FTY: 0.93 (0.74–1.17)] |
Medium quality |
[38] |
| EFFECT, Sloane (2017) |
Conference presentation |
2010–NR |
1611 |
≥12 months |
DMF: 0.13 (0.10–0.17); [1.09 (0.79–1.49)] FTY: 0.12 (0.09–0.16) |
Medium quality |
[39] |
| EFFECT, Chan (2017) |
Conference presentation |
2010–NR |
1890 |
≥12 months |
DMF: 0.14 (0.11–0.18); [0.69 (0.52–0.91)] GA: 0.21 (0.17–0.25) |
Medium quality |
[40] |
| French Retrospective Cohort, Conde (2019) |
Journal article |
2014–2017 |
346 |
Mean 22 months |
DMF: 0.06 (0.04–0.16) TERI: 0.21 (0.14–0.27) |
Medium quality |
[41] |
| Hersh, Hersh (2017) |
Journal article |
FTY initiation: October 2010 – August 2011 DMF initiation: March – July 2013 |
659 |
24 months |
[DMF vs FTY: 1.33 (0.52–3.43)] |
Medium quality |
[25] |
| Hersh, Hersh (2016) |
Journal article |
FTY initiation: October 2010 – August 2011 DMF initiation: March – July 2013 |
775 |
12 months |
[DMF vs FTY: 1.59 (0.47–5.41)] |
Medium quality |
[26] |
| MSBase, Spelman (2016) |
Conference presentation |
NR – April 2016 |
830 |
Mean 1.2 – 3.5 years† |
FTY: 0.19 (0.17–0.23) IFN: 0.26 (0.24–0.29) GA: 0.26 (0.23–0.29) TERI: 0.27 (0.22–0.33) DMF (matched to FTY cohort): 0.22 (0.18–0.27) DMF (matched to IFN cohort): 0.23 (0.19–0.27) DMF (matched to GA cohort): 0.24 (0.19–0.28) DMF (matched to TERI cohort): 0.17 (0.13–0.22) |
Medium quality |
[24] |
| MSBase, Kalincik (2019) |
Journal article |
2006–2017 |
3728 |
Median: 2.5 years |
DMF (matched to TERI cohort): 0.19 (0.15–0.23) TERI (matched to DMF cohort): 0.22 (0.18–0.26) FTY (matched to TERI cohort): 0.18 (0.16–0.21) TERI (matched to FTY cohort): 0.24 (0.21–0.27) FTY (matched to DMF cohort): 0.20 (0.19–0.22) DMF (matched to FTY cohort): 0.26 (0.24–0.28) |
Medium quality |
[23] |
| MSBase, Kalincik (2017) |
Conference presentation |
NR |
2985 |
Median 1.2 – 1.3 years† |
TERI: 0.27 (0.21–0.32) FTY: 0.21 (0.19–0.24) DMF (matched to TERI cohort): 0.17 (0.13–0.22) DMF (matched to FTY cohort): 0.24 (0.21–0.27) |
Medium quality |
[27] |
| MSBase/ALEM, Kalincik (2017) |
Journal article |
November 2015–June 2016 |
4332 |
Median 1.7 – 2.1 years† |
IFN: 0.53 (0.46–0.61) FTY: 0.34 (0.26–0.41) NTZ: 0.19 (0.15–0.23) ALEM (matched to IFN cohort): 0.19 (0.14–0.23) ALEM (matched to FTY cohort): 0.15 (0.1–0.2) ALEM (matched to NTZ cohort): 0.2 (0.14–0.26) |
Medium quality |
[42] |
| NTD, Braune (2018) |
Journal article |
NR |
6658 |
24 months |
IFNb: 0.25 (0.21–0.29) GA: 0.25 (0.21–0.29) TERI: 0.22 (0.17–0.27) FTY: 0.18 (0.15–0.21) DMF (matched to IFNb cohort): 0.17 (0.14–0.22); [0.71 (0.53–0.94)] DMF (matched to GA cohort): 0.19 (0.15–0.23); [0.76 (0.59–0.98)] DMF (matched to TERI cohort): 0.12 (0.09–0.16); [0.55 (0.39–0.77)] DMF (matched to FTY cohort): 0.19 (0.15–0.23); [1.5 (0.78–1.40)] |
Medium quality |
[43] |
| PharMetrics, Bergvall (2013) |
Journal article |
October 2010–March 2011 |
525 |
1.5 years |
IFN/GA: 0.64 IFNb: 0.64 GA: 0.64 FTY (matched to GA cohort): 0.32; [0.50 (0.34–0.75)] FTY (matched to IFNb cohort): 0.32; [1.99 (1.29–3.06)] FTY (matched to IFN/GA cohort): 0.32; [1.99 (1.31–3.04)] |
Medium quality |
[44] |
| San Raffaele Hospital, Moiola (2018) |
Conference presentation |
DMF: 2015–2017 FTY: 2011–2016 |
812 |
23–25 months† |
DMF: 0.11 (SD: 0.99); [0.85 (0.54–1.34)] FTY: 0.12 (SD: 0.24) |
Low quality |
[45] |
| SFCTHIR, Lorscheider (2017) |
Conference presentation |
August 2014–NR |
1800 |
Median 0.9 years |
FTY: 0.25 (0.2–0.3); [1 (0.60–1.0)] DMF: 0.20 (0.13–0.30) |
High quality |
[46] |
| Truven, Boster (2017) | Journal article | 2012–2014 | 6372 | 12 months | IFNb vs DMF: 1.27 (1.10–1.46) GA vs DMF: 1.34 (1.17–1.53) TERI vs DMF: 1.23 (1.05–1.45) FTY vs DMF: 1.03 (0.88–1.21) |
Medium quality | [47] |
| Previously treated populations | |||||||
|---|---|---|---|---|---|---|---|
| Baroncini (2016) |
Journal article |
June 2011–February 2014 |
266 |
24 months |
FTY: 0.28 NTZ: 0.06 |
High quality |
[48] |
| Ernst (2017) |
Journal article |
2012–2014 |
450 |
2 years |
IFNb: 0.39 DMF: 0.26 |
Low quality |
[49] |
| MSBase, He (2015) |
Journal article |
July 1996–April 2014 |
790 |
Median 13 months |
FTY: 0.31 (SD: 0.59); [mean difference: 0.10 (0.02–0.19)] IFN/GA: 0.42 (SD: 0.68) |
Medium quality |
[28] |
| MSBase, Kalincik (2015) |
Conference presentation |
Until December 2013 |
578 |
Median 14–21 months† |
NTZ: 0.20 (0.15–0.24) FTY: 0.40 (0.33–0.46) |
High quality |
[30] |
| MSBase, Spelman (2018) |
Conference presentation |
NR–April 2017 |
968 |
Mean 2.6–3.0 years† |
NTZ: 0.17; 0.71 (0.60–0.84) FTY: 0.23 |
Medium quality |
[29] |
| MSBase/TOP, Spelman (2015) |
Journal article |
NR |
4524 |
Mean 1.9–2.2 years† |
IFN/GA: 0.48 (SD: 0.59) NTZ: 0.18 (SD: 0.38) |
Medium quality |
[50] |
| PharMetrics, Bergvall (2014) |
Journal article |
October 2010–March 2012 |
562 |
12 months |
FTY: 0.19; 0.38 (0.21–0.68) GA: 0.51 |
Low quality |
[31] |
| PharMetrics, Bergvall (2013) |
Journal article |
October 2010–September 2011 |
408 |
12 months |
FTY vs GA: 0.47 (0.31–0.72) |
Low quality |
[32] |
| SFCTHIR, Lorscheider (2018) |
Journal article |
July 2011–NR |
547 |
2 years |
NTZ vs FTY: 0.50 (0.30–0.80) |
High quality |
[51] |
| Truven, Ontaneda (2018) |
Journal article |
2012–2016 |
3906 |
≥15 months |
FTY: 0.21 TERI: 0.26 DMF (matched for FTY cohort): 0.23; [1.07 (0.86–1.33)] DMF (matched for TERI cohort): 0.18; [0.67 (0.49–0.91)] |
Medium quality |
[33] |
| Truven, Boster (2016) | Conference presentation | 2012–2015 | 4005 | 12 months | IFNb vs DMF: 1.45 (1.12–1.87) GA vs DMF: 1.37 (1.09–1.72) TERI vs DMF: 1.25 (1.04–1.50) FTY vs DMF: 0.89 (0.75–1.08) |
Low quality | [34] |
Range across treatment groups.
Results missing were not reported in the given study.
ARR: Annualized relapse rate; ALEM: Alemtuzumab; CI: Confidence interval; DMF: Dimethyl fumarate; FTY: Fingolimod; GA: Glatiramer acetate; GRACE: Good Research for Comparative Effectiveness; IFN: Interferon; IQR: Interquartile range; NR: Not reported; NTZ: Natalizumab; SD: Standard deviation; TERI: Teriflunomide.
Due to the varying methods for reporting platform injectable treatments in the RWE studies, any interferon beta (IFN) treatments were analyzed as a single treatment node. However, several studies reported data for patients who received any IFN or glatiramer acetate (GA), and we analyzed this with its own treatment code (i.e., combined IFN/GA) [28,44,52]; this does not include the other IFN or GA treatment arms, which were reported and analyzed separately.
Mixed prior treatment population
The RR for ARR and the corresponding 95% CrI of DMF compared with other treatment options under each analysis scenario are summarized in Table 4. In the base-case analysis, which included treatment effect estimates from 15 publications, DMF was significantly more effective in improving ARR compared with IFN (RR: 0.73; 95%CrI: 0.57, 0.90), GA (RR: 0.72; 95%CrI: 0.57, 0.88), and TERI (RR: 0.69; 95%CrI: 0.55, 0.84). DMF was found to be less effective than alemtuzumab (ALEM) and natalizumab (NTZ), with RRs of 2.06 (95%CrI: 1.39, 2.95) and 1.53 (95%CrI: 1.09, 2.23), respectively. No statistically significant differences were found between DMF and FTY (RR: 1.06; 95%CrI: 0.89, 1.25) or IFN/GA (RR: 0.64; 95%CrI: 0.4, 1.03).
Table 4. . Bayesian RWE NMA Results for ARR.
| Database changed ↓ |
Rate ratio [95% CrI] | tau | |||||||
|---|---|---|---|---|---|---|---|---|---|
| |
DMF vs→ |
ALEM |
FTY |
IFN/GA |
IFN |
NTZ |
GA |
TERI |
|
| Mixed prior treatment | |||||||||
| Base Case |
– |
2.06 [1.39, 2.95]
|
1.06 [0.89, 1.25] |
0.64 [0.40, 1.03] |
0.73 [0.57, 0.90]
|
1.53 [1.09, 2.23]
|
0.72 [0.57, 0.88]
|
0.69 [0.55, 0.84]
|
0.162 |
| A |
MSBase |
2.09 [1.46, 2.91]
|
1.05 [0.9, 1.23] |
0.66 [0.42, 1.03] |
0.76 [0.63, 0.9]
|
1.52 [1.14, 2.06]
|
0.76 [0.63, 0.9]
|
0.65 [0.53, 0.77]
|
0.153 |
| B |
Hersh |
2.07 [1.41, 2.92]
|
1.06 [0.89, 1.25] |
0.65 [0.41, 1.01] |
0.73 [0.58, 0.9]
|
1.52 [1.13, 2.09]
|
0.72 [0.58, 0.88]
|
0.69 [0.55, 0.84]
|
0.157 |
| C |
MSBase |
2.09 [1.46, 2.91]
|
1.05 [0.9, 1.23] |
0.66 [0.42, 1.03] |
0.76 [0.63, 0.9]
|
1.52 [1.14, 2.06]
|
0.76 [0.63, 0.9]
|
0.65 [0.53, 0.77]
|
0.153 |
| D |
Hersh, MSBase |
2.1 [1.46, 2.92]
|
1.06 [0.9, 1.23] |
0.66 [0.42, 1.03] |
0.76 [0.63, 0.9]
|
1.52 [1.14, 2.06]
|
0.76 [0.63, 0.9]
|
0.65 [0.54, 0.77]
|
0.153 |
| E |
MSBase |
2.05 [1.43, 2.8]
|
1.05 [0.89, 1.21] |
0.64 [0.41, 0.98]
|
0.72 [0.58, 0.87]
|
1.49 [1.13, 2.01]
|
0.71 [0.58, 0.85]
|
0.67 [0.54, 0.79]
|
0.141 |
| No correlation‡ |
Hersh, MSBase |
2.2 [1.6, 2.93]
|
1.1 [0.97, 1.24] |
0.69 [0.45, 1.04] |
0.79 [0.66, 0.91]
|
1.65 [1.3, 2.11]
|
0.78 [0.66, 0.91]
|
0.66 [0.57, 0.77]
|
0.134 |
| With correlation‡ | Hersh, MSBase | 2.18 [1.52, 3.01] | 1.06 [0.91, 1.22] | 0.67 [0.43, 1.02] | 0.76 [0.63, 0.90] | 1.59 [1.20, 2.12] | 0.76 [0.64, 0.90] | 0.64 [0.54, 0.76] | 0.150 |
| Previously treated† | |||||||||
|---|---|---|---|---|---|---|---|---|---|
| Base Case |
– |
– |
1.07 [0.35, 3.17] |
0.85 [0.23, 3.76] |
0.67 [0.21, 2.17] |
2.08 [0.64, 8.48] |
0.41 [0.08, 2.05] |
0.67 [0.22, 2.03] |
0.412 |
| A |
MSBase |
– |
1.07 [0.47, 2.41] |
0.84 [0.31, 2.56] |
0.66 [0.27, 1.65] |
2.32 [0.97, 6.71] |
0.41 [0.12, 1.4] |
0.67 [0.29, 1.53] |
0.197 |
| B or C |
Truven |
– |
1.2 [0.59, 2.72] |
0.94 [0.39, 3.1] |
0.68 [0.36, 1.3] |
2.29 [1.05, 6.97]
|
0.66 [0.3, 1.41] |
0.8 [0.35, 1.8] |
0.310 |
| D |
MSBase, Truven |
– |
1.17 [0.73, 2.08] |
0.92 [0.5, 2.07] |
0.69 [0.43, 1.08] |
2.54 [1.46, 5.66]
|
0.68 [0.39, 1.11] |
0.8 [0.47, 1.38] |
0.153 |
| E |
Pharmetrics |
– |
1.07 [0.35, 3.15] |
0.85 [0.23, 3.74] |
0.67 [0.2, 2.17] |
2.09 [0.65, 8.37] |
0.5 [0.1, 2.41] |
0.67 [0.22, 2.03] |
0.415 |
| No correlation‡ |
MSBase, Pharmetrics, Truven |
– |
1.14 [0.86, 1.55] |
0.79 [0.53, 1.3] |
0.66 [0.46, 0.94]
|
2.02 [1.46, 3.22]
|
0.63 [0.43, 0.87]
|
0.75 [0.54, 1.01] |
0.146 |
| With correlation‡ | MSBase, Pharmetrics, Truven | – | 1.15 [0.77, 1.72] | 0.84 [0.51, 1.66] | 0.68 [0.45, 1.03] | 2.09 [1.32, 3.93] | 0.66 [0.41, 1.02] | 0.76 [0.48, 1.13] | 0.186 |
Bold values are statistically significant.
In the previously treated dataset, Scenario B contains the same set of studies as the base case and is therefore not presented.
Scenario including all related publications.
Selection of articles based on the different analytic scenarios was as follows: Base Case: Most recent cohort, journal article, longer follow-up; A: Study quality (per GRACE assessment); B: Larger sample size; C: More DMTs; D: Study quality, larger sample size, more DMTs; E: None, i.e., other eligible studies with no discernible strengths.
ALEM: Alemtuzumab; CrI: Credible interval; DMF: Dimethyl fumarate; FTY: Fingolimod; GA: Glatiramer acetate; IFN: Interferon; NTZ: Natalizumab; TERI: Teriflunomide.
When selecting alternate publications to include in the analysis (i.e., scenarios A to E), the results were largely similar to the base case. For example, the range of RRs for DMF versus FTY was just 1.05–1.06. The widest variations were seen for DMF versus ALEM (ranging from 2.05–2.10) and DMF versus GA (ranging 0.71–0.76). Although CrIs were slightly narrower in scenarios A to E compared with the base-case scenario, a considerable overlap was still observed across all scenarios. There were no changes in statistical significance of RRs, except for the comparison between DMF and IFN/GA (platform injectables) under scenario E, where DMF was found to be superior (RR: 0.64; 95%CrI: 0.41, 0.98).
When the analyses were conducted including all related publications while ignoring their potential correlation, the RRs shifted slightly compared with the scenarios that included just one publication per study. Except for DMF versus TERI, no RRs fell in the range of those obtained across the scenarios accounting for related publications (i.e., the base case and scenarios A to E). For example, the RRs across the scenarios accounting for related publications for DMF versus FTY ranged from 1.05–1.06, but the “all related publications (no correlation)” scenario yielded an RR of 1.1.
As expected, when assuming the presence of correlated data in the “all related publications” scenario, RR estimates were closer to the ones obtained in the base-case scenario and scenarios A to E. However, the RRs for comparisons with ALEM, IFN/GA, NTZ, or TERI still fell outside the range of the RR estimates generated in the base-case scenario and scenarios A to E.
The CrIs in the “all related publications” scenarios tended to be narrower across all contrasts compared with the base case and scenarios A to E, even when accounting for correlation between related results. However, there were no changes in statistical significance in either scenarios compared with the base case.
Results of sensitivity analyses for increasing the correlations (data not shown) were largely similar to those assuming the set of correlations of 0.50, 0.50, and 0.25 for such contrasts.
Previously treated population
In the base-case analysis, the effectiveness of DMF was not statistically significant compared with other DMTs, with RRs ranging from 0.41–2.08. This analysis was conducted in a small dataset (eight publications of seven unique databases) and is subject to notable statistical heterogeneity. In particular, the network estimate of common between-study standard deviation, was τ = 0.412, with a 95% CrI ranging from 0.09–0.94. This estimate implies that DMTs with equal efficacy (i.e., RR = 1) on average could still yield a true RR ranging from exp(-1.96 × 0.412) = 0.45 to exp(1.96 × 0.412) = 2.24 in individual study populations. Random-effects variance could be estimated for only the NTZ versus FTY contrast (as no other comparisons had ≥2 studies), with an I2 of 79% and τ of 0.45 for this comparison (in pairwise meta-analysis). This was driven largely by the inclusion of Spelman et al. [29], which found a more modest benefit of NTZ versus FTY (RR = 0.71) compared with other studies (RRs ranging from 0.21–0.5); this study included patients with prior TERI, DMF, IFN, or GA use, whereas the other studies only included patients with prior IFN or GA use.
When selecting alternate publications to include in the analysis (i.e., scenarios A to E), the results were relatively similar to the base case; however, the variations in RRs were relatively larger in this patient population. For instance, the RR for DMF versus NTZ increased from 2.08 in the base case to 2.54 in scenario D. Similarly, the RR for DMF versus GA increased from 0.41 in the base case to 0.68 in scenario D (Table 4).
The changes in these scenarios were notably driven by the inclusion of the Boster et al. [34] analysis of the Truven database (which included contrasts of more DMTs) and the substitution of Spelman et al. [29] with Kalincik et al. 2015 [30] from the MSBase database (which reduced the RR of NTZ vs FTY from this database from 0.71 to 0.5). Not surprisingly, in a sparse network, if there happens to be conflict between two related publications, the choice between those publications can have a notable impact as results from that parent database will have a great deal of leverage.
When the analyses were conducted including all related publications while ignoring their potential correlation, many RRs fell within the range obtained across the scenarios accounting for related publications (i.e., the base case and scenarios A to E). However, there were notable differences in the pooled estimates from the base case (Table 4). Additionally, CrIs were narrower, resulting in statistical significance for many treatment comparisons, where DMF was found to be significantly more effective in reducing ARR compared with IFN and GA and less effective compared with NTZ.
When assuming the presence of correlation between related publications, RR estimates were similar to the base case and scenarios A to E. The CrIs in “all related publications” scenarios tended to be narrower across all contrasts compared with the base case and scenarios A to E; this resulted in the benefit of NTZ over DMF becoming statistically significant.
Discussion
We used the data originating from a previous NMA [15], which evaluated the comparative effectiveness of DMF and other DMTs in RRMS, to assess the impact of various methods of analyzing the selection between related publications with competing results in NMAs of RWE. The analysis demonstrated that the results in an NMA are not necessarily meaningfully affected by the criteria used to select among related publications. Nevertheless, this is likely dependent on an interplay of multiple factors related to the complexity of network, the number of related publications, and between-study heterogeneity.
In the NMA focusing on a mixed prior treatment population, many studies were available for estimation of pooled RRs, and statistical heterogeneity was low. Thus, strategies to handle related publications did not impact overall study conclusions in this network, and pooled RR estimates varied only slightly from the base case. However, when the network was based on a relatively small number of publications and prone to substantial between-study heterogeneity, the selection between the different strategies for handling related publications greatly affected statistical conclusions on the real-world comparative effectiveness between certain DMTs.
This situation was demonstrated in the previously treated patient population, where pooled estimates and corresponding CrIs greatly differed from the base-case scenario for several treatment comparisons. The largest changes were introduced by the prioritization of the Boster et al. [34] study of the Truven database (a poster presentation from 2016 presenting RRs for more comparators) over the Ontaneda et al. [33] study (a peer-reviewed journal article with more recent follow-up). While both publications reported very similar treatment effect estimates, the introduction of additional comparators by Boster et al. allowed for more indirect connections in the network, which influenced other comparisons. The results were likely particularly sensitive to changes in the Truven database, because these studies were the largest in the network; arm-level sample sizes ranged from 127 to 2858 in the Truven studies and just 41 [49] to 484 [29] among the other studies in the network. Therefore, it seems that variability in the NMA estimates may arise from the inclusion of related publications, unless the NMA is based on many studies and larger sample size, with limited statistical heterogeneity.
These analyses further demonstrated the dangers of ignoring related publications. The scenario that included all related publications in a given analysis not only overestimates the precision of the results but also causes a shift in the point estimates. This sign of potential bias was demonstrated by the point estimates of the “all related publications” scenarios falling, in most cases, outside the range of point estimates obtained with other scenarios in which only one of the related publications for a given database was included. This would occur most dramatically for studies where the point estimates fall further from the mean of all studies in a given treatment comparison (although data were limited to fully demonstrate this in our dataset).
In addition, the results in the “all related publications” scenario may have been impacted by publication bias. For instance, the RRs across the scenarios selecting individual publications among the related publications (base case and scenarios A to E) for DMF versus FTY in the mixed prior treatment population ranged from 1.05–1.06, but when all related publications were included, an RR of 1.1 was obtained. This variation can be explained by the fact that the studies with related publications have higher RRs (ranging from 1.14 to 1.59) for DMF versus FTY than the studies without related publications (0.85 to 1.09). Therefore, the inclusion of all published studies (including related publications) shifted the pooled estimate in favor of FTY leading to subsequently higher overall RR. This also suggests that studies of databases yielding a greater advantage for FTY are more frequently published than the studies of databases yielding an advantage for DMF; thus, including all related publications shifts the estimate in favor of FTY.
When including all related publications in the larger network with lower heterogeneity (mixed prior treatment), the shift in pooled estimates and over precision were present but minimal, and it did not ultimately change the conclusion of the results. However, in the previously treated network that was based on fewer and smaller studies, the choice for handling related publications affected study conclusions for three out of the six comparisons, resulting in cases where we found inconsistent examples of statistically significant differences between treatments. Attempting to correct for presumed correlations of the results within databases, accounting for the correlation did not fully correct the potential bias in the point estimates, though it did resolve the misleading study conclusions (although CrIs were still notably narrower than the base case).
Alternative approaches such as three-level meta-analysis have been proposed to handle data originating from related publications with the aim of leveraging all the available evidence [53,54]. While the three-level meta-analysis approach addresses the dependence of effect sizes nested across related studies within database, it assumes that sampling errors are conditionally independent of the database effect. Thus, for instance, if within a database all effects are statistically homogeneous (which might be expected when there is high patient overlap), the precision of the estimated database effect will be improperly estimated as too high. This can be explicitly avoided by accounting for the within-database correlations, which will consequently modify the precision of a database estimate. Considering the high level of sampling dependency in related RWE studies originating from the same database, adopting a three-level meta-analysis will likely contribute to arguably misleading precision, and will tend to be more severe the greater the overlap in study participants across related publications. This is further illustrated using simulated data originating from RWE databases in the Supplementary Material. While this threat of overestimating precision (i.e., underestimating sampling error) in a standard three-level model should be considered, it is common in meta-analyses of RWE studies for random-effects variation between-databases to be considerable relative to sampling error (i.e., for there to be high values of I2). This may often result in databases being weighted somewhat equally in a random-effects analysis with high random-effects variation. On the other hand, a three-level meta-analytic approach could be potentially adequate in the event there is a clear mismatch in the PICO among related publications originating from the same database; as such, the results from these related publications correspond to distinct patient cohorts from the same database.
Thus, the precision of estimates-by-database is less important than getting the most accurate estimate for a given database, particularly in the context of non-peer reviewed data, like that from conference abstracts. In our case study, we observed two conference abstracts with very similar methodology to a published paper of the MSBase database which showed notably different effects (for example, 1.59 vs 1.16 for TERI vs DMF) [23,24,27]. With established inconsistencies and lower quality reporting in conference abstracts [55], we argue that in such a case, it is far better to use solely the estimate originating from the peer-reviewed original article than it is to average across related publications, whether with a multivariate approach or a three-level model. However, it may be that in instances where the sampling dependence is much weaker and the difference in strength of evidence is more similar, it may be reasonable to employ meta-analytic models that adjust for the correlation among related publications, utilize a hierarchical approach, or simply treat very weakly correlated study results as independent. Additionally, to ensure a transparent decision-making process, a qualitative synthesis of the study characteristics and outcomes of related publications should be included in RWE NMAs.
While our case study reinforced the relevance of modeling strategies for handling competing results in related publications in NMAs of RWE, our findings have some limitations. Certain comparisons were limited to a small number of databases, which undermined the statistical power to detect significant differences. For instance, data on the combined IFN/GA node were limited to a single database (PharMetrics) in the mixed prior network and to two databases in the previously treated network (MSBase and MSBase/TYSABRI Observational Program). Therefore, this could explain the lack of statistical significance for DMF versus combined IFN/GA in most analytic scenarios of both networks. In addition, our case study was limited to RWE NMAs in multiple sclerosis. While we do not anticipate major deviations in our conclusions for other disease areas, it would be valuable to investigate the generalizability of our findings in other disease areas, such as cancer and cardiovascular diseases. Furthermore, unique to the use of RWE studies is the inability to accurately account for the actual number of patients included in each network; many of the included studies involve matching techniques, which result in having different effective sample sizes for the same treatment in different comparisons. Lastly, the criteria examined in this case represent only a selected set of potential criteria for consideration, as this dataset was notably homogenous with respect to applicability to the research question.
Conclusion
When conducting an NMA of RWE, a hierarchy should be established a priori for determining the selection of individual studies with multiple related publications. Although these criteria may not have much impact on the overall study conclusions when NMAs are based on many large studies, their implementation becomes particularly critical in NMAs involving few and heterogeneous studies. We recommend prioritizing selection criteria that align with the PICOS of the review question, and thus to consider the applicability of the study population, choice of effect measure, handling of intercurrent events, and other domains in the estimands framework [56]. In addition, to ensure complete transparency, it is important that investigators clearly present the variability in baseline characteristics and outcomes of interest from related publications originating from the same database.
In cases where substantial statistical heterogeneity is observed, sensitivity analyses examining alternate related publication selections should be conducted. Analyses including all related publications should be avoided as they may introduce bias and give undue weight to studies with many publications, even when attempting to correct for such clustering or correlation.
Summary points
In systematic literature reviews (SLRs), it is common to identify multiple publications using the same data source. While selection among related publications in network meta-analyses (NMAs) of randomized controlled trials is straightforward, this is particularly challenging in NMAs of real-world evidence (RWE), when a pivotal publication cannot be identified due to differences in, for instance, follow-up time, study populations, or analytical approaches.
This study examines and illustrates eight scenario analyses for handling related publications in NMA of RWE. Different hierarchical approaches in selecting among related approaches were followed, where selection criteria varied based on the recency of the analysis, methodological strength, sample size, number of disease-modifying therapies evaluated, type of publication, follow-up time, or a combination of these factors. In addition, analyses were conducted including all related publications while assuming various level of correlation between related publications.
Our study used an illustrative example from two NMAs (one large network with low statistical heterogeneity; another smaller network with higher statistical heterogeneity) that compare dimethyl fumarate to other disease-modifying treatments in multiple sclerosis.
Selecting alternate related publications from the same data source yielded fairly similar NMA results in the larger network that had lower statistical heterogeneity. However, the choice of the included publication had larger and more meaningful impacts on the NMA results in the network that was smaller with higher statistical heterogeneity.
When scenarios were conducted including all related publications in the NMAs (instead of selecting one pivotal study), pooled estimates and overall conclusions often changed substantially, even when accounting for correlation.
While three-level meta-analysis accounts for the dependence of effect sizes and can properly address some clustering variables from related publications, it assumes that within-cluster sampling errors are conditionally independent, which is unlikely when results are based on (nearly) the same data. Hence, three-level meta-analysis models to account for related publications in RWE NMAs may generate pooled estimates based on improper study weights.
Our study demonstrated that the analyses in NMAs with higher numbers of publications, lower statistical heterogeneity, and larger sample sizes may result in direct and indirect estimates that are less sensitive to the choice of included publication based on different selection criteria.
Future NMAs of RWE should establish an a priori hierarchy for selecting among individual studies to include when multiple related publications are available. We recommend prioritizing studies that best align with the scope of the review question (e.g., in terms of population, intervention, comparator and outcome) and the lowest risk of bias. Critical appraisal tools such as the Good Research for Comparative Effectiveness or Risk Of Bias In Non-randomised Studies - of Interventions tools may help assess these characteristics of RWE studies, and thus selecting the most relevant publication for inclusion in the NMA.
In NMAs where substantial statistical heterogeneity is observed, sensitivity analyses examining alternate related publication selections should be considered.
Supplementary Material
Acknowledgments
The authors thank Shruti Nambiar for her contributions in designing and conducting the original systematic literature review/network meta-analysis. Marvin Rock is currently an employee at Gilead Sciences.
Footnotes
Supplementary data
To view the supplementary data that accompany this paper please visit the journal website at: https://bpl-prod.literatumonline.com/doi/10.57264/cer-2022-0132
Author contributions
M Betts, K Fahrbach, and M Rock were responsible for study conception and design; K Fahrbach and B Neupane were responsible for data analysis; M Betts, K Fahrbach, B Neupane, M Slim and T Debray were responsible for interpreting the results. All authors were responsible for revising the manuscript critically.
Financial & competing interests disclosure
This study was funded by Biogen. M Betts, K Fahrbach, B Neupane, and M Slim: employed by Evidera, a part of Thermo Fisher Scientific. G Cutter: employed by the University of Alabama at Birmingham and President of Pythagoras, Inc. a private consulting company located in Birmingham AL; served on data and safety monitoring boards for Applied Therapeutics, AI therapeutics, AMO Pharma, Astra-Zeneca, Avexis Pharmaceuticals, Biolinerx, Brainstorm Cell Therapeutics, Bristol Meyers Squibb/Celgene, CSL Behring, Galmed Pharmaceuticals, Green Valley Pharma, Horizon Pharmaceuticals, Immunic, Karuna Therapeutics, Mapi Pharmaceuticals LTD, Merck, Mitsubishi Tanabe Pharma Holdings, Opko Biologics, Prothena Biosciences, Novartis, Regeneron, Sanofi-Aventis, Reata Pharmaceuticals, NHLBI (Protocol Review Committee), University of Texas Southwestern, University of Pennsylvania, Visioneering Technologies, Inc; served on consulting or advisory boards for Alexion, Antisense Therapeutics, Biogen, Clinical Trial Solutions LLC, Entelexo Biotherapeutics, Inc., Genzyme, Genentech, GW Pharmaceuticals, Immunic, Klein-Buendel Incorporated, Merck/Serono, Novartis, Osmotica Pharmaceuticals, Perception Neurosciences, Protalix Biotherapeutics, Recursion/Cerexis Pharmaceuticals, Regeneron, Roche, SAB Biotherapeutics. The authors have no other relevant affiliations or financial involvement with any organization or entity with a financial interest in or financial conflict with the subject matter or materials discussed in the manuscript apart from those disclosed.
No writing assistance was utilized in the production of this manuscript.
Data sharing statement
The network meta-analysis was conducted using published data from real-world evidence studies.
References
Papers of special note have been highlighted as: • of interest; •• of considerable interest
- 1.Hatswell AJ, Baio G, Berlin JA, Irs A, Freemantle N. Regulatory approval of pharmaceuticals without a randomised controlled study: analysis of EMA and FDA approvals 1999–2014. BMJ Open 6(6), e011666 (2016). [DOI] [PMC free article] [PubMed] [Google Scholar]
- 2.Sherman RE, Anderson SA, Dal Pan GJ et al. Real-world evidence – what is it and what can it tell us? N. Engl. J. Med. 375(23), 2293–2297 (2016). [DOI] [PubMed] [Google Scholar]; •• An overview of the key dimensions of real-word evidence studies including research setting and methdological approaches.
- 3.Black N. Why we need observational studies to evaluate the effectiveness of health care. BMJ 312(7040), 1215–1218 (1996). [DOI] [PMC free article] [PubMed] [Google Scholar]
- 4.Canadian Agency for Drugs and Technologies in Health (CADTH). Real-world evidence: a primer. (2023). https://www.cadth.ca/real-world-evidence-primer
- 5.Food and Drug Administration (FDA). Framework for FDA's real-world evidence program. (2022). https://www.fda.gov/media/120060/download ; • The FDA framework for implemeting the realworld evidence program to help support regulatory decisions.
- 6.Canadian Agency for Drugs and Technologies in Health (CADTH). Guidance for reporting real-world evidence. (2023). https://www.cadth.ca/sites/default/files/RWE/MG0020/MG0020-RWE-Guidance-Report.pdf ; • CADTH global guidance on the principles and standards for reporting on RWE studies.
- 7.Sarri G, Patorno E, Yuan H et al. Framework for the synthesis of non-randomised studies and randomised controlled trials: a guidance on conducting a systematic review and meta-analysis for healthcare decision making. BMJ Evid. Based Med. 27(2), 109–119 (2022). [DOI] [PMC free article] [PubMed] [Google Scholar]; •• A framework providing researchers guidance on when and how to synthesize the evidence originating from non-randomized studies and randomized controlled trials.
- 8.National Institute for Health and Care Excellence (NICE). Changes we're making to health technology evaluation. (2022). https://www.nice.org.uk/about/what-we-do/our-programmes/nice-guidance/nice-technology-appraisal-guidance/changes-to-health-technology-evaluation
- 9.Abrahami D, Pradhan R, Yin H, Honig P, Baumfeld Andre E, Azoulay L. Use of real-world data to emulate a clinical trial and support regulatory decision making: assessing the impact of temporality, comparator choice, and method of adjustment. Clin. Pharmacol. Ther. 109(2), 452–461 (2021). [DOI] [PubMed] [Google Scholar]
- 10.Senn SJ. Overstating the evidence: double counting in meta-analysis and related problems. BMC Med. Res. Methodol. 9, 10 (2009). [DOI] [PMC free article] [PubMed] [Google Scholar]; • Illustrates the problems associated with double counting of related publications and provides some examples from the published literature.
- 11.Higgins JPT, Thomas J, Chandler Jet al.. et al. (Eds). Cochrane Handbook for Systematic Reviews of Interventions version 6.3. Cochrane; (2022). http://www.training.cochrane.org/handbook [Google Scholar]
- 12.Jenkins DA, Hussein H, Martina R, Dequen-O'byrne P, Abrams KR, Bujkiewicz S. Methods for the inclusion of real-world evidence in network meta-analysis. BMC Med. Res. Methodol. 21(1), 207 (2021). [DOI] [PMC free article] [PubMed] [Google Scholar]
- 13.Zhang J, Tang J, Cui X et al. Indirect comparison of novel oral anticoagulants among Asians with non-valvular atrial fibrillation in the real world setting: a network meta-analysis. BMC Cardiovasc. Disord. 19(1), 182 (2019). [DOI] [PMC free article] [PubMed] [Google Scholar]
- 14.Hill NR, Sandler B, Bergrath E et al. A systematic review of network meta-analyses and real-world evidence comparing apixaban and rivaroxaban in nonvalvular atrial fibrillation. Clin. Appl. Thromb. Hemost. 26, 1076029619898764 (2020). [DOI] [PMC free article] [PubMed] [Google Scholar]
- 15.Cutter G, Sormani MP, Betts M et al. Comparative effectiveness of delayed-release dimethyl fumarate vs. other disease-modifying therapies in patients with multiple sclerosis: a network meta-analysis of real-world evidence (Abstract: p1394). 35th Congress of the European Committee for Treatment and Research in Multiple Sclerosis. Stockholm, Sweden: (2019). [Google Scholar]; • A systematic literature review and network meta-analysis evaluating the comparative effectiveness among different disease-modifying therapies in multiple sclerosis.
- 16.Trapp BD, Ransohoff R, Rudick R. Axonal pathology in multiple sclerosis: relationship to neurologic disability. Curr. Opin. Neurol. 12(3), 295–302 (1999). [DOI] [PubMed] [Google Scholar]
- 17.Compston A, Coles A. Multiple sclerosis. Lancet 359(9313), 1221–1231 (2002). [DOI] [PubMed] [Google Scholar]
- 18.Multiple Sclerosis Society (MS Society UK). Relapsing remitting MS (RRMS). (2023). https://www.mssociety.org.uk/about-ms/types-of-ms/relapsing-remitting-ms
- 19.Multiple Sclerosis Trust. Managing relapses. (2023). https://mstrust.org.uk/information-support/ms-symptoms-diagnosis/managing-ms-relapses
- 20.Gallo P, Van Wijmeersch B, Paradig MSG. Overview of the management of relapsing-remitting multiple sclerosis and practical recommendations. Eur. J. Neurol. 22(Suppl. 2), 14–21 (2015). [DOI] [PubMed] [Google Scholar]
- 21.Finkelsztejn A. Multiple sclerosis: overview of disease-modifying agents. Perspect. Medicin. Chem. 6, 65–72 (2014). [DOI] [PMC free article] [PubMed] [Google Scholar]
- 22.Moher D, Liberati A, Tetzlaff J, Altman DG, Group P. Preferred reporting items for systematic reviews and meta-analyses: the PRISMA statement. PLoS Med. 6(7), e1000097 (2009). [DOI] [PMC free article] [PubMed] [Google Scholar]
- 23.Kalincik T, Kubala Havrdova E, Horakova D et al. Comparison of fingolimod, dimethyl fumarate and teriflunomide for multiple sclerosis. J. Neurol. Neurosurg. Psychiatry 90(4), 458–468 (2019). [DOI] [PubMed] [Google Scholar]
- 24.Spelman T, Kalincik T, Trojano M et al. Comparative analysis of MS outcomes in dimethyl fumarate-treated patients relative to propensity matched fingolimod, teriflunomide, interferon or glatiramer acetate. Presented at: 32nd Congress of the European Committee for Research and Treatment of Mulitple Sclerosis. Royston, UK: (2016). [Google Scholar]
- 25.Hersh CM, Love TE, Bandyopadhyay A et al. Comparative efficacy and discontinuation of dimethyl fumarate and fingolimod in clinical practice at 24-month follow-up. Mult. Scler. J. Exp. Transl. Clin. 3(3), 2055217317715485 (2017). [DOI] [PMC free article] [PubMed] [Google Scholar]
- 26.Hersh CM, Love TE, Cohn S et al. Comparative efficacy and discontinuation of dimethyl fumarate and fingolimod in clinical practice at 12-month follow-up. Mult. Scler. Relat. Disord. 10, 44–52 (2016). [DOI] [PubMed] [Google Scholar]
- 27.Kalincik T, Spelman T, Jokubaitis V et al. Effectiveness of fingolimod, dimethyl fumarate and teriflunomide in relapsing-remitting multiple sclerosis: a comparative longitudinal study. Presented at: 7th Joint ECTRIMS-ACTRIMS Meeting. Paris, France: (2017). [Google Scholar]
- 28.He A, Spelman T, Jokubaitis V et al. Comparison of switch to fingolimod or interferon beta/glatiramer acetate in active multiple sclerosis. JAMA Neurol. 72(4), 405–413 (2015). [DOI] [PubMed] [Google Scholar]
- 29.Spelman T et al. Comparative effectiveness of switching to natalizumab or fingolimod after relapse on first-line relapsing-remitting multiple sclerosis therapy: propensity score matching analysis from the MBase registry. Presented at: 34th Congress of the European Committee for Treatment and Research in Multiple Sclerosis. Berlin, Germany: (2018). [Google Scholar]
- 30.Kalincik T, Horakova D, Spelman T et al. Switch to natalizumab versus fingolimod in active relapsing-remitting multiple sclerosis. Ann. Neurol. 77(3), 425–435 (2015). [DOI] [PubMed] [Google Scholar]
- 31.Bergvall N, Makin C, Lahoz R et al. Relapse rates in patients with multiple sclerosis switching from interferon to fingolimod or glatiramer acetate: a US claims database study. PLOS ONE 9(2), e88472 (2014). [DOI] [PMC free article] [PubMed] [Google Scholar]
- 32.Bergvall N, Lahoz R, Agashivala N et al. Relapse rates among patients with multiple sclerosis who switch from interferon therapy to fingolimod or glatiramer acetate: a retrospective US claims database analysis. Presented at: 29th Congress of the European Committee for Treatment and Research in Multiple Sclerosis. Copenhagen, Denmark: (2013). [Google Scholar]
- 33.Ontaneda D, Nicholas J, Carraro M et al. Comparative effectiveness of dimethyl fumarate versus fingolimod and teriflunomide among MS patients switching from first-generation platform therapies in the US. Mult. Scler. Relat. Disord. 27, 101–111 (2019). [DOI] [PubMed] [Google Scholar]
- 34.Boster A, Nicholas J, Wu N et al. Annual relapse rates in patients with multiple sclerosis treated with different disease-modifying therapies – findings from a real-world setting. Presented at: 32nd Congress of the European Committee for Treatment and Research in Multiple Sclerosis. Royston, UK: (2016). [Google Scholar]
- 35.Guger M, Enzinger C, Leutmezer F et al. Real-life clinical use of natalizumab and fingolimod in Austria. Acta Neurol. Scand. 137(2), 181–187 (2018). [DOI] [PubMed] [Google Scholar]
- 36.Guger M, Enzinger C, Leutmezer F et al. Effects of real life use of oral disease modifying treatments for relapsing-remitting multiple sclerosis in Austria over one year. Presented at: 34th Congress of the European Committee for Treatment and Research in Multiple Sclerosis. Berlin, Germany: (2018). [Google Scholar]
- 37.Buron M, Chalmer T, Sellebjerg F et al. Comparative effectiveness of teriflunomide and dimethyl fumarate in relapsing-remitting multiple sclerosis. Presented at: 34th Congress of the European Committee for Treatment and Research in Multiple Sclerosis. Berlin, Germany: (2018). [Google Scholar]
- 38.Koch-Henriksen N, Magyari M, Sellebjerg F, Sørensen PS. A comparison of multiple sclerosis clinical disease activity between patients treated with natalizumab and fingolimod. Mult. Scler. J. 23(2), 234–241 (2017). [DOI] [PubMed] [Google Scholar]
- 39.Sloane J, Phillips JT, Calkwood J et al. Delayed-release dimethyl fumarate demonstrated no difference in clinical outcomes versus fingolimod in patients with relapsing-remitting multiple sclerosis: results from the real-world EFFECT Study. Presented at: 7th Joint ECTRIMS-ACTRIMS Meeting. Paris, France: (2017). [Google Scholar]
- 40.Chan A, Cohan S, Stark J et al. Treatment with delayed-release dimethyl fumarate is associated with fewer relapses versus glatiramer acetate in patients with relapsing-remitting multiple sclerosis: real-world comparative effectiveness analyses from the EFFECT Study. Presented at: 7th Joint ECTRIMS-ACTRIMS Meeting. Paris, France: (2017). [Google Scholar]
- 41.Conde S, Moisset X, Pereira B et al. Dimethyl fumarate and teriflunomide for multiple sclerosis in a real-life setting: a French retrospective cohort study. Eur. J. Neurol. 26(3), 460–467 (2019). [DOI] [PubMed] [Google Scholar]
- 42.Kalincik T, Brown JWL, Robertson N et al. Treatment effectiveness of alemtuzumab compared with natalizumab, fingolimod, and interferon beta in relapsing-remitting multiple sclerosis: a cohort study. Lancet Neurol. 16(4), 271–281 (2017). [DOI] [PubMed] [Google Scholar]
- 43.Braune S, Grimm S, Van Hovell P et al. Comparative effectiveness of delayed-release dimethyl fumarate versus interferon, glatiramer acetate, teriflunomide, or fingolimod: results from the German NeuroTransData registry. J. Neurol. 265(12), 2980–2992 (2018). [DOI] [PMC free article] [PubMed] [Google Scholar]
- 44.Bergvall N, Makin C, Lahoz R et al. Comparative effectiveness of fingolimod versus interferons or glatiramer acetate for relapse rates in multiple sclerosis: a retrospective US claims database analysis. Curr. Med. Res. Opin. 29(12), 1647–1656 (2013). [DOI] [PubMed] [Google Scholar]
- 45.Moiola L, Esposito F, Di Cristinzi M et al. Comparative effectiveness of dimethyl fumarate and fingolimod in an Italian monocentric cohort relapsing remitting multiple sclerosis patients. Presented at: 34th Congress of the European Committee for Treatment and Research in Multiple Sclerosis. Berlin, Germany: (2018). [Google Scholar]
- 46.Lorscheider J, Benkert P, Lienert C et al. Fingolimod vs. dimethyl fumarate in relapsing-remitting MS: propensity score-matched comparison in a large observational data set. Presented at: 7th Joint ECTRIMS-ACTRIMS Meeting. Paris, France: (2017). [Google Scholar]
- 47.Boster A, Nicholas J, Wu N et al. Comparative effectiveness research of disease-modifying therapies for the management of multiple sclerosis: analysis of a large health insurance claims database. Neurol. Ther. 6(1), 91–102 (2017). [DOI] [PMC free article] [PubMed] [Google Scholar]
- 48.Baroncini D, Ghezzi A, Annovazzi PO et al. Natalizumab versus fingolimod in patients with relapsing-remitting multiple sclerosis non-responding to first-line injectable therapies. Mult. Scler. 22(10), 1315–1326 (2016). [DOI] [PubMed] [Google Scholar]
- 49.Ernst FR, Barr P, Elmor R, Wong SL. Relapse outcomes, safety, and treatment patterns in patients diagnosed with relapsing-remitting multiple sclerosis and initiated on subcutaneous interferon beta-1a or dimethyl fumarate: a real-world study. Curr. Med. Res. Opin. 33(12), 2099–2106 (2017). [DOI] [PubMed] [Google Scholar]
- 50.Spelman T, Kalincik T, Zhang A et al. Comparative efficacy of switching to natalizumab in active multiple sclerosis. Ann. Clin. Transl. Neurol. 2(4), 373–387 (2015). [DOI] [PMC free article] [PubMed] [Google Scholar]
- 51.Lorscheider J, Benkert P, Lienert C et al. Comparative analysis of natalizumab versus fingolimod as second-line treatment in relapsing–remitting multiple sclerosis. Mult. Scler. 24(6), 777–785 (2018). [DOI] [PubMed] [Google Scholar]
- 52.Spelman T, Bergvall N, Tomic D et al. Real-world comparative effectiveness of Fingolimod and Interferon/Glatiramer therapies in a switch population using propensity-matched data from MSBase. Presented at: 29th Congress of the European Committee for Treatment and Research in Multiple Sclerosis. Copenhagen, Denmark: (2013). [Google Scholar]
- 53.Cheung MW. A guide to conducting a meta-analysis with non-independent effect sizes. Neuropsychol. Rev. 29(4), 387–396 (2019). [DOI] [PMC free article] [PubMed] [Google Scholar]; • Describes the multivariate and three-level meta-analysis approaches for handling non-independent effect sizes.
- 54.Konstantopoulos S. Fixed effects and variance components estimation in three-level meta-analysis. Res. Synth. Methods 2(1), 61–76 (2011). [DOI] [PubMed] [Google Scholar]; • Discusses Fisher scoring approach in two-level and three-level meta-analyses.
- 55.Pitkin RM, Branagan MA, Burmeister LF. Accuracy of data in abstracts of published research articles. JAMA 281(12), 1110–1111 (1999). [DOI] [PubMed] [Google Scholar]
- 56.International Council for Harmonisation of Technical Requirements for Pharmaceuticals for Human Use. Addendum on Estimands and Sensitivity Analysis in Clinical Trials, to the Guideline On Statistical Principles for Clinical Trials (2019). https://database.ich.org/sites/default/files/E9-R1_Step4_Guideline_2019_1203.pdf ; • International Council for Harmonisation framework for constructing estimands and sensitivity analyses in clinical trials.
- 57.metafor-package: metafor: A Meta-Analysis Package for R (2022). https://www.rdocumentation.org/packages/metafor/versions/3.0-2/topics/metafor-package
Associated Data
This section collects any data citations, data availability statements, or supplementary materials included in this article.