

Abstract
Tuberculosis (TB) is a leading cause of mortality attributed to an infectious agent. TB primarily targets the lungs, but in about 16% cases can affect other organs as well, giving rise to extrapulmonary TB (EPTB). However, an optimal regimen for EPTB treatment is not defined. Although the recommended treatment for most forms of EPTB is the same as pulmonary TB, the pharmacokinetics of EPTB therapy are not as well studied. To address this gap, we formulate a whole‐body physiologically‐based pharmacokinetic (PBPK) model for EPTB that for the first time includes the ability to simulate drug concentrations in the pleura and lymph node, the most commonly affected sites of EPTB. Using this model, we estimate the time‐dependent concentrations, at potential EPTB infection sites, of the following four first‐line anti‐TB drugs: rifampicin, ethambutol, isoniazid, and pyrazinamide. We use reported plasma concentration kinetics data to estimate model parameters for each drug and validate our model using reported concentration data not used for model formulation or parameter estimation. Model predictions match the validation data, and reported pharmacokinetic parameters (maximum plasma concentration, time to reach maximum concentration) for the drugs. The model also predicts ethambutol, isoniazid, and pyrazinamide concentrations in the pleura that match reported experimental values from an independent study. For each drug, the predicted drug concentrations at EPTB sites are compared with their critical concentration. Simulations suggest that although rifampicin and isoniazid concentrations are greater than critical concentration values at most EPTB sites, the concentrations of ethambutol and pyrazinamide are lower than their critical concentrations at most EPTB sites.
Study Highlights.
WHAT IS THE CURRENT KNOWLEDGE ON THE TOPIC?
Several whole‐body physiologically‐based pharmacokinetic (PBPK) models evaluating the pharmacokinetics of anti‐tuberculosis (TB) drugs in adults have been developed with a focus on pulmonary TB. However, these models do not address the two major extrapulmonary TB (EPTB) sites: pleura and lymph nodes.
WHAT QUESTION DID THIS STUDY ADDRESS?
This study seeks to formulate a whole‐body PBPK model to predict drug concentrations at various EPTB sites. We use this new model to predict the pharmacokinetics of drugs in extrapulmonary organs.
WHAT DOES THIS STUDY ADD TO OUR KNOWLEDGE?
To our knowledge, this is the first model to study the pharmacokinetics for pleural and lymph node TB. It provides reasonable predictions in some cases, such as concentrations of most of the drugs in the pleura. Data are required to validate predictions at other sites.
HOW MIGHT THIS CHANGE DRUG DISCOVERY, DEVELOPMENT, AND/OR THERAPEUTICS?
EPTB treatment needs to be addressed and optimized. PBPK modeling can be used to design new, more effective treatment regimens. This model will serve as the starting point for the development of models for EPTB treatment.
INTRODUCTION
Tuberculosis (TB) is an infectious disease caused by the pathogen Mycobacterium tuberculosis. It is spread when aerosol droplets containing the bacteria are inhaled by a susceptible individual. 1 The World Health Organization (WHO) predicts that in 2019, approximately 10 million people fell ill with TB and 1.4 million people died from it. 2 This large mortality number has only continued to increase, with an estimated 1.6 million deaths in 2021. 3 According to the WHO, TB is one of the major causes of mortality among adults attributed to a single infectious agent, only surpassed by COVID‐19. 3 Progress in reducing global TB burden has been adversely affected as a result of the COVID‐19 pandemic. There has been a significant reduction in the number of newly diagnosed cases as well as in access to TB diagnosis and treatment. 3 In addition, it has been observed that coinfection with human immunodeficiency virus, 1 or heavy use of corticosteroids in COVID‐19 patients that suppressed the immune system, led to the reactivation of latent TB. 4
Pulmonary TB is the most common presentation of the disease. 5 The standard treatment of drug‐sensitive TB consists of a regimen with the following four first‐line drugs: rifampicin, isoniazid, pyrazinamide, and ethambutol. 6 TB therapy is composed of an intensive phase of 2 months with isoniazid, rifampicin, pyrazinamide, and ethambutol, followed by a continuation phase of at least 4 months with isoniazid and rifampicin. 6 However, resistance to these antimicrobials can emerge, giving rise to drug‐resistant TB.
In addition to pulmonary TB, the disease can affect organ systems such as the lymphatic system, the gastrointestinal system, and the central nervous system. This form of TB that affects any organ other than the lungs is referred to as extrapulmonary TB (EPTB). In 2019, about 16% of the reported 7.1 million cases were classified as EPTB. 2 Lymph node TB is the most frequent form of EPTB, followed by pleural TB. 5 , 7 Other locations of EPTB manifestations include the genitourinary tract, skin, bones or joints, and meninges. 5 , 7 From the draining lymph node, the TB bacteria reach extrapulmonary organs via hematogenous spread, where monocytes and activated macrophages form a granuloma to contain the infection. 5
Despite accounting for almost one‐sixth of the total TB notifications, EPTB continues to be overlooked. The recommended treatment for most forms of EPTB is the same as pulmonary TB. 7 EPTB therapy is not as well studied as pulmonary TB, 7 and given its prevalence, further improvement and standardization of EPTB treatment is necessary. Physiologically‐based pharmacokinetic (PBPK) modeling can be employed to predict the in vivo distribution of anti‐TB drugs. Such mathematical tools can complement preclinical studies of drugs, reducing both time and resources used in drug development.
Several whole‐body PBPK models evaluating the pharmacokinetics (PK) of first‐line anti‐TB drugs in adults have been developed. These have been summarized in Table S1. None of these models simulate the PK of all four first‐line drugs at relevant EPTB sites. To our knowledge, only one study models EPTB treatment through a PBPK model. The model is used to predict the time‐dependent tissue concentration of delamanid relative to its minimum inhibitory concentration (MIC) at extrapulmonary sites such as the brain, heart, and liver. 8 However, this model is a single drug distribution model that does not include the pleura and lymph nodes, which are important sites of EPTB.
We develop a PBPK model to study the temporal distribution of the four first‐line anti‐TB drugs in humans, specifically at extrapulmonary sites. In our work, we formulate a whole‐body human PBPK model that for the first time (i) includes drug distribution to pleura and lymph node and (ii) simulates the time‐dependent tissue concentrations of all four primary anti‐TB drugs at these and other EPTB sites. We use the model simulations to examine the predicted concentrations at extrapulmonary sites relative to the effective concentrations of the drugs. We employ available concentration data of the drugs to calibrate and independently validate our model. A distinctive feature of our model is the analysis of drug PK in the pleural fluid and the lymph nodes, prevalent sites of EPTB. Slow and rapid metabolizers of isoniazid are considered as discrete cases, each with different absorption rates and clearance (CL). Such PBPK studies can help evaluate the effectiveness of currently prescribed treatment regimens for EPTB and help develop and evaluate potential new protocols.
MATERIALS AND METHODS
Model formulation
The structure of the whole‐body PBPK model is adapted from Lyons et al. 9 A mass balance on the drug in individual compartments leads to a system of ordinary differential equations (ODEs). The rate of change of amount of drug AT in a tissue/organ T is described using the following general equation:
Where QT (L/h) is the flow rate to and from the tissue/organ; LT (L/h) is the lymph flow rate from tissue/organ T; CA (μg/ml) is the drug concentration in arterial blood; CL (L/h) is total systemic CL of the drug; FT is the fraction of total CL apportioned to T (set to zero if no CL occurs in T); and CVT (μg/ml) is the drug concentration exiting T with CVT = CT/PT, where CT is the drug concentration in tissue T and PT is the tissue:blood partition coefficient. Amount of drug in tissue T is AT = CT * VT, where VT is the volume of T.
Model parameters
Physiological parameters
Cardiac output and afferent lymph flow rate were based on previously reported values. Tissue volumes, blood flow rates, and lymph flow rates were taken as fractions of body weight, cardiac output, and afferent lymph flow rate, respectively, for a 70‐kg man. These fractional values were also taken from previous reports. All of these reported values are listed in the Tables S2 and S3 in the supplementary information (Appendix S1). No lymph flow was considered from the spleen and bone compartments. Fractional tissue volume, blood flow rate, and lymph flow rate for the compartment representing the rest of the body were calculated as the remaining fraction.
Tissue:plasma partition coefficients
To determine the tissue:plasma partition coefficients (PT) for the four drugs, the Rodgers and Rowland method 10 , 11 was employed. This method predicts the partitioning of a drug into a tissue by estimating the drug's distribution into tissue constituent lipids, phospholipids, proteins, and water. Reported rat tissue composition data for the tissues and organs were used. Values for different properties of blood cells and plasma were assumed to be those used by Rodgers and Rowland. 10 , 11 Values for relevant chemical and biological properties of the drugs are listed in Table S4. The median of all PT values for a drug was taken as the PT for the rest of the body. The calculated partition coefficient values are listed in Table S5.
Estimation of PK parameters
By fitting our model output to available time‐dependent plasma concentration data, PK parameters, that is, absorption rate (ka) and systemic CL of the drug, were estimated by minimizing the objective function. Model output plasma concentrations for oral doses of rifampicin (450 mg), ethambutol (400 mg), isoniazid (300 mg), and pyrazinamide (2000 mg) were fitted to reported plasma concentration data 12 , 13 , 14 , 15 , 16 for each drug. For isoniazid, we take studies that specifically measure plasma drug concentrations in individuals who have been identified and grouped as either a slow acetylator (SA) or fast acetylator (FA; i.e., slow or fast metabolizer) and use these to estimate PK parameters in each group of metabolizers. Because several data sets were available for each type of metabolizer, separate sets of studies were used for model calibration and model validation. Fractional renal CL values were taken from previous reports, as listed in Appendix S1. The gut reabsorption rate for rifampicin was set to 0.17/h based on the reported value. 9
The objective function used was weighted sum of squares error, defined in Appendix S1. Goodness‐of‐fit plots were constructed to quantify the match of model simulations to clinical data, including data that were not used for parameter estimation. Estimated parameters were used unchanged in all further simulations.
Simulation
The system of ODEs was numerically solved using ode15s in MATLAB 2020 (The MathWorks, Inc.) to obtain time‐series drug concentration prediction for the four first‐line TB drugs in different tissues and organs; fitnlm was used for parameter estimation. The predictions of the model were validated using available drug concentration data. Simulated plasma concentrations for standard oral doses of rifampicin (600 mg), ethambutol (1200 mg), isoniazid (300 mg), and pyrazinamide (1500 mg) were plotted along with reported plasma concentration data 12 , 13 , 17 , 18 , 19 , 20 , 21 , 22 , 23 , 24 , 25 , 26 for each drug dose. At the start of the dosing regimen, there is a transient lasting several days when the average daily concentration increases and then reaches a steady state. While simulating drug concentrations in EPTB organs, unless mentioned otherwise, 24‐h time profiles of the drug concentration at Day 7 after the start of the drug treatment were used to represent the long‐term daily profile of drug concentration. In the pleura, Day 8 concentrations were simulated because the reported data for rifampicin, isoniazid, and pyrazinamide was for the eighth day after the start of the dosing regimen. Simulated pleural drug concentrations for oral doses of rifampicin (600 mg), ethambutol (1200 mg), isoniazid (300 mg), and pyrazinamide (1500 mg) were plotted along with reported concentration data 27 , 28 , 29 for each drug dose. None of the data used for model calibration were used for validation of the simulations. Plots comparing simulated and experimental values were constructed wherever in vivo data were available.
Model output concentrations were compared with the WHO‐prescribed critical concentration for each drug, 30 , 31 which is the lowest drug concentration that inhibits growth of 95% of M. tuberculosis strains isolated from untreated patients, but does not inhibit growth of strains isolated from patients resistant to that drug. 31 As pyrazinamide activity depends on the surrounding pH, in addition to the critical concentration at pH 6.0, MIC at pH 5.5–5.7 32 was also considered for comparison.
RESULTS
PBPK model incorporating EPTB sites
We extended a previously reported PBPK model to include two major sites of EPTB, that is, pleural space and lymph nodes. This new model is shown in Figure 1. We introduce a “lymph node” compartment similar to the venous and arterial blood compartments to represent the lymphatic system. This compartment collects afferent lymph from organs (except bone and spleen) and drains into the venous blood compartment. The pleural space is represented as a subcompartment of the lung that receives filtrate from the lungs and drains to the lymph node. This representation of physiology is consistent with reports that pleural fluid is a microvascular filtrate flowing in through the parietal pleural capillaries, 33 , 34 and removal of this fluid from the pleural space occurs mainly via lymphatic stomata in the parietal pleura. 34 , 35 Additional details on the formulation of the compartments are given in Appendix S1.
FIGURE 1.

Schematic diagram of the whole‐body physiologically‐based pharmacokinetic model incorporating pleura and lymph node compartments (highlighted). Blood flows to an organ/tissue T with a flow rate QT and leaves with a flow rate QT – LT, where LT is the lymph flow rate from T. The drug is administered orally. CLR (= fR x CL, where CL is the systemic clearance) and CLH (= (1 − fR) x CL) represent renal and hepatic clearance, respectively.
The model consists of 17 perfusion‐limited, well‐stirred tissue compartments connected by blood and lymph flow and parameterized by known physiological values from literature as well as calculated tissue:plasma partition coefficients and PK parameters. The model is described using a system of 18 ODEs listed along with the parameters used in Appendix S1. Concentration‐time profiles in various tissues and organs were simulated for the four first‐line anti‐TB drugs: rifampicin, ethambutol, isoniazid, and pyrazinamide. In addition, as the PK of isoniazid varies significantly depending on the acetylator status of the individual, we model two cases with two different sets of PK parameters: SA and FA.
Oral administration of drug was assumed and is represented by introduction of the drug into the gut compartment with first‐order absorption. First‐order elimination was assumed. Rifampicin is known to undergo enterohepatic circulation. 36 This was modeled as first‐order reabsorption of the drug from the gut lumen.
Model calibration and validation
Model calibration
The model‐predicted plasma concentrations of the drugs were fit to reported data. The drug absorption rate and systemic CL values were estimated by minimizing the weighted sum of squared error between model predictions and reported drug concentrations. The predicted PK parameter values are listed in Table S7 in Appendix S1. Figure 2 shows the fitted curves and reported data for plasma concentration. Goodness‐of‐fit plots for predicted (from model) and observed (from literature) drug concentrations in the plasma, and values of correlation coefficient r are shown in Figure S1. After calibration, the model fits the literature data well (r > 0.8 for all drugs). In the predicted parameters, FA have a higher CL value than SA, as expected. The experimental data used here for model calibration was not used further for validation.
FIGURE 2.

Model‐predicted plasma concentrations for oral doses of rifampicin (450 mg), ethambutol (400 mg), isoniazid (300 mg), and pyrazinamide (2000 mg) were fitted to reported plasma concentration data for each to estimate drug pharmacokinetic parameters. The parameters are listed in Tables S2–S6 in Appendix S1. The predicted PK parameters are listed in Table S7 in Appendix S1. FA, fast acetylator; SA, slow acetylator. Etb‐91‐1400B and Et‐ref‐400 are specific ethambutol products used by Strauch et al. in their study.
Model validation
The developed model was validated using reported plasma concentration data for each drug to assess the efficacy of the formulated model. Data different from that used for parameter estimation were used for validation. The obtained simulation results are shown in Figure 3. Goodness‐of‐fit plots for predicted and observed drug plasma concentrations can be found in Figure S2. Parameters are unchanged from calibrated values. The only parameter that is varied is the dose administered. It is seen that the model is able to simulate data not used in model calibration, as signified by the r values (r > 0.7 for all drugs), indicating the robustness of model prediction.
FIGURE 3.

Simulated plasma concentrations for oral doses of rifampicin (600 mg), ethambutol (1200 mg), isoniazid (300 mg), and pyrazinamide (1500 mg) plotted along with reported plasma concentration data for each drug dose. The model parameters used are listed in Appendix S1. Data used for calibration were not used for model validation. FA, fast acetylator; SA, slow acetylator.
Model prediction of drug concentration
Pleura
Lymph node TB and pleural TB are the most common forms of EPTB. To address pleural TB, we incorporated a pleural fluid compartment in the model to predict the concentration of first‐line anti‐TB drugs and hence approximate their effectiveness against pleural TB. The parameter values are not changed from the calibrated values. Dose administered is set to the experimentally reported value. The simulated Day 8 drug concentrations in the pleura are shown in Figure 4. Despite the absence of calibration with pleural concentration data, the model is able to capture the kinetics of pyrazinamide concentration in the pleura with a correlation coefficient greater than 0.8 (see Appendix S1). However, the model overpredicts the pleural concentration of rifampicin. This is consistent with the observed trend of rifampicin exhibiting less penetration into the pleura than the other first‐line drugs. 37 Predicted concentrations of pyrazinamide and ethambutol are below their prescribed critical concentrations, whereas those of rifampicin and isoniazid are well above their critical concentrations.
FIGURE 4.
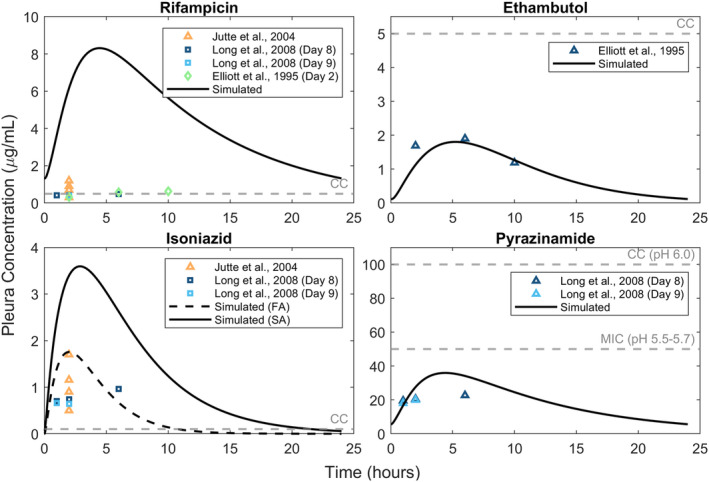
Simulated pleura drug concentrations for oral doses of rifampicin (600 mg), ethambutol (1200 mg), isoniazid (300 mg), and pyrazinamide (1500 mg) plotted along with reported concentration data for each drug dose. The model parameters used are listed in Appendix S1. The gray dashed line represents the critical concentration of each drug. Day 8 simulations are used for all drugs except ethambutol for which Day 2 concentrations corresponding to the experimental data are simulated. FA, fast acetylator; SA, slow acetylator; CC, critical concentration.
Lung tissue
We used the model to simulate lung tissue concentrations and compared these with experimental data. The parameter values used in the simulation are not changed from the calibrated values. Dose is set to the experimentally reported value. Lung tissue concentration‐time data for the drugs for output validation were taken from the literature. 38 , 39 The simulated lung tissue concentrations are shown in Figure 5. Despite the absence of calibration with lung concentration data, the model is able to capture the kinetics of drug concentration in the lung (except ethambutol) with a correlation coefficient greater than 0.5 (see Appendix S1). The model predicts that although rifampicin and isoniazid concentrations are above the critical concentration for a large percentage of time, the concentration of ethambutol is below the critical concentration for a large fraction of time, and the concentration of pyrazinamide is always below its critical concentration.
FIGURE 5.

Simulated lung tissue drug concentrations for oral doses of rifampicin (600 mg), ethambutol (1200 mg), isoniazid (300 mg), and pyrazinamide (1500 mg) plotted along with reported concentration data for each drug dose. Day 1 concentrations are simulated for rifampicin, isoniazid, and pyrazinamide and compared with the study by Prideaux et al. 38 Day 7 concentrations for ethambutol are simulated as the reported data they are compared with correspond to long‐term drug concentrations in the tissue after daily administration. The model parameters used are listed in Appendix S1. The gray dashed line represents the critical concentration of each drug. FA, fast acetylator; SA, slow acetylator; CC, critical concentration.
Extrapulmonary sites
Time‐dependent concentrations of the four drugs were simulated at other potential sites of EPTB and compared with their critical concentrations to predict their effectiveness at combating infection at these sites. Figure 6 shows the Day 7 concentrations of the drugs. For reference, the critical concentrations are also shown. Drug concentrations at different EPTB sites relative to that in the lung compartment over time are shown in Figure S5.
FIGURE 6.

Simulated Day 7 drug concentrations at various sites of extrapulmonary tuberculosis for recommended oral doses of rifampicin (600 mg), ethambutol (1200 mg), isoniazid (300 mg), and pyrazinamide (1600 mg) compared with the critical concentration of each drug. The same parameter values from model calibration are used here. FA, fast acetylator; SA, slow acetylator; CC, critical concentration.
Although isoniazid achieves a peak concentration that is quite high relative to its critical concentration in both FA and SA, rapid metabolizers are unable to maintain this as the drug is rapidly eliminated. Rifampicin appears to achieve a peak concentration higher than its critical concentration in all cases and stays above this concentration for a large fraction of the time in all organs. According to our predictions, ethambutol is unable to reach a concentration higher than the critical concentration in brain, kidney, bone, and skin compartments. An important point to consider for ethambutol and rifampicin is their limited penetration into the cerebrospinal fluid (CSF), especially when meningeal inflammation is not too prominent. 40 As this is not taken into account, the model probably overpredicts the in vivo concentrations of these drugs in the brain and the actual concentrations are even smaller. In a study where patients were administered 600 mg of rifampicin via infusion approximately 3 h before surgery, the highest observed concentration in normal brain tissue was just 0.56 μg/ml. 41 Although intravenous administration results in higher concentrations than those attained by oral administration of the same dose, this value was much less than that predicted by our model around this timepoint. Pyrazinamide and isoniazid do not face this issue of poor central nervous system penetration and hence are vital in the treatment of tuberculous meningitis (TBM). 40 Pyrazinamide, in its current dose, fails to attain its critical concentration in any of the organs in our simulations. A study on 7H10 agar determined pyrazinamide MIC to be around 18–22 μg/ml at a pH of 5.5. 42 The mean estimated concentrations of pyrazinamide are lower than even this lowered MIC in all tissues.
DISCUSSION
The objective of our work was the development of a whole‐body PBPK model to study the disposition of the four first‐line anti‐TB drugs rifampicin, ethambutol, isoniazid, and pyrazinamide in an EPTB context, focusing on lymph node TB and pleural TB, the predominant forms of EPTB. To our knowledge, this is the first PBPK model for TB to include these infection sites. We added two compartments to a previously reported whole body‐PBPK model: a consolidated lymph node compartment and pleura. Following the estimation of PK parameters, our model was able to estimate the in vivo concentration‐time profiles of each drug in different tissues/organs. Validation of the projected concentrations would require tissue concentration data that are unavailable for most cases because of the need for invasive sampling. Hence, we use plasma concentrations and limited pleura and lung tissue concentration data for this purpose.
As we assume drug susceptible TB in our model, we consider critical concentrations of the drugs (as prescribed by WHO) as these concentrations inhibit 95% (90% for pyrazinamide) of wild strains of the target bacteria. We use the critical concentration as it inhibits all strains of the bacteria considered “wild‐type.” There are other measures for clinically desirable concentration levels such as the caseum MBC90 value. We have compared model predictions to these values (Figures S3 and S4) and find that the conclusions are not qualitatively different. We also assume that there are no clinically significant drug–drug interactions between the four drugs 43 and that the PK of a drug are independent of the concentration of the others. It has been shown that rifampicin can increase levels of cytochrome P450, increasing its own metabolism. 44 We do not incorporate the autoinduction demonstrated by rifampicin. In addition, we consider the PK of the drugs to be similar in people with and without TB and do not consider age‐dependent PK properties. We also assume perfusion‐limited drug concentrations and hence do not account for transport rates across intracompartmental boundaries. We also do not account for bound (to cells) and unbound drug concentrations, and the only parameter defining relative blood and tissue concentrations is the partition coefficient. A detailed model without assumptions requires the evaluation of additional parameters, and data at EPTB sites are sparse. Nevertheless, such a model would be more accurate and presumably able to better simulate drug distribution kinetics.
Apart from these assumptions, another limitation of our model is the assumption of a consolidated single lymph node compartment. There are around 600 lymph nodes in the body, and a combined compartment is clearly not an accurate representation of this anatomy. Moreover, drug distribution to all lymph nodes will not be equal. Nonetheless, studying the drug disposition to the lymph nodes is pertinent when discussing EPTB treatment. As such, our model may be regarded as the first step in the incorporation of lymph nodes in whole‐body PBPK models for TB.
Despite these assumptions, our model, calibrated using one set of experimental data, shows good agreement with data from a different source. It is also able to predict ethambutol, isoniazid, and pyrazinamide concentrations in the pleura that match reported experimental values from a study that was not used for either calibration or validation. The expected maximum plasma concentration (Cmax) of the drugs administered at their standard adult doses are 8–24 μg/ml for rifampicin, 2–6 μg/ml for ethambutol, 3–5 μg/ml for isoniazid, and 20–50 μg/ml for pyrazinamide achieved at expected times (tmax) of 2 h, 2–3 h, 0.75–2 h, and 1–2 h, respectively. 45 Our simulations are consistent with these observations.
We used our model to predict time‐dependent concentrations of the four first‐line anti‐TB drugs in extrapulmonary organs. Rifampicin attained a peak above its critical concentration in all simulated cases. However, in the pleural fluid compartment, our model seems to greatly overpredict the time‐dependent concentrations of the drug. Reported pleural fluid drug concentrations appear to barely cross the critical concentration threshold. In a study, the authors observed that rifampicin levels in the pericardial effusion of pericardial TB patients were lower than expected. They hypothesize that a plausible explanation for this is the thickening of pericardial layers or fibrosis. 46 Something analogous could be a reason for the dramatically lower concentrations in the pleura as pleural fibrosis is a known complication of tuberculous pleural effusion. 47 In addition, as it is highly protein bound, rifampicin exhibits limited penetration into CSF, 40 and treatment of tuberculous meningitis might benefit from an increased dosage. In vivo, rifampicin bioavailability is also affected by its metabolism autoinduction.
Ethambutol fails to reach a concentration above its prescribed critical concentration in the brain, kidney, bone, and skin compartments. It has been observed that CSF ethambutol concentrations are too low to be quantifiable in healthy volunteers and is detectable in low amounts in TBM patients with inflamed meninges. 40 Hence, with rehabilitation, the contribution of ethambutol to therapy becomes negligible. In the other tissues/organs its maximum concentration exceeded the critical concentration.
Isoniazid concentrations are above the critical threshold in all compartments, in both FA and SA. However, the Cmax and time above the critical concentration vary greatly. As expected, slow metabolizers attain a greater peak concentration Cmax in all compartments and are able to maintain the drug concentration above the effective concentration for a relatively longer period of time. Therefore, customization of the dosage of isoniazid based on the acetylator status of the individual may prove to be beneficial. Isoniazid has been reported to be antagonistic toward rifampicin 48 , 49 and pyrazinamide. 48 , 50
In our simulations, pyrazinamide does not achieve a maximal concentration higher than its MIC or critical concentration in any compartment. Environmental pH has been seen to play an important role in the sterilizing activity of pyrazinamide. Hence, we take pH into account while setting effective concentration cutoff for this drug. Pyrazinamide's antibacterial activity has been shown to increase with decreasing pH values. 32 A more detailed analysis of the relation of pyrazinamide's sterilizing activity to the environmental pH and how this affects treatment is provided in Appendix S1.
In many organs, we observe that the simulated Cmax of the drug does not cross the critical concentration barrier, or the drug concentration does not stay above this threshold for a long period of time. However, this cocktail of drugs is universally prescribed for all forms of TB. 6 Synergistic action of the drugs that enhances the antimycobacterial effects of these drugs is not accounted for in the model. In addition, in the host, the bacteria experience immune‐mediated stress. Our model currently only focuses on the PK of the drugs and hence is limited to not include details of TB infection, such as the granuloma. Hence, a quantitative systems pharmacology model including the pharmacokinetics/pharmacodynamics of the drug as well as the immune processes in the body might provide a more holistic picture.
PBPK modeling offers a number of advantages. Interindividual variability within a demographic or across different demographics can be integrated into a model. This technique can be immensely useful in preclinical drug development. It can also be valuable in evaluating potential new regimens, since it is desirable that drugs reach their targeted concentrations in particular organs while avoiding problems associated with higher doses. A more detailed and intensive in vivo analysis of drug concentrations and PK at EPTB sites is required to understand the effectiveness of the currently prescribed regimen and can help optimize dosing studies of EPTB. The model and results presented here will serve as a starting point for such studies of drug distribution at EPTB sites.
AUTHOR CONTRIBUTIONS
A.R. and C.J.G. wrote the manuscript. C.J.G. designed the research. A.R. performed the research. A.R. and C.J.G. analyzed the data.
FUNDING
Funding was received from the Council of Scientific and Industrial Research, India in the form of a fellowship to Aparna Ramachandran and from the Department of Biotechnology, Ministry of Science and Technology, India in the form of a research grant to Chetan J. Gadgil (BT/PR40128/BTIS/37/43/2022).
CONFLICT OF INTEREST STATEMENT
The authors declared no competing interests for this work.
Supporting information
Appendix S1
ACKNOWLEDGMENTS
C.J.G. and A.R. thank Rajesh Gokhale for useful discussions on extrapulmonary tuberculosis and the organizers of the India–European Molecular Biology Organisation symposium on mycobacterial heterogeneity and host tissue tropism.
Ramachandran A, Gadgil CJ. A physiologically‐based pharmacokinetic model for tuberculosis drug disposition at extrapulmonary sites. CPT Pharmacometrics Syst Pharmacol. 2023;12:1274‐1284. doi: 10.1002/psp4.13008
REFERENCES
- 1. Pai M, Behr MA, Dowdy D, et al. Tuberculosis. Nat Rev Dis Primer. 2016;2(1):1‐23. doi: 10.1038/nrdp.2016.76 [DOI] [PubMed] [Google Scholar]
- 2. World Health Organization . Global tuberculosis report 2020. 2020. Published online.
- 3. World Health Organization . Global tuberculosis report 2022. World Health Organization 2022.
- 4. Friedman A, DeGeorge KC. Reactivation of latent tuberculosis in a COVID‐19 patient on corticosteroid treatment. BMJ Case Rep. 2022;15(5):e247562. doi: 10.1136/bcr-2021-247562 [DOI] [PMC free article] [PubMed] [Google Scholar]
- 5. Rodriguez‐Takeuchi SY, Renjifo ME, Medina FJ. Extrapulmonary tuberculosis: pathophysiology and imaging findings. Radiogr Rev Publ Radiol Soc N Am Inc. 2019;39(7):2023‐2037. doi: 10.1148/rg.2019190109 [DOI] [PubMed] [Google Scholar]
- 6. World Health Organization , Stop TB initiative. World Health Organization eds, Treatment of Tuberculosis: Guidelines. 4th ed. World Health Organization; 2010: 29‐51. [Google Scholar]
- 7. Lee JY. Diagnosis and treatment of Extrapulmonary tuberculosis. Tuberc Respir Dis. 2015;78(2):47‐55. doi: 10.4046/trd.2015.78.2.47 [DOI] [PMC free article] [PubMed] [Google Scholar]
- 8. Shibata M, Masuda M, Sasahara K, et al. Prediction of human pharmacokinetic profiles of the antituberculosis drug delamanid from nonclinical data: potential therapeutic value against extrapulmonary tuberculosis. Antimicrob Agents Chemother. 2021;65(8):e0257120. doi: 10.1128/AAC.02571-20 [DOI] [PMC free article] [PubMed] [Google Scholar]
- 9. Lyons MA, Reisfeld B, Yang RSH, Lenaerts AJ. A physiologically based pharmacokinetic model of rifampin in mice. Antimicrob Agents Chemother. 2013;57(4):1763‐1771. doi: 10.1128/AAC.01567-12 [DOI] [PMC free article] [PubMed] [Google Scholar]
- 10. Rodgers T, Leahy D, Rowland M. Physiologically based pharmacokinetic modeling 1: predicting the tissue distribution of moderate‐to‐strong bases. J Pharm Sci. 2005;94(6):1259‐1276. doi: 10.1002/jps.20322 [DOI] [PubMed] [Google Scholar]
- 11. Rodgers T, Rowland M. Physiologically based pharmacokinetic modelling 2: predicting the tissue distribution of acids, very weak bases, neutrals and zwitterions. J Pharm Sci. 2006;95(6):1238‐1257. doi: 10.1002/jps.20502 [DOI] [PubMed] [Google Scholar]
- 12. Acocella G. Clinical pharmacokinetics of rifampicin. Clin Pharmacokinet. 1978;3(2):108‐127. doi: 10.2165/00003088-197803020-00002 [DOI] [PubMed] [Google Scholar]
- 13. Furesz S. Chemical and biological properties of rifampicin. Antibiot Chemother Fortschritte Adv Progres. 1970;16:316‐351. doi: 10.1159/000386837 [DOI] [PubMed] [Google Scholar]
- 14. Strauch S, Jantratid E, Stahl M, Rägo L, Dressman JB. The biowaiver procedure: its application to Antituberculosis products in the WHO prequalification Programme. J Pharm Sci. 2011;100(3):822‐830. doi: 10.1002/jps.22349 [DOI] [PubMed] [Google Scholar]
- 15. Augustynowicz‐Kopeć E, Zwolska Z. Bioavailability factors of isoniazid in fast and slow acetylators, healthy volunteers. Acta Pol Pharm. 2002;59(6):452‐457. [PubMed] [Google Scholar]
- 16. Lacroix C, Guyonnaud C, Chaou M, Duwoos H, Lafont O. Interaction between allopurinol and pyrazinamide. Eur Respir J. 1988;1(9):807‐811. [PubMed] [Google Scholar]
- 17. Acocella G, Bonollo L, Garimoldi M, Mainardi M, Tenconi LT, Nicolis FB. Kinetics of rifampicin and isoniazid administered alone and in combination to normal subjects and patients with liver disease. Gut. 1972;13(1):47‐53. doi: 10.1136/gut.13.1.47 [DOI] [PMC free article] [PubMed] [Google Scholar]
- 18. Zwolska Z, Niemirowska‐Mikulska H, Augustynowicz‐Kopec E, et al. Bioavailability of rifampicin, isoniazid and pyrazinamide from fixed‐dose combination capsules. Int J Tuberc Lung Dis. 1998;2(10):824‐830. [PubMed] [Google Scholar]
- 19. Breda M, Benedetti MS, Bani M, et al. Effect of rifabutin on ethambutol pharmacokinetics in healthy volunteers. Pharmacol Res. 1999;40(4):351‐356. doi: 10.1006/phrs.1999.0526 [DOI] [PubMed] [Google Scholar]
- 20. Gwak HS, Park KH, Choi JS, et al. Determination of ethambutol n human plasma by a validated HPLC method and its application to single‐dose pharmacokinetics. J Pharm Investig. 2005;35(2):123‐127. doi: 10.4333/KPS.2005.35.2.123 [DOI] [Google Scholar]
- 21. Bing C, Xiaomeia C, Jinhenga L. Gene dose effect of NAT2 variants on the pharmacokinetics of isoniazid and acetylisoniazid in healthy Chinese subjects. Drug Metabol Drug Interact. 2011;26(3):113‐118. doi: 10.1515/DMDI.2011.016 [DOI] [PubMed] [Google Scholar]
- 22. Ellard GA, Gammon PT, Lakshminarayan S, et al. Pharmacology of some slow‐release preparations of isoniazid of potential use in intermittent treatment of tuberculosis. Lancet (Lond). 1972;1(7746):340‐343. doi: 10.1016/s0140-6736(72)92840-1 [DOI] [PubMed] [Google Scholar]
- 23. Acocella G, Nonis A, Gialdroni‐Grassi G, Grassi C. Comparative bioavailability of isoniazid, rifampin, and pyrazinamide administered in free combination and in a fixed triple formulation designed for daily use in antituberculosis chemotherapy. I. Single‐dose study. Am Rev Respir Dis. 1988;138(4):882‐885. doi: 10.1164/ajrccm/138.4.882 [DOI] [PubMed] [Google Scholar]
- 24. Peloquin CA, Jaresko GS, Yong CL, Keung AC, Bulpitt AE, Jelliffe RW. Population pharmacokinetic modeling of isoniazid, rifampin, and pyrazinamide. Antimicrob Agents Chemother. 1997;41(12):2670‐2679. doi: 10.1128/AAC.41.12.2670 [DOI] [PMC free article] [PubMed] [Google Scholar]
- 25. Ellard GA. Absorption, metabolism and excretion of pyrazinamide in man. Tubercle. 1969;50(2):144‐158. doi: 10.1016/0041-3879(69)90020-8 [DOI] [PubMed] [Google Scholar]
- 26. Wang HF, Wang R, O'Gorman M, Crownover P, Naqvi A, Jafri I. Bioequivalence of fixed‐dose combination Myrin®‐P forte and reference drugs in loose combination. Int J Tuberc Lung Dis. 2013;17(12):1596‐1601. doi: 10.5588/ijtld.13.0190 [DOI] [PubMed] [Google Scholar]
- 27. Jutte PC, Rutgers SR, Van Altena R, Uges DR, Van Horn JR. Penetration of isoniazid, rifampicin and pyrazinamide in tuberculous pleural effusion and psoas abscess. Int J Tuberc Lung Dis. 2004;8(11):1368‐1372. [PubMed] [Google Scholar]
- 28. Long R, Barrie J, Stewart K, Peloquin CA. Treatment of a tuberculous empyema with simultaneous oral and intrapleural antituberculosis drugs. Can Respir J. 2008;15(5):241‐243. [DOI] [PMC free article] [PubMed] [Google Scholar]
- 29. Elliott AM, Berning SE, Iseman MD, Peloquin CA. Failure of drug penetration and acquisition of drug resistance in chronic tuberculous empyema. Tuber Lung Dis. 1995;76(5):463‐467. doi: 10.1016/0962-8479(95)90016-0 [DOI] [PubMed] [Google Scholar]
- 30. World Health Organization . Technical Report on critical concentrations for drug susceptibility testing of isoniazid and the rifamycins (rifampicin, rifabutin and rifapentine). 2021. Published online https://apps.who.int/iris/bitstream/handle/10665/339275/9789240017283‐eng.pdf?sequence=1&isAllowed=y. Accessed June 18, 2022.
- 31. World Health Organization . Companion handbook to the WHO guidelines for the programmatic management of drug‐resistant tuberculosis. 2014. Published online https://apps.who.int/iris/bitstream/handle/10665/130918/9789241548809_eng.pdf?sequence=1. Accessed June 18, 2022. [PubMed]
- 32. Salfinger M, Heifets LB. Determination of pyrazinamide MICs for Mycobacterium tuberculosis at different pHs by the radiometric method. Antimicrob Agents Chemother. 1988;32(7):1002‐1004. doi: 10.1128/AAC.32.7.1002 [DOI] [PMC free article] [PubMed] [Google Scholar]
- 33. Zocchi L. Physiology and pathophysiology of pleural fluid turnover. Eur Respir J. 2002;20(6):1545‐1558. doi: 10.1183/09031936.02.00062102 [DOI] [PubMed] [Google Scholar]
- 34. Lai‐Fook SJ. Pleural mechanics and fluid exchange. Physiol Rev. 2004;84(2):385‐410. doi: 10.1152/physrev.00026.2003 [DOI] [PubMed] [Google Scholar]
- 35. Miserocchi G. Physiology and pathophysiology of pleural fluid turnover. Eur Respir J. 1997;10(1):219‐225. [DOI] [PubMed] [Google Scholar]
- 36. Sousa M, Pozniak A, Boffito M. Pharmacokinetics and pharmacodynamics of drug interactions involving rifampicin, rifabutin and antimalarial drugs. J Antimicrob Chemother. 2008;62(5):872‐878. doi: 10.1093/jac/dkn330 [DOI] [PubMed] [Google Scholar]
- 37. Long R, Barrie J, Peloquin CA. Therapeutic drug monitoring and the conservative management of chronic tuberculous empyema: case report and review of the literature. BMC Infect Dis. 2015;15:327. doi: 10.1186/s12879-015-1093-7 [DOI] [PMC free article] [PubMed] [Google Scholar]
- 38. Prideaux B, Via LE, Zimmerman MD, et al. The association between sterilizing activity and drug distribution into tuberculosis lesions. Nat Med. 2015;21(10):1223‐1227. doi: 10.1038/nm.3937 [DOI] [PMC free article] [PubMed] [Google Scholar]
- 39. Dheda K, Lenders L, Magombedze G, et al. Drug‐penetration gradients associated with acquired drug resistance in patients with tuberculosis. Am J Respir Crit Care Med. 2018;198(9):1208‐1219. doi: 10.1164/rccm.201711-2333OC [DOI] [PMC free article] [PubMed] [Google Scholar]
- 40. Donald PR. Cerebrospinal fluid concentrations of antituberculosis agents in adults and children. Tuberculosis. 2010;90(5):279‐292. doi: 10.1016/j.tube.2010.07.002 [DOI] [PubMed] [Google Scholar]
- 41. Mindermann T, Zimmerli W, Gratzl O. Rifampin concentrations in various compartments of the human brain: a novel method for determining drug levels in the cerebral extracellular space. Antimicrob Agents Chemother. 1998;42(10):2626‐2629. [DOI] [PMC free article] [PubMed] [Google Scholar]
- 42. Stottmeier KD, Beam RE, Kubica GP. Determination of drug susceptibility of mycobacteria to pyrazinamide in 7H10 agar. Am Rev Respir Dis. 1967;96(5):1072‐1075. doi: 10.1164/arrd.1967.96.5.1072 [DOI] [PubMed] [Google Scholar]
- 43. Yew WW. Clinically significant interactions with drugs used in the treatment of tuberculosis. Drug Saf. 2002;25(2):111‐133. doi: 10.2165/00002018-200225020-00005 [DOI] [PubMed] [Google Scholar]
- 44. Chen J, Raymond K. Roles of rifampicin in drug‐drug interactions: underlying molecular mechanisms involving the nuclear pregnane X receptor. Ann Clin Microbiol Antimicrob. 2006;5:3. doi: 10.1186/1476-0711-5-3 [DOI] [PMC free article] [PubMed] [Google Scholar]
- 45. Peloquin CA. Therapeutic drug monitoring in the treatment of tuberculosis. Drugs. 2002;62(15):2169‐2183. doi: 10.2165/00003495-200262150-00001 [DOI] [PubMed] [Google Scholar]
- 46. Shenje J, Ifeoma Adimora‐Nweke F, Ross IL, et al. Poor penetration of antibiotics into pericardium in pericardial tuberculosis. EBioMedicine. 2015;2(11):1640‐1649. doi: 10.1016/j.ebiom.2015.09.025 [DOI] [PMC free article] [PubMed] [Google Scholar]
- 47. Vorster MJ, Allwood BW, Diacon AH, Koegelenberg CFN. Tuberculous pleural effusions: advances and controversies. J Thorac Dis. 2015;7(6):981‐991. doi: 10.3978/j.issn.2072-1439.2015.02.18 [DOI] [PMC free article] [PubMed] [Google Scholar]
- 48. Grosset J, Truffot‐Pernot C, Lacroix C, Ji B. Antagonism between isoniazid and the combination pyrazinamide‐rifampin against tuberculosis infection in mice. Antimicrob Agents Chemother. 1992;36(3):548‐551. [DOI] [PMC free article] [PubMed] [Google Scholar]
- 49. Chigutsa E, Pasipanodya JG, Visser ME, et al. Impact of nonlinear interactions of pharmacokinetics and MICs on sputum bacillary kill rates as a marker of sterilizing effect in tuberculosis. Antimicrob Agents Chemother. 2015;59(1):38‐45. doi: 10.1128/AAC.03931-14 [DOI] [PMC free article] [PubMed] [Google Scholar]
- 50. Almeida D, Nuermberger E, Tasneen R, et al. Paradoxical effect of isoniazid on the activity of rifampin‐pyrazinamide combination in a mouse model of tuberculosis. Antimicrob Agents Chemother. 2009;53(10):4178‐4184. doi: 10.1128/AAC.00830-09 [DOI] [PMC free article] [PubMed] [Google Scholar]
Associated Data
This section collects any data citations, data availability statements, or supplementary materials included in this article.
Supplementary Materials
Appendix S1