

Abstract
Tanezumab is a monoclonal antibody against nerve growth factor (NGF). We investigated tanezumab pharmacokinetic (PK)‐NGF relationships and predicted the extent of systemic free NGF suppression with target‐mediated drug disposition (TMDD) modeling using data from three pivotal phase III interventional studies (NCT02697773, NCT02709486, and NCT02528188) in patients with osteoarthritis. Patients received tanezumab 2.5 mg or 5 mg every 8 weeks (q8w) subcutaneously. A TMDD model using a previously established population PK model was used to describe plasma tanezumab and serum total NGF concentration data, and simulations were performed to predict “unobserved” free NGF versus time profiles and dose–response relationships for free NGF. A total of 2992 patients had available data for plasma tanezumab or serum total NGF concentrations and were included in the analysis; 706 of these had data for both tanezumab and total NGF concentrations. The model generally performed well to predict observed total NGF concentrations up to ~24 weeks after each dose. Simulations suggested free NGF concentration would be suppressed by ~75% (median) near the peak of tanezumab concentration and by less than 5% (median) around the trough tanezumab concentration with a tanezumab 2.5 mg q8w regimen. Free NGF concentration was predicted to return to baseline level at ~8 weeks (95% prediction interval: 5–16 weeks) after the last tanezumab dose. This model adequately described plasma tanezumab and serum total NGF concentrations following s.c. administration of tanezumab 2.5 or 5 mg q8w, allowed prediction of relative change in systemic free NGF following s.c. administration of tanezumab.
Study Highlights.
WHAT IS THE CURRENT KNOWLEDGE ON THE TOPIC?
Target‐mediated drug disposition (TMDD) approximation models have been studied to predict unobserved systemic free nerve growth factor (NGF) concentration following tanezumab s.c. administration.
WHAT QUESTION DID THIS STUDY ADDRESS?
How unobserved systemic free NGF level changes over time following tanezumab s.c. administration in patients with osteoarthritis (OA) from recent phase III studies and how the predicted free NGF suppression associates with the preclinical and clinical data?
WHAT DOES THIS STUDY ADD TO OUR KNOWLEDGE?
An updated TMDD model predicted relative change in unobserved systemic free NGF concentration in patients with OA. The potency of tanezumab (steady‐state constant) was consistent with the preclinical estimate. Whereas temporal change in systemic free NGF levels might be somewhat different from the time course of clinical response to tanezumab, the model‐predicted dose response for free NGF was in line with efficacy results from the clinical studies.
HOW MIGHT THIS CHANGE DRUG DISCOVERY, DEVELOPMENT, AND/OR THERAPEUTICS?
When free target data are unavailable for a drug presenting TMDD approximation models may allow us to predict the free target concentration time course and help understand the drug pharmacology.
INTRODUCTION
Nerve growth factor (NGF) is a known modulator of nociceptive signaling that contributes to neuronal sensitization, and agents targeting NGF are under development as novel therapies for the treatment of certain chronic pain conditions. Tanezumab is a monoclonal antibody that selectively binds to NGF with high affinity and specificity, resulting in inhibition of NGF activity. Tanezumab was developed to treat pain from moderate‐to‐severe osteoarthritis (OA).
NGF is a neurotropic protein and its precursor (proNGF) is a pro‐peptide which is cleaved into NGF. 1 Neurotrophins including NGF act through neurotrophin receptors (p75NTR, TrkA, TrkB, and TrkC). 2 NGF plays a role in the modulation of nociception, suggesting that NGF is a novel and attractive target to treat pain conditions. 3 It was reported that tanezumab selectively bound to NGF with NGF/tanezumab binding affinity tighter than 10 pM which was caused by an extremely slow dissociation rate constant and that tanezumab at saturating levels blocked NGF/TrkA interaction fully. 4 Although relationships among systemic levels of NGF, tissue NGF concentrations, pain perception, and tanezumab efficacy have not been fully elucidated, NGF is considered to play a key role in the mechanism of action of tanezumab. Therefore, consistent with recognized practices, 5 , 6 it is considered important to investigate to what extent tanezumab suppresses free NGF over time under the assumption that change in systemic free NGF level would be associated with clinical response to tanezumab administration.
The target‐mediated drug disposition (TMDD) modeling approach has been used to describe drug, free target, and drug‐target complex. 7 TMDD model approximations are useful in allowing estimation of alternative hybrid parameters when the full TMDD modeling is overparameterized. 8 , 9 , 10 Our group previously investigated TMDD approximation models to predict unobserved systemic free NGF concentration following s.c. administration of tanezumab 2.5–10 mg q8w. 11 , 12 The population pharmacokinetic (PK) and PK‐NGF models were developed using data from two OA studies, where NGF‐related parameter values were reported to be consistent with reported in vitro values. 11 Because these studies were instructed to stop further dosing and enrollment due to clinical hold, the number of doses included in the analysis was limited up to two (majority 1 injection) and four (with a median of 2 injections), respectively. In the meanwhile, this analysis developed a population PK‐NGF model using data from three recent pivotal phase III OA studies, including a long‐term study up to seven doses. Additionally, the population PK model used for this analysis was based on more comprehensive population PK analysis using data from 10 i.v./s.c. studies. 13
Another investigation was conducted to characterize overestimation of TMDD approximation models and quantify the impact when the target binding parameter values were changed. 12 The sensitivity analyses suggested that approximation models would overestimate free NGF suppression in the initial fast phase, but the overestimation would reduce after the second dose across the tested approximation models. 12 , 14 This finding supports that the TMDD approximation model applied to this analysis is considered adequate to predict free NGF suppression at steady‐state.
The objective of this study was to predict systemic free NGF suppression following s.c. administration of tanezumab q8w in patients with OA, based on an indirect effect interpretation of the TMDD approximation models, using data from three recent pivotal phase III studies in order to further understand tanezumab pharmacology.
METHODS
Sample analysis
Plasma tanezumab PK samples (comprised of drug free from and bound to NGF) and longitudinal serum total NGF samples (comprised of NGF free from and bound to tanezumab, and proNGF) following s.c. administration of tanezumab 2.5 mg or 5 mg q8w were collected and assayed from three pivotal phase III studies, A4091056 (NCT02697773), A4091057 (NCT02709486), and A4091058 (NCT02528188), in patients with OA (Table 1). Plasma tanezumab samples were analyzed using a sensitive, specific, and validated enzyme‐linked immunosorbent assay (ELISA) with a lower limit of quantification (LLOQ) of 35 ng/mL. The ELISA assay used anti‐idiotypic mAb as the capturing protein and a mouse anti‐human IgG (Fc)‐horseradish peroxidase conjugate as detection reagent. Precision of the ELISA assay method, as assessed by the coefficient of variation (%CV), was less than or equal to 6.76. 13 An immunoaffinity liquid chromatography tandem mass spectrometry assay method with LLOQ of 10 pg/mL was validated to determine total NGF in human serum. Precision (%CV) of the assay method was less than or equal to 23.6.
TABLE 1.
Studies included in the analysis.
| Trial number (Clinicaltrials.gov identifier) | Design | Tanezumab treatment arms a | Treatment duration | Indication | PK/PD (NGF) assessment schedule (Tanezumab treatment arms) |
|---|---|---|---|---|---|
| A4091056 (NCT02697773) | Phase III, randomized, double‐blind, placebo‐controlled, parallel‐group. S.c. dosing every 8 weeks (2 doses total) | S.c. 2.5 mg (n = 230) s.c. 2.5/5 mg (n = 230) b | 16 weeks | OA (hip or knee) |
Tanezumab PK: baseline (predose) and weeks 8 (predose), 16, and 24 (or early termination). Total NGF (same as PK): Analyzed in ~50% of patients. Note: Extra samples were to be taken from about 30% of patients at weeks 2, 4, and 12 |
| A4091057 (NCT02709486) | Phase III, randomized, double‐blind, placebo‐controlled, parallel‐group. S.c. dosing every 8 weeks (3 doses total) | S.c. 2.5 mg (n = 270) s.c. 5 mg (n = 270) | 24 weeks | OA (hip or knee) |
Tanezumab PK: Baseline (predose) and weeks 8 (predose), 16 (predose), 24, 32, and 48 (or early termination). Total NGF: Baseline (predose) and weeks 8 (predose), 24, 32, and 48 (or early termination) were to be taken from ~30% of patients |
| A4091058 (NCT02528188) | Phase III, randomized, double‐blind, active‐controlled, parallel‐group. S.c. dosing every 8 weeks (7 doses total) | S.c. 2.5 mg (n = 1000) s.c. 5 mg (n = 1000) | 56 weeks | OA (hip or knee) | Baseline (predose) and weeks 8 (predose), 16 (predose), 32 (predose), 48 (predose), 56, and 64 (or early termination). Total NGF: Baseline (predose), weeks 8 (predose), 48 (predose), 56, and 64 (or early termination) were to be taken from ~20% of patients in tanezumab treatment |
Abbreviations: NGF, nerve growth factor; OA, osteoarthritis; PD, pharmacodynamics; PK, pharmacokinetics.
Only tanezumab treatment arms are shown. Numbers in parentheses refer to planned number of patients per arm.
Patients in this arm received a 2.5 mg dose of tanezumab at baseline and a 5 mg dose at week 8.
Data
In the studies, sparse PK data were collected whereas serum total NGF data were collected in a subset of the population (Table 1).
Tanezumab PK and total NGF data were obtained following s.c. administration of tanezumab 2.5 mg or 5 mg q8w. Whereas both plasma tanezumab and serum total NGF concentrations were measured, bound NGF (tanezumab‐NGF complex) concentration was not determined due to high variability of the assay and, as a result, free NGF could also not be determined. Total NGF concentration determined in this analysis included proNGF. Relative amount for proNGF was measured as a peak area ratio of proNGF to an internal standard (a stable isotope labeled peptide), which indicated that mean proNGF concentrations would be comparable across treatment groups at all sampling times. However, because absolute proNGF concentration was unable to be measured, actual proNGF:NGF ratio was not determined. Therefore, the unobserved free NGF concentration was predicted via the PK‐NGF model using data from plasma tanezumab and serum total NGF (including proNGF) concentrations.
Model description
In this analysis, model parameters related to NGF were estimated, whereas parameters associated with tanezumab PK were fixed to parameter estimates from a previously developed population PK model. 13 The final population PK model was developed using data from 10 studies of i.v. or s.c. tanezumab, including studies A4091056 and A4091057. 13 Data from Study A4091058 were not included in the model development, but were used for subanalyses. Study‐specific PK parameters for Study A4091058 were fixed to same values as those for Studies A4091056 and A4091057. The final population PK model is described in Appendix S1.
This model analysis used TMDD interpretation of the indirect response model, given individual plasma tanezumab concentration predicted from empirical Bayes estimates of the population PK model. 13 Details for the model are described in Appendix S1. All the parameters associated with tanezumab PK, including random effect parameters were fixed to the final estimates reported in the population PK analysis (Table S1).
The TMDD approximation model equations for plasma tanezumab (C′ to be used for differentiating plasma tanezumab concentration from the free concentration C), free NGF (R, R 0 = BASE [baseline NGF] at time t = 0), bound NGF (tanezumab‐NGF complex; RC), and both free and bound NGF (R tot = R + RC) concentrations are as follows:
| (1) |
| (2) |
| (3) |
| (4) |
| (5) |
| (6) |
Where A 1, A 2, and A 3 are the amounts of tanezumab at the s.c. injection site, in the central compartment, and in the peripheral compartment, respectively. The population PK parameters are incorporated into the equations as absorption rate constant (k a ), bioavailability (F1), linear elimination rate constants (k 20, k 23, and k 32), and parameters for nonlinear elimination, maximum elimination capacity (VM) and Michaelis–Menten rate constant (KM).
Parameters associated with NGF are NGF synthesis rate constant (k syn), the degradation rate constant (k deg), bound NGF (tanezumab‐NGF complex) degradation rate constant (k int), and steady‐state constant (K ss). Although approximation models used free and total drug concentrations (C and C tot) in the equations, we used plasma tanezumab concentration (C′) in the equations, assuming that C tot = C = C′ (see Discussion section).
Interindividual variability for parameters associated with both tanezumab and NGF was included on the model parameters using multiplicative exponential random effects.
Residual variability was modeled as additive on log‐transformed scale error model for both tanezumab and total NGF concentrations. Because observed total NGF concentration included proNGF, it was assumed that proNGF concentration was constant with proNGF to BASE (baseline NGF) concentration ratio as 1:1, which was arbitrarily selected at this point in the analysis and tested in the sensitivity analysis described below. Therefore, observed total NGF concentration for the ith individual at time j (Y ij ) is described as follows:
Model validation
Goodness of fit to the observed tanezumab and total NGF concentration data were evaluated using visual inspection of diagnostic plots, precision of the parameter estimates, and visual predictive check (VPC). 15 , 16 The diagnostic assessment was performed using Xpose4. 17 , 18 The VPCs were performed as prediction‐corrected VPCs (pcVPCs), which corrected VPC for differences within each bin originated from independent variables and covariates in the model. 19
Sampling Importance Resampling using PsN 20 was used to calculate median (95% confidence interval [CI]) for parameter estimates. Sensitivity analysis was conducted to evaluate impact of the model assumption (ratio of proNGF to NGF at baseline = 1:1) on the results. Population parameter estimates were compared when the ratio was changed from 10:1 to 1:10.
Simulations
To simulate plasma tanezumab and serum total NGF concentrations, and free NGF versus time profiles in the OA population, individual predicted concentration‐time data following tanezumab 2.5 mg s.c. abdominal administration q8w up to seven times were generated (N = 500) using R package mrgsolve 21 after randomly sampling η(s) (interindividual variability) and covariate data from patients with OA of the three studies.
To predict dose–response relationships, free NGF concentration‐time data for a typical patient (a female patient with body weight 84.7 kg, creatinine clearance 93.5 mL/min, and age 59 years) following tanezumab s.c. abdominal administration q8w up to seven times were generated (tanezumab doses for simulations were 0.25 to 10 mg).
Modeling software
Software packages NONMEM version 7.3 (ICON Development Solutions) was used for this analysis, where first‐order conditional estimation method was used as default. 22 To support the analysis, Perl‐speaks‐NONMEM version 4.7.9 23 and R software (versions 3.2.2, 3.4.1, and 3.6.1) 24 were used. The diagnostic assessment was performed using Xpose4. 17 , 18
RESULTS
The dataset included data from three phase III studies following s.c. administration of tanezumab 2.5 or 5 mg q8w in 2992 patients with OA. The number of patients with plasma tanezumab concentration (postdose) and serum total NGF concentration (predose as baseline and postdose) were 2542 (7856 observations) and 790 patients (3490 observations), respectively, which were used for this analysis. Of these, 706 patients had samples for both tanezumab and total NGF. Figure 1 shows observed total NGF concentration versus time profile following tanezumab 2.5 or 5 mg s.c. administration (Figure S1 for tanezumab concentration vs. time). Demographic characteristics of the patients who had total NGF concentration data are shown in Table 2 (Table S2 for patients who had tanezumab concentration data).
FIGURE 1.
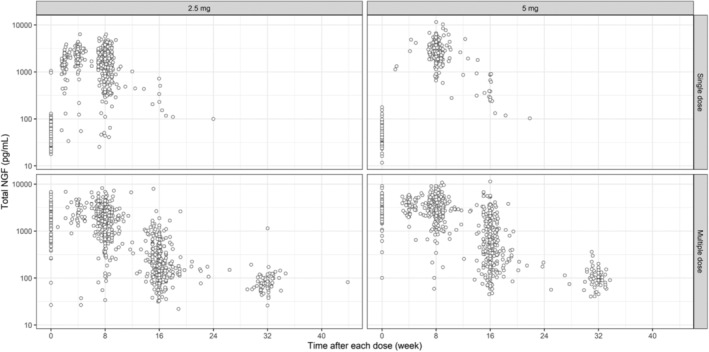
Observed serum total NGF concentration versus time profiles following s.c. administration of tanezumab 2.5 or 5 mg. Title of each panel shows tanezumab s.c. dose (2.5 and 5 mg) split by the first dose and second to seventh dose (single dose and multiple dose indicate observations following the first initial dose and following the second to seventh dose, respectively). Time indicates time after each dose. Single dose data were derived from total NGF data during the first dose. Multiple dose data were derived from total NGF data at and after the second dose. A variable TAD was used as the time. When TAD was zero in the single dose (sample taken at baseline or trough after the first dose), another variable (TAFD, time after the first dose) was used as time to distinguish these samples. CI, confidence interval; NGF, nerve growth factor; RSE, relative standard error; TAD, time after each dose.
TABLE 2.
Patient demographics (patients with serum total NGF data).
| Characteristic | Study A4091056 | Study A4091057 | Study A4091058 | Total |
|---|---|---|---|---|
| Sex, N (%) | ||||
| Male | 88 (38.9) | 50 (31.2) | 147 (36.4) | 285 (36.1) |
| Female | 138 (61.1) | 110 (68.8) | 257 (63.6) | 505 (63.9) |
| Race, N (%) | ||||
| White | 169 (74.8) | 143 (89.4) | 304 (75.2) | 616 (78) |
| Black | 40 (17.7) | 0 (0) | 65 (16.1) | 105 (13.3) |
| Asian | 10 (4.4) | 15 (9.4) | 27 (6.7) | 52 (6.6) |
| Other | 7 (3.1) | 2 (1.3) | 8 (2) | 17 (2.2) |
| Site, N (%) | ||||
| Thigh | 28 (12.4) | 4 (2.5) | 44 (10.9) | 76 (9.6) |
| Abdomen | 186 (82.3) | 145 (90.6) | 297 (73.5) | 628 (79.5) |
| Both | 12 (5.3) | 11 (6.9) | 63 (15.6) | 86 (10.9) |
| BWT, kg | ||||
| Mean (SD) | 87.6 (16.5) | 82.6 (15.4) | 87.8 (17.1) | 86.7 (16.7) |
| Median [range] | 88.6 [51.2, 133] | 81.2 [47, 124] | 88.4 [39, 134] | 87.1 [39, 134] |
| Age, years | ||||
| Mean (SD) | 62.4 (9.27) | 65 (9.63) | 60.9 (9.65) | 62.2 (9.65) |
| Median [range] | 63 [36, 83] | 66 [37, 89] | 61 [28, 90] | 63 [28, 90] |
| CLcr, mL/min | ||||
| Mean (SD) | 105 (32.9) | 112 (31.8) | 107 (31.7) | 107 (32.1) |
| Median [range] | 99.6 [37.5, 197] | 110 [36.8, 206] | 105 [38.7, 207] | 105 [36.8, 207] |
| TNGF, pg/mL | ||||
| Mean (SD) | 55.4 (70.3) | 49.3 (15.3) | 57.4 (51.7) | 55.1 (53.1) |
| Median [range] | 49.4 [19.5, 1050] | 46.3 [16.1, 95.7] | 51.2 [11.7, 960] | 49.7 [11.7, 1050] |
Abbreviations: BWT, body weight; CLcr, creatinine clearance; N, number; NGF, nerve growth factor; SD, standard deviation; Site, injection site; TNGF, total nerve growth factor at baseline (initial predose values).
The NGF‐related parameter estimates (relative standard error) for k syn, BASE, k int, and K ss were 174 pg/mL/day (5.96%), 27.3 pg/mL (1.51%), 0.0309 1/day (8.21%), and 0.728 ng/mL (4.30%), respectively (Table 3). Based on k syn and BASE estimates, k deg was estimated to be 6.37 1/day. Interindividual variability for k syn, BASE, and K ss (CV%) were estimated to be 22.0, 20.2, and 48.3, respectively. Residual variability for total NGF (CV%) was estimated as 35.1. Parameters associated with tanezumab PK were fixed to the final estimates reported in the population PK analysis 13 (Table S1).
TABLE 3.
Parameter estimates for NGF.
| Parameter | Estimate (RSE%) | Median (95% CI) |
|---|---|---|
| ϴ ksyn [pg/mL/day] | 174 (5.96) | 174 [156, 194] |
| ϴ BASE [pg/mL] | 27.3 (1.51) | 27.3 [26.6, 28] |
| ϴ kint [1/day] | 0.0309 (8.21) | 0.0308 [0.0266, 0.0355] |
| ϴ Kss [ng/mL] | 0.728 (4.3) | 0.729 [0.68, 0.778] |
| ω ksyn [CV%] | 22 (12.7) | 22.5 [15.6, 27.9] |
| ω BASE [CV%] | 20.2 (5.34) | 20.2 [16.9, 23] |
| ω Kss [CV%] | 48.3 (4.34) | 48.3 [42.8, 53.1] |
| σ [CV%] | 35.1 (0.647) | 35.1 [34.2, 36.2] |
Note: Values are rounded to the third significant digit. Median [95% CI] was calculated based on sampling‐importance resampling using Perl‐speaks‐NONMEM. 20 The number of iterations was set to five. The number of parameter vectors resampled in the final iteration was set to 1000. The diagnostic plots provided from PsN which was used to confirm whether convergence had been achieved or not.
k deg (= ϴ ksyn/ϴ BASE) = 6.37 (1/day). K ss = 4.85 (pM) given tanezumab molecular weight ~150 kDa.
Abbreviations: CI, confidence interval; CV, coefficient of variation; NGF, nerve growth factor; RSE%, relative standard error of the estimate (%) derived from NONMEM $COV step; ω X and σ [CV%], standard deviation (%) of random effect parameter.
Figures S2 and S3 show diagnostic plots for total NGF and tanezumab, respectively. No significant trend was observed from these plots. The η‐shrinkage for clearance, central compartment, maximum value (V max), volume of the peripheral compartment (V p), and k a were 24%, 44%, 60%, 55%, and 63%, respectively, whereas η‐shrinkage for k syn, BASE, and K ss were 66%, 43%, and 28%, respectively. The ε‐shrinkage for tanezumab low and high residual variability and for total NGF were 15%, −3%, and 17%, respectively.
Figure 2 shows pcVPC plot for total NGF concentrations versus time stratified by dose and the number of doses (first dose and the second to seventh doses). Although the model slightly overestimated the total NGF concentration from around 24 to 32 weeks after each dose, the model generally well‐predicted observed concentrations up to around 24 weeks after each dose. As was shown in the previous population PK analysis, 13 predicted tanezumab concentration‐time profiles were generally consistent with the observed profiles across the strata in the VPC assessment, although small differences between predicted and observed concentrations were observed around the LLOQ (Figure S4).
FIGURE 2.
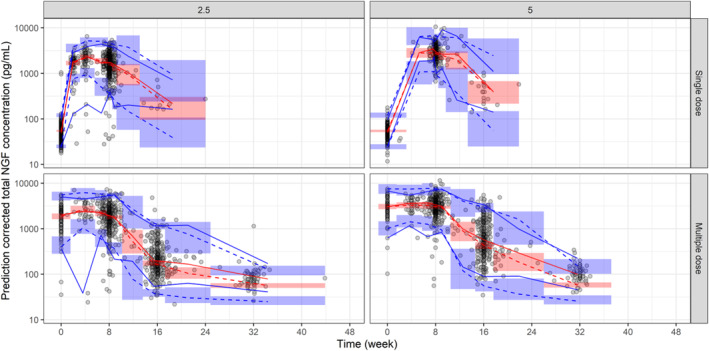
Prediction‐corrected visual predictive check plot for total NGF concentrations versus time. Title of each panel shows tanezumab s.c. dose (2.5 and 5 indicate tanezumab 2.5 mg and 5 mg, respectively) split by the first dose and second to seventh dose (single dose and multiple dose indicate observations following the first initial dose and following the second to seventh dose, respectively). Time indicates time after each dose. For each panel, the red line (blue lines) represent(s) 50th percentile (2.5th and 97.5th percentiles) of observed prediction‐corrected total NGF concentrations. The red dashed line (blue dashed lines) represent(s) model‐predicted 50th percentile (2.5th and 97.5th percentiles) for prediction‐corrected total NGF concentrations. The red areas (blue areas) represent model‐predicted 95% confidence intervals of 50th percentile (2.5th and 97.5th percentiles) for prediction‐corrected total NGF concentrations. Single dose data were derived from total NGF data during the first dose. Multiple dose data were derived from total NGF data at and after the second dose. A variable TAD (time after each dose) was used as the time. When TAD was zero in the single dose (sample taken at baseline or trough after the first dose), another variable (TAFD, time after the first dose) was used as time to distinguish these samples. In the VPC, uncertainty in the population parameters (ie, θ, σ 2, ω 2) was not incorporated. For each simulated trial replicate, simulated data were generated using the model parameters, random draws of η and ε, and independent variables from the trials design. NGF, nerve growth factor.
Sensitivity analysis showed that changes in proNGF to BASE ratio influenced BASE and K ss estimates, whereas other parameters including random effect parameters were not impacted by the proNGF to BASE ratio (Table S3). Absolute free NGF concentration versus time profile was altered by change in the proNGF to BASE ratio, suggesting data on absolute proNGF concentration is essential to predict absolute free NGF serum concentration time course. However, free NGF relative to baseline NGF concentration (free NGF %) versus time profile was little influenced by the proNGF:BASE ratio from 10:1 to 1:10 (Figure S5).
Simulations from the model suggested that tanezumab 2.5 mg q8w by s.c. administration would be predicted to suppress free NGF concentration in the systemic circulation by ~75% (median) near the peak of tanezumab concentration, and by less than 5% (median) at the trough concentration (Figure 3). Free NGF concentration was predicted to return to the baseline level at ~8 weeks (95% prediction interval: 5–16 weeks) after the last s.c. dose of tanezumab 2.5 mg q8w. Predicted dose–response relationships in a typical patient showed the dose–response curve for the maximum free NGF suppression was steep around low dose and the suppression exceeded 70% at tanezumab 2.5 mg (Figure 4). Further, the minimum suppression was less than 10% at tanezumab 2.5 mg.
FIGURE 3.
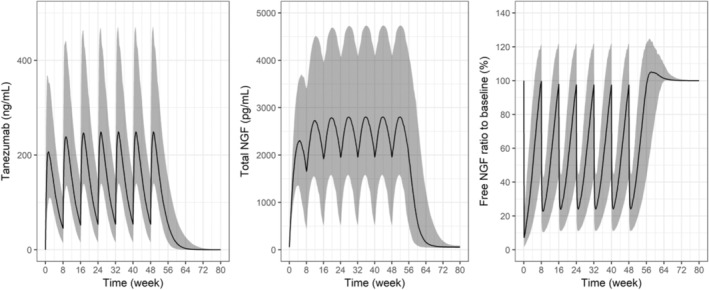
Model predicted tanezumab, total NGF, and free NGF profiles (median [95% CI]) following tanezumab 2.5 mg s.c. abdominal administration every 8 weeks. Individual predicted concentration‐time data following tanezumab 2.5 mg s.c. abdominal administration every 8 weeks up to seven times were generated (N = 500) by randomly sampling η(s) (interindividual variability) and covariate data from patients in the studies. Free NGF (%) = predicted free NGF/baseline NGF*100. CI, confidence interval; NGF, nerve growth factor.
FIGURE 4.
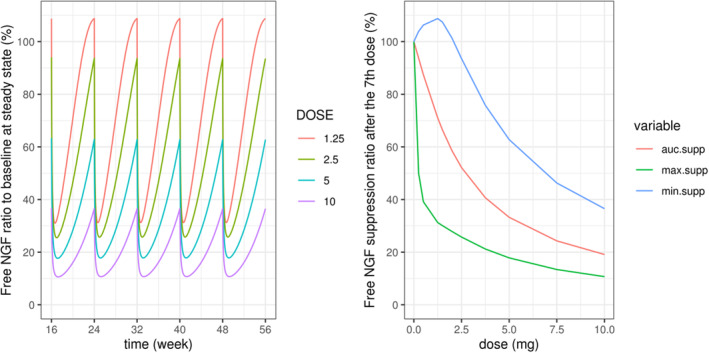
Predicted free NGF versus time and dose–response relationships for a typical patient. Free NGF [%] = predicted free NGF/baseline NGF*100. Typical patient: a female patient with body weight 84.7 kg, creatinine clearance 93.5 mL/min, and age 59 years, who received tanezumab s.c. every 8 weeks (injection site abdomen). Clearance (CL) for 2.5 and 5 mg dose group was used for this simulation. AUC, area under the concentration–time curve; auc. supp, AUC for free NGF from 48 to 56 weeks relative to the AUC without suppression (%); max. supp, maximum suppression (lowest concentration) for free NGF during 48–56 weeks relative to no suppression (baseline concentration; %); min. supp, minimum suppression (highest concentration) for free NGF during 48–56 weeks relative to no suppression (baseline concentration; %); NGF, nerve growth factor.
DISCUSSION
An indirect response model interpretation of TMDD approximation models 9 , 10 was successfully applied to plasma tanezumab and serum total NGF concentration data from three phase III studies in patients with OA.
In this analysis, population PK parameters were fixed to those from the previously developed PK model including a linear and nonlinear (Michaelis–Menten) parallel elimination, as shown in Equations (1), (2), (3) and only NGF related parameters in Equation 4 were estimated. This approach is considered capable of estimating the TMDD parameters under the assumptions that the free drug, free target, and drug–target complex are at equilibrium or quasi‐steady‐state and that this PK model correctly describes free tanezumab concentration for each patient. 10 A Michaelis–Menten TMDD approximation model (MM) proposed by Leonid et al. 9 replaced K int⸱R tot and K ss with V max and K m , respectively. However, our model estimated K ss without fixing its value to KM value. Therefore, this model is not a version of the MM model, but a version of an indirect response model given the predicted individual plasma tanezumab concentration from the population PK model as a driving force. The population PK model detected some nonlinearity, whereas it was uncertain what extent of the nonlinearity was from interaction between tanezumab and NGF. In comparison, the total NGF data in this analysis provided a precise estimate for K ss which was about 40‐fold lower than KM estimate from population PK analysis.
In accordance with the approximation model (C tot = C + RC; RC = R tot⸱C/(K ss + C)) and considering plasma tanezumab concentration is comprised of tanezumab free from and bound to NGF, C tot should be used for plasma tanezumab concentration as C + R tot⸱C/(K ss + C), whereas this model assumes total, free, and plasma tanezumab concentration are same (C tot = C = C′), which may deviate from the approximation model concept. However, as shown in observed concentration levels of total NGF (pg/mL) and plasma tanezumab (ng/mL), ratio of total NGF to plasma tanezumab concentrations (as ng/mL) from samples taken at the same time point (n = 674 pairs) was small (median [2.5th–97.5th percentile], 2.9% [0.8%–6.7%]). This indicates that plasma tanezumab concentration is much higher than R tot. Additionally, predicted total NGF concentration is around 0.5–4.5 ng/mL at steady‐state, whereas predicted tanezumab plasma concentration approximately ranges from 25 ng/mL to 450 ng/mL at steady state following 2.5 mg s.c. administration (Figure 3), indicating that the second term, R tot⸱C/(K ss + C), would be relatively small at the dose level. Since free tanezumab concentration (C ≈ C tot) is also considered much higher than free NGF (R ≤ R tot), this model is also in line with a finding that quasi‐equilibrium approximation may not be maintained when free target concentrations exceed the drug concentrations by an order of a magnitude. 8 When C′ in Equations (4), (5), (6) was replaced with C (Equation 10 in Appendix S1), population parameter estimates and individual predicted concentrations for C tot, C, RC, R tot, and R were similar to those of this analysis (Table S4 and Figure S6). Therefore, we think this assumption would be acceptable to infer relative concentration profile for free NGF, although we should be cautious about interpretation of the results due to limitations led by assumptions made in this analysis.
The estimated baseline NGF value (27.3 pg/mL) is generally close to the NGF concentration reported in healthy volunteers (median [range], 19.68 pg/mL [6.44, 3589] pg/mL). 25 Median proNGF concentrations in patients with Parkinson's disease and healthy subjects were reported to be 94.91 pg/mL and 106.67 pg/mL, respectively. 26 Based on the NGF (19.68 pg/mL) 25 and proNGF (106.67 pg/mL) 26 values in healthy volunteers, the proNGF to NGF ratio across these two studies would be ~5:1, which is different from our assumed ratio (1:1). However, the reported proNGF values (94.91 and 106.67 pg/mL) 26 are approximately two times higher than observed (50 pg/mL) and predicted (55 pg/mL) baseline total NGF values in this analysis and approximately four‐fold the free NGF assuming 1:1 ratio with pro‐NGF. Although observed/predicted baseline NGF levels and assumed proNGF levels in this analysis seem to be not far from previously reported values, it may be difficult to compare these results across studies because of differences in assay method, disease condition, and relatively large interindividual variability.
The modeling outcome provided great insight into unobserved free NGF suppression; however, there are certain limitations that need to be considered. It is recognized that there is uncertainty in proNGF to NGF ratio due to assay issues. Nonetheless, sensitivity analysis indicated that the predictions of total NGF and the predicted ratio of free NGF to baseline NGF were not significantly influenced by assumptions regarding the proNGF to baseline NGF ratio (Figure S5). Another limitation which has a potential impact on the results is an assumption that proNGF is constant across the dosing period regardless of NGF interaction with tanezumab. However, as described in the Data section, relative amount for proNGF as an internal standard corrected peak area ratio suggested that mean proNGF concentrations would be comparable across treatment groups at all sampling times. Additionally, based on total NGF levels reaching a plateau, it is unlikely that there is significant upregulation in the production of pro‐NGF that would significantly impact predicted free or bound NGF levels achieved in the systemic circulation on steady‐state dosing.
The K ss estimate (range from the sensitivity analysis [Table S3]) was 0.728 (0.132, 1.33) ng/mL, which was close to previously reported value (0.776 ng/mL). 11 The estimate can be converted to 4.9 (0.9, 8.9) pM with the approximate molecular weight of tanezumab of 150 kDa (previously reported value 11 converted to 5.2 pM). In vitro K D values for tanezumab IgG and NGF were reported to be less than 100 pM (Biacore analysis) and 10 (95% CI, 1–30) pM (KinExA analysis). 4 When assuming k int ≪ k off, K ss numerically approximates K D . Because the K ss estimate in this analysis is within 95% CI for KinExA K D , our estimated potency under the assumption is also considered consistent with the preclinical estimate. Additionally, the estimate of endogenous NGF half‐life from k deg (2.61 h) is relatively consistent with estimates of the half‐life of NGF administered to other species 2.3–4.5 h. 27 , 28
Simulations suggest that free NGF concentration in the systemic circulation may fluctuate significantly within the dosing interval as predicted that free NGF suppression ranged from 75% (median) at the peak tanezumab concentration to less than 5% (median) at the trough concentration following tanezumab 2.5 mg s.c. administration q8w. Phase III, randomized, placebo‐controlled clinical studies have provided information regarding the PK and pharmacodynamics of tanezumab administered s.c. at doses of 2.5–5 mg for 16–24 weeks in patients with OA. Results of analyses for weekly average pain score (WPS) in patients with OA, including studies A4091056 29 and A4091057 30 suggested that fluctuation for the drug effect (placebo‐corrected change from baseline in WPS) following s.c. administration of tanezumab 2.5 mg q8w would be small, and the drug effect would be maintained within the dosing interval (data not shown). Therefore, there may be some difference between temporal change in systemic free NGF levels and time course of clinical response to tanezumab.
The rapid onset of effect and overall sustained effect of tanezumab in terms of pain relief in patients with OA may be due to the combination of the immediate nociceptor desensitization followed by the delayed indirect downregulation of cell surface receptors and neurotransmitters associated with nociception. 31 An assumption underpinning the model predictions is that the systemic changes in NGF mirror that in the osteoarthritic joint tissues. 32 In this regard, a recent systematic review could not find consistent evidence to support synovial fluid levels being higher. 33 Given the large excess of tanezumab over NGF, the predictions are also expected to be robust to fold increases in tissue levels over plasma levels. Similarly, the distribution of tanezumab into the synovial fluid and associated tissue could be slower to equilibrate and achieve lower steady state concentrations. However, it is expected, as per published literature, that the synovium and surrounding tissue would be relatively leaky due to the ongoing inflammation, 34 so overall impact of tissue distribution on suppression is expected to be the minimal. Whereas the overall dynamics of the system are considered more related to the dual nociceptive effects of NGF suppression already described, there are some reports that minimal physiologically‐based PK models can characterize relationships between anti‐inflammatory drug kinetics at the site of action and responses using preclinical or clinical data. 34 , 35 , 36 Therefore, further work in this regard for tanezumab is warranted.
Although there is limitation that TMDD approximation models may lead to overestimation of free target suppression during fast phase (e.g., after the first dose), previous sensitivity analysis showed that difference in free target concentration‐time profile between full and approximation TMDD models would be slight at steady‐state and in the elimination phase. This supports adequacy of inferring free NGF levels in the elimination phase based on this approximation model. 12 In this analysis, simulations predicted that free NGF concentration return to the baseline level relatively fast following the last dose of tanezumab s.c. 2.5 mg q8w (about 8 weeks with 95% prediction interval of 5–16 weeks). Considering that plasma tanezumab has a half‐life of ~3 weeks, 13 free NGF concentration in systemic circulation would be close to the normal level before tanezumab is eliminated from plasma (e.g., 16 weeks after the last s.c. dose corresponds to ~5 half‐lives).
The dose–response simulation in a typical patient showed that the maximum free NGF suppression rapidly increased up to around 1 mg of tanezumab s.c. dose q8w and the suppression was about 70% at around tanezumab 2.5 mg q8w (Figure 4). In the placebo‐controlled phase III studies in patients with OA, tanezumab 2.5 and 2.5/5 mg (2.5 mg at baseline and 5 mg at week 8) q8w at week 16 (Study A4091056) and tanezumab 2.5 and 5 mg q8w at week 24 (Study A4091057, except for one end point from 2.5 mg) statistically improved all three coprimary efficacy end points. 29 , 30 Although relationships between systemic free NGF level and clinical response to tanezumab have not been fully elucidated, the simulation results suggest that dose response for free NGF suppression are in line with the efficacy results for tanezumab 2.5 and 5 mg q8w observed in the clinical studies. These results align with recent model‐based dose‐exposure response pooled analysis showing pain relief efficacy of tanezumab 2.5 and 5 mg q8w. 37
CONCLUSIONS
This TMDD approximation model adequately described plasma tanezumab and serum total NGF concentrations following s.c. administration every 8 weeks of tanezumab 2.5 or 5 mg in patients with OA. The model allowed prediction of relative change in unobserved systemic free NGF concentration following s.c. administration of tanezumab.
AUTHOR CONTRIBUTIONS
S.S., A.S., P.N., C.C., P.G., and S.M. wrote the manuscript. S.S., S.M., and P.G. designed the research. S.S., A.S., P.N., and C.C. performed the research. S.S. and A.S. analyzed the data.
FUNDING INFORMATION
This study was funded by Pfizer and Eli Lilly and Company.
CONFLICT OF INTEREST STATEMENT
S.S., A.S., P.N., C.‐H.C., and P.G. are employees of, and own stock/options in, Pfizer. S.M. was an employee of Pfizer at the time of this work (currently affiliated with GSK) and owns stock/options in Pfizer.
Supporting information
Appendix S1
ACKNOWLEDGMENTS
Medical writing support was provided by Margit Rezabek, DVM, PhD, of Engage Scientific Solutions and was funded by Pfizer and Eli Lilly and Company.
Shoji S, Suzuki A, Nouri P, Cai C‐H, Gaitonde P, Marshall S. Prediction of relative change in free nerve growth factor following subcutaneous administration of tanezumab, a novel monoclonal antibody to nerve growth factor. CPT Pharmacometrics Syst Pharmacol. 2023;12:1358‐1370. doi: 10.1002/psp4.13015
ClinicalTrials.gov registration: NCT02697773; NCT02709486; and NCT02528188.
DATA AVAILABILITY STATEMENT
Upon request, and subject to review, Pfizer will provide the data that support the findings of this study. Subject to certain criteria, conditions and exceptions, Pfizer may also provide access to the related individual de‐identified participant data. See https://www.pfizer.com/science/clinical‐trials/trial‐data‐and‐results for more information.
REFERENCES
- 1. Hondermarck H. Neurotrophins and their receptors in breast cancer. Cytokine Growth Factor Rev. 2012;23:357‐365. [DOI] [PubMed] [Google Scholar]
- 2. Schecterson LC, Bothwell M. Neurotrophin receptors: old friends with new partners. Dev Neurobiol. 2010;70:332‐338. [DOI] [PubMed] [Google Scholar]
- 3. Barker PA, Mantyh P, Arendt‐Nielsen L, Viktrup L, Tive L. Nerve growth factor signaling and its contribution to pain. J Pain Res. 2020;13:1223‐1241. [DOI] [PMC free article] [PubMed] [Google Scholar]
- 4. Abdiche YN, Malashock DS, Pons J. Probing the binding mechanism and affinity of tanezumab, a recombinant humanized anti‐NGF monoclonal antibody, using a repertoire of biosensors. Protein Sci. 2008;17:1326‐1335. [DOI] [PMC free article] [PubMed] [Google Scholar]
- 5. Zheng S, McIntosh T, Wang W. Utility of free and total target measurements as target engagement and efficacy biomarkers in biotherapeutic development‐opportunities and challenges. J Clin Pharmacol. 2015;55:S75‐S84. [DOI] [PubMed] [Google Scholar]
- 6. Ayyar VS, Jaiprasart P, Geist B, et al. Translational PK/PD and model‐informed development of JNJ‐67842125, a fab reversal agent for JNJ‐64179375, a long‐acting thrombin inhibitor. Br J Pharmacol. 2021;178:3943‐3958. [DOI] [PubMed] [Google Scholar]
- 7. Mager DE, Jusko WJ. General pharmacokinetic model for drugs exhibiting target‐mediated drug disposition. J Pharmacokinet Pharmacodyn. 2001;28:507‐532. [DOI] [PubMed] [Google Scholar]
- 8. Mager DE, Krzyzanski W. Quasi‐equilibrium pharmacokinetic model for drugs exhibiting target‐mediated drug disposition. Pharm Res. 2005;22:1589‐1596. [DOI] [PubMed] [Google Scholar]
- 9. Gibiansky L, Gibiansky E, Kakkar T, Ma P. Approximations of the target‐mediated drug disposition model and identifiability of model parameters. J Pharmacokinet Pharmacodyn. 2008;35:573‐591. [DOI] [PubMed] [Google Scholar]
- 10. Gibiansky L, Gibiansky E. Target‐mediated drug disposition model: relationships with indirect response models and application to population PK‐PD analysis. J Pharmacokinet Pharmacodyn. 2009;36:341‐351. [DOI] [PubMed] [Google Scholar]
- 11. Arends RH, Kaila N, Marshall SF, Gibiansky L. Translational modeling of tanezumab pharmacokinetics (PK) and tanezumab‐NGF relationship to predict free NGF concentrations in nonhuman primates (NHP) and humans. Paper presented at: American Association of Pharmaceutical Scientists (AAPS) National Biotechnology Conference; May 16–18; Boston, Massachusetts, USA. 2016.
- 12. Shoji S, Marshall S, Xie R, Arends R. Slow drug‐target complex kinetics and first dose overestimation of free target suppression in target‐mediated drug disposition (TMDD) approximation models: an evaluation for tanezumab a NGF antibody for treatment of pain. Paper presented at: population approach Group in Europe (PAGE); Budapest, Hungary. 2017.
- 13. Shoji S, Suzuki A, Gaitonde P, Cai C‐H, Marshall S. Population pharmacokinetics of tanezumab following intravenous or subcutaneous administration to patients with osteoarthritis or chronic low back pain. Br J Clin Pharmacol. 2022;88:3321‐3334. [DOI] [PubMed] [Google Scholar]
- 14. Dua P, Hawkins E, van der Graaf PH. A tutorial on target‐mediated drug disposition (TMDD) models. CPT Pharmacometrics Syst Pharmacol. 2015;4:324‐337. [DOI] [PMC free article] [PubMed] [Google Scholar]
- 15. Holford N. The visual predictive check – superiority to standard diagnostic (rorschach) plots (abstract 738). Paper presented at: Population Approach Group in Europe (PAGE); Pamplona, Spain. 2005.
- 16. Karlsson MO, Holford N. A tutorial on visual predictive checks (abstract 1434). Paper presented at: Population Approach Group in Europe (PAGE); Marseille, France. 2008.
- 17. Jonsson EN, Karlsson MO. Xpose‐‐an S‐PLUS based population pharmacokinetic/pharmacodynamic model building aid for NONMEM. Comput Methods Programs Biomed. 1999;58:51‐64. [DOI] [PubMed] [Google Scholar]
- 18. Keizer RJ, Karlsson MO, Hooker A. Modeling and simulation workbench for NONMEM: tutorial on pirana, PsN, and Xpose. CPT: Pharmacometr Syst Pharmacology. 2013;2:e50. [DOI] [PMC free article] [PubMed] [Google Scholar]
- 19. Bergstrand M, Hooker AC, Wallin JE, Karlsson MO. Prediction‐corrected visual predictive checks for diagnosing nonlinear mixed‐effects models. AAPS J. 2011;13:143‐151. [DOI] [PMC free article] [PubMed] [Google Scholar]
- 20. Dosne AG, Bergstrand M, Karlsson MO. An automated sampling importance resampling procedure for estimating parameter uncertainty. J Pharmacokinet Pharmacodyn. 2017;44:509‐520. [DOI] [PMC free article] [PubMed] [Google Scholar]
- 21. Baron KT. mrgsolve: Simulate from ODE‐based models. R package version 0.9.2. 2019. Accessed September 13, 2021. https://CRAN.R‐project.org/package=mrgsolve
- 22. Beal SL, Sheiner LB, Boeckmann AJ, Bauer RJ, eds. NONMEM 7.3.0 Users Guides. ICON Development Solutions; 1989. –2013. [Google Scholar]
- 23. Lindbom L, Pihlgren P, Jonsson EN. PsN‐toolkit‐a collection of computer intensive statistical methods for non‐linear mixed effect modeling using NONMEM. Comput Methods Programs Biomed. 2005;79:241‐257. [DOI] [PubMed] [Google Scholar]
- 24. R Development Core Team . R: a language and environment for statistical computing. https://cran.r‐project.org/manuals.html. Accessed March 30, 2022
- 25. Lang UE, Gallinat J, Danker‐Hopfe H, Bajbouj M, Hellweg R. Nerve growth factor serum concentrations in healthy human volunteers: physiological variance and stability. Neurosci Lett. 2003;344:13‐16. [DOI] [PubMed] [Google Scholar]
- 26. Xu XM, Dong MX, Feng X, et al. Decreased serum proNGF concentration in patients with Parkinson's disease. Neurol Sci. 2018;39:91‐96. [DOI] [PubMed] [Google Scholar]
- 27. Tria MA, Fusco M, Vantini G, Mariot R. Pharmacokinetics of nerve growth factor (NGF) following different routes of administration to adult rats. Exp Neurol. 1994;127:178‐183. [DOI] [PubMed] [Google Scholar]
- 28. Alastra G, Aloe L, Baldassarro VA, et al. Nerve growth factor biodelivery: a limiting step in moving toward extensive clinical application? Front Neurosci. 2021;15:695592. [DOI] [PMC free article] [PubMed] [Google Scholar]
- 29. Schnitzer TJ, Easton R, Pang S, et al. Effect of tanezumab on joint pain, physical function, and patient global assessment of osteoarthritis among patients with osteoarthritis of the hip or knee: a randomized clinical trial. JAMA. 2019;322:37‐48. [DOI] [PMC free article] [PubMed] [Google Scholar]
- 30. Berenbaum F, Blanco FJ, Guermazi A, et al. Subcutaneous tanezumab for osteoarthritis of the hip or knee: efficacy and safety results from a 24‐week randomised phase III study with a 24‐week follow‐up period. Ann Rheum Dis. 2020;79:800‐810. [DOI] [PMC free article] [PubMed] [Google Scholar]
- 31. Chang DS, Hsu E, Hottinger DG, Cohen SP. Anti‐nerve growth factor in pain management: current evidence. J Pain Res. 2016;9:373‐383. [DOI] [PMC free article] [PubMed] [Google Scholar]
- 32. O'Neill TW, Felson DT. Mechanisms of osteoarthritis (OA) pain. Curr Osteoporos Rep. 2018;16:611‐616. [DOI] [PMC free article] [PubMed] [Google Scholar]
- 33. Baldini M, Farinelli L, Luciani P, Manzotti S, Salaffi F, Gigante A. Synovial and serum levels of NGF in osteoarthritis and rheumatic diseases: a systematic review. J Biol Regul Homeost Agents. 2020;34:25‐32. [PubMed] [Google Scholar]
- 34. Chen X, Jiang X, Jusko WJ, Zhou H, Wang W. Minimal physiologically‐based pharmacokinetic (mPBPK) model for a monoclonal antibody against interleukin‐6 in mice with collagen‐induced arthritis. J Pharmacokinet Pharmacodyn. 2016;43:291‐304. [DOI] [PMC free article] [PubMed] [Google Scholar]
- 35. Zheng S, Niu J, Geist B, et al. A minimal physiologically based pharmacokinetic model to characterize colon TNF suppression and treatment effects of an anti‐TNF monoclonal antibody in a mouse inflammatory bowel disease model. MAbs. 2020;12:1813962. [DOI] [PMC free article] [PubMed] [Google Scholar]
- 36. Ayyar VS, Lee JB, Wang W, et al. Minimal physiologically‐based pharmacokinetic (mPBPK) metamodeling of target engagement in skin informs anti‐IL17A drug development in psoriasis. Front Pharmacol. 2022;13:862291. [DOI] [PMC free article] [PubMed] [Google Scholar]
- 37. Boucher M, Verburg K, Gaitonde P, Marshall S. Dose (exposure) efficacy response of tanezumab following intravenous and subcutaneous administration across phase 2 and phase 3 studies in patients with osteoarthritis of hip and knee. Paper presented at: Twelfth American Conference on Pharmacometrics (ACoP12). 2021.
- 38. Jonsson EN, Xie R, Marshall SF, Arends RH. Population pharmacokinetics of tanezumab in phase 3 clinical trials for osteoarthritis pain. Br J Clin Pharmacol. 2016;81:688‐699. [DOI] [PMC free article] [PubMed] [Google Scholar]
Associated Data
This section collects any data citations, data availability statements, or supplementary materials included in this article.
Supplementary Materials
Appendix S1
Data Availability Statement
Upon request, and subject to review, Pfizer will provide the data that support the findings of this study. Subject to certain criteria, conditions and exceptions, Pfizer may also provide access to the related individual de‐identified participant data. See https://www.pfizer.com/science/clinical‐trials/trial‐data‐and‐results for more information.