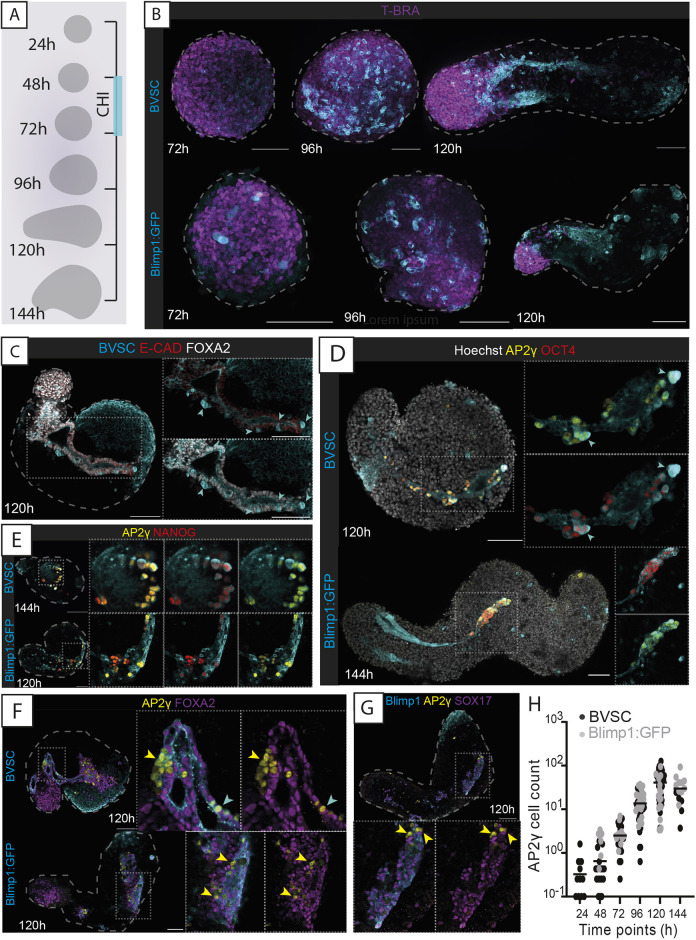
Fig. 1.
Characterising gastruloid-derived PGCLCs. (A) Schematic of gastruloid protocol and morphological changes from 24 to 144 h. CHI, CHIR-99021. (B) Maximum-projection images of gastruloids from BVSC and Blimp1:GFP reporter lines. In BVSC gastruloids, Blimp1:mVenus is membrane-targeted, whereas Stella:eCFP is found throughout the cell. (C) Z-section images of Blimp1-mVenus+ endodermal tracts. (D) Expression of AP2γ and OCT4 in gastruloids. (E) Expression of AP2γ and NANOG in gastruloids. (F,G) AP2γ-expressing cells do not co-express FOXA2 (F) or SOX17 (G). (H) Cell counts of AP2γ-expressing cells from both Blimp1:GFP and BVSC gastruloids. Black bars represent the mean value at each time point. In B-E: cyan arrowheads, Stella+ cells; yellow arrowheads, AP2γ+ cells; insets, higher-magnification images; dashed lines, morphological gastruloid outline from Hoechst staining; dotted lines, magnification regions. Images are representative of 4-32 gastruloids per panel. Scale bars: 100 µm.

