Fig. 3.
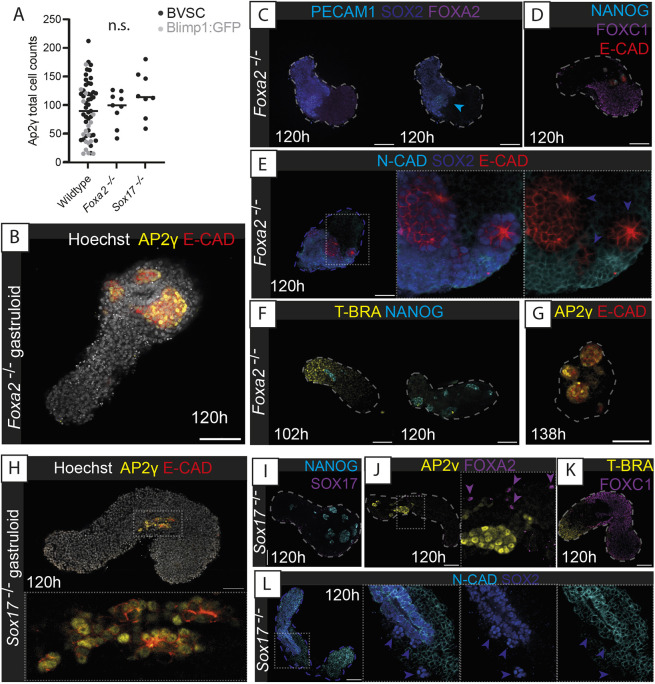
Knockout of gastruloid endodermal tissue leads to aberrant Gld-PGCLC localisation but maintains mesodermal and ectodermal populations. (A) Quantification of AP2γ+ cell counts in Blimp1:GFP and BVSC gastruloids (wildtype), alongside Foxa2−/− and Sox17−/− gastruloids. Black bars indicate the median average; n.s., no significant difference. (B) AP2γ+ cells localise into large clusters in Foxa2−/− gastruloids and show no E-cadherin (E-CAD-positive) endodermal tracts (AP2γ negative). (C) Confirmation of lack of FOXA2 expression in Foxa2−/− gastruloids. Blue arrowhead indicates a population of SOX2+, PECAM1+ PGCLCs. (D) Maintenance of FOXC1 mesoderm in Foxa2−/− gastruloids at 120 h. (E) Neural ectodermal cell types present in Foxa2−/− gastruloids as evidenced by N-Cadherin (N-CAD or CDH2) and SOX2 expression. (F) Mesodermal T-BRA expression in Foxa2−/− gastruloids was seen at 102 h but not at 120 h. (G) Later-stage putative Gld-PGCLC in 138 h Foxa2−/− gastruloids. (H) AP2γ+ cells localise into large clusters in Sox17−/− gastruloids and show no E-cadherin (E-CAD)-positive endodermal tracts (AP2γ negative). (I) Confirmation of lack of SOX17−/− expression detected in Sox17−/− gastruloids. (J) Presence of several scattered FOXA2+ cells (purple arrowheads) in Sox17−/− gastruloids. (K) Maintenance of FOXC1 mesoderm in Sox17−/− gastruloids at 120 h. (L) Neural ectodermal cell types present in Sox17−/− gastruloids as evidenced by N-Cadherin (N-CAD) and SOX2 expression. Violet arrowheads, SOX2+, N-CAD− cells likely to be Gld-PGCLCs. In E,H,J,L, insets show higher-magnification images. Dashed lines, morphological gastruloid outline from Hoechst staining; dotted lines, magnification regions. Images are representative of 4-13 gastruloids per panel. Scale bars: 100 µm.

