

Abstract
Disparities exist in referral and access to the liver transplant (LT) waitlist, and social determinants of health (SDOH) are increasingly recognized as important factors driving health inequities, including in LT. The SDOH of potential transplant candidates are therefore important to characterize when designing targeted interventions to promote equity in access to LT. Yet, it is uncertain how a transplant center should approach this issue and characterize SDOH, identify disparities, and use this data to inform interventions. We performed a retrospective study of referrals for first-time, single-organ LT to our center from 2016-2020. Addresses were geoprocessed and mapped to the corresponding county, census tract, and census block group to assess their geospatial distribution, identify potential disparities in referrals, and characterize their communities across multiple domains of SDOH to identify potential barriers to evaluation and selection. We identified variability in referral patterns and areas with disproportionately low referrals, including counties in the highest quartile of liver disease mortality (9%) and neighborhoods in the highest quintile of socioeconomic deprivation (17%) and quartile of poverty (21%). Black individuals were also underrepresented compared to expected state demographics (12 vs. 18%). Among the referral population, several potential barriers to evaluation and selection for LT were identified, including poverty, educational attainment, access to healthy food, and access to technology. This approach to characterization of a transplant center’s referral population by geographic location and associated SDOH demonstrates a model for identifying disparities in a referral population and potential barriers to evaluation that can be used to inform targeted interventions for disparities in LT access.
Keywords: liver transplant, social determinants of health, waitlist, disparities
Introduction
Liver transplantation (LT) is a life-saving treatment for advanced liver disease. The LT care continuum is a complex, multistep process that begins with a referral, followed by evaluation, placement on the waitlist following a committee review, and ultimately transplantation. Disparities may arise at any stage in this process, and disproportionately low rates of transplantation and inferior outcomes for historically marginalized groups have been observed for decades.1–9
Prior literature has focused primarily on outcomes of patients on the waitlist and post-transplant, while studies on access to referral and the waitlist have been more limited, despite these being critical steps in access to LT.1,2 This is largely due to the availability of data on patients after listing and transplant, while information on referral and selection patterns is more scarce due to the fragmented healthcare system as well as lack of reliable national data on liver disease prevalence and severity. Limited existing data have, however, demonstrated disparities in waitlist access by several non-clinical factors, including race, sex, insurance, and socioeconomic status, and have also highlighted the importance of community of residence and access to care.3,4,6,7,9–12 Rurality, distance to a transplant center, region, state of residence, access to specialty care, and state Community Health Scores have all been associated with decreased likelihood of waitlist access.3,4,6,7,10,11 These findings underscore the role of social determinants of health (SDOH), defined broadly by the World Health Organization as “the circumstances in which people are born, grow up, live, work, and age…and the systems put in place to offer health care and services to a community,” in access to transplant. SDOH are increasingly recognized as important factors impacting health and driving health inequities, including in LT.13
The communities and associated SDOH of potential transplant candidates are thus critical to characterize and understand when designing targeted interventions to promote equity in access to LT. Given the complexity of the relationships among transplant centers, the communities they serve, SDOH, and referral and evaluation for transplant, successful interventions will likely require a multipronged approach, and center-level efforts will be essential. Yet, it is uncertain how a center should approach these issues and utilize the spectrum of data available to identify potential disparities in access to transplant in order to design interventions.
We performed this study with the following aims: 1) to assess the geospatial distribution of a referral population of a single transplant center and to identify potential disparities in referrals and 2) to characterize the communities of residence and structural SDOH of the referral population and identify potential barriers to evaluation which may be amenable to intervention. We hypothesized that we would find variability in referral patterns by geographic location and associated access to care and community socioeconomic status.
Methods
Referral Population
All first-time referrals to our center for LT between 2016 and 2020 from North Carolina and the surrounding states (South Carolina, Virginia, and Tennessee) were identified. Patients referred for a second organ transplant or multiorgan transplant were excluded. Individual demographic information, including age, sex, race, ethnicity, insurance, and primary language was obtained from the electronic medical record. Designated racial groups of Asian, American Indian/Alaska Native, Native Hawaiian/Pacific Islander, or multiple races were grouped into an “Other” category due to small numbers. The home addresses of referred patients were geoprocessed and mapped to the according census block group, census tract, and county, allowing for analysis of their communities and SDOH at these levels. The distance to the transplant center was also determined.
Disparities in Referrals and Social Determinants of Health
In order to evaluate for potential disparities in referrals, the distribution of referrals by degree of access to specialty care for liver disease, county rurality, burden of liver disease-related mortality, neighborhood socioeconomic deprivation, community poverty, uninsured population, and educational attainment was assessed. Socioeconomic deprivation was assessed by two deprivation indices, the Area Deprivation Index (ADI) and Social Vulnerability Index (SVI). These indices include poverty and educational attainment, though these were also included separately to specifically evaluate their relationship. The referral population was also characterized by access to healthy food and technology. Measures were included at the narrowest geographic level available. For most this was the census block group or census tract, which approximate neighborhood level. When able, measures were defined according to the National Institutes of Health PhenX structural SDOH toolkit, which standardizes definitions to ensure consistency across studies.14
Access to Specialty Care
Access to specialty care for liver disease was obtained from two sources: the 2021 Area Health Resources File, which provided the number of gastroenterologists per county in 2019, and the North Carolina Medical Board roster as of October 2021, which contained information regarding the location of active gastroenterology (GI) practitioners, including physicians, physician assistants, and nurse practitioners.15 The density of GI providers per 100,000 population in a county was determined and expressed by quartile.
Rurality
County rurality was defined according to the 2013 Urban Influence Codes and the Office of Management and Budget classification as metropolitan, micropolitan, and non-core.16 Metropolitan counties are counties with urbanized populations of 50,000 or more and the neighboring economically tied counties, with 25% of workers commuting between them. Micropolitan areas are smaller urban clusters (10,000-49,999 people), and the remaining counties are non-core counties. Non-metropolitan areas are considered rural.
Liver Disease-Related Mortality
Data on county-level liver disease mortality for adults ages 25-74 from 2016-2020 were obtained from the Centers for Disease Control and Prevention’s (CDC) Wide-ranging Online Data for Epidemiologic Research.17 A diagnosis of alcohol-related liver disease, chronic hepatitis, hepatic fibrosis, cirrhosis, portal hypertension, hepatorenal syndrome, or hepatocellular carcinoma as the underlying cause of death was considered death from liver disease, similar to previous studies using this database (Table S1).18 These data were suppressed by the CDC for counties which had <10 deaths during this time period, which included five from North Carolina, five from Tennessee, and 21 from Virginia. Included data accounted for 99.6%, 99.5%, and 98.3% of liver disease-related deaths in these states, respectively, from 2016-2020. Crude mortality rates were split into quartiles to stratify counties by burden of liver-related mortality, and the ratio of referrals to liver disease deaths per county was also determined and stratified into quartiles. In addition to county-level data, the total mortality from liver disease for the included states by race and ethnicity was obtained to compare these demographics to the referral population.
Area Deprivation Index
The ADI is an index of neighborhood socioeconomic disadvantage at the census block group level incorporating 17 indicators, including educational attainment, income, home ownership, unemployment, poverty, crowded housing, access to car, and access to telephone, among others (Table S2). In this study, the 2019 edition was incorporated and expressed by state quintile. This was included in addition to the SVI as it focuses on a narrower geographic area and their components differ slightly, with the SVI including race/ethnicity and additional demographic variables.
Social Vulnerability Index
The CDC/Agency for Toxic Substances and Disease Registry SVI evaluates the social vulnerability of a community and was initially created to identify communities that may need support with disasters.19 It incorporates data at the census tract level on 15 factors across four themes: socioeconomic (below poverty level, unemployed, income, no high school diploma), household composition and disability (aged ≥65, aged <18, >5 with disability, single-parent households), minority status and language (minority, speak English “less than well”), and housing and transportation (multi-unit structures, mobile homes, crowding, no vehicle, group quarters) (Table S2). Each census tract receives a ranking for each theme and an overall ranking, which are published as national percentiles. The 2018 version was utilized and expressed according to quintile among the included states.
Poverty, Educational Attainment, Insurance Status
Data on poverty, educational attainment, and insurance status were obtained from the 2019 American Community Survey (ACS) 5-year estimates.20 The ACS is a survey conducted by the Census Bureau on a broad range of topics, with yearly data release. The proportions of a census block group under the poverty level and without a high school diploma were determined, as was the proportion of a census tract without health insurance. These measures were expressed as quartiles among the included states, and a high poverty area was defined as an area with at least 40% of the population under the poverty level.14
Access to Healthy Food
Access to healthy food was evaluated by two measures: low access to a grocery store, and the relative availability of healthy to unhealthy food options. Low access was defined at the census tract level by the 2019 US Department of Agriculture (USDA) Food Access Research Atlas as an area with at least 500 people or 33% of the population living more than one mile (urban areas) or 10 miles (rural areas) from the nearest grocery store or supermarket.21 Areas considered both low access and low income are classified as food deserts. This was supplemented by an assessment of the presence of food swamps, or areas with high density of unhealthy food relative to healthier options. This was determined using the Retail Food Environment Index (RFEI) for each county.14 The RFEI is calculated from the number of fast food restaurants and convenience stores divided by the number of grocery stores and supermarkets, and these data were obtained from the 2020 USDA Food Environment Atlas.22
Access to Technology
Access to technology was assessed across three domains: device ownership, internet in home, and availability of broadband at speeds meeting the Federal Communications Commission (FCC) standard (≥25 Megabits per second [Mbps] download speed and ≥3Mbps upload speed). Household access to devices and the internet was obtained from the 2019 ACS 5-year estimates at the census tract level.20 The proportion of a county provided access to internet meeting the FCC definition for broadband was ascertained from the Fourteenth FCC Broadband Deployment Report published in 2021, which contained data from internet service providers as of the end of 2019.23
Statistical Analysis
Disparities in Referrals
The proportion of referrals by rurality, degree of access to specialty care, burden of liver disease mortality, quintile of ADI and SVI, and quartile of community poverty, education, and insurance status were determined to assess for disparities in referrals. The observed proportions of referrals by ADI, SVI, poverty, educational attainment, and insurance status were compared to an expected equal distribution (i.e. 20% for quintiles and 25% for quartiles) using chi-square tests, and the proportion from high-poverty areas was also compared to the overall proportion of these areas. In addition, the racial distribution of the referral population was compared to the demographics of the population who experienced liver disease mortality. The Cochran-Armitage test for trend was performed to evaluate the relationship between county liver disease mortality quartile and degree of access to specialty care.
Barriers to Evaluation and Access to the Waitlist
To further characterize the communities and associated SDOH of the referral population and to identify potential barriers to evaluation and selection, descriptive statistics were additionally calculated for measures of access to food and technology.
All analyses were performed using SAS® version 9.4 (SAS Institute, Cary, NC). All research was conducted in accordance with both the Declarations of Helsinki and Istanbul, and this study was approved by the Duke University Institutional Review Board.
Results
Demographic Characteristics of Referral Population
Overall, 1971 individuals were referred for first-time LT at our center from 2016-2020, the majority of whom resided in North Carolina (n=1460, 74.1%). The mean age at referral was 56 years, and most patients were male (59%), White (82%), of non-Hispanic ethnicity (97%), English-speaking (93%), and lived within 100 miles of the transplant center (57%) (Table 1). Sixteen percent of the referred population was uninsured. In comparison to the population who experienced liver disease-related deaths over the same period, the referral population was less likely to be Black (12.2% vs. 18.1%, p<0.001), while the proportions of other races (White: 82.3% vs. 79.7%; other: 5.5% vs. 2.2%) and Hispanic ethnicity (2.8% vs. 2.8%) were more similar (Table S3).
Table 1.
Sociodemographic Characteristics of the Referral Population.
| All Referred, n=1971, % (n) | |
|---|---|
| Age, years, mean (SD) | 56.2 (11.9) |
| Sex | |
| Male | 59.3 (1169) |
| Female | 40.7 (802) |
| Racea | |
| White | 82.3 (1431) |
| Black | 12.2 (212) |
| Other | 5.5 (96) |
| Ethnicityb | |
| Hispanic | 2.8 (45) |
| Not Hispanic | 97.2 (1590) |
| Primary language | |
| English | 93.0 (1834) |
| Other language | 7.0 (137) |
| Insurancec | |
| Private | 35.8 (671) |
| Public | 47.8 (896) |
| Uninsured | 16.5 (309) |
| Distance from transplant center, miles, median (IQR) | 83.0 (33.3-147.3) |
| ≤50 miles | 31.3 (617) |
| >50-100 miles | 25.9 (511) |
| >100-150 miles | 18.5 (365) |
| >150 miles | 24.2 (478) |
Abbreviations: IQR, interquartile range; SD, standard deviation
Missing n=232.
Missing n=336.
Missing n=95.
Geographic Distribution of Referral Population
The geographic distribution of referrals is shown in Figure 1, overlaid on county rurality (Fig 1A) and degree of access to local gastroenterology (Fig 1B). In total, 61.8% of counties in the included states had no gastroenterologist, and 46.0% of counties in North Carolina had no GI physician or GI advanced practice provider. Most referrals were from non-rural areas and counties with a higher density of gastroenterologists, with over 50% of referrals from counties with the highest density (Fig 2A–B). The same was true when evaluated within North Carolina and inclusive of advanced practice providers: only 15% of referrals were from counties with no local GI care (Figure S1A and S2A).
Figure 1.

Geographic distribution of referrals superimposed on county rurality (A) and quartile of density of GI physicians per 100,000 population (B). Over 50% of counties had no local gastroenterologists, so quartile 1 and 2 are combined in B. Abbreviations: GI, gastroenterology.
Figure 2.
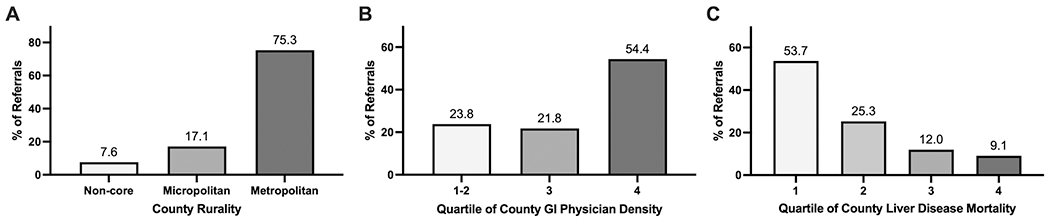
Distribution of referrals by county rurality (A), access to local GI physicians (B), and burden of liver disease mortality (C). Over 50% of counties had no local gastroenterologists, so quartile 1 and 2 are combined in (B). Quartile 3 included >0-2.6 GI physicians per 100,000 population, and quartile 4 included densities of ≥2.6. Cutoffs for mortality rates depicted in (C) were 27.0, 33.2, and 41.9 deaths per 100,000 population. Abbreviations: GI, gastroenterology.
In addition, the majority of referrals were from counties in the lowest quartile of liver-related mortality, and less than 10% came from counties in the highest mortality quartile (Fig 2C, Fig 3A, Fig S1B, Fig S2B). These counties were also least likely to have a local GI provider (66.3% in lowest mortality quartile vs. 46.5% in 2nd quartile vs. 32.6% in 3rd quartile vs. 19.8% in highest quartile, ptrend<0.001). Figure 3B depicts the ratio of referrals per liver disease-related deaths by quartile, which highlights specific counties with a low number of referrals for the burden of liver disease and further differentiates them by the absence of local GI care.
Figure 3.
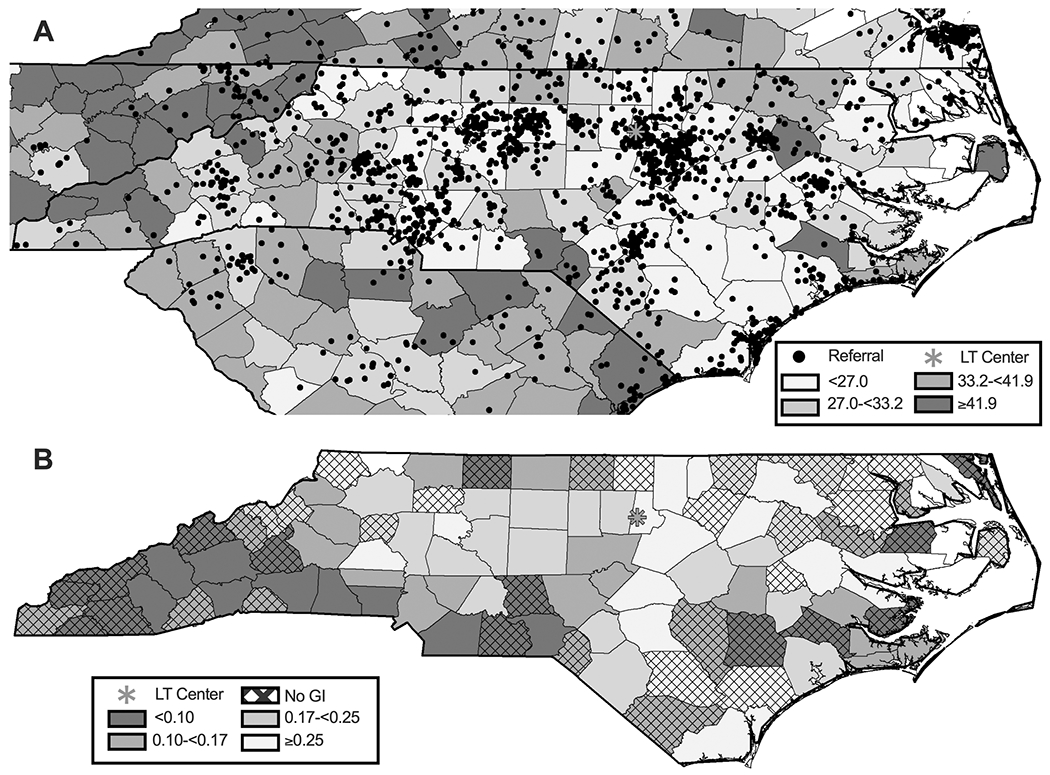
Geographic distribution of referrals superimposed on quartile of liver disease mortality (A) and the ratio of referrals to liver disease-related deaths (B). B also indicates counties without a local GI provider. Abbreviations: GI, gastroenterology; LT, liver transplant.
Referral Population and Deprivation Indices, Poverty, and Education
The distribution of referrals by ADI and SVI quintile is shown in Figure 4 and Figure S3. Overall, the proportion of referrals was lowest in the most deprived ADI quintile at 16.9% (p=0.001; Fig 4A). There was a greater proportion of referrals from more vulnerable areas according to the SVI, though when evaluated by subdomain, the highest quintile of socioeconomic vulnerability and minority population were similarly underrepresented at 17.4% and 18.5%, respectively (p<0.001; Fig 4B, Fig S4A–B). The other subdomains of household composition and housing and transportation were more similar to the trend observed for the overall SVI (Fig S4C–D).
Figure 4.

Distribution of referrals by ADI (A), SVI (B), poverty (C) and educational attainment (D). Poverty level quartile cutoffs: 5.1%, 11.6 %, and 21.8%. Educational attainment cutoffs: 5.0%, 11.1%, and 18.9%. Abbreviations: ADI, Area Deprivation Index; HS, high school; SVI, Social Vulnerability Index.
When assessed by quartile of poverty, the proportion of referrals overall slightly increased with increasing poverty, though referrals were least likely to be from the most impoverished areas (20.9%, p<0.001; Fig. 4C). In addition, though 6.3% of census block groups were considered high poverty areas, in which at least 40% of the population was under the poverty level, only 4.4% of referrals were from these neighborhoods. A similar pattern was observed with educational attainment, with the lowest proportion of referrals from areas with the lowest educational attainment (21.4%, p<0.001; Fig 4D). When evaluated by insurance status, areas with the highest uninsured population had among the lowest proportion of referrals (23.3%, p<0.001; Fig S4E).
Referral Population and Access to Food and Technology
Overall, 45.0% of the referral population lived in census tracts with low access to grocery stores, and 16.8% were from neighborhoods that were considered food deserts. In addition, 14% lived in counties with the highest ratio of unhealthy to healthy food options (food swamps), with over nine times the number of unhealthy options (Fig 5A).
Figure 5.

Distribution of referrals by quartile of food swamps (A), and access to technology (B, C, D). Food swamp cutoffs: RFEI 5.5, 7.2, 9.1. County broadband access cutoffs: 71.0%, 89.0%, and 97.0%. Household broadband cutoffs: 70.8%, 80.8%, and 90.0%. Household device cutoffs: 82.9%, 89.6%, 95.1%. Abbreviations: RFEI, Retail Food Environment Index.
The majority of referrals were from counties in the highest quartile of broadband availability, though over 20% lived in neighborhoods in which nearly one-third of households lacked broadband access and nearly 20% lacked a computer, tablet, and smartphone (Fig 5B–D).
Discussion
Referral and evaluation are critical steps in access to LT, though data on referral and selection patterns are scarce.1 The limited existing data have, however, demonstrated the importance of geographic location, highlighting the role of SDOH in access to transplant.3,4,6,7,10,11 These factors are thus important to characterize and understand when designing interventions to promote equity in access to LT. Yet, it is uncertain how a transplant center should approach this issue and utilize the spectrum of data available to inform these interventions. In this study we demonstrate the approach of a large transplant center in characterizing a referral population by geographic location and associated structural SDOH in order to identify potential disparities in referrals and barriers to evaluation, which can serve as a model for other centers to adopt to the populations they serve. Our work builds on prior studies identifying disparities in access to transplant referral and the waitlist and was performed with the intention of making center-level data actionable and informative for intervention development.3,4,6,7,9–12
We first evaluated the geospatial distribution of referrals and attempted to identify areas where they appeared disproportionately low, as we hypothesized that we would observe variability. We found that the vast majority of referrals were from metropolitan areas, consistent with prior data, and counties with greater access to local GI care.7,11 Despite nearly half of the counties in North Carolina lacking gastroenterology providers, these areas accounted for only 15% of referrals. Perhaps more concerning, however, was the low number of referrals (9%) from areas with the highest liver disease mortality. We further highlighted specific counties with low referrals relative to their burden of liver disease, and the vast majority were more remote from the transplant center and did not have local specialty care for liver disease. As a result, community outreach and engagement in these areas must be targeted at primary care providers and patient education about the early signs of liver disease. In contrast, outreach in counties with local gastroenterologists may be most effective through professional networks and inter-health system communications to understand referral practices and barriers.
In addition, we found that neighborhoods of greater socioeconomic deprivation, poverty, and lower educational attainment were underrepresented among our referral population, indicating that individuals within these areas likely experience barriers in referral, which must be considered when designing interventions to improve access. We also observed that Black individuals were underrepresented in our referral population relative to the population who experienced liver disease-related death, consistent with prior data on racial disparities in access to the LT waitlist.3,4,11 We suspect that this likely reflects underlying differential community resources, infrastructure, and access to care, and highlights the critical need to target the SDOH at the root of these disparities in order to improve equity in access to transplant. These findings exemplify how geospatial analysis can highlight referral gaps and be used to direct multilevel outreach efforts between health systems, communities, local providers, and patients. We are utilizing this work to inform ongoing efforts to ensure equitable access to LT at our center.
In addition to disparities in access to LT referral, individuals may experience challenges after referral in presenting for evaluation, undergoing the evaluation process, and selection for LT, which are important to understand and contextualize. We therefore characterized the referral population and their communities across several dimensions of SDOH, including indices of deprivation, which summarize multiple indicators of disadvantage, and then by more specific domains to further understand contributing factors. When available, these were evaluated at the census block group or census tract level, which approximate the neighborhood level and better represent an individual’s sociocontextual environment than broader geographic classifications such as zip code or county. We found that while the most disadvantaged areas were overall underrepresented among our referral population, indicating potential lack of access to referral, individuals from these areas still comprised 15-20% of referrals. After overcoming the referral hurdle, these individuals may experience further barriers in the evaluation process across several domains, including health literacy, financial cost, and access to transportation, factors which, if identified prior to evaluation, may be amenable to intervention.
For example, individuals from high poverty areas and their caregivers are likely to be disproportionately impacted by the burden of multiple appointments needed for the evaluation process, as this will often require missing work and incurring travel-related costs. Consolidating appointments for these patients to a single day or providing reimbursement for gas, parking, or meals may be relatively simple interventions that mitigate or alleviate this barrier to evaluation. In addition, ensuring transplant-related educational material is appropriate for a high school level and below will be important given the proportion from areas with low educational attainment. The individuals living in neighborhoods with low access to food and in significant food swamps may face challenges in maintaining a sufficient nutritional status for transplant and may benefit from connection with community resources to assist with this. Navigation programs, which have been successfully utilized in kidney transplant, may also be useful in helping patients who experience multiple barriers as they progress through the complex transplant process.24
Telehealth, which has become a more routine modality of care delivery since the onset of the coronavirus-19 pandemic, is another intervention that could diminish some barriers to both referral and evaluation. When assessing the geospatial distribution of our referral population, many of the counties with greater liver-related mortality and few referrals were more outlying areas further from the transplant center. Distance from a transplant center has previously been identified as a factor associated with lower likelihood of LT referral and increased liver disease mortality.12,25 Remoteness from an LT center may present several barriers to referral and evaluation, including the need for transportation and the anticipated time and cost to travel for evaluation, not only for the patient but also their caregivers. Telehealth has been proposed as a potential solution, and it has been associated with a decreased time from LT referral to evaluation and waitlisting in the Veterans Affairs system.26,27 However, telehealth may itself present challenges to disadvantaged populations with regards to the necessary access to technology, including patients with liver disease.28,29 We specifically evaluated access to technology in our referral population and found that while the majority lived in areas in which the infrastructure for broadband access was present, over 20% lived in neighborhoods in which nearly one-third of households lacked broadband and in which many did not have a computer or other device. Therefore, while telehealth may be a promising strategy to improve access to LT, interventions utilizing it will need to ensure that the populations of need can participate and that this does not further existing disparities.29
Our study thus highlights the utility of examining the distribution of referrals and characteristics of their communities in order to gain novel insights and to ultimately design targeted interventions to promote equity in access to LT. Our approach has several strengths. We utilized readily available health system data and publicly available information on several domains of SDOH, which were defined using standardized definitions from the National Institutes of Health PhenX toolkit when available to facilitate comparisons across studies. In addition, while prior work on SDOH and LT has largely been limited to the zip code- or county-level, we used the census block group or tract when available, which better approximates one’s local environment.8,10,30–32 Deprivation indices may serve as convenient summary measures and provide an overall assessment of disadvantage, while the subdomains and other individual measures are likely more useful in designing targeted interventions. These data can be linked to an individual with only an address, making this approach easily adoptable by any transplant center. In addition, these data are available at the time of referral, allowing for some interventions to be implemented prior to presenting for evaluation, where they may be needed and most impactful.
Limitations to our study include the lack of many individual SDOH to complement these community-level measures, though at present, there is no infrastructure for recording this data, and much of it remains uncollected, unstructured, or inaccessible within the electronic medical record.33 As such, although our approach allowed for assessment of multiple domains of structural SDOH at a narrow geographic level, we were limited in our ability to evaluate these variables in the context of some patient-level factors such as individual income and educational attainment, which will be important. We were also somewhat limited in the ability to quantify disparities in referral, as though our center performs over 50% of LTs in our state, there are two other transplant centers which may have captured some patients from areas that seemed underrepresented. However, we aim to serve all communities within our state, and these areas with high liver-related mortality, low referrals for LT, and lack of access to care clearly need engagement to improve outcomes. In addition, in comparing the proportions of referrals by socioeconomic deprivation, an equal distribution of patients eligible for referral among the population was assumed given lack of data on liver disease epidemiology at these more narrow geographic levels. This assumption is likely not completely accurate, though we would expect that the burden of liver disease is likely even higher in these more disadvantaged areas, and thus our estimates are more likely to overestimate than underestimate the access to referral in these areas. Finally, we present here characterization of a referral population, though these SDOH will impact each step of the transplant cascade, perhaps differentially, and future studies will be needed to assess their role along the entire care continuum. We hope to have data on this in our cohort in the future.
In conclusion, in this study we demonstrated an approach to characterization of a transplant center’s referral population by geographic location, communities of residence, and structural SDOH to inform targeted interventions for disparities in LT access. We utilized publicly available data at narrow geographic levels to obtain a comprehensive evaluation of our referral population, which required only an address and can thus be readily applied by other centers seeking to understand and intervene upon social barriers to LT in the populations they serve. Future work should be performed to assess the impact of these factors across the LT cascade.
Supplementary Material
Acknowledgements:
The content is solely the responsibility of the authors and does not necessarily represent the official views of the National Institutes of Health. The authors would like to thank Wendy Webster and Hamed Zaribafzadeh with the Department of Surgery Laboratory for Transformative Administration for their assistance with this project.
Financial Support:
JBH is supported by NIH grant T32DK007568. LMM is supported by the National Institute on Minority Health and Health Disparities under Award Number U54MD012530.
Abbreviations:
- ACS
American Community Survey
- ADI
Area Deprivation Index
- CDC
Centers for Disease Control and Prevention
- CI
confidence interval
- D
decile
- FCC
Federal Communications Commission
- GI
gastroenterology
- HS
high school
- IQR
interquartile range
- LT
liver transplantation
- Mbps
Megabits per second
- Q
quartile
- RFEI
Retail Food Environment Index
- SD
standard deviation
- SDOH
social determinants of health
- SVI
Social Vulnerability Index
- USDA
US Department of Agriculture
Footnotes
Conflicts of interest: nothing to report.
References
- 1.Park C, Jones MM, Kaplan S, et al. A scoping review of inequities in access to organ transplant in the United States. Int J Equity Health. 2022;21(1):22. [DOI] [PMC free article] [PubMed] [Google Scholar]
- 2.Nephew LD, Serper M. Racial, Gender, and Socioeconomic Disparities in Liver Transplantation. Liver Transpl. 2021;27(6):900–912. [DOI] [PubMed] [Google Scholar]
- 3.Mathur AK, Ashby VB, Fuller DS, et al. Variation in access to the liver transplant waiting list in the United States. Transplantation. 2014;98(1):94–99. [DOI] [PMC free article] [PubMed] [Google Scholar]
- 4.Rosenblatt R, Wahid N, Halazun KJ, et al. Black Patients Have Unequal Access to Listing for Liver Transplantation in the United States. Hepatology. 2021;74(3):1523–1532. [DOI] [PubMed] [Google Scholar]
- 5.Moylan CA, Brady CW, Johnson JL, Smith AD, Tuttle-Newhall JE, Muir AJ. Disparities in liver transplantation before and after introduction of the MELD score. JAMA. 2008;300(20):2371–2378. [DOI] [PMC free article] [PubMed] [Google Scholar]
- 6.Bryce CL, Angus DC, Arnold RM, et al. Sociodemographic differences in early access to liver transplantation services. Am J Transplant. 2009;9(9):2092–2101. [DOI] [PMC free article] [PubMed] [Google Scholar]
- 7.Axelrod DA, Guidinger MK, Finlayson S, et al. Rates of solid-organ wait-listing, transplantation, and survival among residents of rural and urban areas. JAMA. 2008;299(2):202–207. [DOI] [PubMed] [Google Scholar]
- 8.Ross K, Patzer RE, Goldberg DS, Lynch RJ. Sociodemographic Determinants of Waitlist and Posttransplant Survival Among End-Stage Liver Disease Patients. Am J Transplant. 2017;17(11):2879–2889. [DOI] [PubMed] [Google Scholar]
- 9.Jesse MT, Abouljoud M, Goldstein ED, et al. Racial disparities in patient selection for liver transplantation: An ongoing challenge. Clin Transplant. 2019;33(11):e13714. [DOI] [PubMed] [Google Scholar]
- 10.Mohamed KA, Ghabril M, Desai A, et al. Neighborhood Poverty is Associated with Failure to be Waitlisted and Death During Liver Transplant Evaluation. Liver Transpl. 2022;28(9):1441–1453. [DOI] [PMC free article] [PubMed] [Google Scholar]
- 11.Kanwal F, Hernaez R, Liu Y, et al. Factors Associated With Access to and Receipt of Liver Transplantation in Veterans With End-stage Liver Disease. JAMA Intern Med. 2021;181(7):949–959. [DOI] [PMC free article] [PubMed] [Google Scholar]
- 12.Goldberg DS, French B, Forde KA, et al. Association of distance from a transplant center with access to waitlist placement, receipt of liver transplantation, and survival among US veterans. JAMA. 2014;311(12):1234–1243. [DOI] [PMC free article] [PubMed] [Google Scholar]
- 13.Rosenblatt R, Lee H, Liapakis A, et al. Equitable Access to Liver Transplant: Bridging the Gaps in the Social Determinants of Health. Hepatology. 2021;74(5):2808–2812. [DOI] [PubMed] [Google Scholar]
- 14.PhenX Toolkit: Collections. Accessed February 17, 2022. https://www.phenxtoolkit.org/collections/view/6
- 15.Area Health Resources Files. Accessed November 16, 2021. https://data.hrsa.gov/topics/health-workforce/ahrf
- 16.Urban Influence Codes. USDA ERS. Accessed November 16, 2021. https://www.ers.usda.gov/data-products/urban-influence-codes.aspx [Google Scholar]
- 17.Underlying Cause of Death, 1999-2020. Centers for Disease Control and Prevention. Accessed November 16, 2021. https://wonder.cdc.gov/ucd-icd10.html [Google Scholar]
- 18.Goldberg D, Ross-Driscoll K, Lynch R. County Differences in Liver Mortality in the United States: Impact of Sociodemographics, Disease Risk Factors, and Access to Care. Gastroenterology. 2021;160(4):1140–1150. [DOI] [PMC free article] [PubMed] [Google Scholar]
- 19.Centers for Disease Control and Prevention/ Agency for Toxic Substances and Disease Registry/ Geospatial Research, Analysis, and Services Program. CDC/ATSDR Social Vulnerability Index. https://www.atsdr.cdc.gov/placeandhealth/svi/data_documentation_download.html
- 20.2019 American Community Survey 5-Year Estimates. U.S. Census Bureau. Accessed November 16, 2021. https://data.census.gov/cedsci/ [Google Scholar]
- 21.Rhone A Food Access Research Atlas. Accessed October 9, 2022. https://www.ers.usda.gov/data-products/food-access-research-atlas/
- 22.Economic Research Service (ERS), U.S. Department of Agriculture (USDA). Food Environment Atlas. https://www.ers.usda.gov/data-products/food-environment-atlas/
- 23.Fourteenth Broadband Deployment Report. Federal Communications Commission; 2021. [Google Scholar]
- 24.Sullivan C, Leon JB, Sayre SS, et al. Impact of navigators on completion of steps in the kidney transplant process: a randomized, controlled trial. Clin J Am Soc Nephrol. 2012;7(10):1639–1645. [DOI] [PMC free article] [PubMed] [Google Scholar]
- 25.Goldberg DS, Newcomb C, Gilroy R, et al. Increased Distance to a Liver Transplant Center Is Associated With Higher Mortality for Patients With Chronic Liver Failure. Clin Gastroenterol Hepatol. 2017;15(6):958–960. [DOI] [PMC free article] [PubMed] [Google Scholar]
- 26.John BV, Love E, Dahman B, et al. Use of Telehealth Expedites Evaluation and Listing of Patients Referred for Liver Transplantation. Clin Gastroenterol Hepatol. 2020;18(8):1822–1830. [DOI] [PMC free article] [PubMed] [Google Scholar]
- 27.Serper M, Cubell AW, Deleener ME, et al. Telemedicine in Liver Disease and Beyond: Can the COVID-19 Crisis Lead to Action? Hepatology. 2020;72(2):723–728. [DOI] [PMC free article] [PubMed] [Google Scholar]
- 28.Wegermann K, Wilder JM, Parish A, et al. Racial and Socioeconomic Disparities in Utilization of Telehealth in Patients with Liver Disease During COVID-19. Dig Dis Sci. 2022;67(1):93–99. [DOI] [PMC free article] [PubMed] [Google Scholar]
- 29.Henson JB, Wegermann K, Patel YA, Wilder JM, Muir AJ. Access to technology to support telehealth in areas without specialty care for liver disease. Hepatology. 2023;77(1):176–185. [DOI] [PubMed] [Google Scholar]
- 30.Quillin RC 3rd, Wilson GC, Wima K, et al. Neighborhood level effects of socioeconomic status on liver transplant selection and recipient survival. Clin Gastroenterol Hepatol. 2014;12(11):1934–1941. [DOI] [PubMed] [Google Scholar]
- 31.Akateh C, Miller R, Beal EW, et al. County Rankings Have Limited Utility When Predicting Liver Transplant Outcomes. Dig Dis Sci. 2020;65(1):104–110. [DOI] [PMC free article] [PubMed] [Google Scholar]
- 32.Niazi SK, Vargas E, Spaulding A, et al. Impact of County Health Rankings on Nationwide Liver Transplant Outcomes. Transplantation. 2021;105(11):2411–2419. [DOI] [PubMed] [Google Scholar]
- 33.Chan NW, Moya-Mendez M, Henson JB, et al. Social determinants of health data in solid organ transplantation: National data sources and future directions. Am J Transplant. 2022;22(1):2293–2301. [DOI] [PMC free article] [PubMed] [Google Scholar]
Associated Data
This section collects any data citations, data availability statements, or supplementary materials included in this article.