

Abstract
Approximately 18% of U.S. children under 5 years old live in poverty, which is one of the strongest predictors of child neglect. However, most families in poverty do not engage in neglect and this may be due to heterogeneity in risk factors. This study examined how risk factors co-occurred among families in poverty across early childhood and whether risk profiles were differentially related to physical and supervisory neglect across time. Results suggested there were four risk profiles across early childhood (i.e., years 1 and 3). At year 1, the four profiles in order of prevalence were: Low Risk, High Risk, Depressed and Uninsured, and Stressed with Health Problems. At year 3, the profiles were: Low Risk, High Risk, Depressed with Residential Instability, and Stressed with Health Problems. Overall, the High Risk profile was associated with more physical and supervisory neglect across time compared to the Low Risk profile; however, the Stress with Health Problems profile was also associated with greater physical neglect. These findings illustrate heterogeneity in the risk factors among families in poverty and demonstrate the differential impact of risk exposure on later neglect. Results also provide evidence to practitioners and policymakers about target risk experiences to prevent neglect.
Keywords: poverty, neglect, risk factors
Introduction
In 2021, 4 million children or about 18% of all American children under 5 years old lived in poverty (Kids Count, 2022). This is particularly concerning because children living in poverty are more likely to have worse behavioral, cognitive, mental health, and physical health outcomes compared to their more affluent peers and early childhood is a particularly important period for later skill development (Berger et al., 2009; Cunha et al., 2006; Yoshikawa et al., 2012). Children living in poverty are also more likely to experience harsh parenting (Berger, 2007; Conger et al., 2010). According to the Family Stress Model, as economic hardship increases, parents are more likely to engage in harsh, inconsistent, and uninvolved parenting behaviors (Conger et al., 2010). Therefore, in order to promote child well-being among families in poverty, it is essential to further explore the mechanisms by which poverty influences maladaptive parenting behaviors. Specifically, this study focuses on identifying subgroups of risk factors among families in poverty that are associated with neglect across early childhood.
Poverty is more strongly associated with neglect than with other forms of maltreatment and poverty is one of the strongest predictors of neglect (Proctor & Dubowitz, 2014; Maguire-Jack & Sattler, 2022). Children in low socioeconomic households are nearly seven times more likely to be neglected than children who live in more affluent households (Sedlak et al., 2010). This could be in part be due to poverty constraining parents’ time and resources (Elias et al., 2018; Saar-Heiman, 2022). It is also possible that parents in poverty might come into contact with bureaucratic institutions, such as public assistance or social services, and may experience monitoring of parenting behaviors by mandated reporters. However, there is debate on whether this increased risk of maltreatment referrals for low-income families is due to surveillance bias (Chaffin & Bard, 2006; Drake et al., 2017) or due to increased overall risk exposure (Drake et al., 2009; Kim et al., 2018). Although caseworkers are instructed to exclude poverty as a sole reason for neglect, many factors associated with poverty also increase the risk of neglect, such as unemployment, single parent status, or residential instability (Dubowitz et al., 2011; Slack et al., 2011; Xu et al., 2021; Zhang et al., 2022). For example, although many families in poverty experience material hardship; it is only when these hardships reach the level of deprivation that they would be considered neglect (Thomas & Waldfogel, 2022). Yet, it is also important to keep in mind that most children who live in poverty are not neglected. Indeed, although over 18% of children under 5 lived in poverty in 2021, it is estimated that 4% of children between 2–5 years old have experienced neglect in the past year (Vanderminden et al., 2019). Thus, identifying which co-occurring risk factors impact families’ capacities to meet children’s needs in the context of poverty may be an important step in preventing neglect. The current study used a person-centered approach to illustrate how risk factors differentially co-occur among families in poverty and whether two different types of neglect vary based on these risk profiles.
Neglectful Parenting
Neglect is difficult to detect because it is based on the omission of behaviors and incorporates both potential harm and actual harm (Kobulsky & Dubowitz, 2022b; Proctor & Dubowitz, 2014; Turner et al., 2019). Further, neglect is also difficult to measure because it can include different subtypes and there is currently disagreement about which subtypes to include (Haworth et al., 2022; Kobulsky & Dubowitz, 2022b; Proctor & Dubowitz, 2014). Federal law set forth by the Child Abuse Prevention and Treatment Act (CAPTA) provides a broad and vague definition of maltreatment, but also requires states to provide their own definitions of abuse and neglect (Barnett et al., 1993; Kobulsky & Dubowitz, 2022b). A recent analysis demonstrated that states vary widely in their definitions of neglect, from minimal defining aspects to expanded inclusion criteria (Rebbe, 2018). For example, less than half of U.S. states differentiate between involuntary neglect, in which the child’s needs are not met due to parent’s physical or financial limitations, and maltreatment (Rebbe, 2018). Despite these variations in defining neglect, only a small proportion of referrals and investigations are due to material need and a larger share are due to lack of supervision (Jonson-Reid et al., 2013; Palmer et al., 2022).
Similar variations in specifications of neglect subtypes can be found in empirical research and there is no set standard for which subtypes to include (Kobulsky & Dubowitz, 2022b). One approach, the Maltreatment Classification Scheme, used child protective services (CPS) records to identify maltreatment type, frequency, and chronicity (Barnett et al., 1993). The Longitudinal Studies of Child Abuse and Neglect modified this scheme to discriminate between subtypes of neglect, such as “failure to provide” and “lack of supervision” (English et al., 2005). Failure to provide, or what is often referred to as physical neglect (Dubowitz et al., 2005; Font & Berger, 2015), includes the caregiver failing to provide adequate food, hygiene, clothing, shelter, or medical care (English et al., 2005). Lack of supervision, known as supervisory neglect (Font & Berger, 2015), includes failing to ensure the child is supervised, failing to ensure the child is in a safe situation, and failing to ensure adequate care when the caregiver is unavailable (Dubowitz et al., 2005). Supervisory neglect includes exposing children to domestic violence, substance abuse, and criminality. Another study systematically reviewed definitions and subtypes of neglect across CPS systems, empirical studies, and state statues, and identified three major subtypes: physical, supervisory, and emotional neglect (Coohey, 2003). The current study focuses on two of these major subtypes of neglect (Coohey, 2003; Turner et al., 2019; Vanderminden et al., 2019): physical neglect and supervisory neglect. Given self-report is likely to underrepresent families involved in CPS, the behavioral approximations of physical and supervisory neglect provide further information on how risk factors may relate to parenting behaviors.
Risk Factors for Neglect
According to Belsky’s (1993) etiology of child maltreatment, there are multiple pathways that lead to child maltreatment. Specifically, the risk of child maltreatment is influenced by factors from parents, children, the environment, and the larger context (Belsky, 1993). Therefore, risk factors situated within different contexts (e.g., parent, family, society) likely influence parenting behaviors. Several studies have demonstrated that specific risk factors increase the likelihood of neglect, including caregivers’ depressive symptoms and parenting stress (Stith et al., 2009; Slack et al., 2011; Kobulsky & Dubowitz, 2022). Drawing on the etiology of child maltreatment and the family stress model, the current study focused on six risk factors at the parent (i.e., low education, health issues, depressive symptoms, parenting stress) and societal levels (residential instability and lack of health insurance) in the family context of poverty.
At the parent-level, low levels of education and health issues are two factors that increase the likelihood of neglect according to the etiology of child maltreatment (Kobulsky & Dubowitz, 2022). Importantly, education is strongly associated with positive parenting behaviors and low levels of parental education has been linked to a higher likelihood of physical and supervisory neglect (Marco et al., 2022; Mulder et al., 2018; Turner et al., 2019). Caregivers with health issues might be unable to meet a child’s needs due to physical limitations or due to the additional demands of caring for their own health (Mayer et al., 2007). Indeed, previous research has demonstrated that experiencing a physical health problem is associated with child neglect (Mayer et al., 2007; Mulder et al., 2018; Slack et al., 2011). The Family Stress Model (FSM) can provide further information on parent-level risk factors for neglect. FSM posits that economic hardship is associated with increased economic pressure which increases a parent’s psychological distress and this impacts parenting behaviors (Conger et al., 2010). As such, parent depressive symptoms and parenting stress are important risk factors linking poverty to maladaptive parenting practices. Depressive symptoms can prevent parents from being emotionally available to their children and have been shown to be predictive of maltreatment (Dubowitz et al., 2011; Stith et al., 2009) and neglect (Clément et al., 2016; Slack et al., 2011). Poverty can increase parenting stress, which then could cause parents to feel overwhelmed or fatigued (Elias et al., 2018), thereby undermining parenting behaviors. Parenting stress has been linked to both maltreatment generally (Stith et al., 2009) and neglect specifically (Clément et al., 2016).
Turning to societal-level risk factors, both residential instability (Kobulsky & Dubowitz, 2022; Marco et al., 2022) and lack of access to health insurance might increase child neglect. Needing to move multiple times, or experiencing residential instability, could inhibit parents’ ability to provide safe and stable shelter. Residential instability could also be a marker of overall family chaos and lead to instability in other aspects of the child’s environment (Doan & Evans, 2020). Residential instability has been linked with neglect directly (Slack et al., 2011) and indirectly through parental stress (Warren & Font, 2015). The United States lacks universal health insurance, which leaves some families without access to health insurance (Garfield et al., 2020). Lack of access to health insurance might decrease the likelihood of seeking necessary medical care, due to the potential cost, fear of bias from medical providers, difficulty in finding a provider, and many other reasons. Previous research has linked public health insurance to a lower likelihood of fatal child maltreatment (Miyamoto et al., 2017), but the findings are mixed for neglect specifically (McGinty et al., 2022; Slack et al., 2011). Although each of these studies has established the importance of these risk factors for predicting neglect, few focus specifically on child neglect (cf. Clément et al., 2016) and even fewer focus on neglect among families in poverty (cf. Slack et al., 2004; 2011). The current study builds upon the existing research by incorporating a person-centered approach and longitudinal framework.
A Person-Centered Approach to Risk Factors for Neglect
Neglect, as with other adverse experiences, is unlikely to be the product of a single risk factor, but rather the product of multiple, interacting exposures (Kobulsky & Dubowitz, 2022). However, certain risks may frequently co-occur and these combinations of risk factors, which in this study are referred to as “risk profiles,” may be more predictive of neglectful parenting. Examining the combinations of risk factors is considered a person-centered approach, which groups families according to whether they share risk factors. Two commonly used person-centered methods are Latent Class Analysis (LCA), which uses dichotomous indicators, and Latent Profile Analysis (LPA), which uses both dichotomous and continuous risk indicators (Collins & Lanza, 2010). One of the advantages of a person-centered approach for the current study is that it illustrates how risk factors naturally co-occur among families in poverty to increase the likelihood of neglect. Previous research has demonstrated that poverty-related risk factors, such as life stressors, residential crowding, caregiver depression, and single-parent household, differentially co-occur to create risk profiles. These risk profiles then differentially predict children’s academic functioning, behavioral problems, and self-regulation skills, both immediately (Roy & Raver, 2014)and longitudinally (Jobe-Shields et al., 2015). Although these studies illustrated which poverty-related risks co-occur to create risk profiles and how these profiles relate to child functioning, there is still a limited understanding of how risk factors tend to co-occur among families in poverty to predict neglectful parenting.
The Timing of Risk Factors in Predicting Neglect
There is also a lack of research about how risk profiles at different time points across early childhood might predict neglectful parenting. According to life course theory (Elder, 1998), the association between an event and its impact varies based on the timing in the life course. For example, the risk factors at age 1 that are significantly associated with neglect at age 3 might be different from the risk factors at age 3 that are significantly associated with neglect at age 5. Previous research has illustrated that the timing of risks among low-income families is important for predicting school readiness: risks in the first year are particularly impactful on children’s school readiness through parenting behaviors, whereas risks during toddlerhood tend to have minimal effects on school readiness (Mistry et al., 2010).
Families might also move between different configurations of risk across time. Although some families may maintain either high or low risk across time, there are some families that will likely move into higher or lower risk situations across time. Moving into a higher risk profile is likely to negatively influence parenting behaviors, whereas moving to a lower risk profile might decrease the likelihood of neglectful parenting. Thus, the current study examined the concept of timing in several ways. First, this study focuses on how risk profiles change across early childhood and how risk profiles are associated with neglectful parenting. Second, this study investigates how families transition between risk profiles across early childhood.
The Current Study
Poverty is an important predictor of neglectful parenting, yet most families in poverty do not engage in child neglect. Therefore, it is important to understand how risk factors tend to co-occur among families in poverty and how families’ risk profiles change across time in order to identify risk exposures that are most likely to undermine parenting in order to provide extra supports and preventive interventions. Additionally, prior research has rarely focused on predictors of neglect, as opposed to maltreatment generally, and even fewer studies have explored different types of neglect. This study aims to move the field forward by investigating three research questions: 1) How do risks for neglect co-occur among families in poverty at two different time points during early childhood?; 2) How do families in poverty transition between risk profiles across early childhood; and 3) How are risk profiles across early childhood among families in poverty related to neglectful parenting behaviors?
Method
Data and Sample
The Future of Families and Child Wellbeing Study (FFCWS) is a longitudinal, national survey of children born between 1998 and 2000 in twenty U.S. cities with over 200,000 residents. The study oversampled for non-marital births, which resulted in a large proportion of participants being economically disadvantaged. Of the sample, the majority were Black (69%), followed by Hispanic (19%), White (8%), and an other race (4%) (Reichman, Teitler, Garfinkel, & McLanahan, 2001). Mothers ranged in age at child’s birth from younger than 18 to over 40 and 59% had at least graduated from high school. The majority of mothers were U.S. born (87%) and most already had another child (64%) (Reichman et al., 2001). Almost 5,000 families were interviewed at birth and when children turned 1, 3, 5, 9, and 15. Data were collected from surveys completed by mothers, fathers, primary caregivers, child care providers, teachers, and children. Direct observational assessments of the family members were also conducted. Poverty is typically measured as below 100% of the federal poverty threshold whereas near poor is between 100% and 200% of the federal poverty threshold (Jiang et al., 2016). Given all children under 200% of the poverty threshold are at risk for worse school readiness compared to families above 200% of the poverty threshold (Isaacs, 2012), the current sample included families that lived within 200% of the poverty threshold at baseline (n = 3,033). The current sample was limited to families that participated in the 5-year in-home assessments as that is when the outcome of interest is assessed (n = 1,883). To ensure CPS contact did not precede the observed risk factors the current sample was further limited to families that did not report contact between birth and year 1 (n = 1,846). This study focused on biological mothers as they were the primary caregiver interviewed and are the source of the behavioral approximations of neglect.
Descriptive statistics of the analytic sample can be found in Table 1. There were some differences between participants who were and were not included in the sample. Families in the sample tended to have target children who were slightly older than the rest of the sample at year 1, younger mothers, and more children and adults in the household. Families in the sample were also less likely to have married mothers and more likely to have cohabiting or single mothers. Mothers in the sample were also less likely to be White or of an other racial group, and more likely to be Black. Among families included in the sample, children were 15 months on average at the year 1 assessment, about half were male (52%), and few were low birth weight (11%). Mothers were about 24 years old; most were single (51%), and mothers were racially diverse (11% White, 59% Black, and 30% an other racial group).
Table 1.
Descriptive statistics of FFCW participants excluded and included in the analyses.
| Not in Sample (n = 3,051) | In Sample (n = 1,846) | Significance of Difference | |||||
|---|---|---|---|---|---|---|---|
| Mean | SD | Mean | SD | Min | Max | ||
|
| |||||||
| Child age (months at year 1) | 14.87 | 3.41 | 15.24 | 3.55 | 9 | 30 | *** |
| Child male | 0.53 | 0.52 | 0 | 1 | |||
| Child low birth weight | 0.10 | 0.11 | 0 | 1 | |||
| Child disability status | 0.02 | 0.03 | |||||
| Mother’s age (years at birth) | 26.07 | 6.19 | 23.97 | 5.54 | 15 | 43 | *** |
| Married | 0.32 | 0.11 | 0 | 1 | *** | ||
| Cohabiting | 0.35 | 0.38 | 0 | 1 | * | ||
| Single | 0.32 | 0.51 | 0 | 1 | *** | ||
| Number of additional children in household | 1.07 | 1.20 | 1.57 | 1.42 | 0 | 8 | *** |
| Number of adults in household | 2.35 | 0.99 | 2.27 | 1.07 | 1 | 9 | * |
| White | 0.27 | 0.11 | 0 | 1 | *** | ||
| Black | 0.41 | 0.59 | 0 | 1 | *** | ||
| Other | 0.32 | 0.30 | 0 | 1 | * | ||
Note.
p < .001
p < .01
p < .05.
Measures
Depressive symptoms.
Depressive symptoms were measured with the Composite International Diagnostic Interview-Short Form (Kessler et al., 1998) at years 1 and 3. If mothers endorsed having two weeks of either dysphoric mood (dissatisfaction with life) or anhedonia (inability to feel pleasure) for at least half a day and almost every day, they were asked seven more questions. If mothers reported no dysphoric mood or anhedonia, they received a score of zero. Items indicated high internal consistency (α = .92-.93 at years 1 and 3, respectively). The eight items were summed and higher scores indicated more depressive symptoms.
Parenting stress.
At years 1 and 3, mothers rated their parenting stress using the Parent Stress Inventory (e.g., “Being a parent is harder than I thought it would be”) using a 4-point scale, from (1) strongly agree to (4) strongly disagree (Abidin, 1995). Four items were the same across waves (“Being a parent is harder than I thought it would be,” “I feel trapped by my responsibilities as a parent,” “I find that taking care of my child (ren) is much more work than pleasure,” and “I often feel tired, worn out, or exhausted from raising a family”). Internal consistency was acceptable (α = .61-.63 at years 1 and 3, respectively). These four items were averaged at each wave, with higher scores indicating more parenting stress.
Residential instability.
Mothers reported how many times they had moved since the child’s birth (year 1 survey) or first birthday (year 3 survey). The responses were rescaled from 0 “No moves” to 10 “10 moves.” More moves indicated more residential instability.
Health problems.
At years 1 and 3, mothers were asked “Do you have a serious health problem that limits the amount or kind of work you can do?” Responses were coded as No (0) and Yes (1).
Low education.
At baseline mothers reported on their highest completed education and mothers reported on whether they had completed additional schooling at years 1 and 3. Low education was coded as (1) high school diploma/ GED or lower and (0) more than a high school diploma at years 1 and 3.
Lack of health insurance.
At years 1 and 3, mothers were asked two questions on whether they or their children were covered by 1) a public health insurance plan and 2) a private health insurance plan. Responses were recoded for each question No (0) and Yes (1). Based on the answers to these two questions, a new variable was created that indicated either No health insurance (1) or Any health insurance (0) at years 1 and 3.
Neglectful behaviors.
Using a strategy similar to that employed by Font and Berger (2015), neglectful behaviors were separated into physical neglect and supervisory neglect based on mothers’ responses to questionnaires regarding her behaviors, interviewers’ observations using the Home Observation for Measurement of the Environment Inventory (HOME; Caldwell & Bradley, 2001), and mothers’ responses to four items regarding physical or supervisory neglect on the Parent-Child Conflict Tactics Scale (CTS; Straus et al., 1998) at year 3 and 5 (see Sattler, 2019). Physical neglect included measures of whether the child received necessary food (CTS), whether the utilities were shut off (mother interview), whether the family was evicted (mother interview), whether the child could not get necessary medical care (CTS), and interviewer observations of housing interior or safety issues and the child’s hygiene (HOME interviewer observation). Supervisory neglect included if in the past year the parent was too intoxicated to care for the child (CTS), if the caregiver left the child alone when they should not have (CTS), if the parents had a physical dispute in front of the child (mother interview), if the parent used any hard drugs or non-prescribed drugs currently or in the past year (mother interview), or if the parent earns any income from illegal activities (mother interview). For both physical neglect and supervisory neglect, each indicator was dichotomized and averaged to create these two scales with higher levels indicating higher neglect. Based on Streiner (2003), it is not appropriate to report internal consistency for physical and supervisory neglect because they are indexes of causal indicators and are not scales of effect indicators. It is also important to note that no single indicator would necessarily reflect neglect, but rather higher scores on these indexes would be indicative of a home environment the could pose risks to children.
Covariates.
All covariates were drawn from baseline or, if unavailable, from the year 1 interview. Child-level covariates include child’s age (in months from year 1), sex (0 = female, 1 = male), low birthweight (0 = no, 1 = yes), and child disability status (0 = no, 1 = yes). Family-level covariates included mother’s age (years), mother’s race (White, Black, other), marital status (married to father, cohabiting with father, not with father), number of additional children, and the number of adults.
Analytic Approach
All analyses were conducted in Mplus 7.4 (Muthén, & Muthén, 2015) within a structural equation modeling (SEM) framework. Full information maximum likelihood estimation (FIML) accounted for missing data. Latent Profile Analysis (LPA) was used to model how risks for neglect occur among families in poverty. LPA uses indicators to cluster risk factors into different profiles that make up a categorical latent variable. Each model was compared to successively more complex models using the Bayesian Information Criterion (BIC), adjusted BIC (ABIC), and the Lo-Mendell-Rubin Adjusted Likelihood Ratio Test (LMRT) to determine the number of classes that best fit of the model to the data (Nylund, Asparouhov, & Muthén, 2007). A better fitting model would result in a decreased BIC and ABIC and an LMRT p-value below 0.05 when comparing K classes versus K-1 classes (i.e., the second model would be a significant improvement from the first model). Additionally, classes need to contain a minimum of 1% as recommended by Jung & Wickrama (2008) or at least 50 cases (Weller et al., 2020). Model fit was also based on examination of a line graph of the BIC and ABIC values to determine where the values leveled off. These steps were conducted separately for risk factors at year 1 and year 3.
Next, Latent Transition Analysis (LTA) was used to examine how families move between risk profiles across early childhood. LTA estimates latent transition probabilities, in which the probability of latent profile membership at the next time point is conditional on the profile membership at the previous time point (Bray, Lanza, & Collins, 2010). LTA uses the same fit statistics as LPA, in which a decreased BIC and ABIC and an LMR-LRT p-value below 0.05 indicate a better fitting successive model.
Finally, a regression auxiliary model estimated how risk profiles across early childhood relate to neglectful parenting using the BCH method (Asparouhov & Muthén, 2021). First, the latent class measurement model is estimated, and the BCH weights are saved. Next, Mplus estimates an auxiliary model in which neglect (physical neglect, supervisory neglect) is regressed on the latent profiles controlling for covariates using BCH weights. Neglect was regressed on covariates in the overall model and then intercepts of physical and supervisory neglect were allowed to be estimated freely across latent profiles. Physical neglect and supervisory neglect were estimated in the same model. Neglect indicators at year 3 (physical neglect, supervisory neglect) were regressed on risk profiles at year 1. In a separate model, neglect at year 5 was regressed on risk profiles at year 3. These regressions provide intercepts of the continuous, respectively, which were then compared using a Wald test.
Results
Latent Profile Enumeration
Profile models were compared based on relative fit indices, interpretability, and parsimony (Table 2). At both years, the five-profile solution demonstrated convergence issues, which represents a commonly used indicator to stop profile enumeration (Nylund-Gibson & Choi, 2018). At years 1 and 3, the BIC and ABIC declined across progressively more complex models (i.e., the 2-profile solution to the 3-profile solution, and the 3-profile solution to the 4-profile solution). Plotted graphs of the BIC and ABIC confirmed that both indicators of model fit decreased progressively across profile solutions. The entropy remained high across the profile enumeration process at both years of assessment. Given the four-profile solution demonstrated better model fit (i.e., lower BIC and ABIC) compared the three-profile solution, demonstrated high entropy, and contained the necessary minimum sample size per profile (i.e., more than 1% or 50 cases; Jung & Wickrama, 2008; Weller et al., 2020) at years 1 and 3, the four-profile solution was selected at both time points (see Figures 1 and 2). Means are plotted for continuous risk factors (depressive symptoms, parenting stress, residential instability) and probabilities of risk are plotted for categorical risk factors (maternal health problems, low education, no health insurance). The means are standardized for ease of interpretation.
Table 2.
Fit statistics for latent profiles of risk factors at year 1 and year 3.
| Log likelihood ratio | Parameters | BIC | ABIC | Entropy | LMRT | Distribution (%) | |
|---|---|---|---|---|---|---|---|
|
| |||||||
| Year 1 Risk | |||||||
| 1 class | −9913.94 | 9 | 19895.57 | 19866.97 | |||
| 2 class | −8596.01 | 16 | 17312.35 | 17261.51 | 0.99 | 0.00 | 84–16 |
| 3 class | −8217.67 | 23 | 16608.31 | 16535.24 | 1.00 | 0.00 | 83–7–10 |
| 4 class | −7953.651 | 30 | 16132.93 | 16037.62 | 1.00 | 0.00 | 80–6–4–10 |
| 5 class | −7540.364 | 37 | 15359.00 | 15241.45 | 1.00 | 0.00 | 11–8–4–5–7 |
| Year 3 Risk | |||||||
| 1 class | −9831.711 | 9 | 19731.11 | 19702.52 | |||
| 2 class | −8497.453 | 16 | 17115.24 | 17064.41 | 0.99 | 0.00 | 79–21 |
| 3 class | −8158.085 | 23 | 16489.15 | 16416.08 | 0.99 | 0.00 | 78–8–13 |
| 4 class | −7900.461 | 30 | 16026.55 | 15931.24 | 1.00 | 0.00 | 75–7–4–13 |
| 5 class | −7562.274 | 37 | 15406.82 | 15289.27 | 1.00 | 0.00 | 11–4–67–10–8 |
Note. For the 5-class solution at year 1 and year 3, there were non-ignorable errors, and the parameter estimates may not be trustworthy. Abbreviations include Bayesian Information Criterion (BIC), Adjusted BIC (ABIC), and Lo-Mendell-Rubin Adjusted Likelihood Ratio Test (LMRT).
Figure 1:

Latent Profiles Based on Year 1 Risk Factors.
Figure 2:
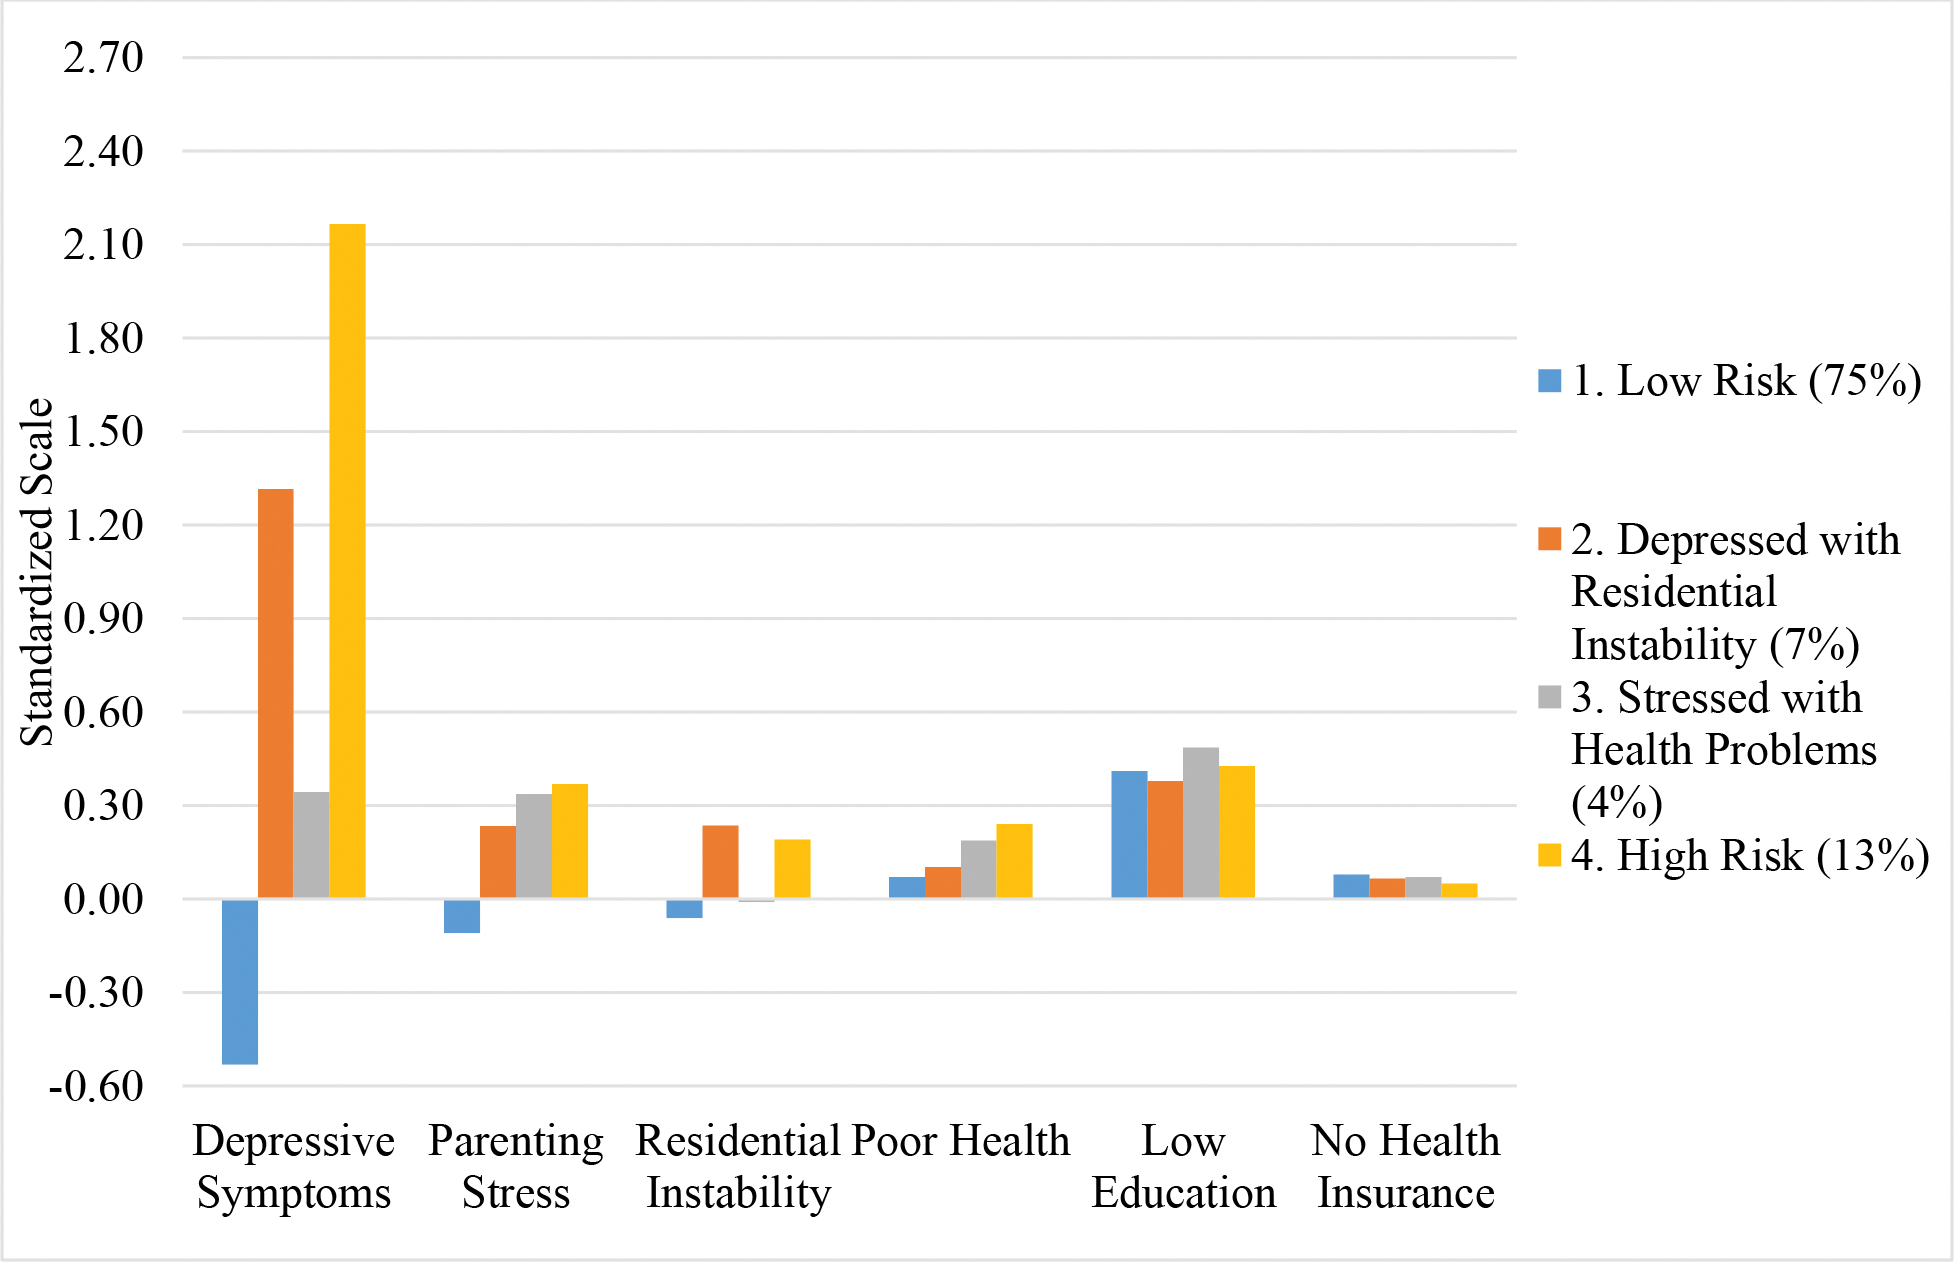
Latent profiles based on year 3 risk factors.
Description of Risk Profiles
At year 1 (Figure 1), one profile was labeled “Low Risk” because it had the lowest level of all risk factors except low education or lack of health insurance and included the majority of the sample (80%). The second profile was labeled “Depressed and Uninsured” because families demonstrated high scores on depressive symptoms and the highest rates of being uninsured. This profile included approximately 6% of the sample. Another profile was labeled “Stressed with Health Problems” because this group had the highest levels of parenting stress and higher levels of maternal health problems. Around 4% of the sample were in the “Stressed with Health Problems” group. The last profile was termed “High Risk” because this group had the highest levels for several risk factors, such as depressive symptoms, residential instability, and health problems, or the second highest levels for parenting stress and low education. The “High Risk” profile included about 10% of the sample.
At year 3, many of these profiles were replicated, including “Low Risk,” “Stressed with Health Problems,” and “High Risk.” Almost 75%, 4%, and 13% of the sample were in each profile, respectively. One profile did change and was labeled “Depressed with Residential Instability” because this group still exhibited high depressive symptoms (1.32 standard deviations), but now also had the highest level of residential instability (.24 of a standard deviation). The Depressed with Residential Instability profile included 7% of the sample.
Latent Transition Analysis of Risk Profiles
Next, LTA models were estimated to examine how families moved between risk profiles across early childhood (see Table 3). Among mothers in the Low Risk profile at year 1, the majority remained in the Low Risk profile (82.5%), but 5.8% transitioned to the Depressed with Residential Instability, 3.1% transitioned to the Stressed with Health Problems, and 8.6% moved to the High Risk group. For mothers in the Depressed and Uninsured profile at year 1, the majority transitioned to the Low Risk profile at year 3 (52.5%), followed by High Risk (23.9%), Depressed with Residential Instability (16.3%), and Stressed with Health Problems (7.3%). Mothers in the Stressed with Health Problems profile at year 1 most often moved to the Low Risk profile at year 3 (55%), followed by Depressed with Residential Instability (18.1%), and then evenly between Stressed with Health Problems and High Risk (13.5% and 13.3% respectively). Among mothers in the High Risk profile at year 1, most remained in High Risk at year 3 (46.3%), followed by Low Risk (36.6%), Depressed with Residential Instability (11.9%), and Stressed with Health Problems (5.2%). Taken together, mothers in almost all profiles at year 1 were more likely to move to the Low Risk profile at year 3.
Table 3.
Latent transition probabilities based on latent profiles at year 1 and year 3.
| Year 3 Profiles | ||||||
|---|---|---|---|---|---|---|
| 1. Low Risk (75%) | 2. Depressed & Residential Instability (7%) | 3. Stressed & Health Problems (4%) | 4. High Risk (13%) | Total | ||
|
| ||||||
| Year 1 Profiles | 1. Low Risk (80%) | 82.5% | 5.8% | 3.1% | 8.6% | 100% |
| 2. Depressed & Uninsured (6%) | 52.5% | 16.3% | 7.3% | 23.9% | 100% | |
| 3. Stressed & Health Problems (4%) | 55.0% | 18.1% | 13.5% | 13.3% | 100% | |
| 4. High Risk (10%) | 36.6% | 11.9% | 5.2% | 46.3% | 100% | |
Note. Percentages are based on profile membership at year 1.
Auxiliary Regression Model Results
Year 1 Profiles Predicting Year 3 Neglectful Parenting.
Table 4 shows the associations between year 1 latent profiles and year 3 neglectful parenting. The following reported coefficients are the standardized intercept within latent profiles and the p-values are the comparison of intercepts between latent profiles. For physical neglect behaviors, there were several significant findings based on profile membership. Compared to the Low Risk profile (β = .27), both the Stressed with Health Problems (β = .61, p < .05) and High Risk (β = .71, p < .001) profiles had mothers who engaged in significantly more physical neglect. Similarly, compared to the Depressed and Uninsured profile (β = .28), the High Risk (β = .71, p < .001) and Stressed with Health Problems (β = .61, p < .05) profiles included mothers who were more physically neglectful. For supervisory neglect, there was one statistically significant finding and one marginal effect. Compared to the Low Risk profile (β = .11), the High Risk profile (β = .58, p <.001) included mothers who engaged in more supervisory neglect behaviors. Mothers in the Low Risk profile (β = .10) displayed marginally fewer supervisory neglect behaviors than mothers in the Depressed and Uninsured profile (β = .34, p = .072).
Table 4.
Standardized intercepts of physical and supervisory neglect at year 3 across latent profiles from year 1 and Wald test comparisons.
| Physical Neglect at Year 3 | Supervisory Neglect at Year 3 | |||||||||
|---|---|---|---|---|---|---|---|---|---|---|
| Intercept | Wald Test | Intercept | Wald Test | |||||||
| Risk Profiles at Year 1 | β | SE | Compared to Class 1 | Compared to Class 2 | Compared to Class 3 | β | SE | Compared to Class 1 | Compared to Class 2 | Compared to Class 3 |
|
| ||||||||||
| 1. Low Risk (80%) | 0.27 | 0.17 | - | * | 0.11 | 0.16 | - | |||
| 2. Depressed & Uninsured (6%) | 0.28 | 0.19 | - | * | 0.34 | 0.20 | - | |||
| 3. Stressed & Health Problems (4%) | 0.61 | 0.23 | * | * | - | 0.34 | 0.25 | - | ||
| 4. High Risk (10%) | 0.71 | 0.21 | *** | *** | 0.58 | 0.20 | *** | |||
Note.
p < .001
p < .01
p < .05.
All models controlled for child age, child sex, child low birth weight status, child disability status, mother’s age, mother’s race, mother’s marital status, number of additional children in household, and number of adults in household.
Year 3 Profiles Predicting Year 5 Neglectful Parenting.
As seen in Table 5, there were significant differences in physical neglect parenting behaviors at year 5 based on profile membership at year 3. Compared to the High Risk profile (β = .77), mothers in the Stressed with Health Problems (β = .43, p < .05) and Low Risk (β = .39, p < .001) profiles engaged in significantly less physical neglect. Compared to the Low Risk profile (β = .39), mothers in the Depressed with Residential Instability profile engaged in marginally more physical neglect (β = .57, p = .078). For predicting supervisory neglect, mothers in the Low Risk (β = .21, p < .001) and Depressed with Residential Instability (β = .29, p < .05) profiles demonstrated significantly less supervisory neglect than mothers in the High Risk profile (β = .53).
Table 5.
Standardized intercepts of physical and supervisory neglect at year 5 across latent profiles from year 3 and Wald test comparisons.
| Physical Neglect at Year 5 | Supervisory Neglect at Year 5 | |||||||||
|---|---|---|---|---|---|---|---|---|---|---|
| Intercept | Wald Test | Intercept | Wald Test | |||||||
| Risk Profiles at Year 3 | β | SE | Compared to Class 1 | Compared to Class 2 | Compared to Class 3 | β | SE | Compared to Class 1 | Compared to Class 2 | Compared to Class 3 |
|
| ||||||||||
| 1. Low Risk (75%) | 0.39 | 0.16 | - | 0.21 | 0.18 | - | ||||
| 2. Depressed & Residential Instability (7%) | 0.57 | 0.18 | - | 0.29 | 0.20 | - | ||||
| 3. Stressed & Health Problems (4%) | 0.43 | 0.20 | - | 0.31 | 0.24 | - | ||||
| 4. High Risk (13%) | 0.77 | 0.19 | *** | * | 0.53 | 0.19 | *** | * | ||
Note.
p < .001
p < .01
p < .05.
All models controlled for child age, child sex, child low birth weight status, child disability status, mother’s age, mother’s race, mother’s marital status, number of additional children in household, and number of adults in household.
Discussion
This study examined how risk factors co-occur among families in poverty across time and how these profiles of risk factors were associated with neglectful parenting. Prior research has demonstrated that each of the chosen risk factors (i.e., depressive symptoms, low education, parenting stress, caregiver health issues, residential instability, and no health insurance) are individually associated with either physical neglect or supervisory neglect, but not all of these have been investigated within the context of poverty or explored longitudinally. This study sought to fill this gap in the literature by using a person-centered approach to studying the associations between risk factors and neglect among families in poverty.
In reviewing the results, the types of risk profiles were fairly stable across time. At both year 1 and year 3, there were High Risk, Low Risk, and Stressed with Health Problems profiles. The only noticeable change was the Depressed and Uninsured profile at year 1 changed to Depressed with Residential Instability at year 3 due to similar uninsurance rates at year 3 and a higher rate of residential instability. These results provide evidence that the way in which risk factors co-occur might be consistent across early childhood and some prior work has also found that risk profiles are relatively stable across early childhood (e.g., Dunn et al., 2011; Yan et al., 2018). Interestingly, most mothers moved to the Low Risk profile at year 3 regardless of their profile membership at year 1. One potential explanation could be that the first year of life is a particularly vulnerable time for risk exposure compared to older ages. Parenting during the first year of life is especially demanding, physically and financially, and the United States provides some of the least supports to parents compared to other countries (i.e., no paid parental leave, no universal health insurance, no subsidized child care, no family cash allowances; Collins, 2019). Alternatively, it could be that when children are close to three years old families have access to more supports, such as child care or other services, which might decrease risk exposure. One exception is mothers in the High Risk profile at year 1 were likely to remain High Risk at year 3. This is not particularly surprising given the U.S. policy context provides minimal supports to families, thereby leaving the structural challenges of poverty to fall solely on families. In the context of poverty, parents often struggle to find resources on their own, either due to limited availability or quality, due to the prohibitory cost of resources, or due to exclusion criteria (Elias et al., 2018; Saar-Heiman, 2022). Therefore, in order to alleviate exposure to high levels of risk in the context of poverty, policy solutions are warranted to create equitable environments.
Another finding was that High Risk profile membership, compared to Low Risk profile membership, at years 1 or 3 was related to more physical neglect and supervisory neglect. Mothers in the High Risk profile at year 3 also engaged in more physical neglect at year 5 than mothers in the Stressed with Health Problems profile and engaged in more supervisory neglect at year 5 than the mothers in the Depressed with Residential Instability profile. Poverty is a structural-level risk factor, when coupled with a multitude of other risk exposures at once can undermine parents’ abilities to provide or supervise their child, thereby increasing neglectful parenting behaviors. Indeed, based on the Family Stress Model, poverty combined with economic pressures (e.g., residential instability, lack of health insurance) and parental psychological distress (e.g., depressive symptoms and parenting stress) increases the risk of disrupted parenting (Conger et al., 2010), or in this case neglect. As such, addressing financial, housing, food, child care, and health care insecurity requires policy-level change to reduce society-level risk factors associated with poverty (Elias et al., 2018; Klika et al., 2022; Smith et al., 2021; Thomas & Waldfogel, 2022; Zhang et al., 2022). Therefore, practitioners and policymakers should consider how to address structural inequalities when working with families in poverty, in addition to providing family-level supports (Briar-Lawson et al., 2021; Saar-Heiman, 2022). Future research should continue to use a longitudinal, person-centered approach to elucidate processes through which risk factors challenge parenting in the context of poverty.
Overall, there were more differences in physical neglect parenting behaviors, compared to supervisory neglect, based on latent profile membership across time. It could be that the selected risk factors are more predictive of physical neglect rather than supervisory neglect. Specifically, there might be more conceptual overlap between certain risk factors and indicators of subtypes of neglect. For example, residential instability or lack of health insurance might be more predictive of physical neglect indicators assessing the ability to meet children’s basic needs of shelter and medical care, compared to supervisory neglect which includes indicators of substance abuse, supervision, or domestic violence. Similar work has found that economic risks are more closely associated with physical neglect, whereas low levels of parent education are related to supervisory and physical neglect (Turner et al., 2019). Additionally, previous research has found protective factors were more predictive of physical neglect than supervisory neglect (Sattler, 2021). Alternatively, it might be that supervisory neglect is too heterogeneous to capture in one construct and requires further examination of specific indices (e.g., domestic violence exposure vs. leaving a child unattended). Future research should continue to explore the differential impact of risk factors on multiple types of maltreatment.
Several limitations of this study need to be considered when evaluating the results. First, although this study is longitudinal and controls for many covariates, these results cannot establish causality and it would be unethical to assign risks to families in order to explore causality. Alternatively, causal statistical methods such as propensity score matching could be used in future research to understand the casual association between risk profiles and neglectful parenting. Second, the current assessments may not be fully reflective of families’ risk experiences or neglectful parenting behaviors; however, this study used the best available measures to assess the risks of interest. This study also assessed behavioral approximations of two subtypes of neglect as a way of assessing high risk parenting behaviors. Third, this study did not have administrative data on child protective services involvement and thus, cannot ascertain which families had system involvement. Future studies should consider linking survey and administrative data to provide a more holistic picture of parenting, risk factors, and systems involvement. Fourth, the ways in which risks influence neglect may occur on a more proximal timeline than what was measured in the given dataset. Future research could explore how families’ experiences of risk influence their parenting behaviors in a more immediate way. Fifth, this study focused on mothers, however perpetrators of neglect can have a wide variety of relations to the child. For example, although over 90% of victims experience maltreatment from one or both parents, closer to 38% of victims are maltreated by mothers alone (USDHHS, 2022). Therefore, future work should include experiences of neglect from multiple perpetrators. Sixth, the parenting stress index reflected lower than expected internal consistency, which may be due to using a shortened version of the scale. Large-scale surveys often have to use abbreviated versions of scales and this may contribute to lower internal consistency and potentially result in insignificant findings (Gard et al., 2020). Lastly, the sample of this study includes an overrepresentation of Black and other race families and an underrepresentation of White families. Thus, many families included in the current study are impacted by other challenges, such as structural racism, in addition to poverty. This may influence the findings and requires further investigation on the ways in which systems and inequities interact to threaten families.
Nonetheless, the current study has several strengths and important implications for academic and nonacademic audiences. This study was one of the first to use a person-centered approach to model risk factors for neglect among families in poverty. These results can provide policymakers and practitioners information on how specific configurations of risk factors undermine families’ capacity to effectively meet children’s needs in order to tailor resources and interventions. The current study was also one of the first to examine how the risks for neglect vary across time. This information can help inform interventions and programs on how families’ needs and vulnerabilities change across early childhood, and more effectively personalize resources based on children’s developmental stage.
Currently, there is limited evidence on which families in poverty are the most at risk for neglect, which is troubling given the heterogeneity of families in poverty and that the majority of families in poverty do not engage in neglect. The results from this study provide evidence on how risks co-occur among families in poverty and which profiles of risk increase the likelihood of neglect across early childhood. Given the often constrained social services in the U.S., these results are particularly useful for policymakers and practitioners to identify co-occurring risk exposures among families in poverty in order to efficiently create resources and interventions. These findings illustrate that it is not just poverty, but rather the experience of many risks in the context of poverty that increase child neglect.
Acknowledgments
The author acknowledges the support of grants from the National Institute of Child Health and Human Development (T32 HD007081–35, PI: R. Kelly Raley; T32 HD049302, PI: Deborah Ehrenthal).
References
- Abidin RR (1995). Manual for the parenting stress index. Odessa, FL: Psychological Assessment Resources. [Google Scholar]
- Barnett D, Manly JT, & Cicchetti D (1993). Defining child maltreatment: The interface between policy and research. In Cicchetti D & Toth SL (Eds.), Child Abuse, Child Development, and Social Policy (pp. 7–74). Norwood, NJ: Ablex. [Google Scholar]
- Belsky J (1993). Etiology of child maltreatment: A developmental ecological analysis. Psychological Bulletin, 114, 413. [DOI] [PubMed] [Google Scholar]
- Berger LM (2007). Socioeconomic factors and substandard parenting. Social Service Review, 81, 485–522. [Google Scholar]
- Berger LM, Paxson C, & Waldfogel J (2009). Income and child development. Children and Youth Services Review, 31, 978–989. 10.1016/j.childyouth.2009.04.013 [DOI] [PMC free article] [PubMed] [Google Scholar]
- Briar-Lawson K, Pryce JA, & Raheim S (2021). Family-centered anti-poverty strategies to address child neglect. Child Welfare, 98, 145–176. [Google Scholar]
- Caldwell BM, & Bradley RH (2001). HOME inventory and administration manual. 3rd ed. Little Rock, AR: University of Arkansas for Medical Sciences. [Google Scholar]
- Chaffin M, & Bard D (2006). Impact of intervention surveillance bias on analyses of child welfare report outcomes. Child Maltreatment, 11(4), 301–312. 10.1177/1077559506291261 [DOI] [PubMed] [Google Scholar]
- Clément MÈ, Bérubé A, & Chamberland C (2016). Prevalence and risk factors of child neglect in the general population. Public Health, 138, 86–92. [DOI] [PubMed] [Google Scholar]
- Collins C (2019). Making motherhood work. In Making Motherhood Work. Princeton University Press. [Google Scholar]
- Collins LM, & Lanza ST (2010). Latent class and latent transition analysis. Hoboken, New Jersey: Wiley, doi: 10.1002/9780470567333.ch7. [DOI] [Google Scholar]
- Conger RD, Conger KJ, & Martin MJ (2010). Socioeconomic status, family processes, and individual development. Journal of Marriage and Family, 72, 685–704. [DOI] [PMC free article] [PubMed] [Google Scholar]
- Cunha F, Heckman JJ, Lochner L, & Masterov DV (2006). Interpreting the evidence on life cycle skill formation. Handbook of the Economics of Education, 1, 697–812. [Google Scholar]
- Doan SN, & Evans GW (2020). Chaos and instability from birth to age three. The Future of Children, 30(2), 93–114. [Google Scholar]
- Drake B, Jonson-Reid M, & Kim H (2017). Surveillance bias in child maltreatment: A tempest in a teapot. International Journal of Environmental Research and Public Health, 14(9), 971. 10.3390/ijerph14090971 [DOI] [PMC free article] [PubMed] [Google Scholar]
- Drake B, Lee SM, & Jonson-Reid M (2009). Race and child maltreatment reporting: Are Blacks overrepresented? Children and Youth Services Review, 31(3), 309–316. 10.1016/j.childyouth.2008.08.004. [DOI] [PMC free article] [PubMed] [Google Scholar]
- Dubowitz H, Pitts SC, Litrownik AJ, Cox CE, Runyan D, & Black MM (2005). Defining child neglect based on child protective services data. Child Abuse & Neglect, 29, 493–511. [DOI] [PubMed] [Google Scholar]
- Dubowitz H, Kim J, Black MM, Weisbart C, Semiatin J, & Magder LS (2011). Identifying children at high risk for a child maltreatment report. Child Abuse & Neglect, 35, 96–104. [DOI] [PubMed] [Google Scholar]
- Elias TI, Blais N, Williams K, & Burke JG (2018). Shifting the paradigm from child neglect to meeting the needs of children: A qualitative exploration of parents’ perspectives. Social work in Public Health, 33, 407–418. [DOI] [PubMed] [Google Scholar]
- English DJ, Bangdiwala SI, & Runyan DK (2005). The dimensions of maltreatment: Introduction. Child Abuse & Neglect, 29, 441–460. [DOI] [PubMed] [Google Scholar]
- Font SA, & Berger LM (2015). Child maltreatment and children’s developmental trajectories in early to middle childhood. Child Development, 86, 536–556. [DOI] [PMC free article] [PubMed] [Google Scholar]
- Garfield R, Anthony D, and Orgera K (2020). The coverage gap: Uninsured poor adults in states that do not expand medicaid. Kaiser Family Foundation. Accessed December 16, 2022. https://www.kff.org/medicaid/issue-brief/the-coverage-gap-uninsured-poor-adults-in-states-that-do-not-expand-medicaid/.
- Haworth S, Schaub J, Kidney E, & Montgomery P (2022). A Systematic Review of Measures of Child Neglect. Research on Social Work Practice, 10497315221138066. [Google Scholar]
- Jobe-Shields L, Andrews AR, Parra GR, & Williams NA (2015). Person-centered approaches to understanding early family risk. Journal of Family Theory & Review, 7, 432–451. [Google Scholar]
- Jonson-Reid M, Drake B, & Zhou P (2013). Neglect subtypes, race, and poverty: Individual, family, and service characteristics. Child Maltreatment, 18, 30–41. [DOI] [PMC free article] [PubMed] [Google Scholar]
- Jung T, & Wickrama KAS (2008). An introduction to latent class growth analysis and growth mixture modeling. Social and Personality Psychology Compass, 2, 302–317. [Google Scholar]
- Kessler RC, Andrews G, Mroczek D, Ustun B, & Wittchen HU (1998). The world health organization composite international diagnostic interview short-form (cidi-sf). International Journal of Methods in Psychiatric Research, 7, 171–185. [DOI] [PMC free article] [PubMed] [Google Scholar]
- Kids Count. (2020, September). Child poverty statistics in the U.S. KIDS COUNT data center: A project of the Annie E. Casey Foundation. Retrieved June 6, 2022, from https://datacenter.kidscount.org/data/tables/43-children-in-poverty-100-percent-poverty#detailed/1/any/false/1729,37,871,870,573,869,36,868,867,133/any/321,322 [Google Scholar]
- Kim H, Drake B, & Jonson-Reid M (2018). An examination of class-based visibility bias in national child maltreatment reporting. Children and Youth Services Review, 85, 165–173. [Google Scholar]
- Klika JB, Maguire-Jack K, Feely M, Schneider W, Pace GT, Rostad W, ... & Merrick MT. (2022). Childcare subsidy enrollment income generosity and child maltreatment. Children, 10(1), 64. [DOI] [PMC free article] [PubMed] [Google Scholar]
- Kobulsky JM, Dubowitz H (2022). The Etiology of Child Neglect and a Guide to Addressing the Problem. In: Geffner R., White JW., Hamberger LK., Rosenbaum A., Vaughan-Eden V., Vieth VI. (eds) Handbook of Interpersonal Violence and Abuse Across the Lifespan. Springer, Cham. 10.1007/978-3-319-89999-2_325 [DOI] [Google Scholar]
- Kobulsky JM, Dubowitz H (2022b). The Nature of Neglect and Its Consequences. In: Geffner R., White JW., Hamberger LK., Rosenbaum A., Vaughan-Eden V., Vieth VI. (eds) Handbook of Interpersonal Violence and Abuse Across the Lifespan. Springer, Cham. 10.1007/978-3-319-89999-2_9 [DOI] [Google Scholar]
- Maguire-Jack K, & Sattler K (2022). Neighborhood poverty, family economic well-being, and child maltreatment. Journal of Interpersonal Violence, 08862605221119522. [DOI] [PMC free article] [PubMed] [Google Scholar]
- Marco M, Maguire-Jack K, Gracia E, & López-Quílez A (2020). Disadvantaged neighborhoods and the spatial overlap of substantiated and unsubstantiated child maltreatment referrals. Child Abuse & Neglect, 104, 104477. [DOI] [PubMed] [Google Scholar]
- Mayer M, Lavergne C, Tourigny M, & Wright J (2007). Characteristics differentiating neglected children from other reported children. Journal of Family Violence, 22, 721–732. [Google Scholar]
- McGinty EE, Nair R, Assini-Meytin LC, Stuart EA, & Letourneau EJ (2022). Impact of medicaid expansion on reported incidents of child neglect and physical abuse. American Journal of Preventive Medicine, 62, e11–e20. [DOI] [PubMed] [Google Scholar]
- Mistry RS, Benner AD, Biesanz JC, Clark SL, & Howes C (2010). Family and social risk, and parental investments during the early childhood years as predictors of low-income children’s school readiness outcomes. Early Childhood Research Quarterly, 25, 432–449. [Google Scholar]
- Miyamoto S, Romano PS, Putnam-Hornstein E, Thurston H, Dharmar M, & Joseph JG (2017). Risk factors for fatal and non-fatal child maltreatment in families previously investigated by CPS: A case-control study. Child Abuse & Neglect, 63, 222–232. [DOI] [PubMed] [Google Scholar]
- Muthén LK, & Muthén B (2015). Mplus. The Comprehensive Modelling Program for Applied Researchers: User’s Guide. [Google Scholar]
- Nylund KL, Asparouhov T, & Muthén BO (2007). Deciding on the number of classes in latent class analysis and growth mixture modeling: A Monte Carlo simulation study. Structural Equation Modeling, 14, 535–569. [Google Scholar]
- Nylund-Gibson K, & Choi AY (2018). Ten frequently asked questions about latent class analysis. Translational Issues in Psychological Science, 4, 440. [Google Scholar]
- Palmer L, Font S, Eastman AL, Guo L, & Putnam-Hornstein E (2022). What does child protective services investigate as neglect? A population-based study. Child Maltreatment, 10775595221114144. [DOI] [PMC free article] [PubMed] [Google Scholar]
- Proctor LJ, & Dubowitz H (2014). Child neglect: Challenges and controversies. In Korbin JE & Krugman RD (Eds.), Handbook of Child Maltreatment (pp. 27–61). Netherlands: Springer. [Google Scholar]
- Rebbe R (2018). What is neglect? State legal definitions in the United States. Child Maltreatment, 23, 303–315. [DOI] [PMC free article] [PubMed] [Google Scholar]
- Roy AL, & Raver CC (2014). Are all risks equal? Early experiences of poverty-related risk and children’s functioning. Journal of Family Psychology, 28, 391. [DOI] [PMC free article] [PubMed] [Google Scholar]
- Saar-Heiman Y (2022). Understanding the relationships among poverty, child maltreatment, and child protection involvement: perspectives of service users and practitioners. Journal of the Society for Social Work and Research, 13, 117–141. [Google Scholar]
- Sattler KMP (2019). Preventing neglect and promoting child well-being among children in high-risk environments [Doctoral dissertation, The University of Texas at Austin]. UT Electronic Theses and Dissertations. https://repositories.lib.utexas.edu/bitstream/handle/2152/75841/SATTLER-DISSERTATION-2019.pdf?sequence=1&isAllowed=y [Google Scholar]
- Sedlak AJ, Mettenburg J, Basena M, Petta I, McPherson K, Greene A, and Li S (2010). Fourth National Incidence Study of Child Abuse and Neglect (NIS–4): Report to Congress, Executive Summary. Washington, DC: U.S. Department of Health and Human Services, Administration for Children and Families. [Google Scholar]
- Slack KS, Holl JL, McDaniel M, Yoo J, & Bolger K (2004). Understanding the risks of child neglect: An exploration of poverty and parenting characteristics. Child Maltreatment, 9, 395–408. [DOI] [PubMed] [Google Scholar]
- Slack KS, Berger LM, DuMont K, Yang MY, Kim B, Ehrhard-Dietzel S, & Holl JL (2011). Risk and protective factors for child neglect during early childhood: A cross-study comparison. Children and Youth Services Review, 33, 1354–1363. [Google Scholar]
- Smith BD, Li Q, Wang K, & Smith AM (2021). A national study of child maltreatment reporting at the county level: Interactions among race/ethnicity, rurality and poverty. Children and Youth Services Review, 122, 105925. [Google Scholar]
- Stith SM, Liu T, Davies LC, Boykin EL, Alder MC, Harris JM, ... & Dees, J. E. M. E. G. (2009). Risk factors in child maltreatment: A meta-analytic review of the literature. Aggression and Violent Behavior, 14, 13–29. [Google Scholar]
- Straus MA, Hamby SL, Finkelhor D, Moore DW, & Runyan D (1998). Identification of child maltreatment with the Parent-Child Conflict Tactics Scales: Development and psychometric data for a national sample of American parents. Child Abuse & Neglect, 22, 249–270. [DOI] [PubMed] [Google Scholar]
- Streiner DL (2003). Being inconsistent about consistency: When coefficient alpha does and doesn’t matter. Journal of Personality Assessment, 80(3), 217–222. [DOI] [PubMed] [Google Scholar]
- Thomas MM, & Waldfogel J (2022). What kind of “poverty” predicts CPS contact: Income, material hardship, and differences among racialized groups. Children and Youth Services Review, 136, 106400. [DOI] [PMC free article] [PubMed] [Google Scholar]
- Turner HA, Vanderminden J, Finkelhor D, & Hamby S (2019). Child neglect and the broader context of child victimization. Child Maltreatment, 24, 265–274. [DOI] [PubMed] [Google Scholar]
- U.S. Department of Health & Human Services, Administration for Children and Families, Administration on Children, Youth and Families, Children’s Bureau. (2022). Child Maltreatment 2020. Available from https://www.acf.hhs.gov/cb/data-research/child-maltreatment.
- Vanderminden J, Hamby S, David-Ferdon C, Kacha-Ochana A, Merrick M, Simon TR, ... & Turner H. (2019). Rates of neglect in a national sample: Child and family characteristics and psychological impact. Child Abuse & Neglect, 88, 256–265. [DOI] [PMC free article] [PubMed] [Google Scholar]
- Warren EJ, & Font SA (2015). Housing insecurity, maternal stress, and child maltreatment: An application of the family stress model. Social Service Review, 89, 9–39. [Google Scholar]
- Xu Y, Jedwab M, Soto-Ramírez N, Levkoff SE, & Wu Q (2021). Material hardship and child neglect risk amidst COVID-19 in grandparent-headed kinship families: The role of financial assistance. Child Abuse & Neglect, 121, 105258. [DOI] [PMC free article] [PubMed] [Google Scholar]
- Zhang L, Nepomnyaschy L, & Simmel C (2022). So close yet so different: neighborhood inequality and child maltreatment. Child Abuse & Neglect, 130, 104988. [DOI] [PubMed] [Google Scholar]