Abstract
Background: There is insufficient data on the prevalence and consequences of eating disorders in Type 2 diabetic patients. Objective: To evaluate the presence of eating disorders (ED) and their association with glycaemic control and metabolic parameters in adult patients with type 2 diabetes mellitus (T2DM). Materials and methods: A cross-sectional study on 145 patients was conducted in the medicine outpatient unit of HAHC Hospital, Jamia Hamdard tertiary care center. The Eating Attitudes Test (EAT-26) was used to screen for ED in adults with T2DM. The Score of less than 20 and more than 30 on EAT-26 questionnaire was defined as control for participants and relevant medical details like duration of treatment, glycaemic control, complications were recorded. Results: A total of 145 diabetic individuals participated in this study. Out of these, 17.3% of individuals with T2DM screened positive for ED on EAT-26 scale and had a significant positive correlation in <20 groups and a significant negative correlation in >30 groups. Conclusion: Our study reveals that eating disorders are not very common in our clinical population of T2DM, the prevalence rates of eating disorders are lower in patients with T2DM than those reported from developed western countries.
Keywords: Type 2 diabetes mellitus (T2DM), eating disorders (ED), eating aptitude test (EAT-26), anorexia nervosa (AN), bulimia nervosa (BN), binge eating (BE)
Introduction
Diabetes mellitus (DM) is a metabolic disorder that arises from insulin secretion, insulin action, or both. Insulin deficiency, in turn, contributes to chronic hyperglycaemia with disturbances of carbohydrate, fat, and protein metabolism [1]. It results in a major health problem that has been widely increasing over the past few decades.
Over 424.9 million people worldwide are thought to have diabetes mellitus, according to the International Diabetes Federation. By 2045, it is predicted that more than 628.6 million adults will have diabetes due to the disease’s rising prevalence.
Eating disorders (ED) are conditions that are grouped because of common characteristics of preoccupation with food and body weight which could result in disturbed eating behaviour. They are classified into, binge eating disorder (BED), bulimia nervosa (BN), Anorexia Nervosa (AN), Acute restrictive food intake disorder (ARFID), other specified feeding or eating disorders, and unspecified feeding or eating disorders. Bulimia nervosa followed by anorexia nervosa shows a high prevalence in diabetes [2].
Binge Eating Disorder (BED) is characterized by repeated episodes of uncontrolled intake of the unusually large amount of food in a short period time. These episodes are accompanied by feelings of guilt, shame, and physiological distress. It affects around 2% of the world’s population and can lead to other health problems associated with diets, such as high cholesterol and diabetes [3].
Bulimia nervosa is a type of eating disorder that is also known as bulimia. It’s a dangerous illness that can lead to death. Binge eating followed by purging is the most common symptom. Forced vomiting, strenuous activity, or the use of laxatives or diuretics can all cause purging [3].
Before a diagnosis of diabetes, weight loss may be viewed as good, but subsequent weight restitution and growth may have unfavourable repercussions [4]. Family stress related to diabetes has been identified as a risk factor for acute dieting, as well as for eating disorders in diabetes mellitus [4]. Earlier Studies have shown that a prominent association exists between disfigured eating behaviour and diabetes and they exacerbate each other and hence become an important inducible risk factor for diabetes mellitus [5].
To the best of our knowledge, we have limited data from studies assessing a possible link between eating disorders with diabetes mellitus and insulin resistance. Therefore, this study is designed to evaluate the association of commonly prevalent eating disorders including Binge eating, Bulimia Nervosa, and Anorexia Nervosa with Insulin Resistance in a subgroup of the diabetic population. Therefore, we have taken up this study to study and correlate the relationship between eating disorders and glycaemic parameters in a diabetic population.
Material and methods
Type of study
Cross-sectional study with Control distribution and Parametric data included 145 patients diagnosed with Diabetes Mellitus Type II (both males and females aged 25-65 years) seeking medical care at the HAHC Hospital, Jamia Hamdard.
Inclusion criteria and exclusion criteria
Subjects diagnosed with Type 2 diabetes mellitus as per ADA (American diabetes association) criteria [6] were included and patients with Diabetic complications and co-morbid psychiatric illness as per ICD (International criteria of disease) 10 criteria [7] as diagnosed under guidance of a psychiatrist, subjects with apparent hepatic, pulmonary & renal malignancies on haemodialysis were excluded.
Ethical clearance
Ethical clearance was obtained from ethics committee of HIMSR (Hamdard Institute of medical sciences and research), Jamia Hamdard. The study was briefed to all the participants. Informed written consent was obtained from the patients and healthy subjects.
Data collection measure
Data regarding eating patterns and preferences was taken in the form of the most widely used standardized questionnaire in both languages Hindi and English attached to the proforma EAT-26 questionnaire [8]. Generally, a referral is recommended if a respondent scores “positively” or meets the “cut off” scores or threshold on one or more criteria. Low scores (<20) can still be consistent with serious eating problems, as denial of symptoms can be a problem with eating disorders. Score (>30) indicate high level of concerned dieting, bodyweight or problematic eating behaviour [8]. Based on EAT 26 scoring, Prevalence of Bulimia nervosa, binge eating, anorexia nervosa was calculated and diabetic subjects were divided into three groups (<20 = binge eating, >30 = Anorexia nervosa, 20-30 = control EAT-26 score) [8].
Biochemical estimations
Fasting and post prandial plasma glucose was determined using BECKMAN COULTER AU480 analyser [Hexokinase method] [9]. Fasting plasma glucose ≥126 mg/dl and Two-hour plasma glucose ≥200 mg/dl was defined as diabetic condition according to American Diabetic Association [6].
HbA1c (Glycated haemoglobin) was estimated by Bio-Rad D-10 HPLC (High Performance liquid chromatography) analyser for detecting diabetes [HPLC method] [10]. HbA1c ≥6.5% was considered as diabetic condition according American Diabetic Association [6]. The degree of Insulin resistance (IR) was determined by using the homeostasis model assessment (HOMA-IR). The estimation of IR by homeostasis model assessment (HOMA) was calculated with the formula: [fasting serum insulin (µUI/ml) × fasting plasma glucose (mg/dl)]/22.5 [11]. HOMA-IR ≥2 was considered as insulin resistance according to American diabetic association [11]. Statistical analysis was performed using SPSS 21. The data was presented as mean ± standard error mean (SEM), p-value <0.05 was considered statistically significance. Comparison of glycaemic indices (fasting, postprandial blood glucose, HbA1c and insulin resistance) between different groups of eating disorders was made by performing ANOVA two-way statistical tests. Correlation between fasting blood glucose, postprandial blood glucose, and HbA1c and insulin resistance with score of eating disorders (EAT-26) was obtained by Spearman and Pearson correlation method.
Results
The study was carried on 145 diabetic subjects. Out of 145 diabetic subjects 39.5% were males and 60.5% were females. EAT-26 questionnaire scored 25 individuals in below 20 and above 30 groups. Based on this, 25 individuals scores were below 20 and above 30. Out of 25 individuals, 13 were males and 12 were females. So, the prevalence was 9% in males and in females, it was 8.3%. The total prevalence calculated was 17.3% (Figure 14). Mean duration of diabetes in was 5.69±0.94 years in below 20 and above 30 groups. Mean age of subjects in <20 and >30 groups were 48.78±1.26 years. No significant correlation was found between age, gender distribution, body weight and duration of diabetes (Table 1; Figure 1).
Figure 14.
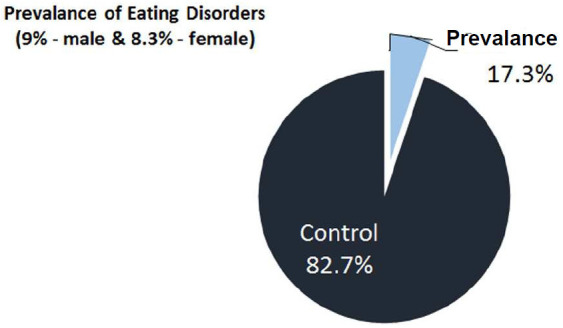
Prevalence of eating disorder in type 2 Diabetes mellitus patients.
Table 1.
Socio-demographic features of the study subjects
| Total Diabetic population | Diabetic Below and above cutoff score | P value | |
|---|---|---|---|
| (n=145) | (n=25) | ||
| Mean ± SEM | Mean ± SEM | ||
| Age (years) | 46.02±1.38 | 48.78±1.26 | - |
| Gender distribution (n) | Male =57 (39.5%) | Male =13 (9%) | - |
| Female =88 (60.5%) | Female =12 (8.3%) |
Figure 1.
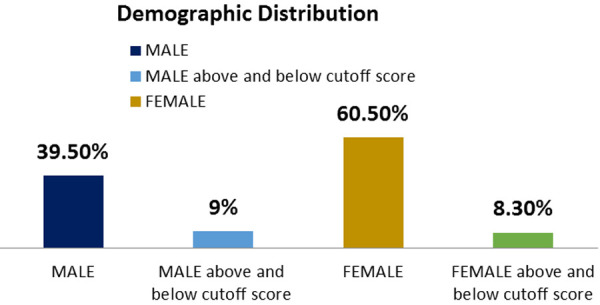
Sex wise distribution (%) of subjects in control and diabetic groups.
The levels of Fasting plasma glucose were significantly higher subjects with eating disorders as compared to control group. The average plasma glucose levels were 168.4±5.51 mg/dL in diabetics whose EAT-26 scores in between 20-30. Whereas average fasting plasma glucose levels in <20 and >30 groups were 218±23.10 mg/dL and 269±25.12 respectively (Figure 2; Table 2). The levels of post prandial plasma glucose were significantly higher in subjects with eating disorders. The average post prandial plasma glucose levels were 230±8.82 mg/dL in diabetics whose EAT-26 scores in between 20-30. Whereas average post prandial plasma glucose levels in <20 and >30 groups were 308.71±36.83 mg/dL and 396.5±37.78 respectively (Figure 3; Table 3). The HbA1c levels were significantly higher in subjects with eating disorders. The average HbA1c levels were 8.33±0.17 in diabetics whose EAT-26 scores in between 20-30. Whereas average HbA1c levels in <20 and >30 groups were 10±0.75 and 10.3±0.62 respectively (Figure 4; Table 4). The HOMA-IR levels were significantly higher in subjects with eating disorders. The average HOMA-IR levels were 4.6±0.37 in diabetics whose EAT-26 scores in between 20-30. Whereas average HOMA-IR levels in <20 and >30 groups were 4.09±0.79 and 8.372±2.33 respectively (Figure 5; Table 5).
Figure 2.
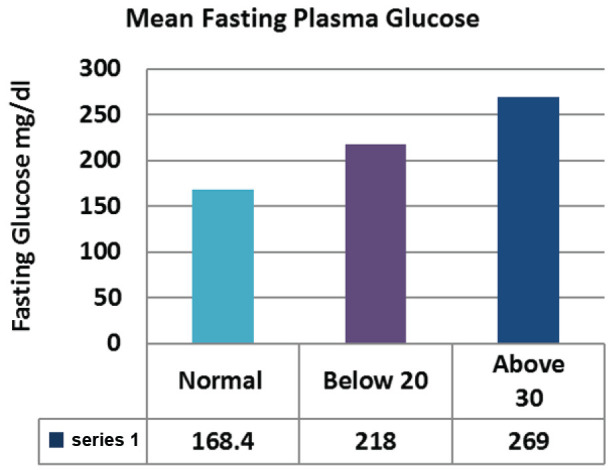
Comparison of mean fasting plasma glucose between control and eating disorder group.
Table 2.
Comparison of mean fasting plasma glucose between control and eating disorder groups
| Normal Mean ± SEM | Below 20 Mean ± SEM | Above 30 Mean ± SEM | P value | |
|---|---|---|---|---|
| Fasting plasma Glucose | 168.4±5.51 | 218±23.10 | 269±25.12 | 0.026 |
Figure 3.
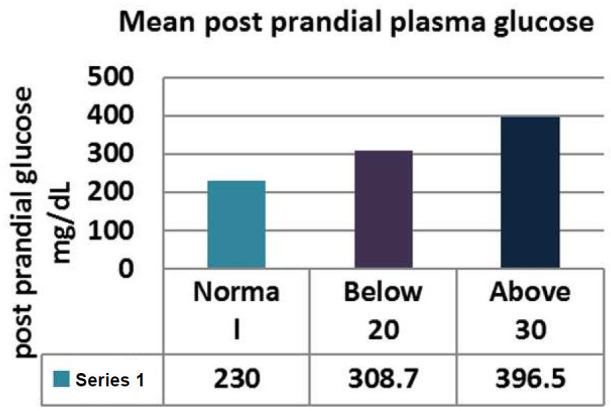
Comparison of mean Post Parandial plasma glucose between control and eating disorder group.
Table 3.
Comparison of mean Post-Parandial plasma glucose between control and eating disorder groups
| Normal Mean ± SEM | Below 20 Mean ± SEM | Above 30 Mean ± SEM | P value | |
|---|---|---|---|---|
| Post prandial plasma Glucose | 230±8.82 | 308.72±36.83 | 396.5±37.78 | 0.019 |
Figure 4.
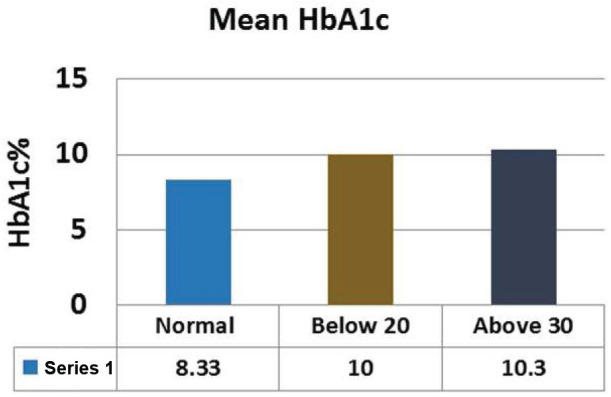
Comparison of mean HbA1c between control and eating disorder group.
Table 4.
Comparison of mean HbA1c between control and eating disorder group
| Normal Mean ± SEM | Below 20 Mean ± SEM | Above 30 Mean ± SEM | P value | |
|---|---|---|---|---|
| HbA1c | 8.33±0.17 | 10±0.75 | 10.3±0.62 | 0.047 |
Figure 5.
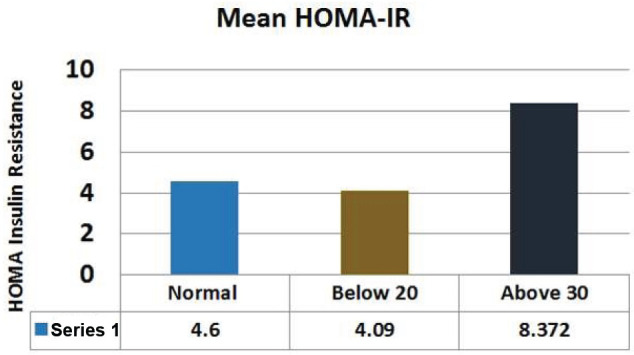
Comparison of mean HOMA-IR between control and eating disorder group.
Table 5.
Comparison of mean HOMA-IR between control and eating disorder group
| Normal Mean ± SEM | Below 20 Mean ± SEM | Above 30 Mean ± SEM | P value | |
|---|---|---|---|---|
| HOMA-IR | 4.60±0.37 | 4.09±0.79 | 8.372±2.33 | 0.02 |
Fasting plasma glucose was significantly increased in <20 group diabetic patients. A further Eat-26 score revealed a significant positive correlation with fasting plasma glucose (P=0.017, r=0.02) (Figure 6). Post prandial plasma glucose was significantly increased in <20 group diabetic patients. Further Eat-26 score revealed a significant positive correlation with post prandial plasma glucose (P=0.044, r=0.5) (Figure 7). HbA1c % was significantly increased in <20 group diabetic patients. Further Eat-26 score revealed a significant positive correlation with HbA1c % (P=0.042, r=0.17) (Figure 8). HOMA-IR was significantly increased in <20 group diabetic patients. Further Eat-26 score revealed a significant positive correlation with HOMA-IR (P=0.002, r=0.83) (Figure 9). Fasting plasma glucose was significantly decreased in >30 group diabetic patients. Further Eat-26 score revealed a significant negative correlation with fasting plasma glucose (P=0.026, r=0.20) (Figure 10). Post prandial plasma glucose was significantly decreased in >30 group diabetic patients. Further Eat-26 score revealed a significant negative correlation with post prandial plasma glucose (P=0.019, r=-0.30) (Figure 11). HbA1c % was significantly decreased in >30 group diabetic patients. Further Eat-26 score revealed a significant negative correlation with HbA1c % (P=0.047, r=-0.22) (Figure 12). HOMA-IR was significantly decreased in >30 group diabetic patients. Further Eat-26 score revealed a significant negative correlation with HOMA-IR (P=0.04, r=-0.15) (Figure 13). Refer (Table 6) for overall conclusion.
Figure 6.
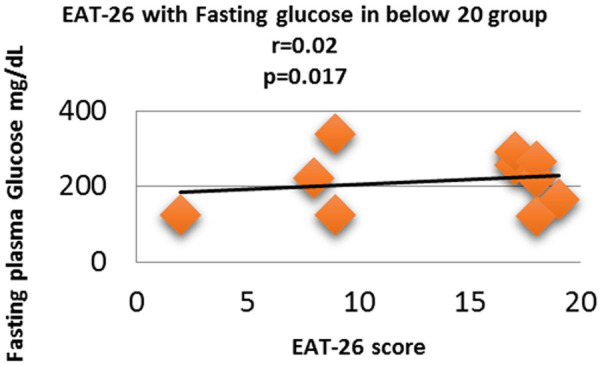
Correlation analysis (Pearson correlation coefficient) showing the relation between Fasting plasma glucose and EAT-26 score in Diabetic subjects.
Figure 7.
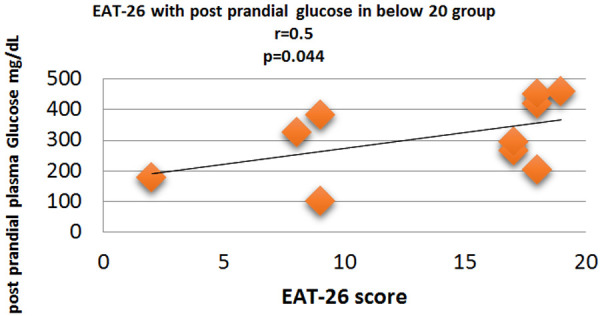
Correlation analysis (Pearson correlation coefficient) showing the relation between Post prandial plasma glucose and EAT-26 score in Diabetic subjects.
Figure 8.
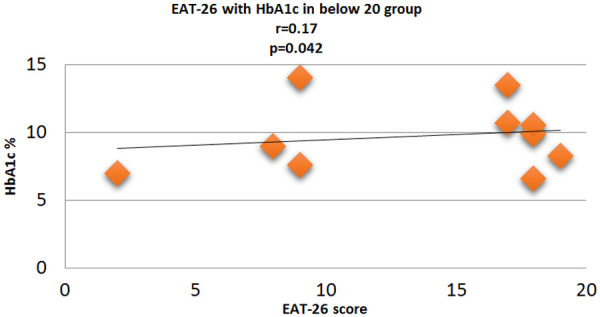
Correlation analysis (Pearson correlation coefficient) showing the relation between HbA1c % and EAT-26 score in Diabetic subjects.
Figure 9.
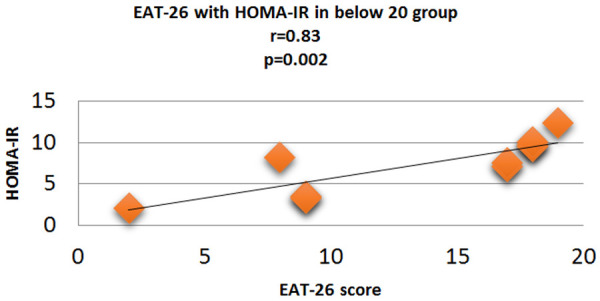
Correlation analysis (Pearson correlation coefficient) showing the relation between HOMA-IR and EAT-26 score in Diabetic subjects.
Figure 10.
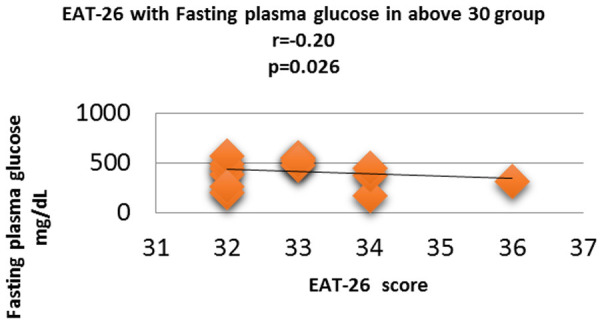
Correlation analysis (Pearson correlation coefficient) showing the relation between Fasting plasma glucose and EAT-26 score in Diabetic subjects.
Figure 11.
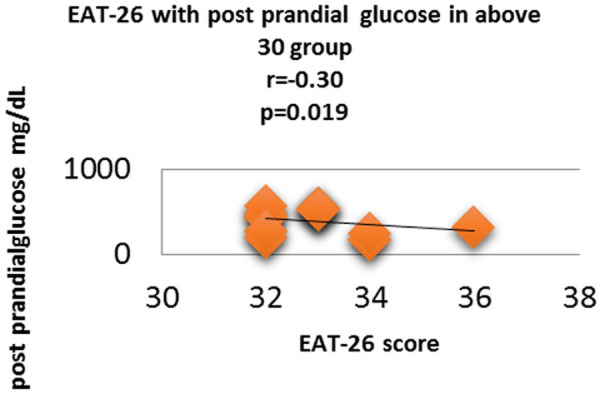
Correlation analysis (Pearson correlation coefficient) showing the relation between Post prandial plasma glucose and EAT-26 score in Diabetic subjects.
Figure 12.
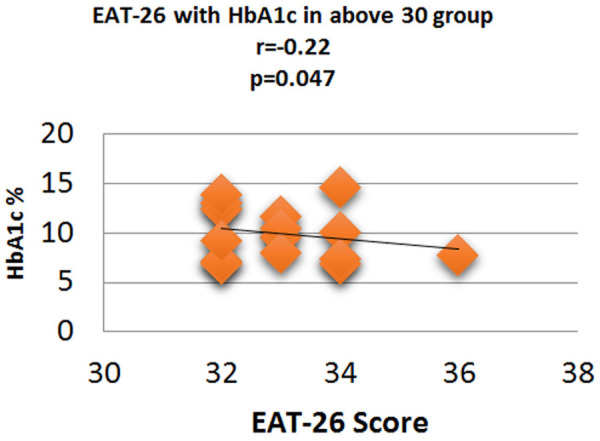
Correlation analysis (Pearson correlation coefficient) showing the relation between HbA1c % and EAT-26 score in Diabetic subjects.
Figure 13.
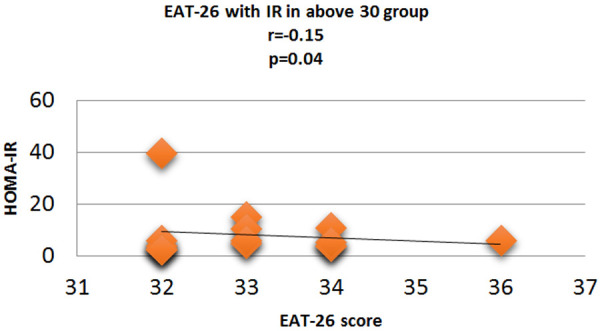
Correlation analysis (Pearson correlation coefficient) showing the relation between HOMA-IR and EAT-26 score in Diabetic subjects.
Table 6.
Comparison of the control group with the study group
| Normal Mean ± SEM | Below 20 Mean ± SEM | Above 30 Mean ± SEM | P value | |
|---|---|---|---|---|
| Fasting plasma Glucose | 168.4±5.51 | 218±23.10 | 269±25.12 | 0.026 |
| Post-prandial plasma Glucose | 230±8.82 | 308.72±36.83 | 396.5±37.78 | 0.019 |
| HbA1c | 8.33±0.17 | 10±0.75 | 10.3±0.62 | 0.047 |
| HOMA-IR | 4.60±0.37 | 4.09±0.79 | 8.372±2.33 | 0.02 |
Discussion
When hyperglycemia and weight loss are unexplained, patients with T2DM should be “screened for disordered or disrupted eating behaviours validated using screening methods based on self-reported habits linked to drug dosing, meal schedule, and physical activity”.[12].
In our study subjects were divided into 3 groups based on EAT-26 score [8]. Those who scored <20 and >30 were considered at risk and individuals with score between 20 and 30 were considered as Control. The study was carried on 145 diabetic subjects. Out of 145 diabetic subjects 39.5% were males and 60.5% were females. EAT-26 questionnaire scored 25 individuals in <20 and >30 groups. <20 score group had 5 males and 5 females whereas in >30 score group 9 males and 6 females were seen. The mean age of subjects in <20 was 49.60±1.30 years and Mean age of subjects in >30 groups was 48.78±1.26 years; our results was supported by study done by Krishnamurthy et al. [5]. The most prevalent onset age of eating disorders is between 25 and 50 years [5].
Our study revealed that the levels of Fasting plasma glucose were significantly highest in subjects with >30 EAT-26 score. The average significant fasting plasma glucose levels were 168.4±5.51 mg/dL in Control group whereas average fasting plasma glucose levels in <20 and >30 groups were 218±23.10 mg/dL and 269±25.12 respectively. Fasting glucose level was highest in >30 EAT-26 score group as it indicates toward their anorexic style of eating behavior and the plasma levels of fatty acids and ketone bodies increase in starvation leading to elevation of plasma glucose for an uncertain period because of the absence of insulin sensitivity [2]. Our results were supported by other study conducted by other study [5,13]. Our study also showed an interesting finding that the levels of post prandial plasma glucose were also significantly highest in subjects with >30 EAT-26 score. The average post prandial plasma glucose levels were 230±8.82 mg/dL in Control group. Whereas average post prandial plasma glucose levels in <20 and >30 groups were 308.71±36.83 mg/dL and 396.5±37.78 respectively. Post prandial glucose levels were highest in >30 EAT-26 score group as insalubrious lifestyle modifications are the primary cause behind high glucose levels. On the other hand, nutritional intervention involving calorie restriction and avoidance of healthy foods increases insulin demand exacerbated by physical inactivity which ultimately leads to hyperglycemia [5]. Hypoglycemia causes episodes of uncontrolled ingestion of unusually large amounts of food in a short period of time, leading in an elevated postprandial level [7]. The results were comparable to the study conducted by Celik et al., Krishnamurthy et al. [5] and Dostálová et al. [13]. The result of our study also exhibited that the HbA1c levels were significantly highest in subjects with >30 EAT-26 score. The average HbA1c levels were 8.33±0.17 in Control group. Whereas average HbA1c levels in <20 and >30 groups were 10±0.75 and 10.3±0.62 respectively. HbA1c levels were highest in >30 EAT-26 score as it indicates toward their starving and acute fasting behavior, prolonged starvation keeps liver in permanent gluconeogenic state which is responsible for elevated glycated hemoglobin. Similar results were supported by Krishnamurthy [5] and Dostálová [13]. Furthermore, our study found out that the HOMA-IR levels were significantly higher in subjects with >30 EAT-26 score. The average HOMA-IR levels were 4.6±0.37 in Control group. Whereas average HOMA-IR levels in <20 and >30 groups were 4.09±0.79 and 8.372±2.33 respectively. HOMA-IR is maximum in >30 EAT-26 groups as Starvation causes insulin resistance which is partly due to decrease of insulin action on glucose transport in target cells (Dostálová et al., 2007) [13]. According to preliminary evidence from other authors, starvation is linked to a longer time required for insulin to exert its maximal effect on glucose transport, as well as significant alterations in insulin metabolism, including lower basal insulin levels and higher metabolic clearance [13]. Similar results were obtained by Dostálová et al. [13] and Krishnamurthy et al. [5] who also found that insulin resistance was higher in patients with eating disorder as compared to those who did not have any. The present study also revealed an important finding that fasting plasma glucose had a statistically significant positive correlation with <20 EAT-26 score (binge eating scale) (P=0.017, r=0.02) and negative with >30 EAT-26 score (anorexic eating scale) (P=0.026, r=-0.20). As scores <20 on EAT-26 Questionnaire correspond to binge eating behavior and consuming excessive amounts of fatty or sugary foods on a long-term basis can cause blood sugar to rise beyond Control levels and increases potential risk of insulin resistance, type 2 diabetes. Scores >30 on EAT-26 questionnaire displayed anorexic behavior of eating thus higher the score means severe anorexic behavior thus starvation leads to elevation of plasma glucose for an uncertain period because of the absence of insulin sensitivity [2]. Our results were comparable to the previous studies [5,13]. Additionally, post prandial glucose levels had a statistically significant positive correlation with <20 EAT-26 score (binge eating scale) (P=0.044, r=0.5) and negative with >30 EAT-26 score (anorexic eating scale) (P=0.019, r=-0.30). As scores <20 on EAT-26 Questionnaire corresponds to binge eating behavior as when blood sugar levels rise to high levels and not having sufficient insulin in blood to cope, it can often cause feeling of both tiredness and hunger and can therefore makes craving for more food which can lead to vicious circle forming and binge eating. Whereas scores >30 on EAT-26 questionnaire displayed anorexic behavior of eating thus higher the score means severe anorexic behavior. The nutritional intervention involving calorie restriction and avoidance of healthy foods increases insulin demand exacerbated by physical inactivity which ultimately leads to hyperglycemia [5]. Results were supported by studies of Celik et al., Krishnamurthy et al. [5] and Dostálová et al. [13]. HbA1c levels had a statistically significant positive correlation with <20 EAT-26 score (binge eating scale) (P=0.042, r=0.17) and negative with >30 EAT-26 score (anorexic eating scale) (P=0.047, r=-0.22) supported by the results of Celik et al. who also found that patients with binge eating disorders had higher HbA1c [14] unlike Herbozos et al. who found no statistically significant difference in the glycemic control between the two groups. Similarly, HOMA-IR levels in our study had a statistically significant positive correlation with <20 EAT-26 score (binge eating scale) (P=0.002, r=0.83) and negative with >30 EAT-26 score (anorexic eating scale) (P=0.04, r=-0.15). Thus, a positive correlation between <20 EAT-26 score and HOMA-IR showed that with an increase in binge eating behavior insulin resistance increases, scores below 20 on EAT-26 Questionnaire corresponded to binge eating behavior, as binging fatty or sugary foods on a long-term basis can cause your blood sugar to rise beyond Control levels. This is bad for your health because it can increase the risk of insulin resistance [13]. Negative correlation between >30 EAT-26 score and HOMA-IR display anorexic eating behavior and as Starvation causes insulin resistance which is partly due to decrease of insulin action on glucose transport in target cells [13]. Preliminary data from other authors suggested that starvation is associated with an increase of the time necessary for insulin to exert its maximum effect on glucose transport and is associated with marked changes in insulin metabolism characterized by decreased basal insulin levels and increased metabolic clearance [13]. Similar results were obtained by previous studies who also found that insulin resistance was higher in patients with eating disorders as compared to those who did not have any [5,13].
The majority of Indian research on eating disorders prevalence has been conducted on target populations like school children or college-going women [15-18]. Therefore, no community-based studies have been conducted in India to date to document the prevalence of eating disorders; rates have been identified in certain patient populations only [19-23]. Furthermore, in our study prevalence of eating disorders came out to be 17.3% this rate was supported by studies from Western and Asian countries such as China and Japan, but there are no recent epidemiological data available for comparison from other South and Southeast Asian countries [24]. Webb JB et al. also reported Diabetic patients have prevalence rates of binge eating disorders ranging from 2.5 to 40% [7,24-26]. In our study, the prevalence of eating disorder was almost equal in males and females which were 9% in males and 8.3% in females unlike the study performed by [Makino et al.] [27]. Stating that eating disorders were more common in females as compared to males of western countries than of non-western countries [27]. To support our study, recent data indicate that the prevalence of eating disorders, as well as related attitudes and behaviours, is growing in Asia-Pacific regions, and may be comparable to those identified in Europe and North America [23,28]. In support of our prevalence in a recent systematic review of 6527 subjects, the prevalence of eating disorders was found to be present in 1.2-8.0% of diabetic patients [7]. International comparisons can be made easier with standardized eating disorder evaluation methods. However, despite careful translation into local languages, the key themes or principles evaluated by some questions in these methods may not be culturally relevant in all populations [29] looking at the disparities between those who tested positive for eating disorders and those who did not. It was hypothesized that a positive response to a questionnaire might indicate a mild eating disorder and to be classified as an eating disorder in a psychological evaluation.
Conclusion
Diabetes is a lifestyle disease and is closely associated with abnormal eating behaviour. Eating behaviours play a major role in the pathogenesis of diabetes and its complications. There is significant evidence that the induction of eating disorders is key in the onset of diabetic complications. Screening of eating disorders in the early stages of diabetes will prevent and will minimize various complications associated with diabetes mellitus. The positive correlation between disfigured eating behaviour and diabetes exacerbated each other and hence becomes an important inducible risk factor for diabetes mellitus. Fasting blood glucose, post prandial blood glucose, Hba1c and insulin resistance showed a positive correlation with binge eating disorder (EAT <20 score). Moreover, all these parameters showed a significant negative correlation with anorexic eating scale (EAT >30 score). This study helped in the identification of high-risk group and thus early detection and management of eating disorders may minimize complications in diabetes. Our study also revealed that Eating disorders are not common in our clinical population of T2DM and their BMI-matched counterparts without T2DM. The rates of ED are lower than those reported in western and more affluent Asian countries in both populations with or without T2DM. There is little prior information on eating disorders in T2DM subjects from India and this study attempts to address this knowledge gap.
Limitation of the study
This was a hospital-based study and may not be indicative of the prevalence at a population level. Secondly, although we excluded patients with a history of psychiatric comorbidities, like mood disorders, measures for depression and anxiety which often coexist in T2D were not recorded in the current study.
Disclosure of conflict of interest
None.
References
- 1.Davies MJ, D’Alessio DA, Fradkin J, Kernan WN, Mathieu C, Mingrone G, Rossing P, Tsapas A, Wexler DJ, Buse JB. Management of hyperglycaemia in type 2 diabetes, 2018. A consensus report by the American Diabetes Association (ADA) and the European Association for the Study of Diabetes (EASD) Diabetologia. 2018;61:2461–2498. doi: 10.1007/s00125-018-4729-5. [DOI] [PubMed] [Google Scholar]
- 2.Meneghini LF, Spadola J, Florez H. Prevalence and associations of binge eating disorder in a multiethnic population with type 2 diabetes. Diabetes Care. 2006;29:2760. doi: 10.2337/dc06-1364. [DOI] [PubMed] [Google Scholar]
- 3.Salvia MG, Ritholz MD, Craigen KLE, Quatromoni PA. Managing type 2 diabetes or prediabetes and binge eating disorder: a qualitative study of patients’ perceptions and lived experiences. J Eat Disord. 2022;10:148. doi: 10.1186/s40337-022-00666-y. [DOI] [PMC free article] [PubMed] [Google Scholar]
- 4.Roland JM, Bhanji S. Anorexia nervosa occurring in patients with diabetes mellitus. Postgrad Med J. 1982;58:354–6. doi: 10.1136/pgmj.58.680.354. [DOI] [PMC free article] [PubMed] [Google Scholar]
- 5.Krishnamurthy A, Gupta Y, Bhargava R, Sharan P, Tandon N, Jyotsna VP. Evaluation of eating disorders and their association with glycemic control and metabolic parameters in adult patients with type 2 diabetes mellitus. Diabetes Metab Syndr. 2020;14:1555–61. doi: 10.1016/j.dsx.2020.07.048. [DOI] [PubMed] [Google Scholar]
- 6.American Diabetes Association. Diagnosis and classification of diabetes mellitus. Diabetes Care. 2007;30(Suppl 1):S42–7. doi: 10.2337/dc07-S042. [DOI] [PubMed] [Google Scholar]
- 7.World Health Organization. The ICD-10 classification of mental and behavioural disorders. 1992;55:135–9. [Google Scholar]
- 8.Garner DM, Olmsted MP, Bohr Y, Garfinkel PE. The eating attitudes test: psychometric features and clinical correlates. Psychol Med. 1982;12:871–8. doi: 10.1017/s0033291700049163. [DOI] [PubMed] [Google Scholar]
- 9.American Diabetes Association. 2. Classification and diagnosis of diabetes: standards of medical care in diabetes-2018. Diabetes Care. 2018;41(Suppl 1):S13–S27. doi: 10.2337/dc18-S002. [DOI] [PubMed] [Google Scholar]
- 10.Farcet A, Delalande G, Oliver C, Retornaz F. About the HbA1c in the elderly. Geriatr Psychol Neuropsychiatr Vieil. 2016;14:42–8. doi: 10.1684/pnv.2016.0588. [DOI] [PubMed] [Google Scholar]
- 11.Mari A, Pacini G, Murphy E, Ludvik B, Nolan JJ. A model-based method for assessing insulin sensitivity from the oral glucose tolerance test. Diabetes Care. 2001;24:539–48. doi: 10.2337/diacare.24.3.539. [DOI] [PubMed] [Google Scholar]
- 12.American Diabetes Association. 5. Facilitating behavior change and well-being to improve health outcomes: standards of medical care in diabetes-2020. Diabetes Care. 2020;43(Suppl 1):S48–S65. doi: 10.2337/dc20-S005. [DOI] [PubMed] [Google Scholar]
- 13.Dostálová I, Smitka K, Papežová H, Kvasničková H, Nedvídková J. Increased insulin sensitivity in patients with anorexia nervosa: the role of adipocytokines. Physiol Res. 2007;56:587–594. doi: 10.33549/physiolres.931089. [DOI] [PubMed] [Google Scholar]
- 14.Çelik S, Kayar Y, Önem Akçakaya R, Türkyılmaz Uyar E, Kalkan K, Yazısız V, Aydın Ç, Yücel B. Correlation of binge eating disorder with level of depression and glycemic control in type 2 diabetes mellitus patients. Gen Hosp Psychiatry. 2015;37:116–9. doi: 10.1016/j.genhosppsych.2014.11.012. [DOI] [PubMed] [Google Scholar]
- 15.Srinivasan TN, Suresh TR, Jayaram V, Fernandez MP. Eating disorders in India. Indian J Psychiatry. 1995;37:26–30. [PMC free article] [PubMed] [Google Scholar]
- 16.American Diabetes Association. 2. Classification and diagnosis of diabetes. Diabetes Care. 2017;40(Suppl 1):S11–24. doi: 10.2337/dc17-S005. [DOI] [PubMed] [Google Scholar]
- 17.Gupta N, Bhargava R, Chavan B, Sharan P. Eating attitudes and body shape concerns among medical students in Chandigarh. Indian J Soc Psychiatry. 2017;33:219. [Google Scholar]
- 18.Upadhyah AA, Misra R, Parchwani DN, Maheria PB. Prevalence and risk factors for eating disorders in Indian adolescent females. Natl J Physiol Pharm Pharmacol. 2014;4:153–7. [Google Scholar]
- 19.Vaidyanathan S, Kuppili PP, Menon V. Eating disorders: an overview of Indian research. Indian J Psychol Med. 2019;41:311–7. doi: 10.4103/IJPSYM.IJPSYM_461_18. [DOI] [PMC free article] [PubMed] [Google Scholar]
- 20.Sharan P, Sundar AS. Eating disorders in women. Indian J Psychiatry. 2015;57(Suppl 2):S286–95. doi: 10.4103/0019-5545.161493. [DOI] [PMC free article] [PubMed] [Google Scholar]
- 21.Kaur SP, Sharma S, Lata G, Manchanda S. Prevalence of anxiety, depression, and eating disorders in women with polycystic ovarian syndrome in North Indian population of Haryana. Galore Int J Health Sci Res. 2019;4:61–7. [Google Scholar]
- 22.Joseph M, Shyamasunder AH, Mammen P, Thomas N. Type 1 diabetes mellitus and eating disorders. Int J Diabetes Dev Ctries. 2017;37:502–6. [Google Scholar]
- 23.Thomas JJ, Lee S, Becker AE. Updates in the epidemiology of eating disorders in Asia and the Pacific. Curr Opin Psychiatry. 2016;29:354–62. doi: 10.1097/YCO.0000000000000288. [DOI] [PubMed] [Google Scholar]
- 24.Webb JB, Applegate KL, Grant JP. A comparative analysis of type 2 diabetes and binge eating disorder in a bariatric sample. Eat Behav. 2011;12:175–81. doi: 10.1016/j.eatbeh.2011.04.007. [DOI] [PubMed] [Google Scholar]
- 25.Crow S, Kendall D, Praus B, Thuras P. Binge eating and other psychopathology in patients with type II diabetes mellitus. Int J Eat Disord. 2001;30:222–6. doi: 10.1002/eat.1077. [DOI] [PubMed] [Google Scholar]
- 26.Abbott S, Dindol N, Tahrani AA, Piya MK. Binge eating disorder and night eating syndrome in adults with type 2 diabetes: a systematic review. J Eat Disord. 2018;6:36. doi: 10.1186/s40337-018-0223-1. [DOI] [PMC free article] [PubMed] [Google Scholar]
- 27.Makino M, Tsuboi K, Dennerstein L. Prevalence of eating disorders: a comparison of western and non-western countries. MedGenMed. 2004;6:49. [PMC free article] [PubMed] [Google Scholar]
- 28.Tong J, Miao S, Wang J, Yang F, Lai H, Zhang C, Zhang Y, Hsu LK. A two-stage epidemiologic study on prevalence of eating disorders in female university students in Wuhan, China. Soc Psychiatry Psychiatr Epidemiol. 2014;49:499–505. doi: 10.1007/s00127-013-0694-y. [DOI] [PubMed] [Google Scholar]
- 29.Choudry IY, Mumford DB. A pilot study of eating disorders in Mirpur (Pakistan) using an Urdu version of the eating attitudes test. Int J Eat Disord. 1992;11:243–51. [Google Scholar]


