

Abstract
Small angle neutron scattering (SANS) measurements are reported for DNA gels in near physiological conditions in which the concentration of monovalent and divalent counter-ions, as well as pH, are varied. The scattering intensity I(q) is described by a two term equation, one due to osmotic concentration fluctuations and the other coming from static inhomogeneities frozen in by the cross-links. SANS in the low q range indicates the presence of large clusters the size of which exceeds the resolution of the experiment. In the intermediate q-range the intensity increases with the CaCl2 concentration and the slope approaches −1, corresponding to linear (rod-like) scatterers. In the highest q region, the scattering response is governed by the local chain geometry. Screening of the electrostatic interactions by sodium chloride causes a moderate increase in the SANS intensity that is accompanied by an increase in the mesh size L of the network. Addition of calcium chloride, or a decrease in pH, produce similar trends, and ultimately leads to phase separation. The scattering intensity at q = 0, estimated from independent measurements of the osmotic pressure Π, is in excellent agreement with I(0) from the SANS measurements. Anomalous small angle X-ray scattering (ASAXS) measurements on uncross-linked DNA show that the monovalent ion cloud is only weakly influenced by the addition of divalent ions. Conversely, the divalent counter-ion cloud tightly follows the contour of the polymer chains.
Keywords: small angle neutron scattering, X-ray scattering, osmotic swelling pressure, DNA gel, ion distribution
Graphical Abstract
INTRODUCTION
Ion-biopolymer interactions play a key role in a variety of biological processes. The action of ions is complex: they stabilize the local structures, and ion binding can also affect the intrinsic properties of the polymer chain, such as flexibility, electrostatic interactions and the overall thermodynamics of the system. Several studies have been devoted to understanding the interactions that give rise to compaction of DNA in solution and allow this molecule to penetrate into cells.1–7 The majority of previous scattering investigations were designed to test the validity of different models describing the spatial charge distribution of the counterions, or the effect of the electrostatic interactions on the free energy or the persistence length.6–8 Less attention has been paid to the effect of ions on the osmotic concentration fluctuations and associated changes in the local organization of the molecule.
An important constraint in studying such systems is that multivalent counterions can cause precipitation in solution, even at low ion concentrations.9 The use of cross-linked networks extends the concentration range over which the system remains stable, since macroscopic phase separation does not occur in gels.
The aim of this paper is to investigate the effects of mono and divalent counterions and of pH on the characteristic length scales in DNA gels. The salt concentration is varied in near-physiological conditions. Small angle neutron scattering (SANS) is used to determine the characteristic length scale of the osmotic concentration fluctuations. The shape the monovalent and divalent counterion cloud along the DNA chain is investigated by anomalous small angle X-ray scattering (ASAXS).
The organization of this paper is as follows. After a brief outline of the scattering formalism and of the experimental procedures, we report SANS measurements from DNA gels swollen in NaCl solutions. The effects of pH and of CaCl2 are then discussed. The SANS response of the gels in analyzed by a two-term equation consisting of a thermodynamic and a static component. A comparison is made between direct measurements of the osmotic swelling pressure Π and the scattering intensity I(q=0) derived from SANS. In the final part of the paper, ASAXS measurements on DNA-Sr and DNA-Rb solutions are presented.
THEORETICAL CONSIDERATIONS
SANS in Polymer Gels
In a scattering experiment the intensity is determined by the pair correlation function of the concentration fluctuations. For a solution of flexible neutral polymer chains, the fluctuations are screened at distances defined by a correlation length ξ.12 The osmotic pressure Π associated with these fluctuations in the sample is of the order of the energy density kT/ξ3, where k is Boltzmann’s constant and T is the absolute temperature. In the case where electrostatic forces are present, as in a polyelectrolyte solution, the correlation length of the osmotic fluctuations is modified by the counter-ions. They affect the net charge and the electrostatic interactions of the polymer chains, and above a certain threshold concentration ion condensation occurs.13 In polymers consisting of semi-rigid sequences, such as DNA and other biopolymers, the electrostatic forces may modify both intra- and interchain correlations, thereby affecting the stiffness of the polymer and the interactions responsible for chain clustering and phase separation.14.15
Several expressions have been proposed in the literature16–18 to describe scattering from worm-like chains consisting of a sequence of rigid segments. The length L of the sequence that is observable in the concentration fluctuations is a mesh size that corresponds to the thermodynamic correlation length. This gives rise to a scattering intensity that, for qL > 1, varies as q−1, where q is the scattering vector (4π/λ)sin(θ/2), λ being the wavelength of the incident neutrons and θ the scattering angle. The scattering intensity from the thermodynamically driven concentration fluctuations may then be expressed in the form19
| (1) |
where f(q) describes the cross-section of the molecule. At qR<1, where R is the cross-sectional radius of the polymer chain, f(q) can be approximated by
| (2) |
Thus, we have
| (3) |
In systems containing large scale inhomogeneities, such as bundles or branched structures, these structures also contribute to the scattering response in the low q region. In gels static concentration fluctuations generated by the cross-links are also generally present. In DNA specifically, a variety of other superstructures, such as liquid crystalline regions, have been observed. It is found that the total scattering intensity from such heterogeneous systems is described by a sum of a thermodynamic and a static component20–27
| (4) |
In polyelectrolyte solutions and gels Istat(q) generally arises from scattering from the surfaces of large clusters and can be represented by a power law expression of the form Bq−n, which yields for the total scattering function the expression
| (5) |
where n= 4 if the surfaces of the large heterogeneities are smooth (Porod scattering).28 For rough surfaces29, however, the exponent of the scattering behavior may approach −3. This phenomenon has been observed in a wide variety of polymer solutions and in both neutral and polyelectrolyte gels.18,27,30,31
ASAXS
ASAXS is a means of determining the counterion disribution in polyelectrolyte solutions using a tunable X-ray source to vary the contrast of a given counterion in the neighborhood of its atomic absorption threshold.32,33
The scattering function of a polymer solution may be defined by the differences in electron density (ρj(E)-ρs) between the solvent and the other components (polymer, resonant ion) of the solution. Thus
| (6) |
where r0 (2.818×10⁻¹³ cm) is the nominal radius of the electron, E is the energy of the incident X-ray beam and Spp(q), Sxx(q) and Sxp(q) are the partial structure factors of the polymer, the counterions and their cross term, respectively. In the vicinity of the absorption edge, ρx is energy-dependent. As the energy E of the incident photons approaches the absorption threshold, the electron density ρx(E) of the counter-ion decreases, while that of the polymer and of the solvent remain constant.
The difference between the scattering intensity I(q) from a sample at two different energies E1 and E2 is therefore given by
| (7) |
where E1 and E2 are respectively the reference energy measured far below the absorption edge and that just below the edge, where the anomalous effects are strongest.34,35 The values of ρx(E) for each element are tabulated. By measuring ΔI(q,E1,E2) at a series of different energies Ej, the partial structure factors Sxp(q) and Sxx(q) can then be deduced from eq 7.
EXPERIMENTAL METHODS
Gel Preparation
DNA gels were prepared36 from a sodium salt of DNA (Sigma, salmon testes, Mw=1.3 106) in 40 mM NaCl solution at a concentration of 3% w/w. The G-C content of this DNA is 41.2%. DNA was cross-linked with ethylene glycol diglycidyl ether (Fluka) at pH = 9.0 using TEMED to adjust the pH. The cross-linking reaction was carried out in NaCl solutions containing different amounts of CaCl2 (0 – 0.2 M). The gels were equilibrated with a bath containing from 0 to 0.2 mM CaCl2 in 40 mM NaCl. At higher CaCl2 concentrations a volume transition occurs in this system, where solvent is expelled from the network.36 SANS and osmotic pressure measurements were made below this threshold CaCl2 concentration. The pH of the gels was adjusted by addition of HCl and by measuring the value with a pH meter, taking into account the shift of 0.4 in the pH in deuterated water37.
DNA solutions for the ASAXS experiment were prepared from the same DNA as the gels without either cross-linking agent or TEMED. These solutions were studied in 0.1 M of either NaCl or RbCl and containing from 0 to 0.11 M of either CaCl2 or SrCl2. We note here that, since the solutions are not in equilibrium with an infinite bath, the phase transition condition is different from that of the gel.
Small Angle Neutron Scattering Measurements
SANS measurements were performed at NIST, Gaithersburg MD, on the NG3 instrument. The sample temperature was maintained at 25.0°±0.1°C. Gel samples were prepared in solutions of D2O in 2 mm thick sample cells. Measurements were made at two sample-detector distances, 2.5 m and 13.1 m, with incident wavelength 8Å. After azimuthal averaging, corrections for incoherent background, detector response and cell window scattering were applied. The intensity normalization was made with the NIST standard samples.38
Osmotic Pressure Measurements
Gels were equilibrated with poly(vinyl pyrrolidone) solutions (molecular weight: 29 kDa) of known osmotic pressure,39,40 using a semi-permeable membrane to prevent the polymer penetrating into the network. When equilibrium was reached, the concentration of both phases was measured. This procedure gives the dependence of the swelling pressure ω = Π -G upon the polymer volume fraction, φ, for each gel. Here, Π is the osmotic pressure and G is elastic modulus of the gel. Over the concentration range explored in these measurements the value of G of the gels (< 1 kPa) was small. All measurements were carried out at 25.0 ± 0.1°C.
ASAXS Measurements
The ASAXS measurements were performed on the BM2 beam line at the European Synchrotron Radiation Facility (ESRF), in the transfer wave vector range 0.008 Å-1 ≤ q ≤ 1.0 Å-1, using a 2D CCD detector. Corrections were made for dark counts and camera distortion. The intensities were normalized using a standard sample of known scattering cross-section. To minimize the effects of radiation damage, measurements were made on solutions of DNA, and the sample position was varied at each change of incident energy.
To operate in an experimentally convenient energy range, in the ASAXS experiment the monovalent sodium and divalent calcium ions were replaced by rubidium and strontium, respectively, because the absorption edge of the latter ions lies in the energy range conveniently accessible for synchrotron measurements. The SAXS measurements were made at six energies below the rubidium absorption edge (15.1997 keV): 14.900, 15.08, 15.15, 15.18, 15.193 and 15.197 keV and at six energies below the strontium absorption edge (16.1046 keV) : 15.800, 15.984, 16.056, 16.085, 16.097 and 16.102 keV.
RESULTS AND DISCUSSION
Small angle scattering measurements provide a means of quantifying structural features in DNA gels in the length scale range 10 Å – 1000 Å that arise from changes in the environment such as ion concentration, pH and ion valence. In what follows we describe systematic SANS measurements preformed on three sets of DNA gels in equilibrium with solutions of
a monovalent salt (sodium chloride) over a wide range of concentration,
0.04 M NaCl at different values of pH, and
0.04 M NaCl at different concentrations of a divalent salt (calcium chloride).
For the last set, a comparison is made between the scattering intensity arising from the thermodynamic concentration fluctuations and direct measurements of the osmotic swelling pressure.
SANS
The SANS response of a 3% w/w DNA gel in different NaCl solutions is shown in Figure 1. As the salt concentration increases, the shape of the curves gradually varies and the data converge at high q. Strong scattering at low q values indicates the presence of large clusters, which are a common feature both in polyelectrolyte solutions and in gels, and which have been discussed in the polyelectrolyte literature.41,42 In the intermediate q range (0.01 ≤ q ≤ 0.05 Å−1), the intensity increases with the NaCl concentration, corresponding to an increase in the osmotic fluctuations, i.e., an increase in Idyn(0). In the absence of salt a correlation peak in the neutron scattering response is visible at q ≈ 0.06 Å−1. This feature, which is typical of salt-free solutions of polyelectrolytes, reflects the correlation between polymer chains due to their strong electrostatic repulsion. In the present case, the mean distance of separation between the chains is approximately 2π/q ≈ 100 Å. Assuming hexagonal packing of the DNA strands43,44, this separation corresponds to a concentration of about 2.7% w/w, which is comparable to the nominal concentration (3% w/w). With increasing salt concentration the peak progressively disappears.
Figure 1.
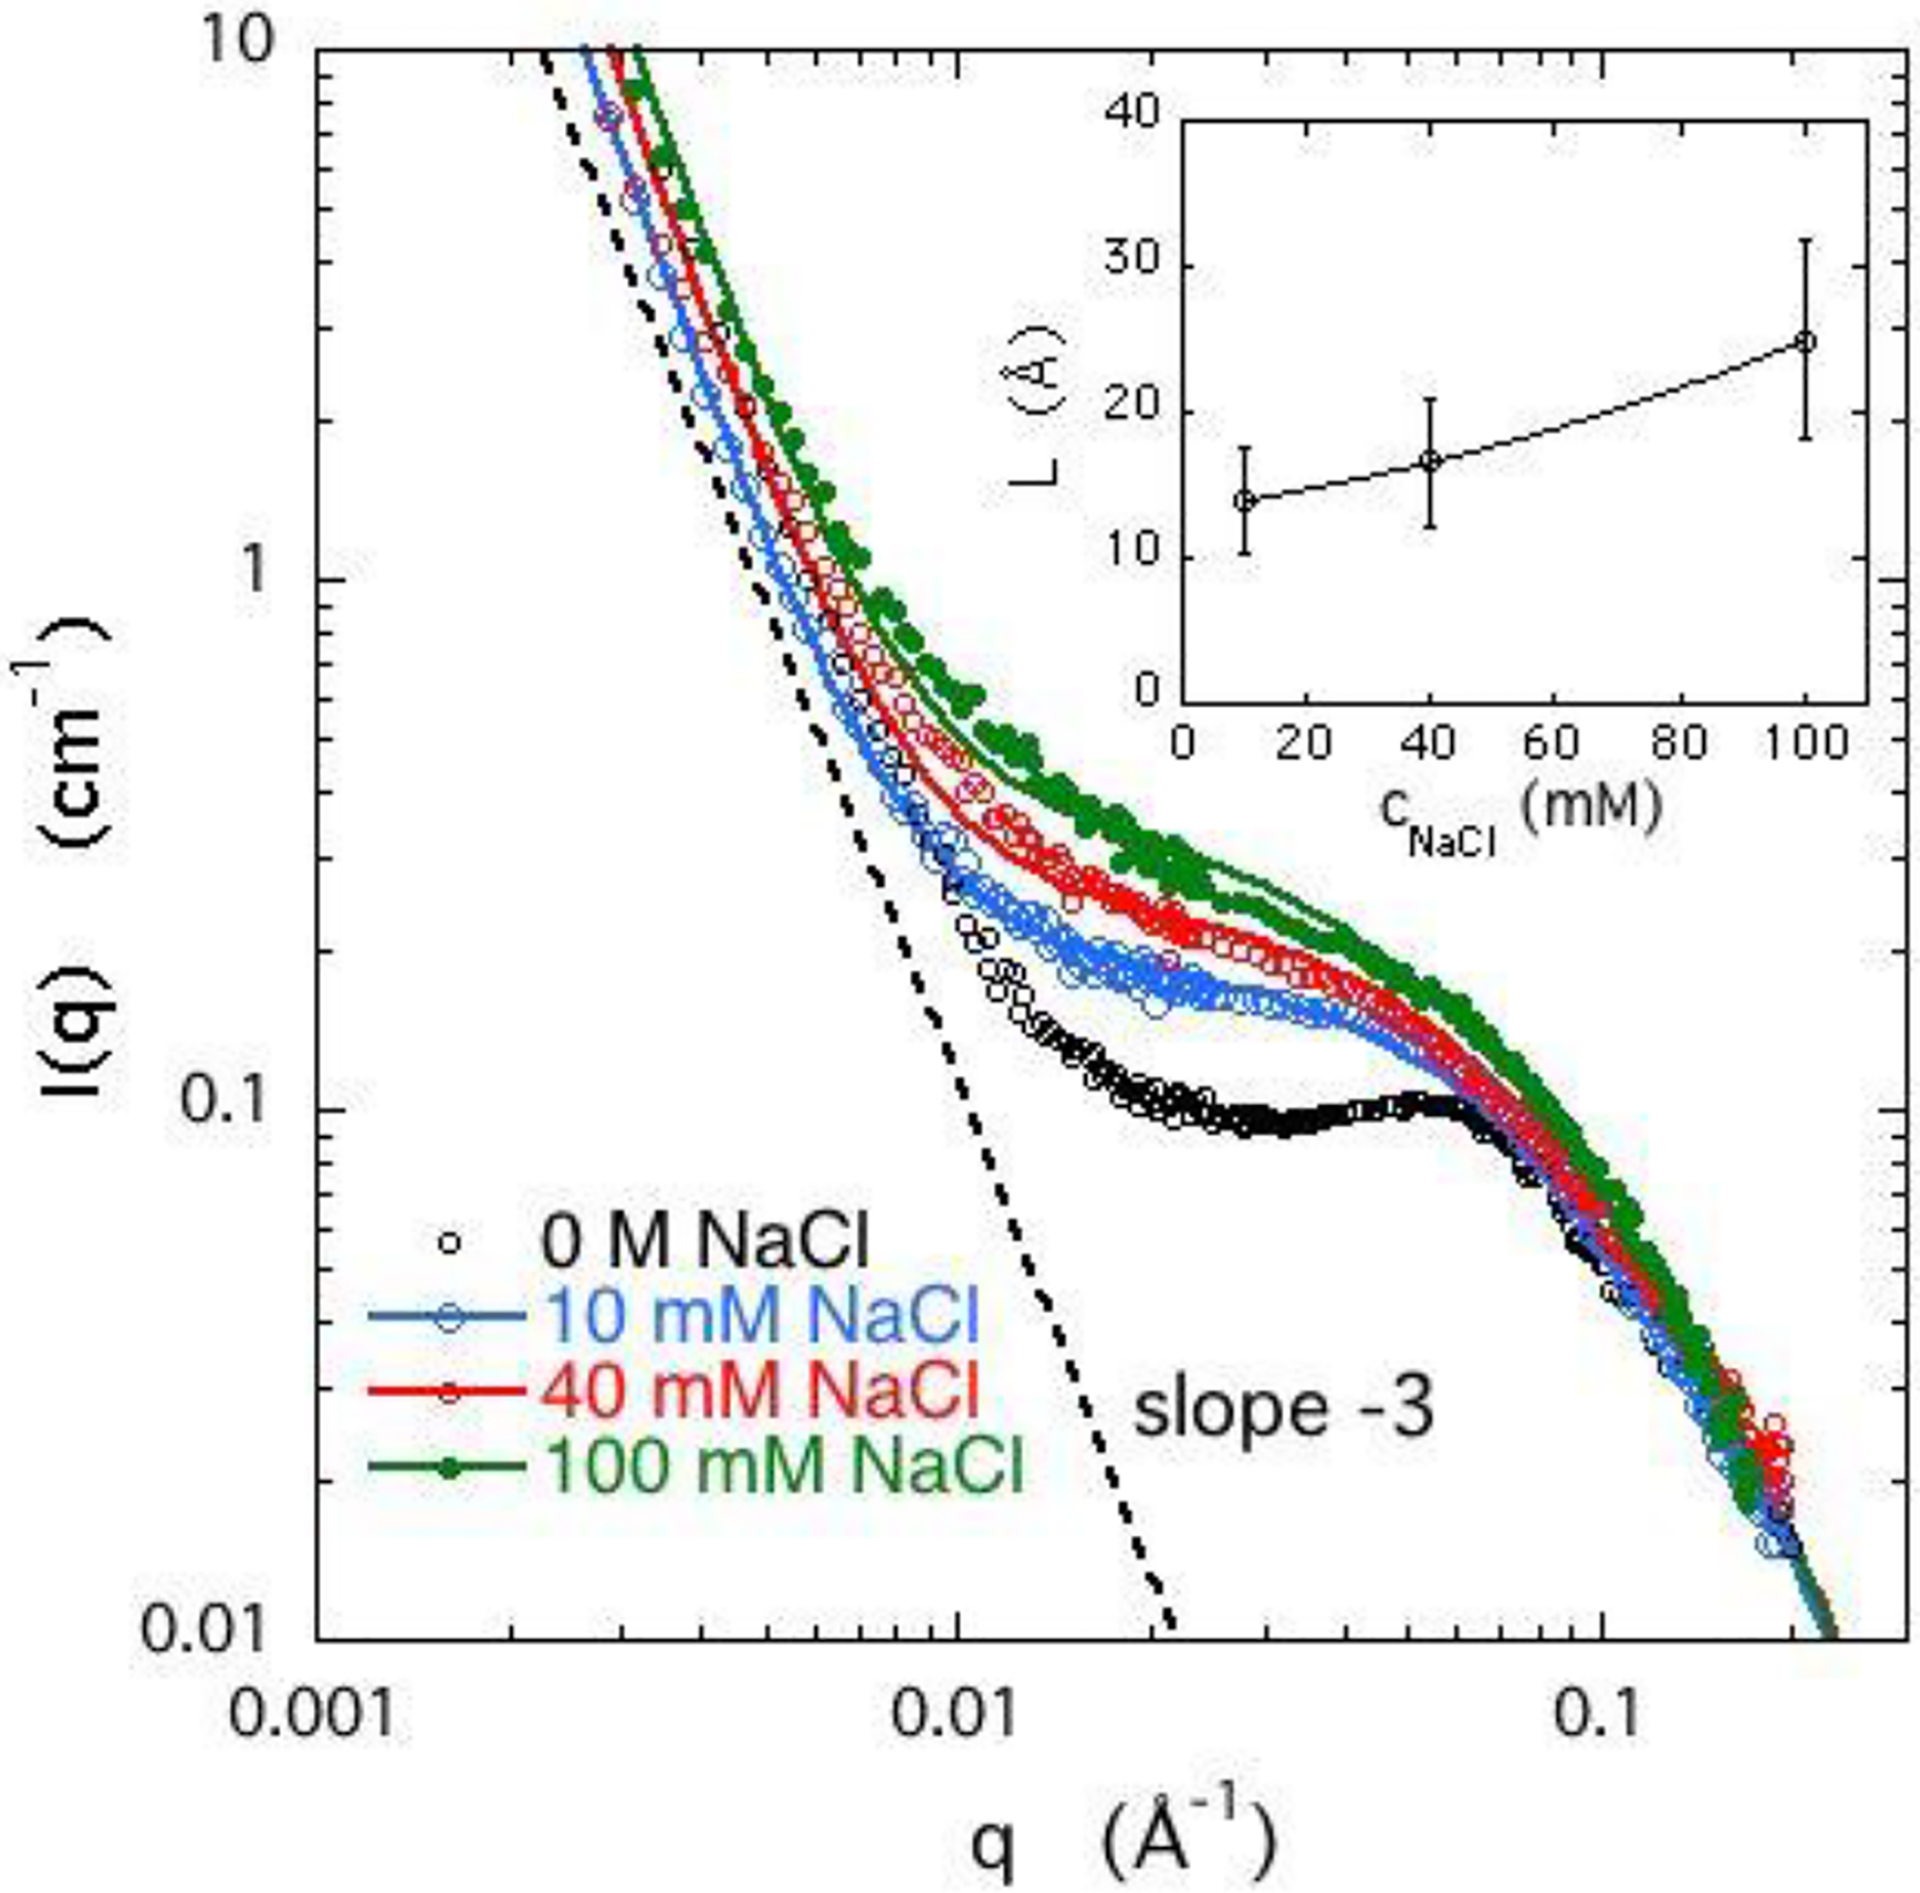
SANS response of 3% w/w DNA gels containing varying amounts of NaCl. Continuous curves are the fits of eq. 5. Inset: dependence of L on concentration of NaCl.
For the NaCl containing samples, equation 5 provides a reasonable fit to the SANS responses in Figure 1 over the observed q range (continuous curves). The power law slope of the low q range is slightly greater than −3, indicative of surface scattering from large clusters.29 The sodium chloride concentration increases not only the scattering intensity but also the correlation length L. As the NaCl concentration increases from 10 mM to 100 mM, L increases by a factor of roughly 2 (Figure 1 inset).
Figure 2 shows the effect of pH on the SANS response of a DNA gel swollen in D2O containing 40 mM NaCl. The behavior is qualitatively similar to that in Figure 1. In the pH range 5 – 7, the scattering response is affected only very weakly, while at low pH the hydrogen ions replace the sodium counterions and reduce the degree of ionization. At pH < 1 the gels exhibit phase separation and collapse. Note that at very low values of pH chemical modifications, such as denaturation, are expected. Over the period of the SANS experiments (2–3 hours), however, no structural changes were detected.
Figure 2.
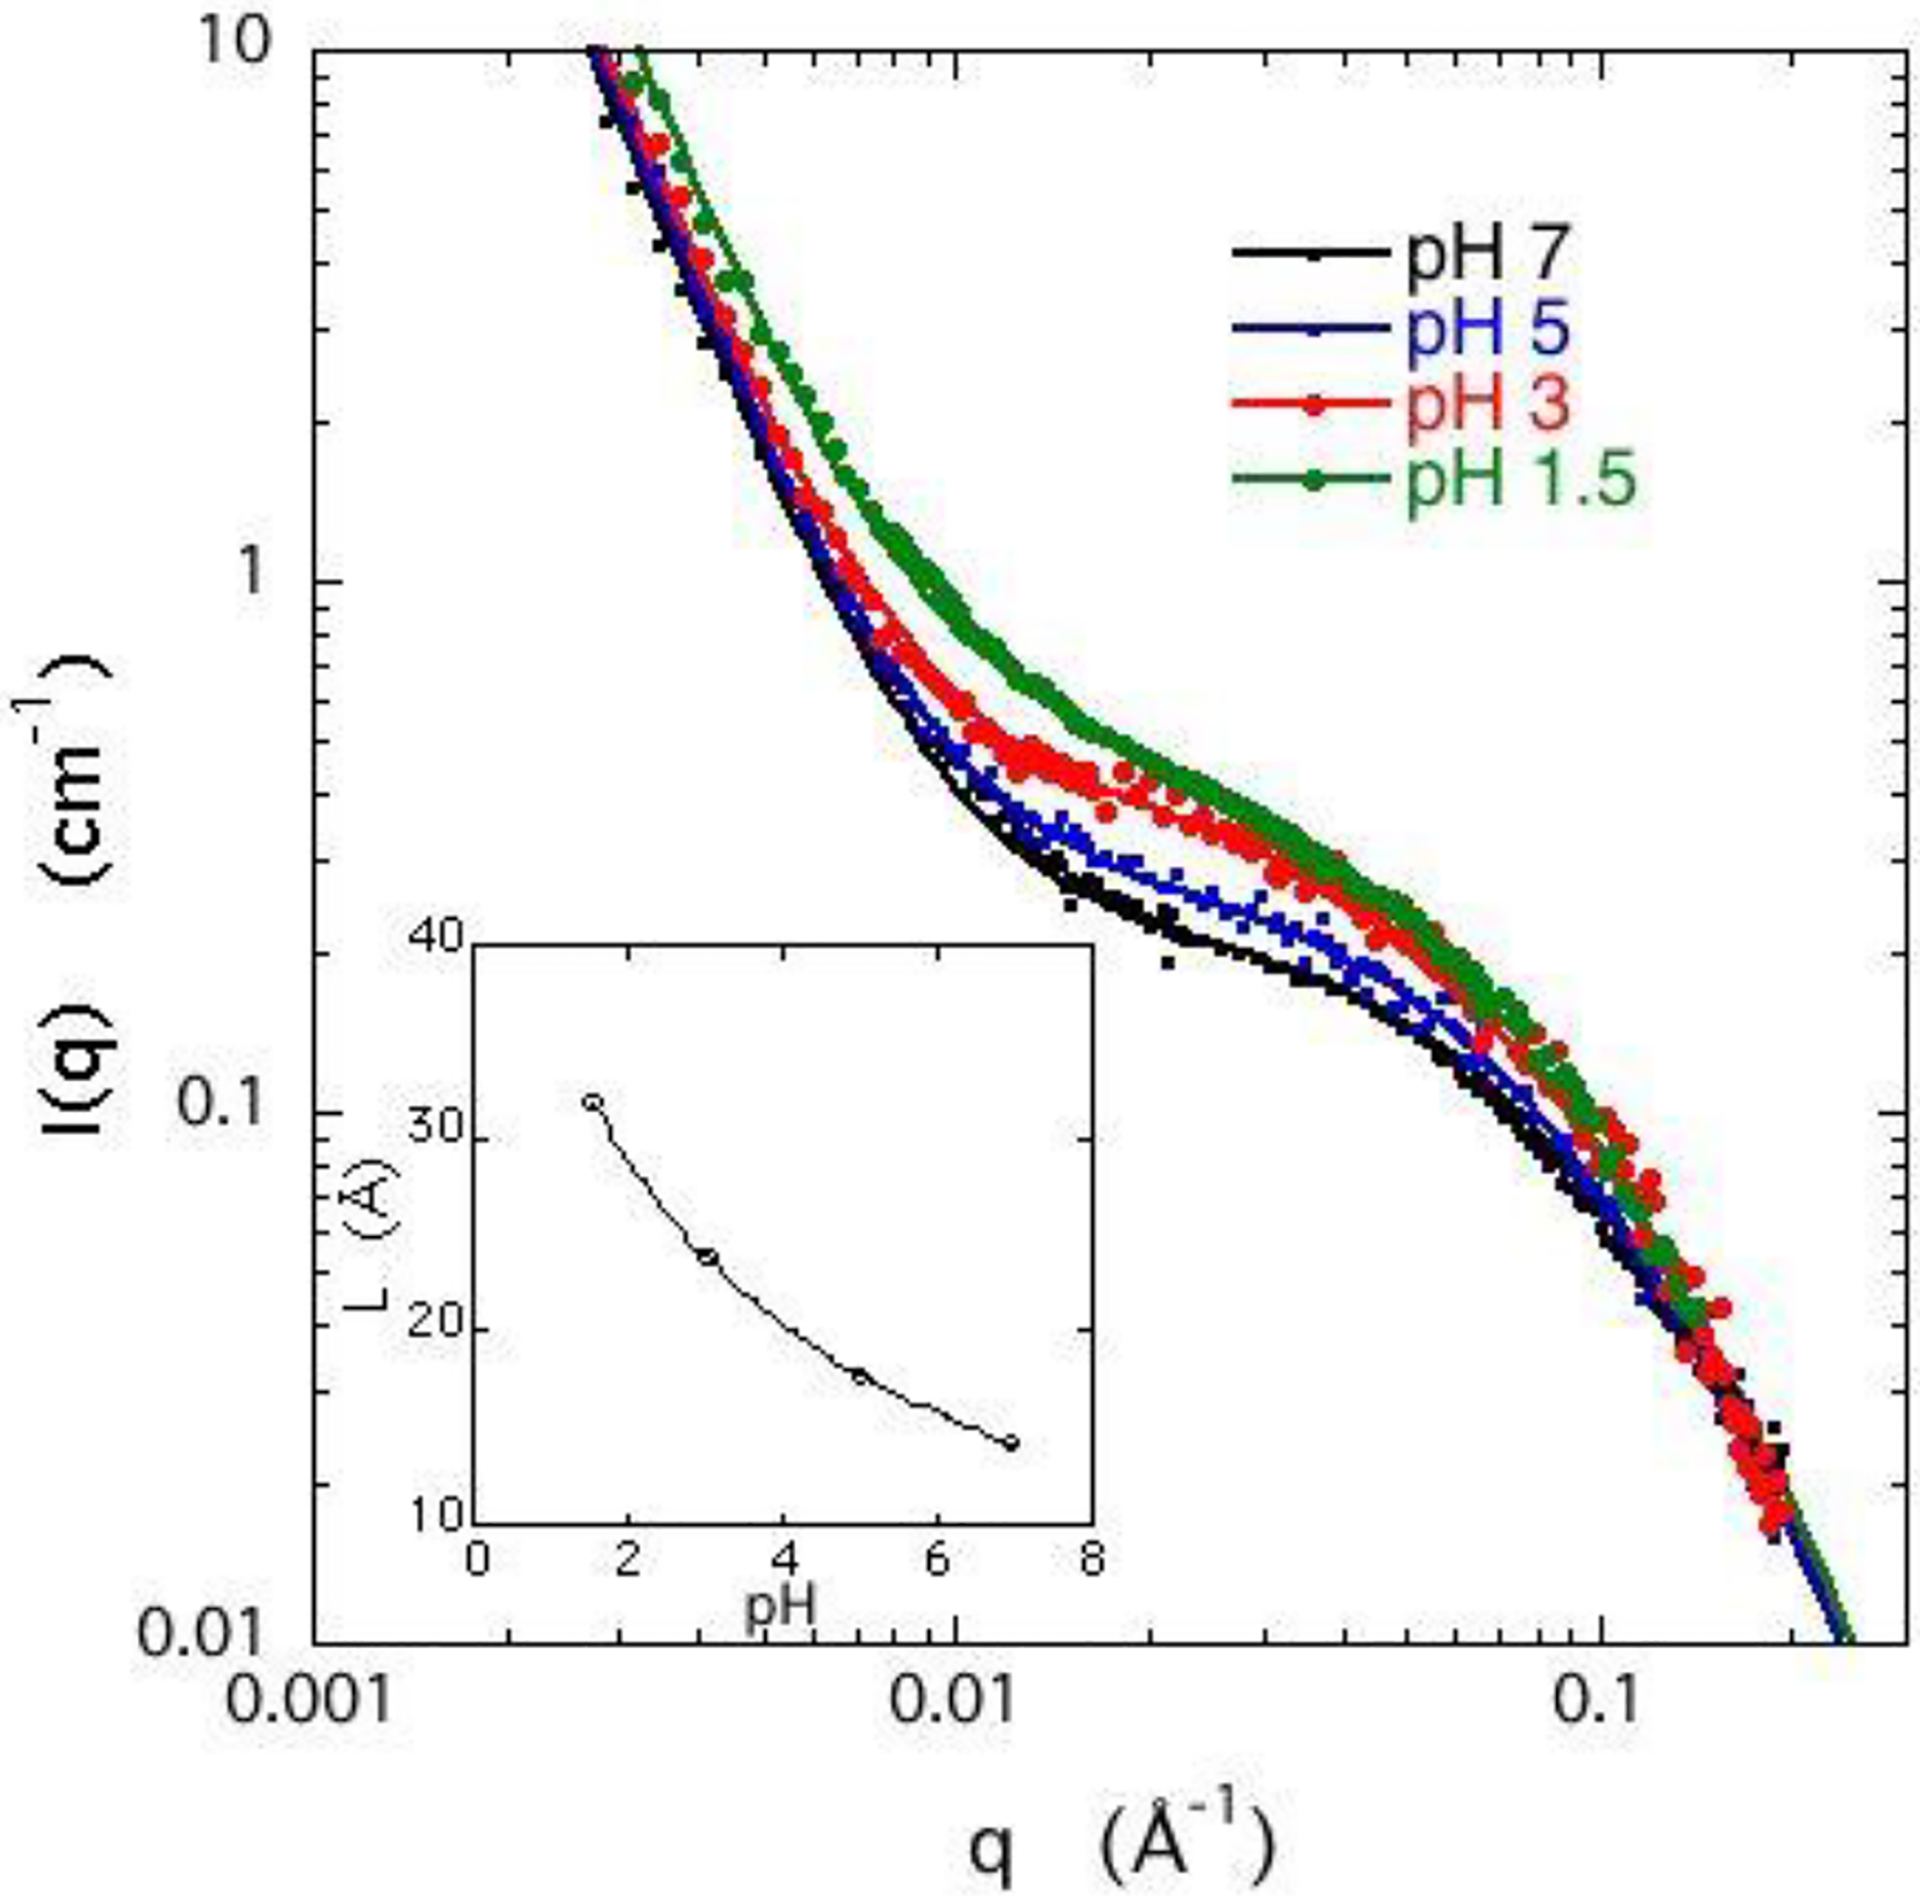
SANS response for 3% w/w DNA gels containing 40 mM NaCl at different values of pH. Continuous curves are the fits of eq 5. Inset: Dependence of correlation length L on pH.
The similarity in the shape and the trend of the scattering curves in Figures 1 and 2 is remarkable. In both cases, the structural changes stem from charge compensation, but the underlying mechanism is not the same. Increasing the sodium chloride concentration reduces the electrostatic screening length and hence the repulsion between the anionic groups on the backbone of the polymer. Decreasing the pH, by contrast, results in protonation of the DNA. At pH = 1 the hydrogen ion concentration (0.1 M) slightly exceeds the molar concentration of DNA (about 0.075 M). This effect is much stronger than the purely electrostatic screening, with the result that phase separation occurs below pH = 1. In the presence of monovalent salts such as sodium chloride, by contrast, DNA solutions remain stable up to cNaCl ≈ 1 M. The increase in scattering intensity with increasing salt concentration, however, is characteristic of polyelectrolyte solutions and gels that approach the phase boundary for phase separation. In phase separating systems the amplitude of the concentration fluctuations increases, with an increase in the correlation length L as more extended regions of the polymer chains become exposed.
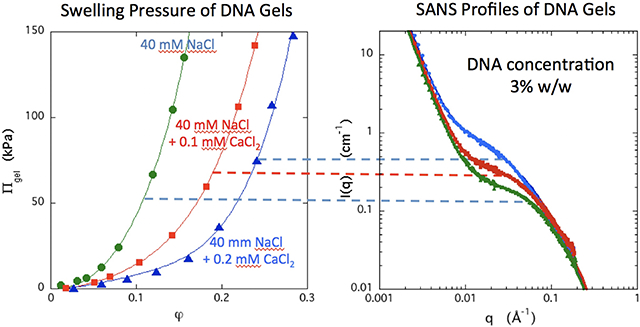
Figure 3 shows the scattering spectra for DNA gels containing 0.04 M NaCl and different concentrations of calcium chloride. In this system the range of CaCl2 concentration is limited because at cCaCl2 ≈ 0.27 mM a volume phase transition occurs.34 Compared with the situation in Figure 1, only a small amount of calcium chloride is needed to generate an increase in the intensity in the intermediate q range equivalent to that of 100 mM NaCl. Moreover, the inset of Figure 3 shows that CaCl2 causes L to vary much more strongly than does NaCl. An increase of only 0.1 mM CaCl2 in the surrounding bath raises L to a value comparable to that with 100 mM NaCl, i.e., a thousandfold greater sensitivity. This major difference in behaviour between NaCl and CaCl2 is a symptom of the basic difference in the way that mono or divalent cations contribute to the counterion cloud surrounding the polyelectrolyte chains in the gel. The counterions affect both the structure of the network at different length scales and the thermodynamic properties of the system. The resulting changes are measurable at the macroscopic length scale by osmotic measurements and, at higher resolution, by scattering methods that are sensitive to the ionic distribution.
Figure 3.
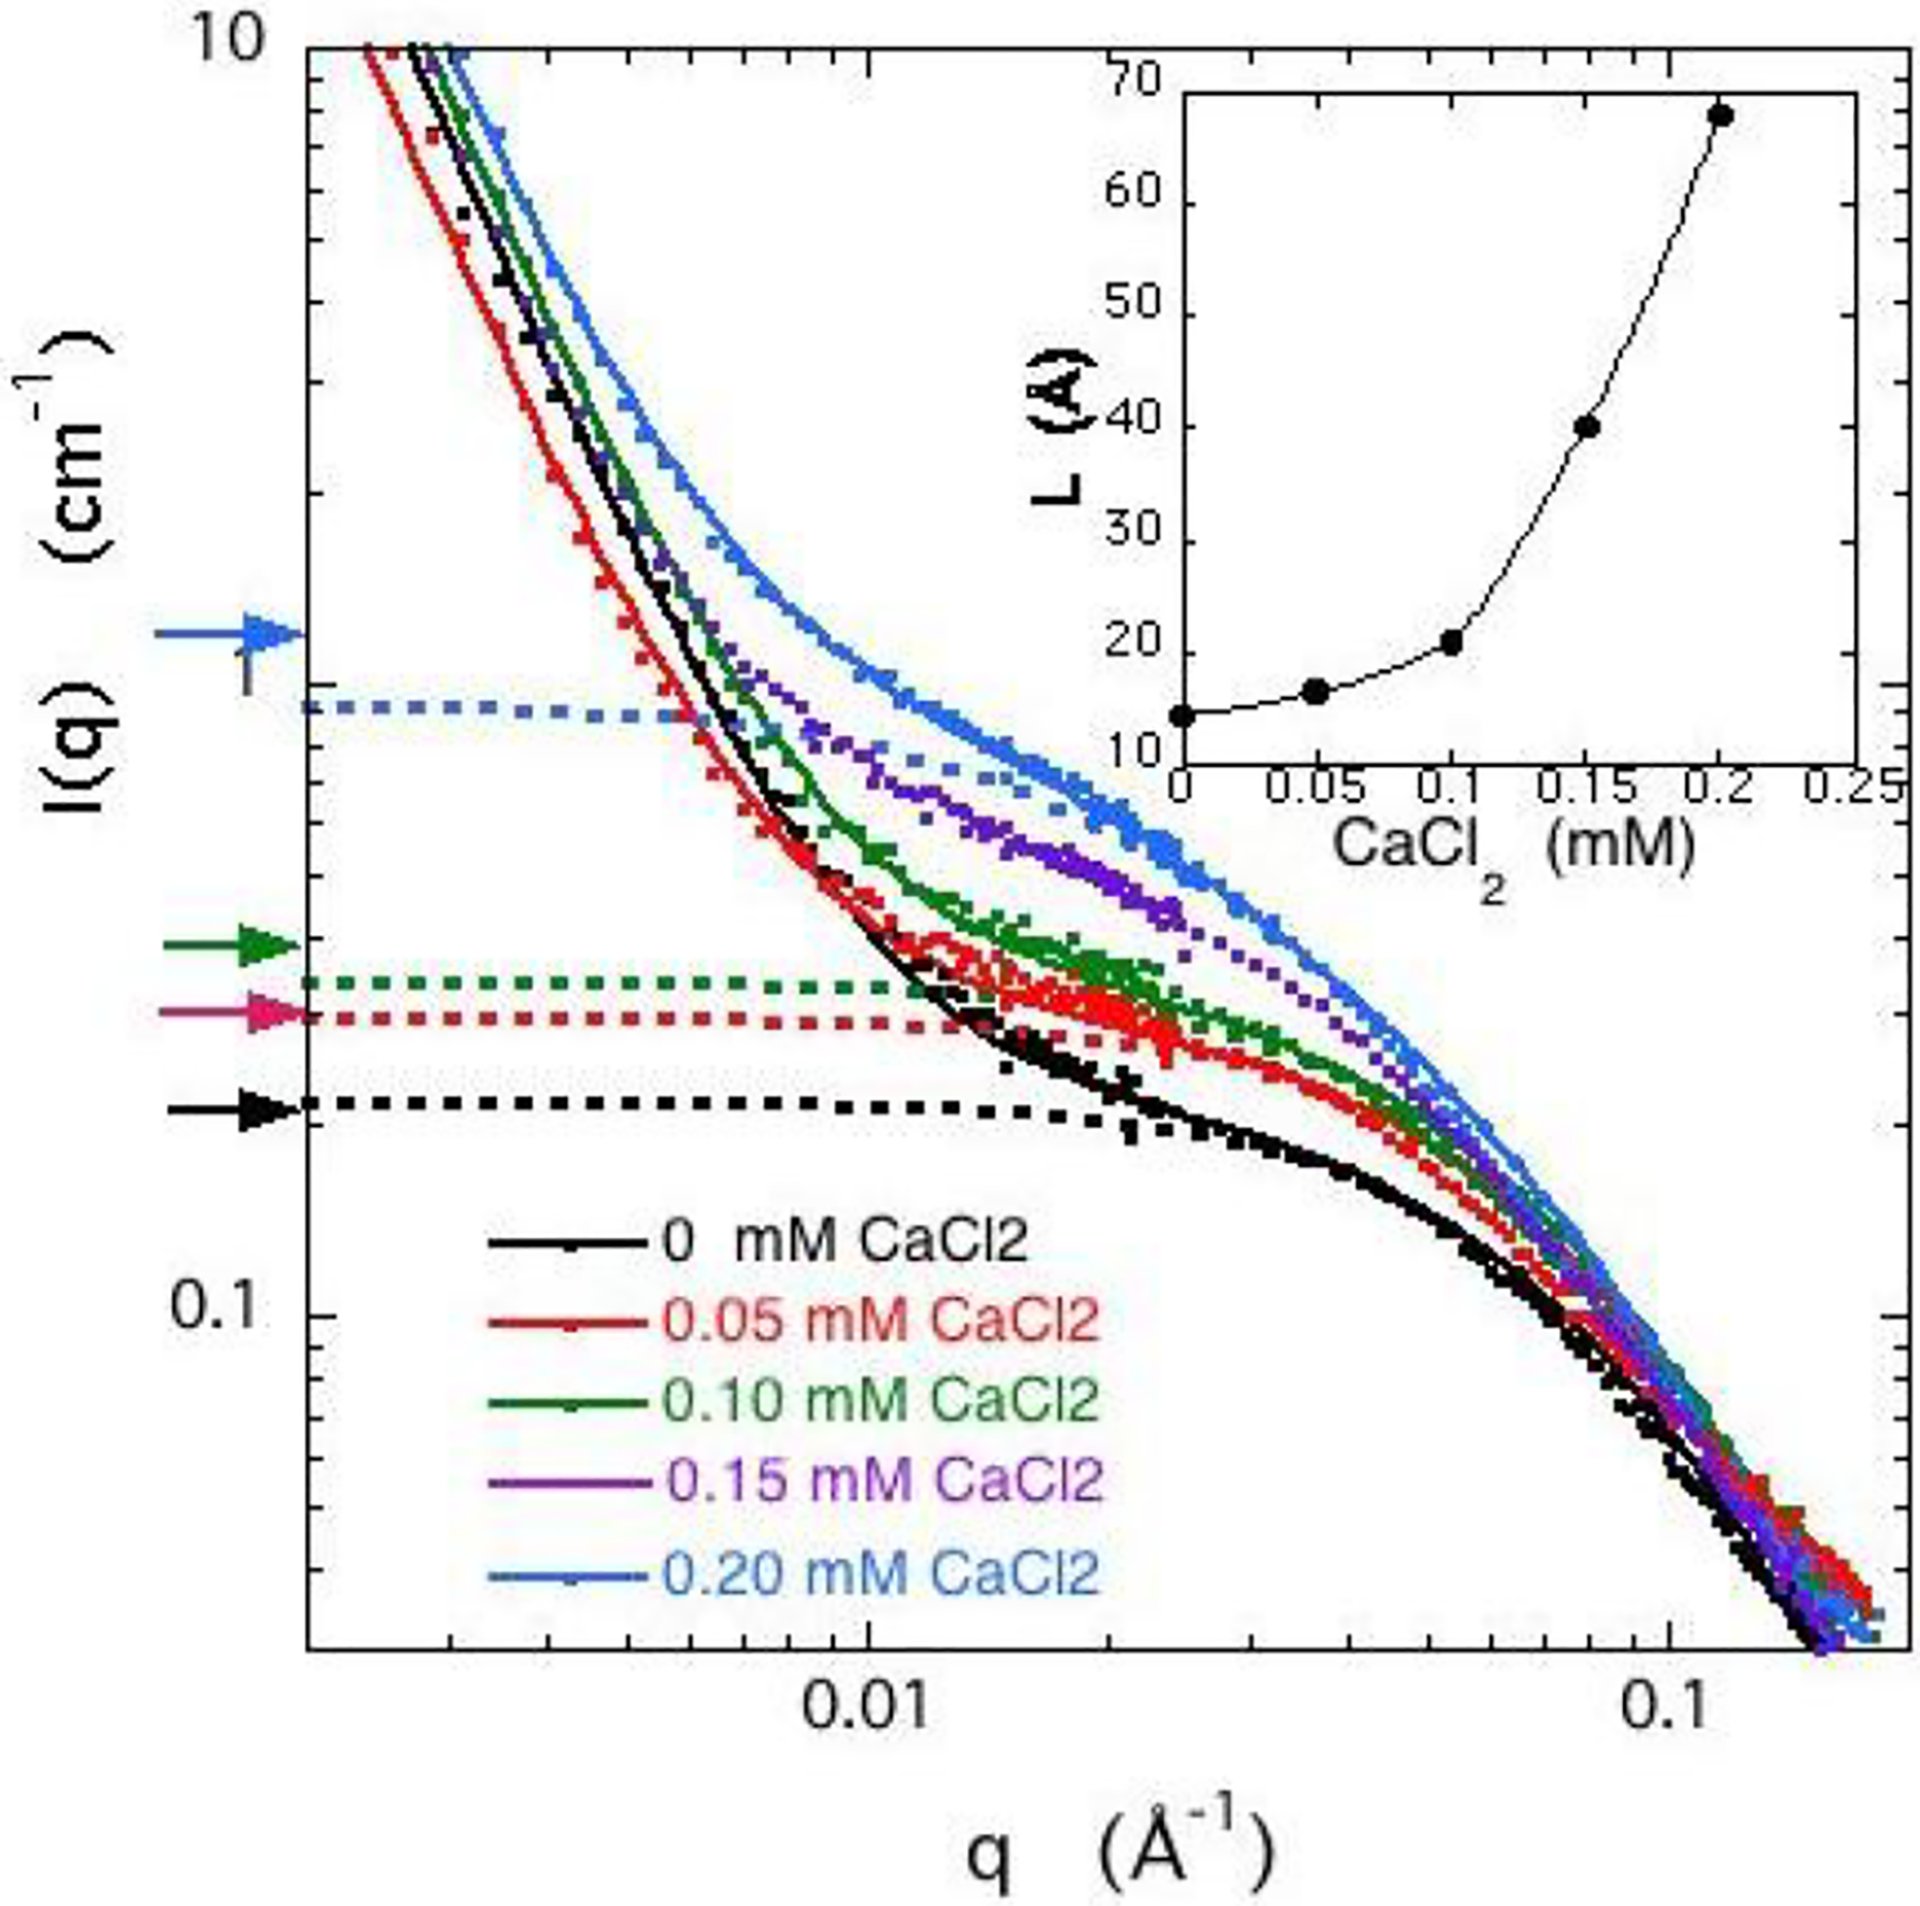
SANS response for 3% w/w DNA gels, swollen in 40 mM NaCl solutions containing different amounts of CaCl2. Continuous curves: eq 5; dotted lines: first term of eq 5. Arrows on left axis: estimates of Idyn(0) from osmotic pressure measurements using eqs. 8 and 10. Inset: Variation of mesh size L with CaCl2 concentration.
Comparison of Osmotic Pressure Measurements with SANS
The thermodynamic contribution to the SANS scattering signal can be estimated from Eq. 5, in which the first term is governed by the osmotic modulus κ (= φ∂Π/∂φ, where φ= c/dp is the polymer volume fraction and dp is the density of the dry polymer). The dependence of the osmotic pressure Π on the CaCl2 concentration contains the information about the interactions that govern the thermodynamic properties at the macroscopic level.
According to thermodynamic considerations, the intensity scattered by osmotic concentration fluctuations Idyn(0) is inversely related to κ through
| (8) |
Here, Δρ2 = 7.31 1020 cm−4 is the neutron scattering contrast factor between DNA and D2O.45 The increase in intensity in Figure 3 thus reflects a decrease in the osmotic modulus κ .
Figure 4 shows the variation of osmotic pressure Πgel of a cross-linked DNA gel determined as a function of polymer volume fraction φ. For each data set the sample was equilibrated with a solution of ionic concentration. Changes in the NaCl concentration alone in the range 10 – 100 mM reduce Πgel only weakly, which is consistent with the SANS response shown in Figure 1. In contrast to NaCl, however, CaCl2 strongly reduces the osmotic pressure of the DNA gel. Addition of 0.20 mM CaCl2 reduces Πgel by an order of magnitude. This reduction implies that calcium ions screen the electrostatic repulsion between the DNA strands. The ensuing association among the polymer chains increases the mesh size as the phase transition is approached (Figure 3 inset). It is important to emphasize that the osmotic and the scattering observations both indicate that the changes induced by these ions are fully reversible. The situation is illustrated by Scheme 1.
Figure 4.
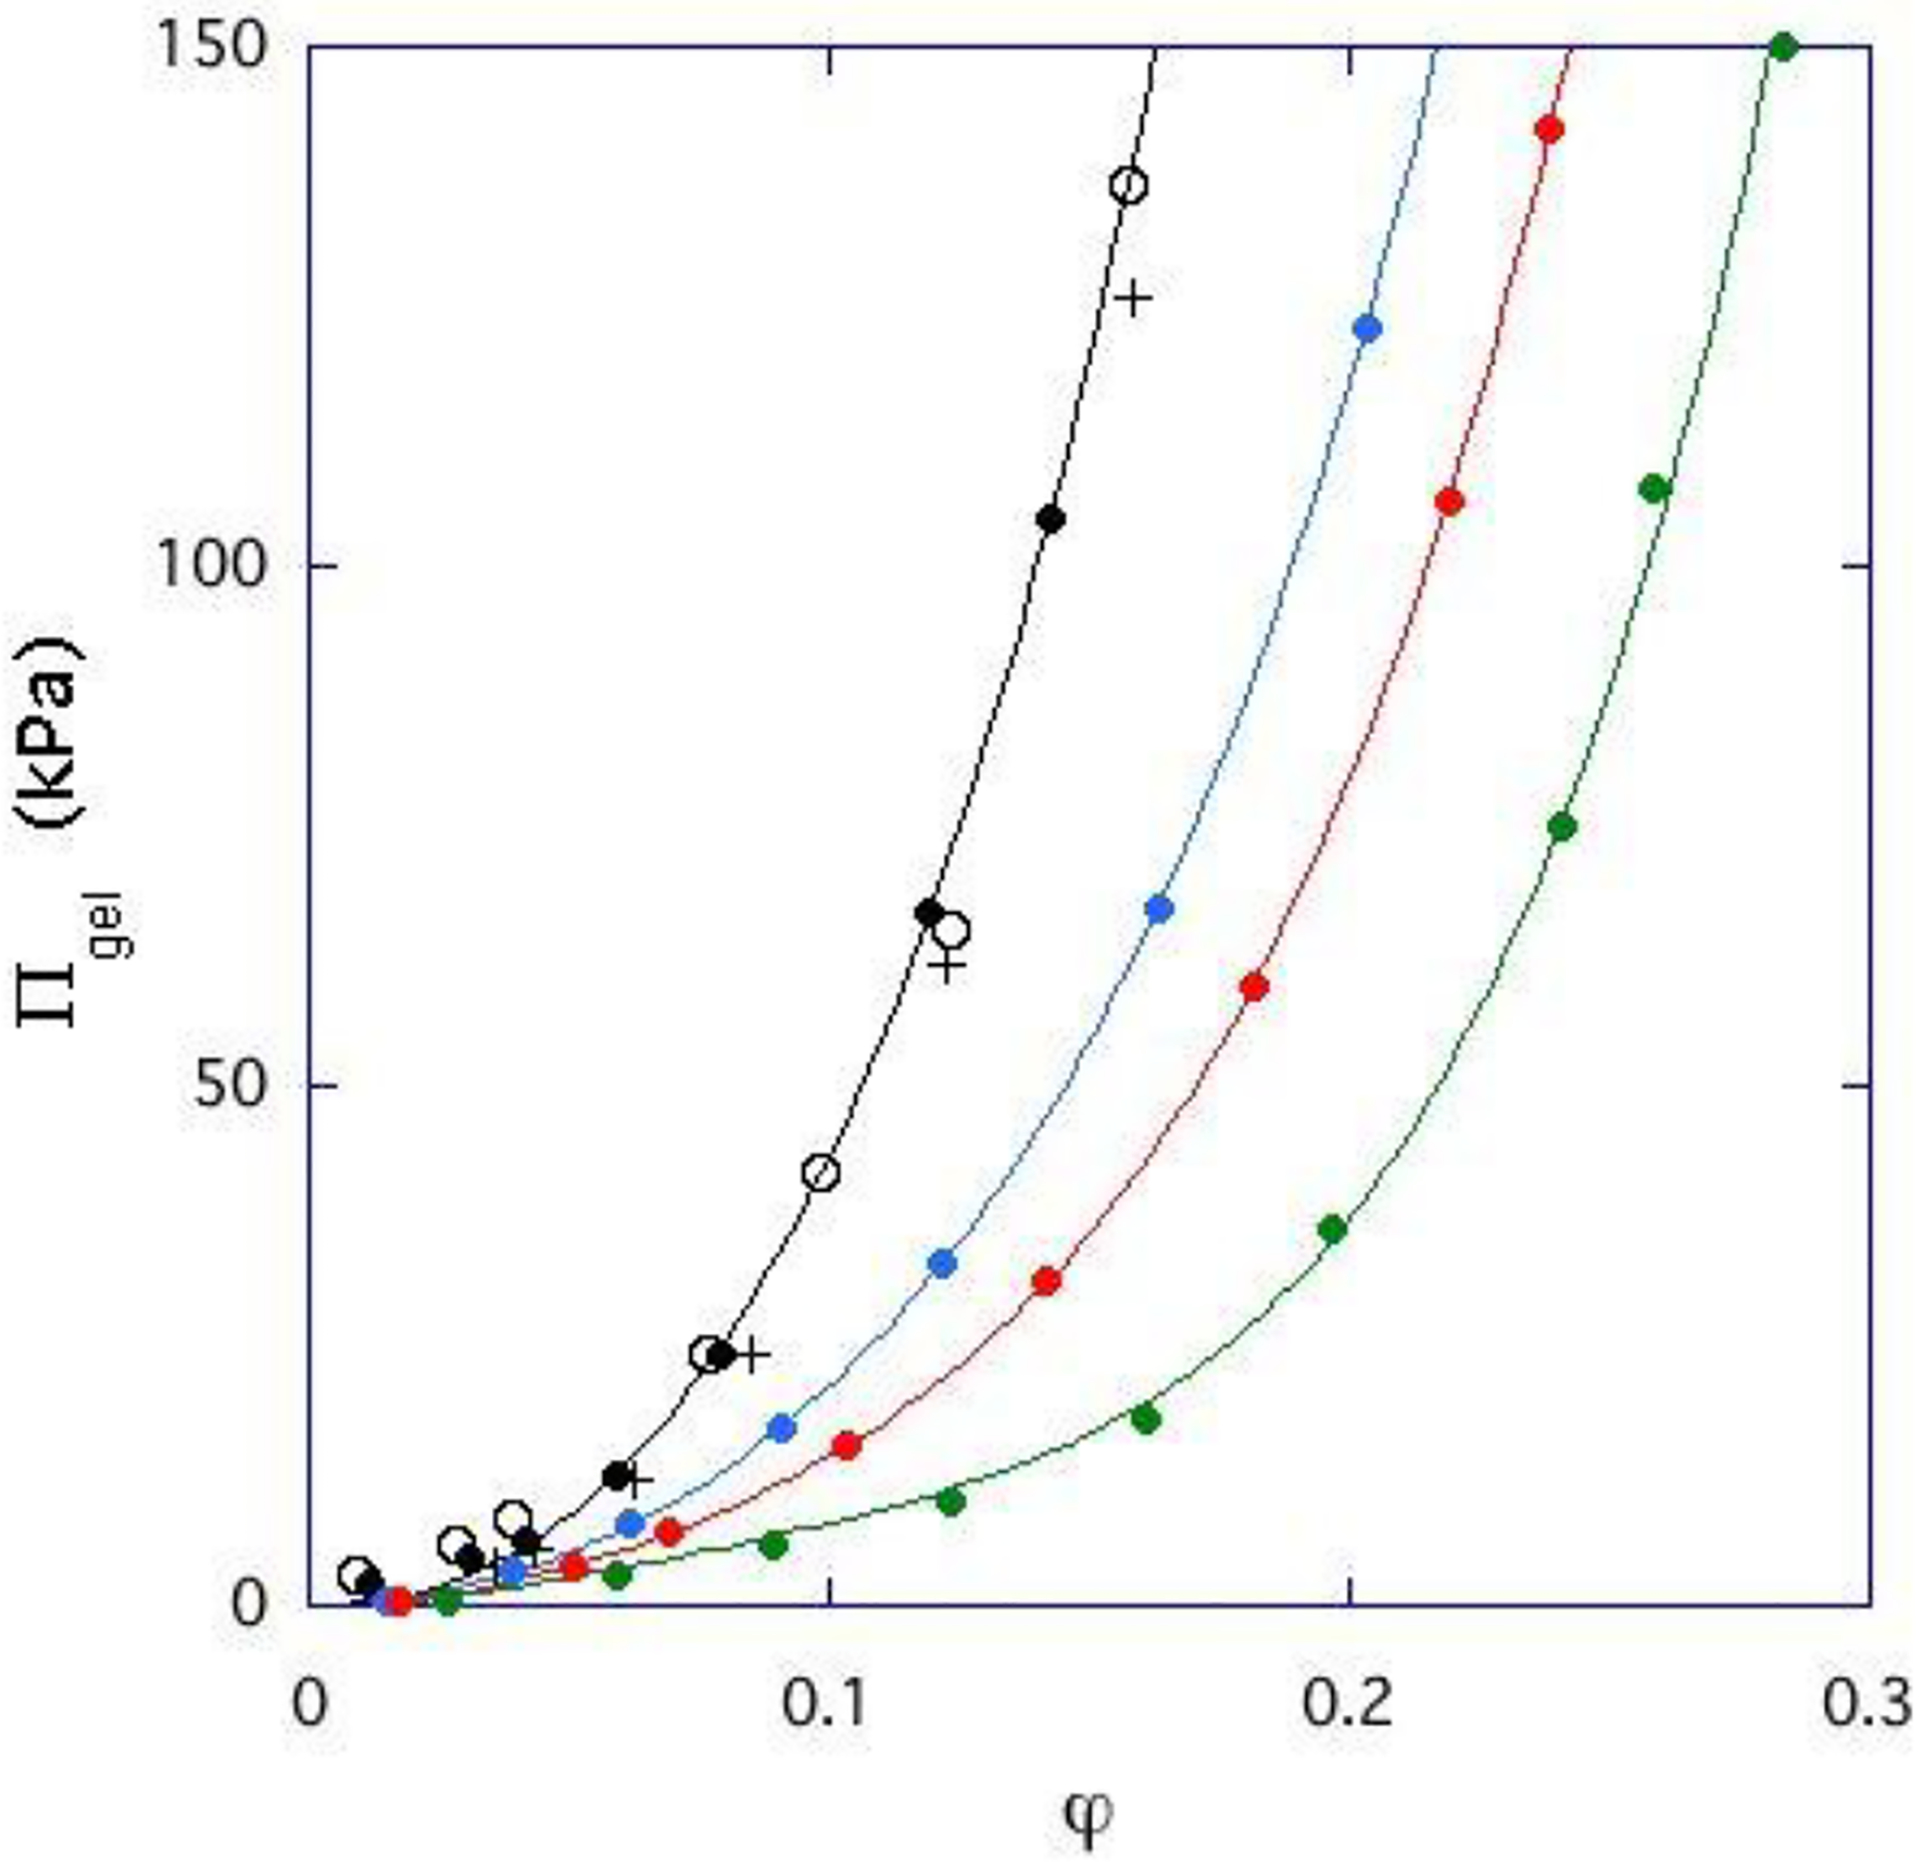
Dependence of the osmotic pressure of a DNA gel (cross-linked at 3% w/w) in equilibrium with salt solutions as a function of polymer volume fraction. For each curve, the ionic composition of the salt solution is constant. (○):10 mM NaCl ; (●): 40 mM NaCl; (+): 100 mM NaCl; (● ): 0 mM NaCl + 0.05 mM CaCl2; (●): 40 mM NaCl + 0.10 mM CaCl2; (●): 40 mM NaCl + 0.20 mM CaCl2. Continuous lines are fits to eq 9.
Scheme 1.
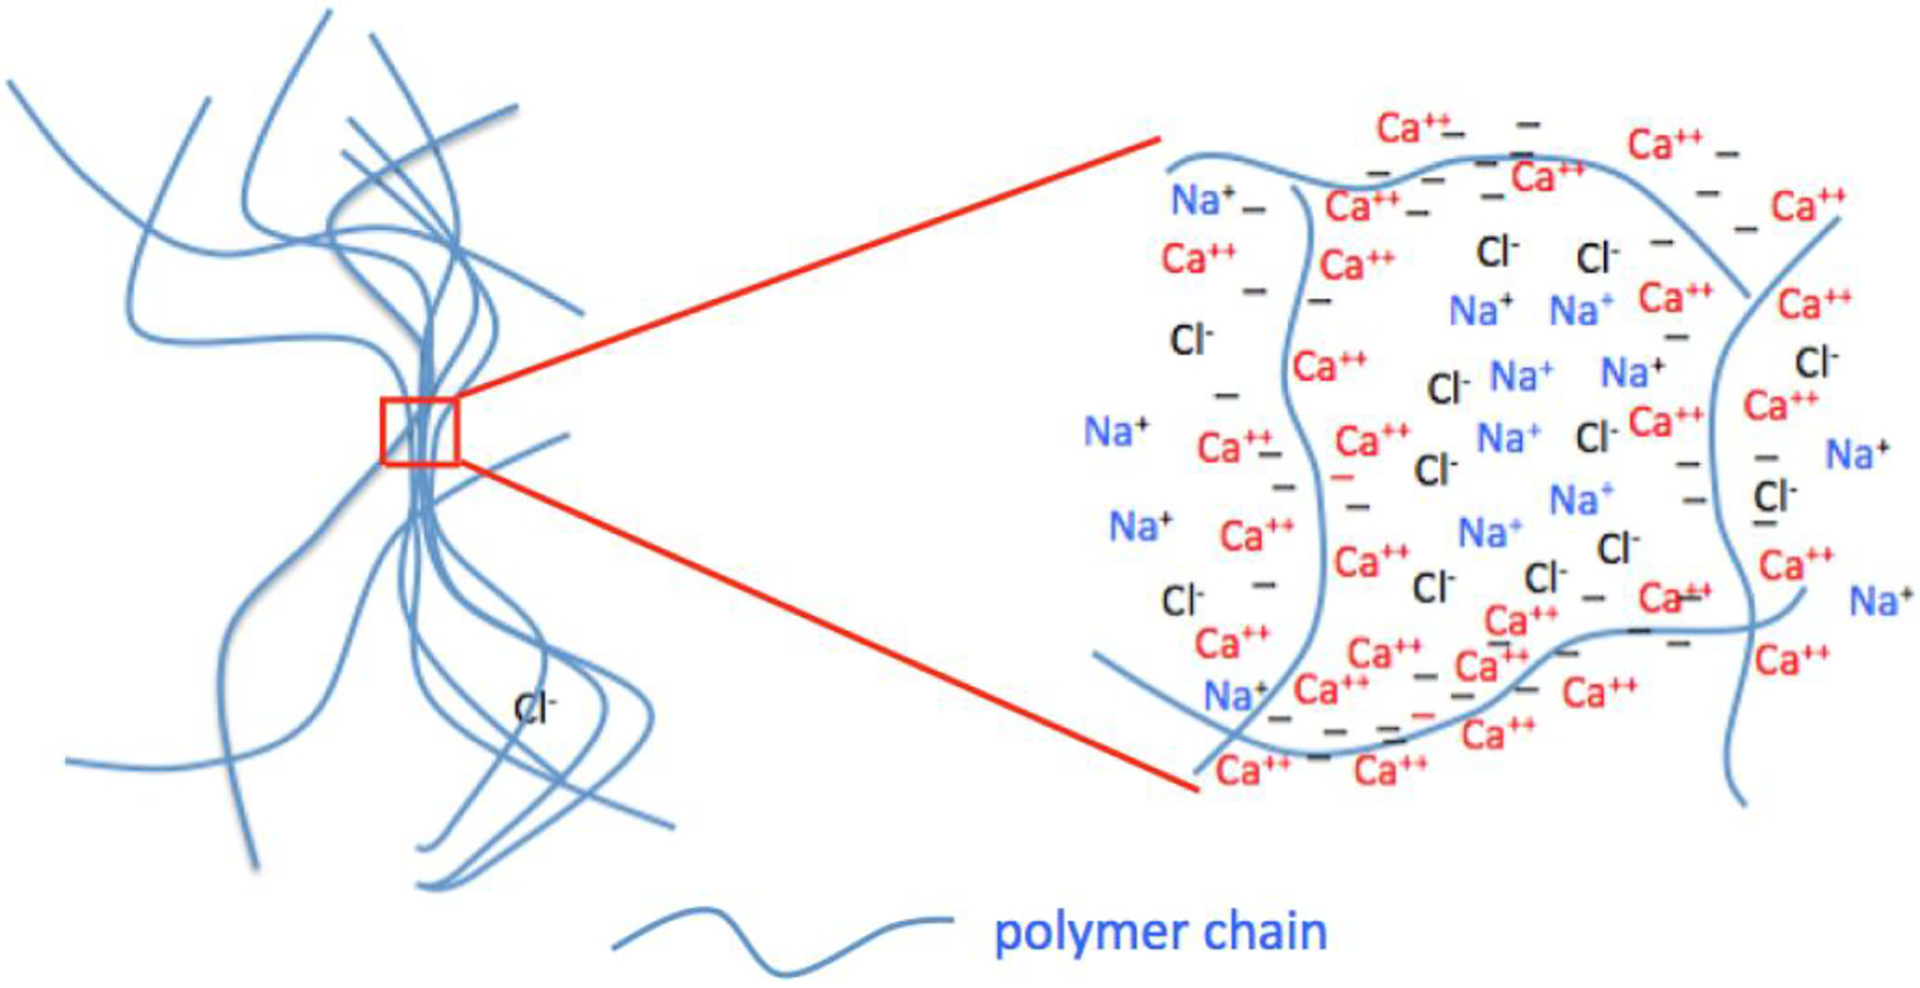
Distribution of polymer chains (left figure) and ions (right figure) in swollen polyelectrolyte gels.
The osmotic pressure data can be expressed in terms of a Flory Huggins-type equation of the form46
| (9) |
where χ0 and χ1 are the interaction parameters, V1 is the molar volume of the solvent and R the gas constant. The continuous curves in Figure 4 are the fits of Eq. 9 to the data. The osmotic modulus κ = φ∂Π/∂φ, from Eq. 9, is
| (10) |
With the measured values of χ0 and χ1, Eq. 8and Eq. 10 provide an independent estimate for the intensity Idyn(0) scattered by the osmotic fluctuations.
The fits of Eq. 5 to the SANS signals at different CaCl2 concentrations are shown in Figure 3. The continuous lines are the total response I(q), while the dotted lines are the osmotic component alone, Idyn(q). The values of Idyn(0) obtained from osmotic pressure measurements are indicated by horizontal arrows on the left axis of the figure. The agreement between the results of the two independent measurements of the thermodynamic component Idyn(q) at q = 0 substantiates the model underlying eq 5.
In summary, the 1/q dependence of the SANS signal is in agreement with the linear character of the DNA chains in the gel. We identify the mesh size L as a quantitative indicator of the chain rearrangement in response to changes in the agreement between the results of the two independent measurements of the thermodynamic component Idyn(q) at q = 0 substantiates the model underlying eq 5. concentration and composition of the ionic environment. Screening of the electrostatic interactions by sodium chloride in the concentration range 10 mM to 100 mM causes a moderate increase both in L and in the amplitude of the concentration fluctuations. Similar trends are observed on addition of calcium ions and on decreasing pH. In the latter cases these modifications push the system towards phase transition. The effect of calcium ions on L and on the dynamic scattering intensity Idyn(0) is, however, much greater than that of sodium.
Osmotic measurements made on the same DNA gels indicate a reduction in the osmotic pressure in the presence of calcium ions by more than an order of magnitude. It is shown that the osmotic modulus κ derived from osmotic swelling pressure measurements is in good agreement with that obtained from the dynamic components of the SANS signal. This result verifies that the mesh size L can be identified with the correlation length of the osmotic concentration fluctuations.
Anomalous Small Angle X-ray Scattering (ASAXS)
The SANS measurements reveal significant differences between the behavior of DNA in NaCl and CaCl2 solutions. Increasing the concentration of counterions screens the electrostatic repulsion between the DNA strands and enhances the scattering intensity: above a given concentration of divalent ions, phase separation takes place. In the case of monovalent ions, however, no phase separation is detected. To identify the differences between the DNA with monovalent and divalent ions, ASAXS measurements were made on DNA solutions.*
As stated in the Experimental Section, for the anomalous scattering measurements the divalent ion calcium was replaced by strontium, and the monovalent ion sodium by rubidium. To verify that these substitutions do not affect the organization of the DNA in the solution, a comparison was made between the SANS signals of DNA samples containing calcium and strontium, as well as rubidium and sodium, respectively. Figure 5 shows that the differences are within experimental error.
Figure 5.
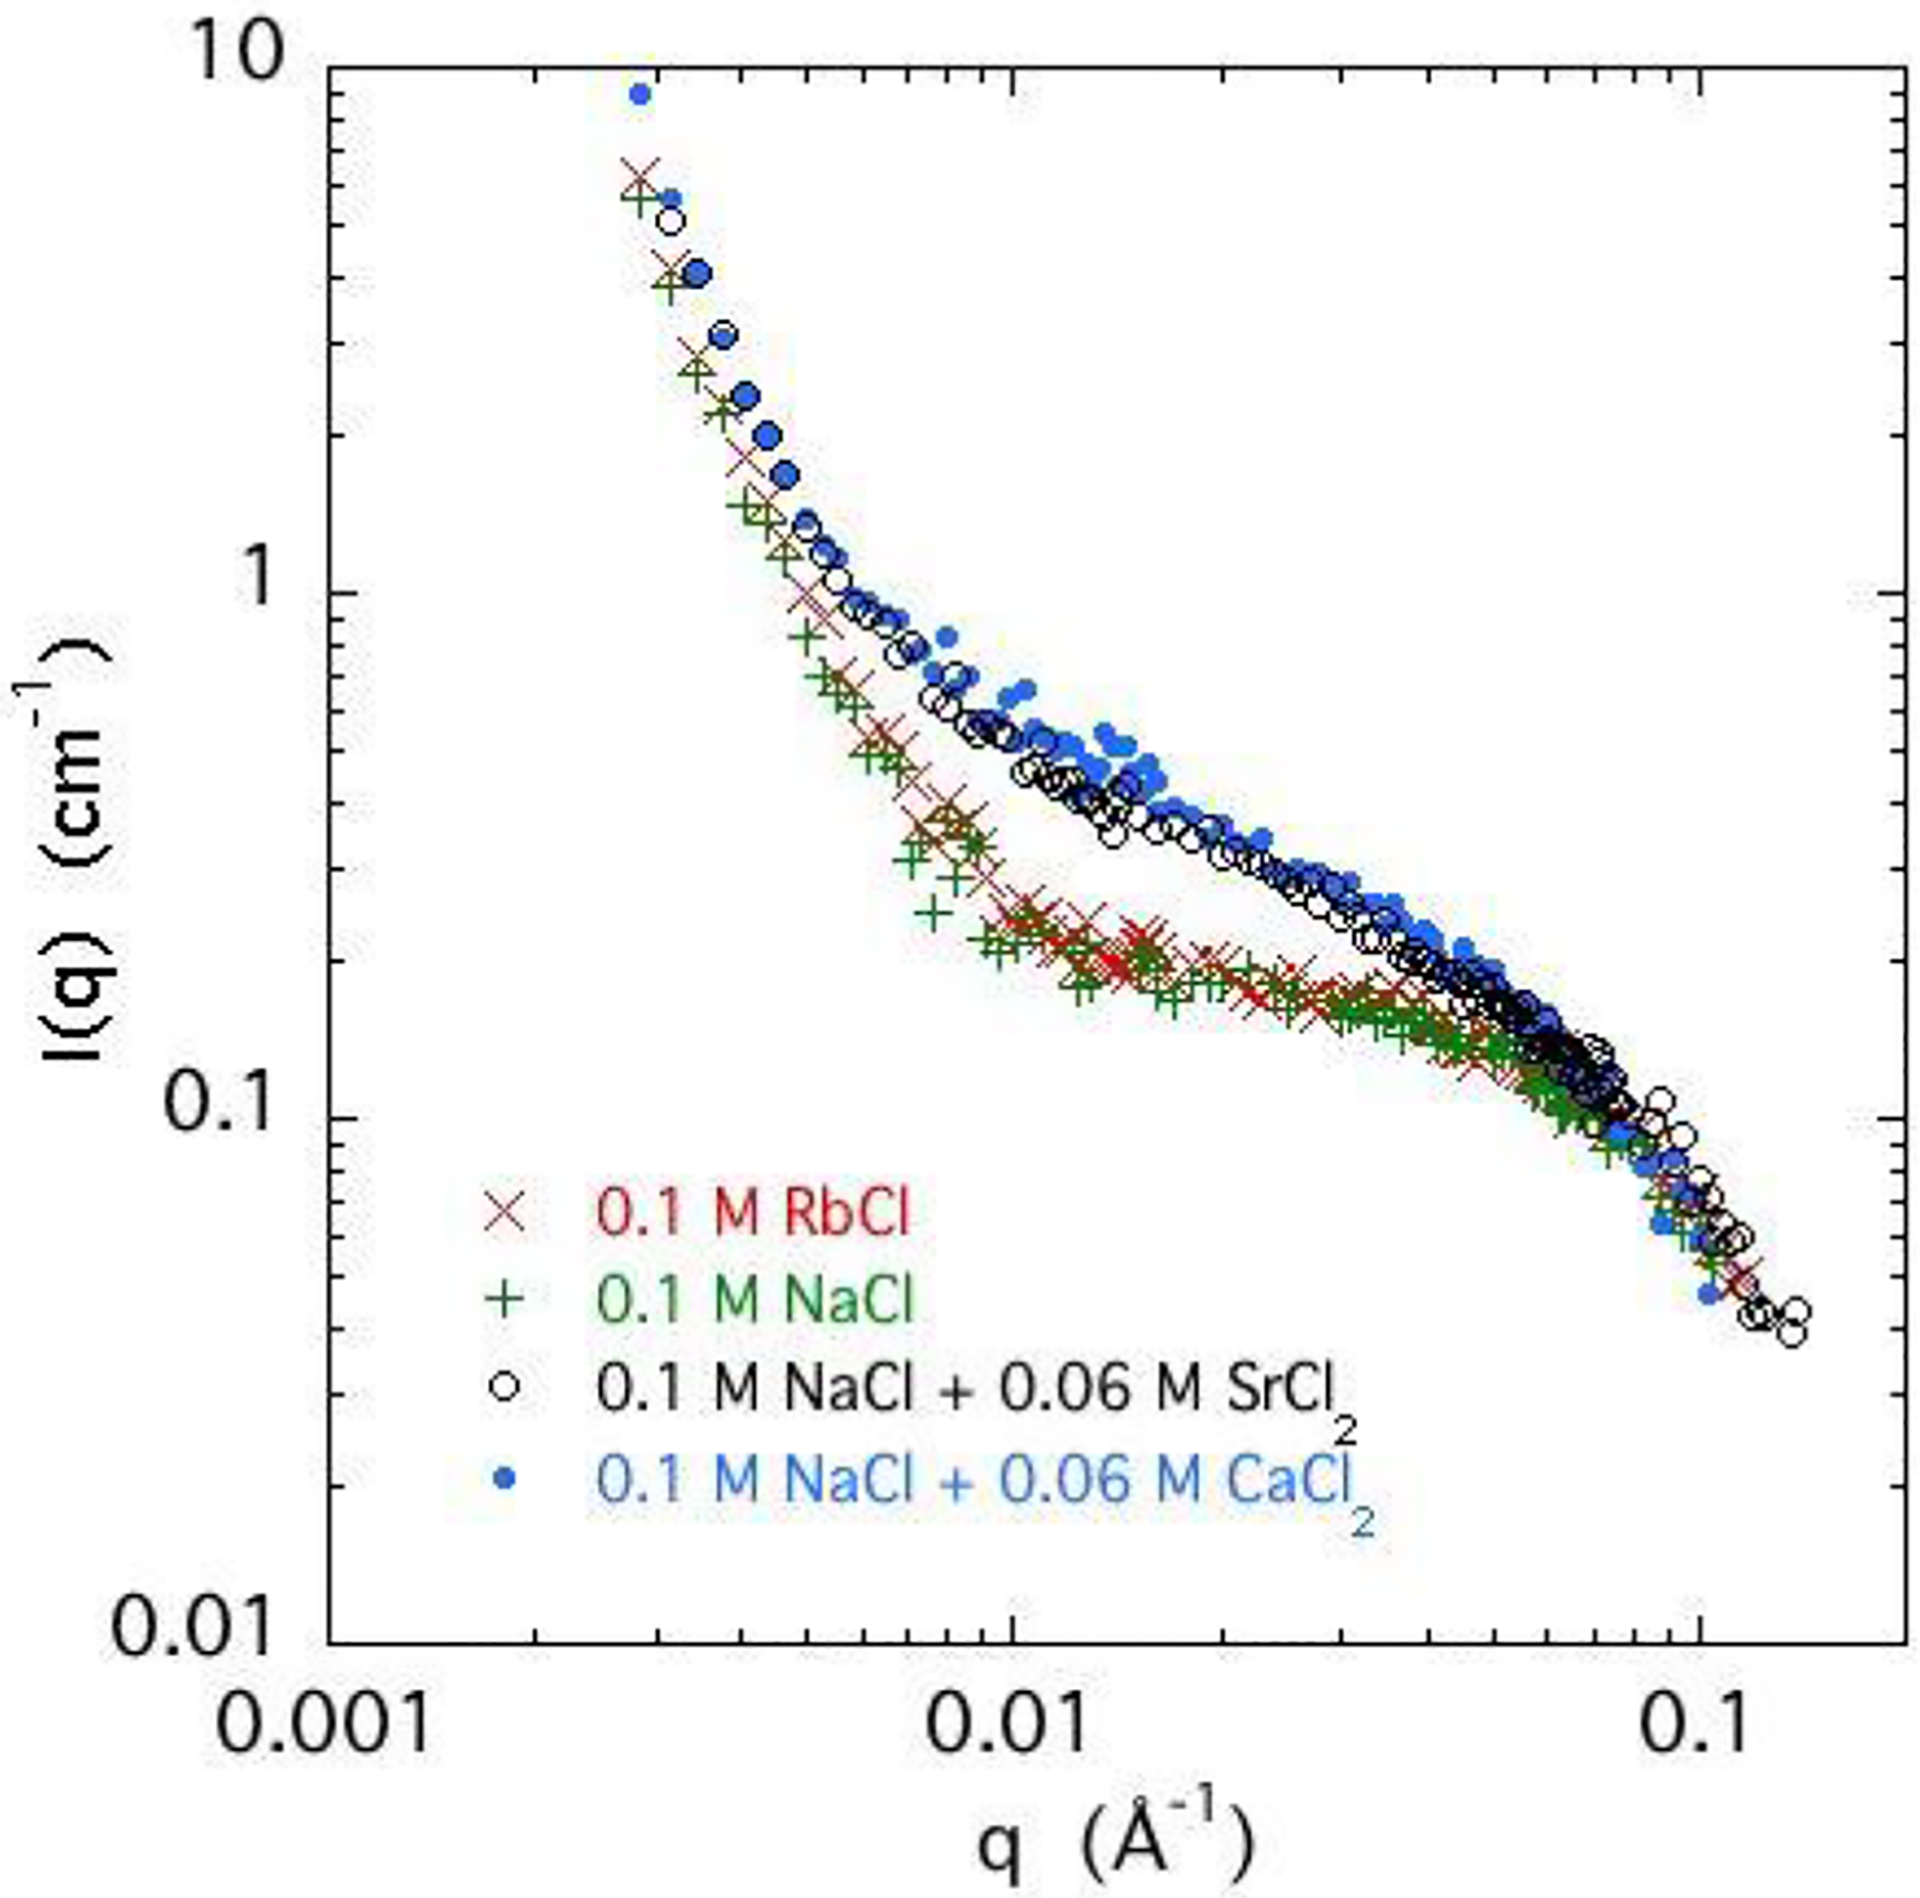
SANS response of 3% w/w DNA solutions in 0.1 NaCl with 0.06 M CaCl2 (solid symbol), 0.06 M SrCl2 (o), and without divalent salt (+), and also of a 3% w/w DNA solution in 0.1 RbCl (×).
Figure 6a compares the SANS and SAXS response of a 3% w/w solution of DNA containing 0.1 M NaCl and 0.05 M SrCl2. In the intermediate q range the SANS and SAXS profiles are practically indistinguishable, as illustrated in the inset of the figure. At low q SANS provides information on larger scale structures, while at high q, where the signal intensity decreases sharply, the data become dominated by incoherent scattering. In this high q region the overall quality of the SAXS data is, however, much better than that of SANS since the incoherent contribution is negligible. Figure 6b shows that as the energy of the incident X-ray beam approaches the absorption edge of the strontium ion, the SAXS signal decreases owing to the reduction in the effective number of electrons in the atom. The differences ΔI(q) are constructed by subtracting the intensities at the two energies, shown as an enlargement in the inset.
Figure 6.
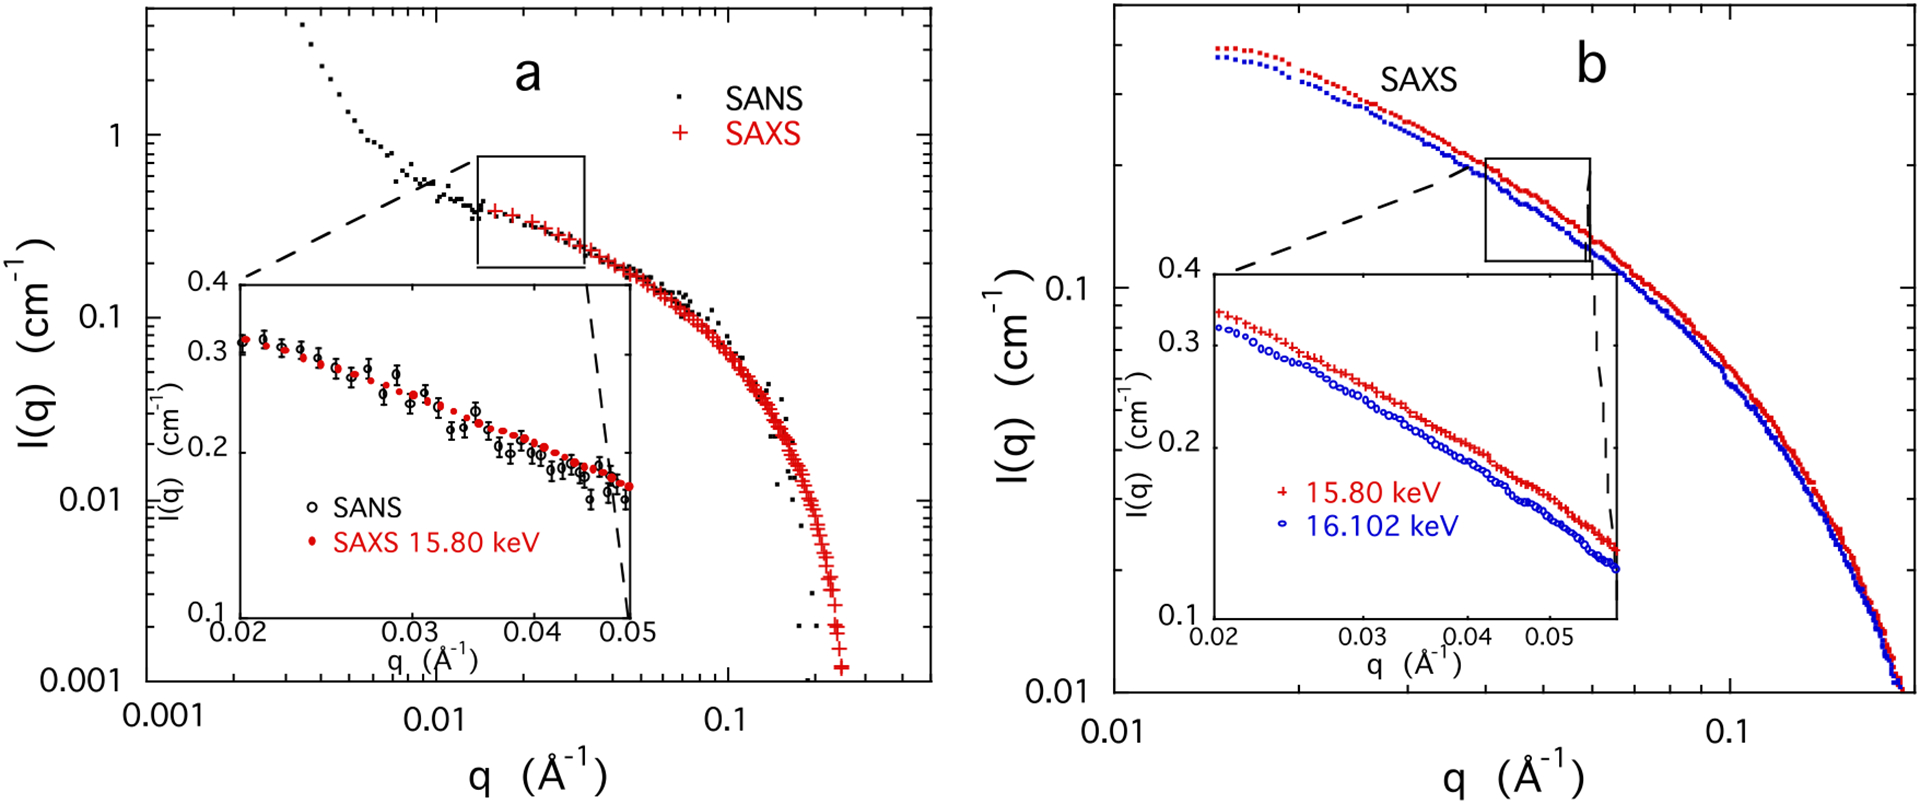
a) Response of 3 w/w% DNA solution containing 0.1 M NaCl and 0.05 M SrCl2 SANS (•) and SAXS (+) at 15.8 keV, below the Sr absorption edge (16.1046 keV).39 The intensity scale of the SAXS measurements is normalized to that of the SANS response at low q. Inset: enlargement of the same data; b) SAXS response of same sample at two energies, 15.80 keV and 16.102 keV. Inset: enlargement of selected region of the SAXS signal illustrating the difference in intensity at the two energies.
Figure 7 shows the resulting differences ΔI(q), far below and immediately below the absorption edge, both for the Rb and Sr containing systems. Unlike the SANS experiment, the responses of these two ions display pronounced differences in shape and intensity, reflecting the different absorption energies of the ionic species. This result shows that in the present system ASAXS enables us to distinguish between chemically different ions in the counter-ion atmosphere. The intensity in the low and intermediate q region scattered by the rubidium ions is about 3 times greater than that of the strontium ions. Increased intensity is expected since the amount of rubidium ions available is almost an order of magnitude greater than that of divalent ions, and also twice as many rubidium ions are needed for the charge compensation on the DNA backbone. However, this increase in intensity from the counterions in the vicinity of the DNA is limited by the differences in the mono- and divalent ion distributions. At high q, the intensity of both the Rb and the Sr signals decreases steeply, reducing the signal to noise ratio in this region. The inset of Figure 7 shows that increasing the concentration of divalent ions affects the diffuse monovalent cloud only weakly. Its radius R, however, increases, i.e., the monovalent ions are repelled from the backbone.
Figure 7.
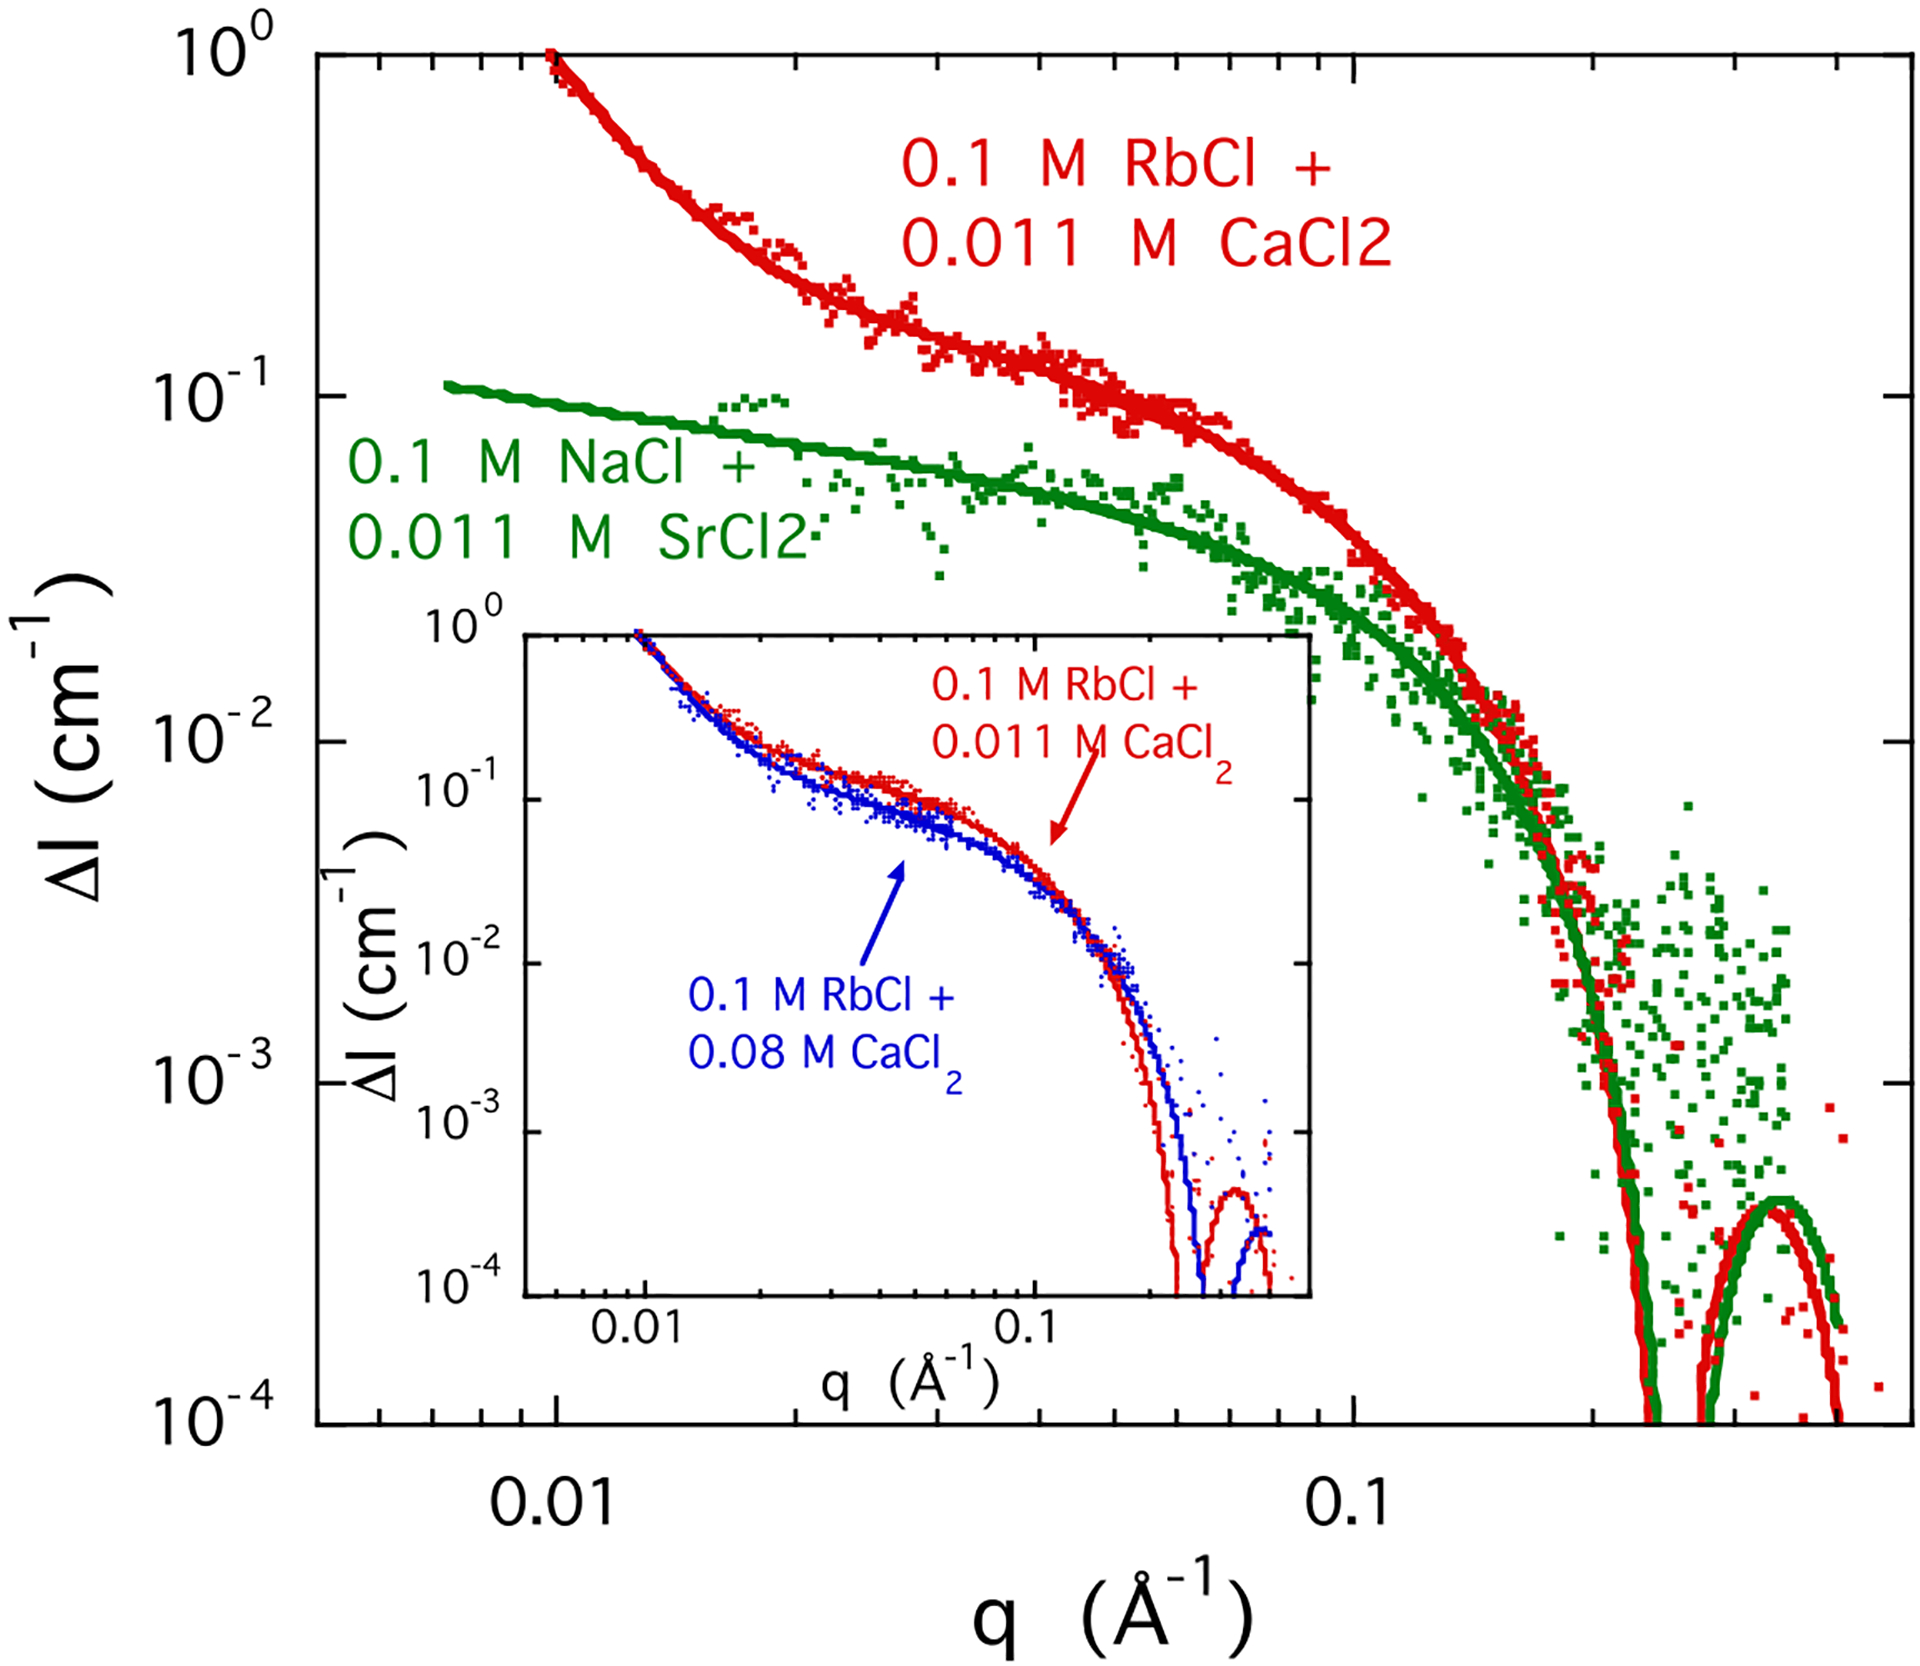
Comparison between the ASAXS profiles ΔI(q) in a 3% w/w DNA solution with 0.1 M RbCl (red) and 0.011 M SrCl2 (green). The mono- and divalent ion concentrations are identical in the two samples. Incident energies are as follows: 14.9 and 15.197 keV for the Rb-containing solution and 15.8 and 16.102 keV for the Sr containing sample. Inset: ASAXS response of Rb-DNA solution with two different CaCl2 concentrations: 0.011 M (red), 0.080 M (blue). Lines are fits to Eq. 11.
To account for the high q response imposed by the cylindrical form factor of the DNA, the X-ray scattering profiles can be described by a modification of Eq 5. Thus
| (11) |
where J1(x) is the cylindrical Bessel function of order 1. As the strontium ion concentration increases, L increases from 14 Å in 0.011 M SrCl2 to 55 Å in 0.080 M SrCl2. This variation of L is consistent with the SANS finding in Figure 3 that the correlation length of the DNA gels increases with increasing CaCl2 concentration.
Figure 8 shows how the ASAXS profile of the strontium response ΔI(q) varies with the concentration of SrCl2 in the DNA solutions. The increase in slope of ΔI(q) at low q above 0.05 M follows the same trend as observed in the SANS measurements (Figure 3) of the gels with increasing CaCl2 concentration, as the system approaches phase separation. (Measurements at concentrations above 0.111 M could not be made owing to phase separation.) This behaviour differs markedly from that of the monovalent ions, where the rubidium ASAXS profile is practically unaffected by the concentration of the calcium ions. This result, together with the similarity in shape between the ASAXS and the SANS signals, is consistent with the intuitive picture that the divalent ions form a tight cloud around the DNA.
Figure 8.
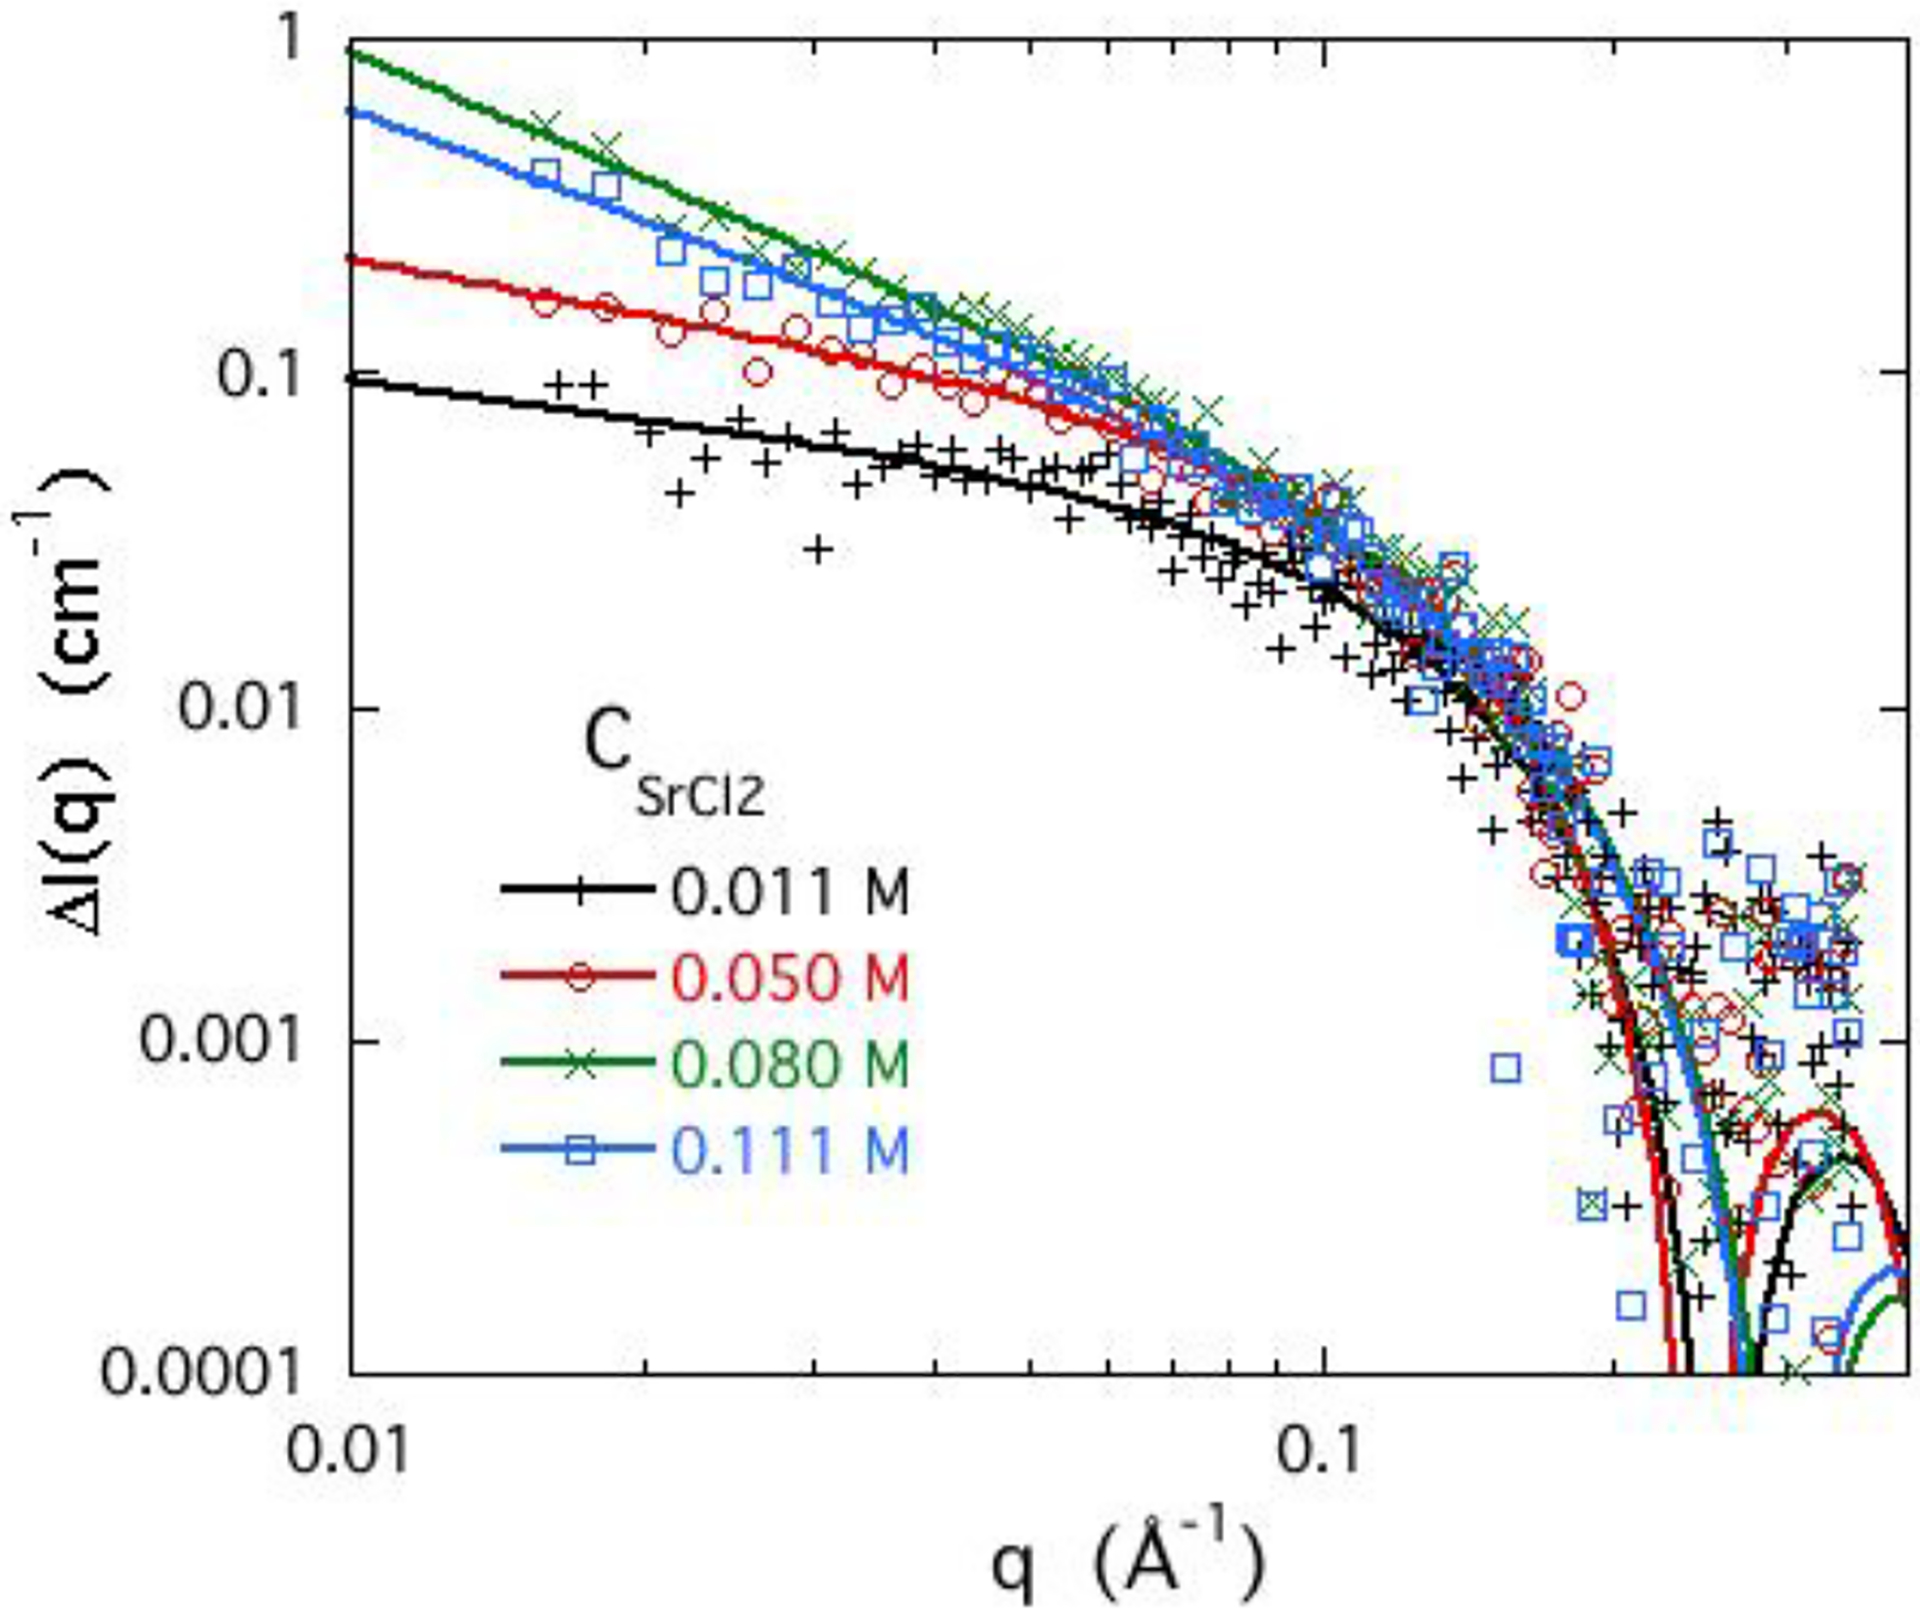
ASAXS response of strontium from 3 wt% DNA solutions with different SrCl2 concentrations in 0.1 M NaCl. Continuous lines are fits of Eq. 11 to the data.
To determine the distribution of the strontium ion cloud in the immediate neighbourhood of the DNA chain, the data of Figure 8 are re-displayed in Figure 9 in the Kratky representation, q2ΔI(q) vs q. This format emphasises the response in the high q region where short range correlations dominate. In the case of a simple cylindrical ion distribution, the maximum value of q2ΔI(q) is located at about qR = 1.84. The position of the maximum thus reflects the radius R of the counter-ion cloud, and its amplitude is proportional to the concentration of strontium ions in the vicinity of the DNA. Figure 9 shows that the maximum of the signal from the DNA solution occurs at q ≈ 0.1 Å−1 and its position varies slightly over the concentration range investigated (0.011 to 0.111 M). As the SrCl2 concentration in the DNA solution increases, the amplitude of the signal increases, reflecting the enrichment of strontium ions around the DNA chains.
Figure 9.
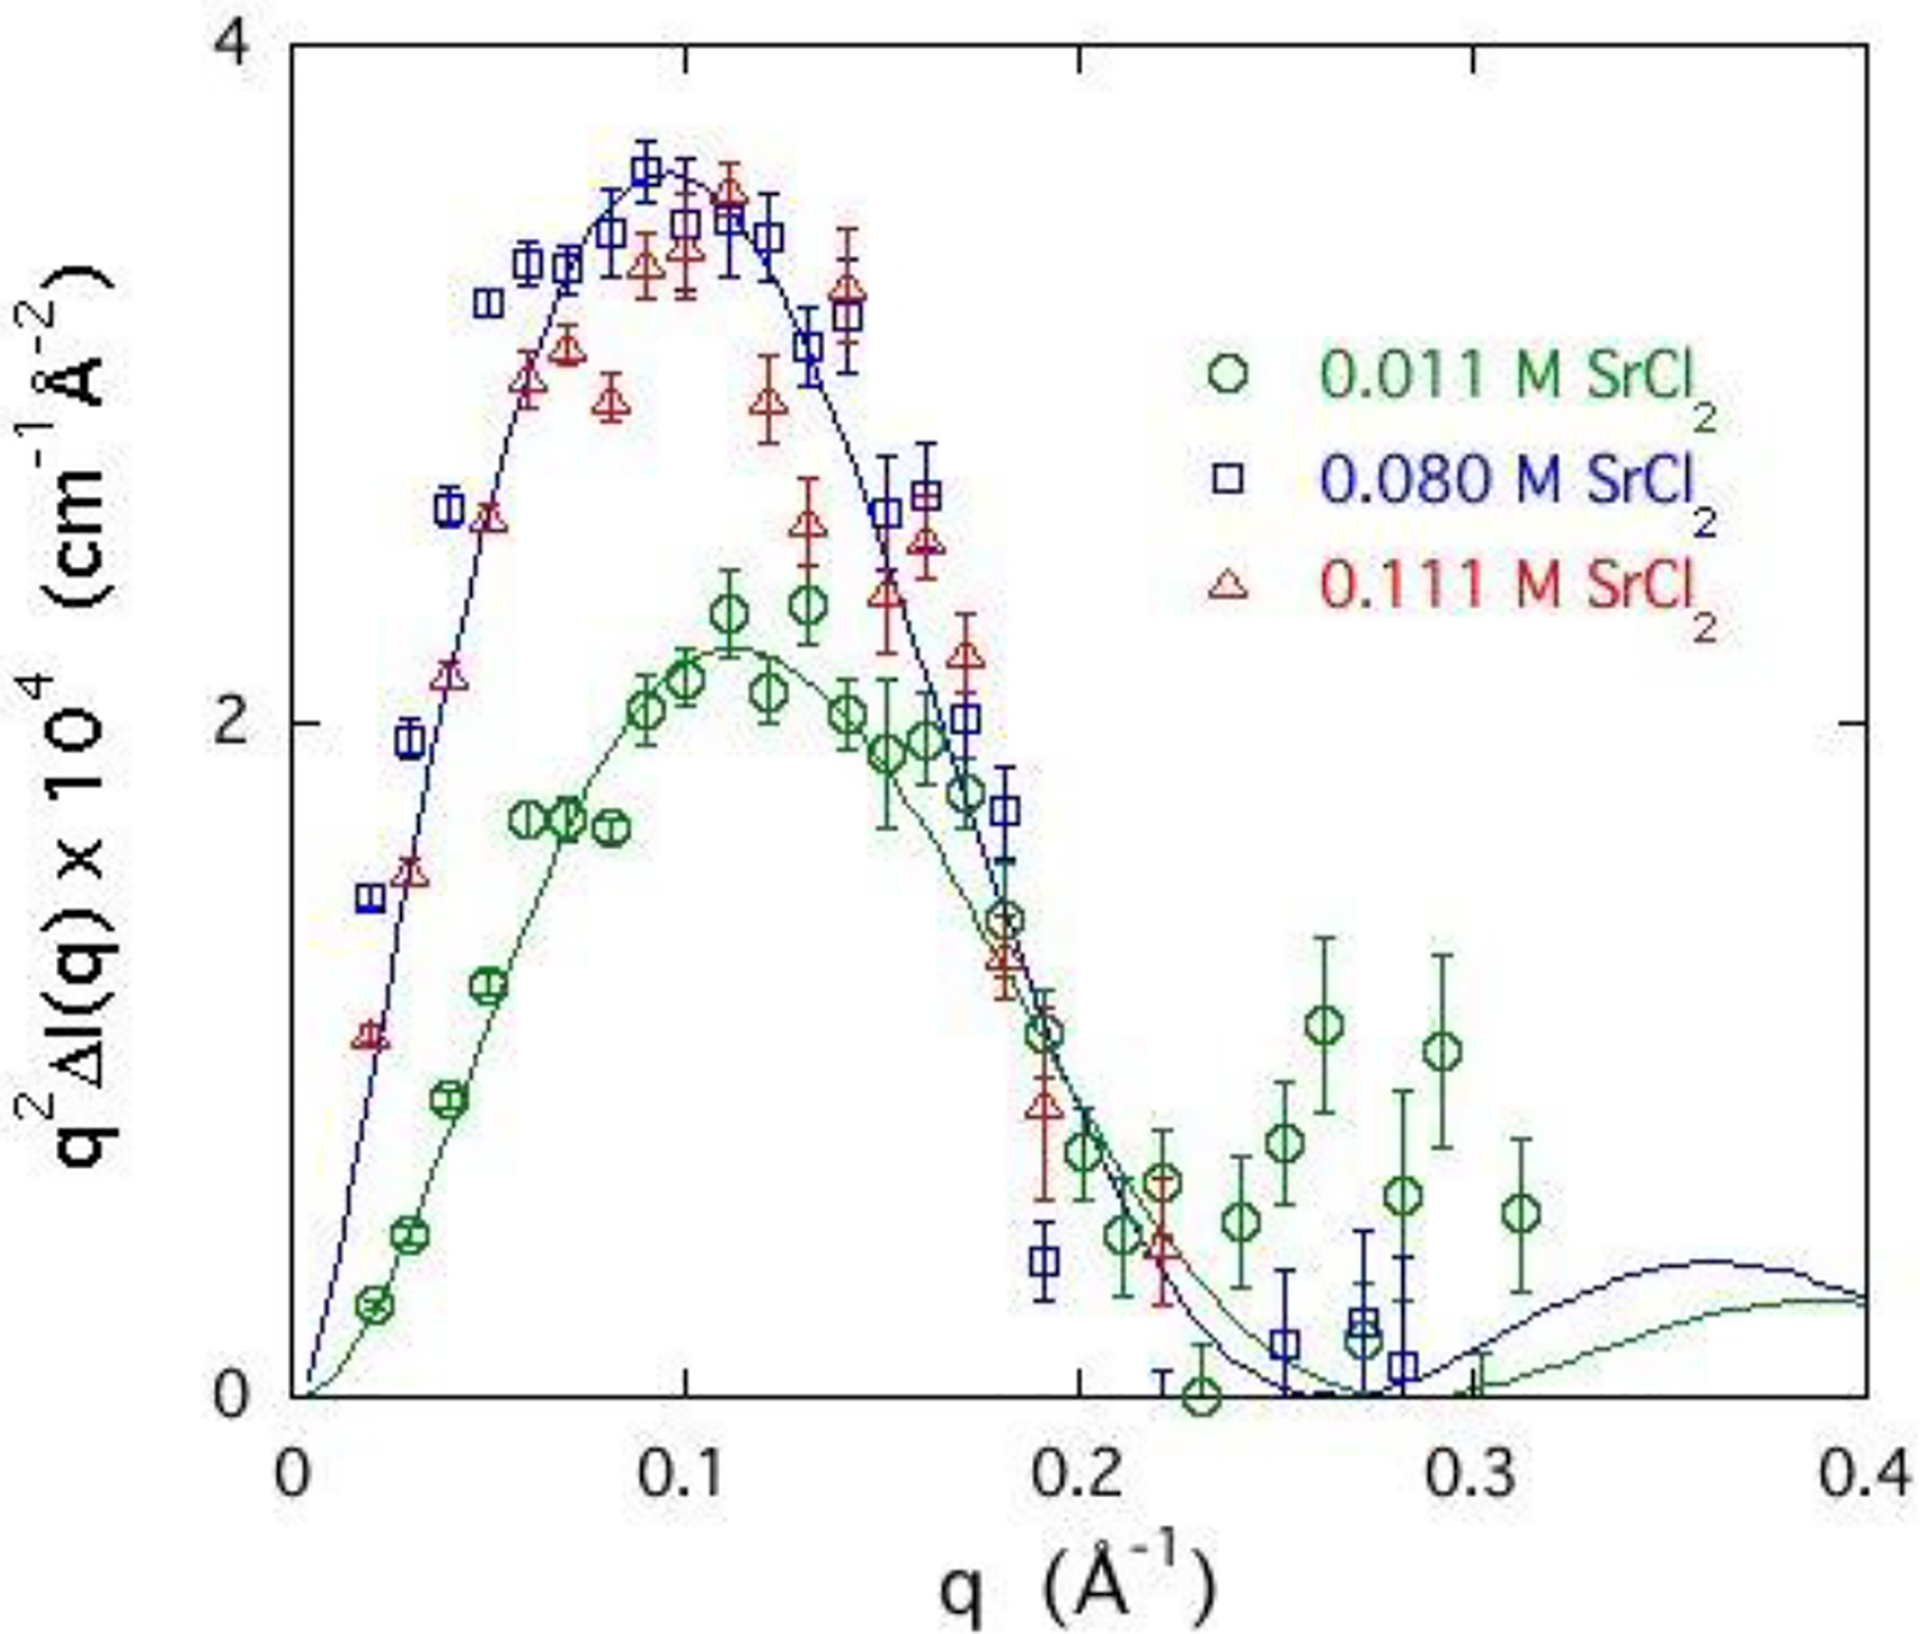
Kratky plot of ASAXS signal q2ΔI(q) of selected DNA-Sr solutions shown in Figure 8, where the ΔI(q) is the difference in scattered intensity between 15.8 and 16.102 keV. Continuous lines are calculated from eq. 11 with R = 15.5 Å for samples containing 0.1 M NaCl with 0.11 M SrCl2 (Δ) and 0.08 M SrCl2 (☐), and 13.5 Å for sample containing 0.1 M NaCl with 0.011 M SrCl2 (Ο).
The continuous curves in Figure 9 are the fits of Eq. 11 to the experimental data. For the samples containing 0.1 M NaCl with 0.11 M SrCl2 (Δ) and 0.08 M SrCl2 (☐) this procedure yields R = 15.5 Å, while for the sample with 0.1 M NaCl and 0.011 M SrCl2 (o), R = 13.5 Å. The surrounding sheath of strontium ions at low concentration thus lies closer to the DNA core, while, as already noted, the monovalent ions are pushed outwards. Also, at low divalent ion concentration the maximum of the q2I(q) curves increases with strontium concentration, and at high divalent ion concentration attains a plateau. The height of the peak is proportional to the number of strontium ions in the immediate vicinity of the DNA chain. Similar analysis of the corresponding Rb signal yields R > 20 Å.
It should be noted that, in the vicinity of the anionic DNA backbone, the solutions contain both mono and divalent cations. These ions are in excess to the stoichiometric condition for charge compensation. The equilibrium composition of the ion cloud surrounding the polymer chains is the result of the competition between the counterions and is governed by their specific binding capacity. Stoichiometry of charge neutralisation requires that two monovalent cations replace one divalent cation. In systems in which both monovalent and divalent counterions are in excess, however, existing models of polyelectolyte solutions are unable to predict either how the presence of excess ions affects the exchange between divalent and monovalent ions or the composition of the ion cloud.
The intensity of the maxima in the ASAXS signal, illustrated in Figure 9, is proportional to the concentration of strontium ions in the counter-ion atmosphere around the DNA chain. These plots can be calibrated by comparing the total SAXS spectra of the Sr-containing samples with those of the corresponding calcium-containing DNA solutions. This procedure is outlined in Appendix 1. The resulting dependence of the concentration of strontium ions in the ion cloud is displayed in Figure 10 as a function of the strontium chloride concentration in the bulk DNA solution. After a steep initial increase, the SrCl2 concentration in the cloud levels out, and reaches saturation at cSrCl2 ≈ 0.06 M. In contrast to this behaviour, the same figure shows that for the monovalent ion, the intensity of the rubidium signal from the immediate neighbourhood of the DNA chain varies only weakly as the concentration of calcium ions (calcium) increases. The observed change in the shape of the rubidium signal at high q, however, shows that the divalent ions displace the monovalent ions farther away from the DNA backbone.
Figure 10.
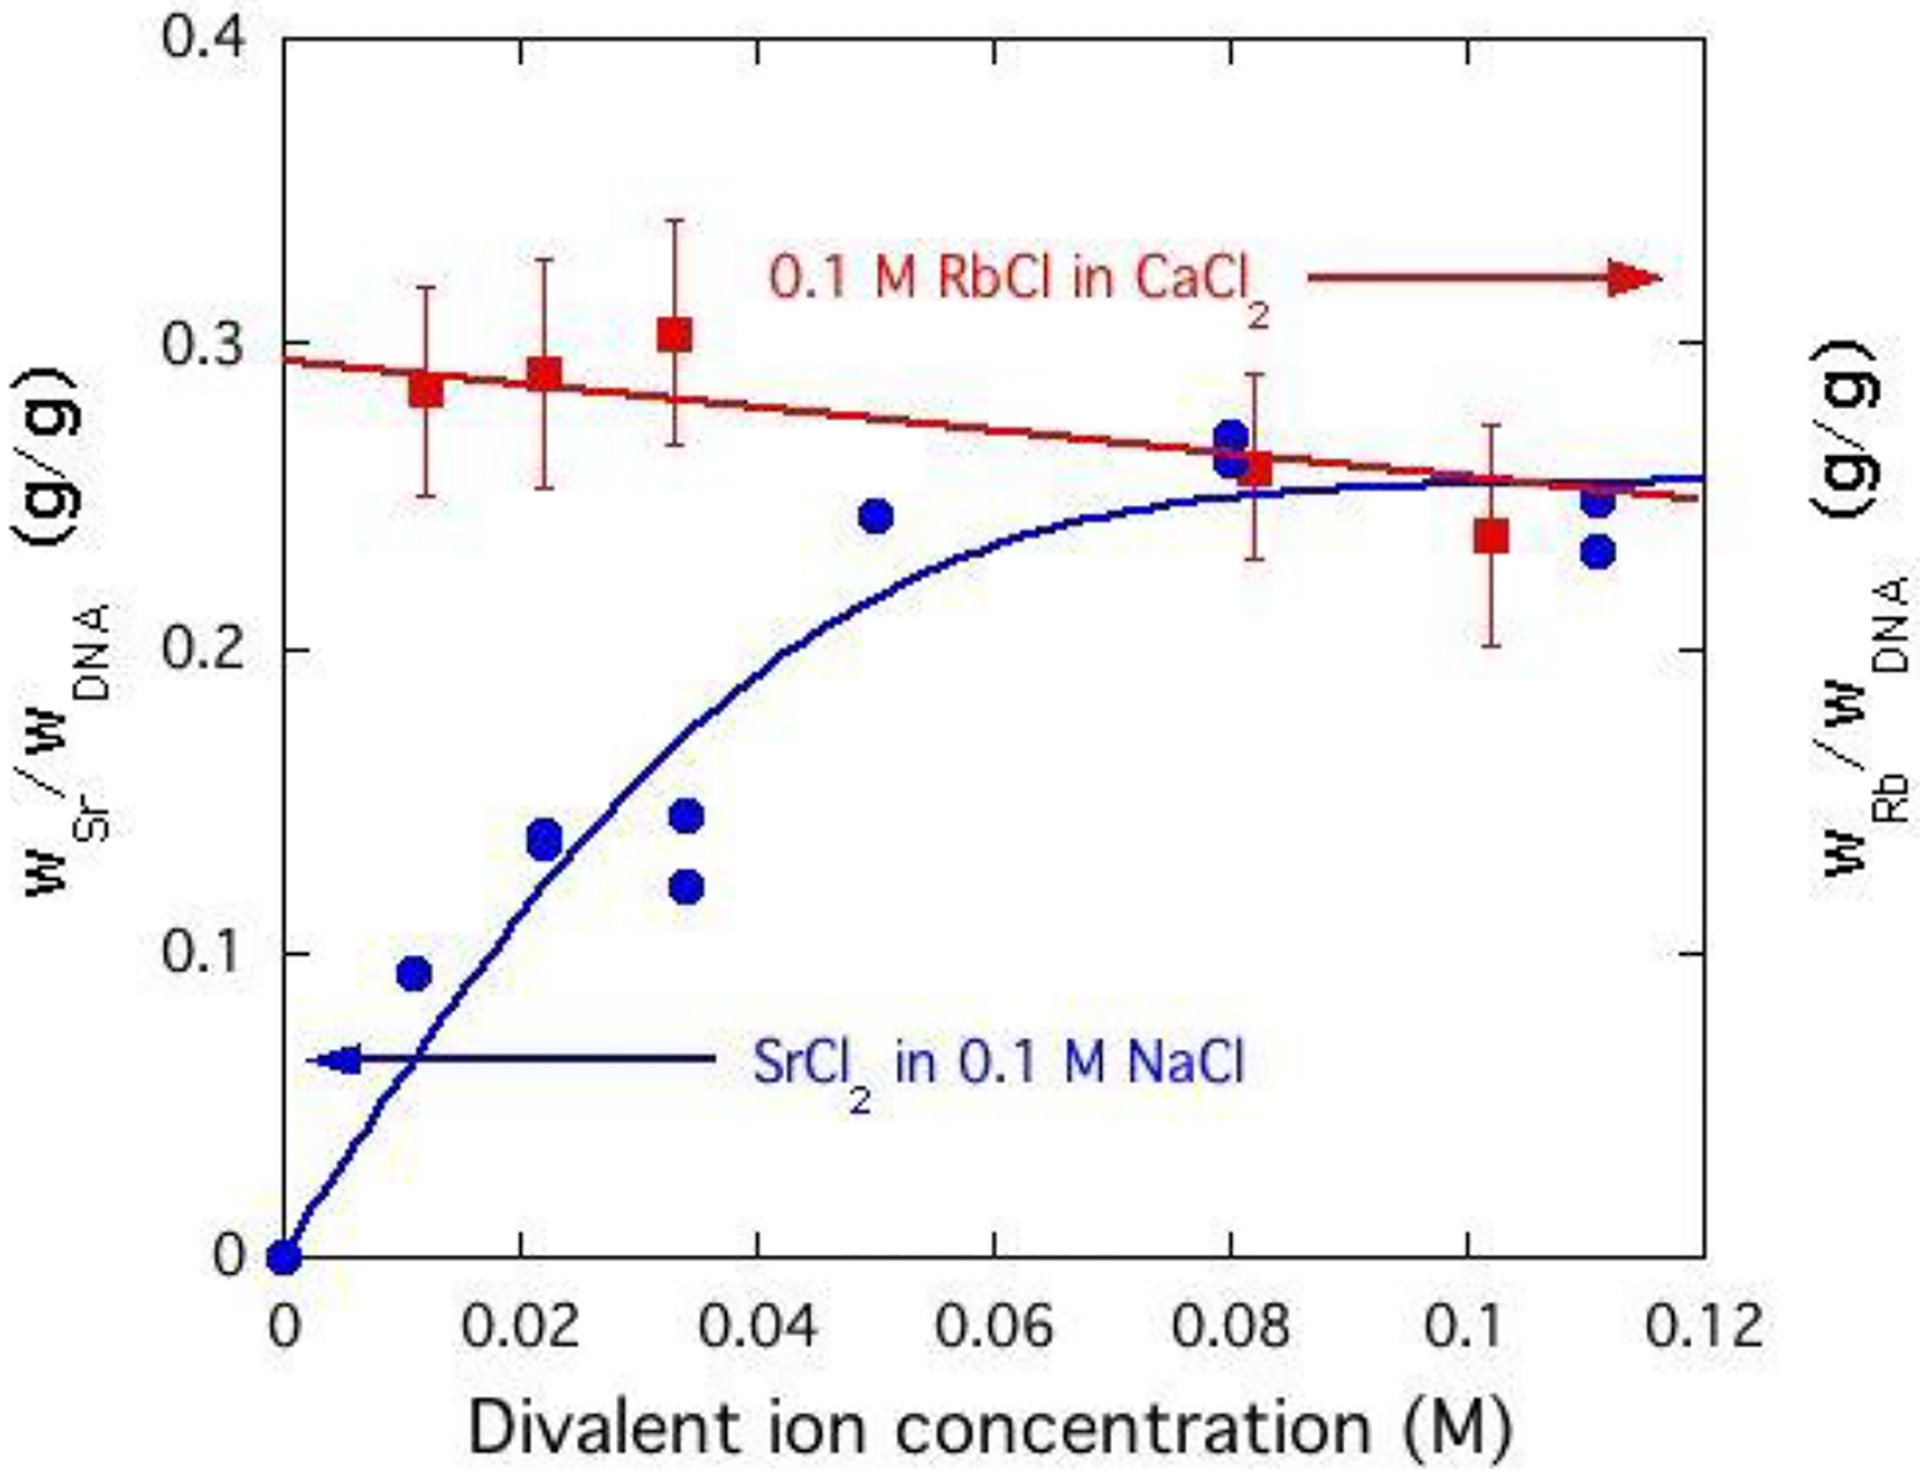
Variation of weight fraction of resonant Sr ions (left hand scale) and of the Rb ions (right hand scale) in the vicinity of the DNA chains as a function of divalent ion concentration in the solution. Weight faction of the ions is with respect to the DNA.
CONCLUSIONS
In this work systematic SANS measurements are reported for DNA gels in which the concentration of sodium and calcium ions and the pH are varied to determine the effect of the ionic environment on the thermodynamic interactions and on the molecular organization.
In salt-free conditions, DNA gels exhibit a correlation peak in their SANS spectra similar to that generally observed in polyelectrolyte solutions. This scattering feature reflects the local alignment among the charged polymer chains due to the unscreened electrostatic repulsion. In the 3% DNA gel the average separation of the DNA strands is approximately 100 Å, which is consistent with the distance estimated on the basis of a hexagonal arrangement of the DNA double strands. Above 40 mM sodium chloride content, the correlation peak disappears. At higher sodium chloride concentration a moderate increase occurs in the scattering intensity, which can be described by an expression consisting of two terms. The first term is governed by the osmotic concentration fluctuations in the gel, which exhibit a correlation length L. The second term describes the scattering by static or quasi-static inhomogeneities that are typical of gels, and give rise to excess intensity at low values of q.
The scattering response in the intermediate q range, I(q) ∝ 1/q, indicates that the shape of the fluctuating elements is linear. Increasing the salt content of the gel increases the scattered intensity, and is accompanied by an increase in the correlation length L, corresponding to increased mesh size of the DNA gel. A similar trend is observed upon addition of calcium chloride or with decreasing pH, ultimately resulting in phase separation. Measurements of the osmotic pressure Π show that increasing the calcium ion concentration from 0 to 0.2 mM in the equilibrium bath reduces Π by more than an order of magnitude. The osmotic modulus of the DNA gels, derived from the osmotic swelling pressure measurements is in good agreement with the dynamic component of the SANS intensity.
The ASAXS measurements on 3% w/w solutions of DNA (in which rubidium and strontium ions are substituted for sodium and calcium ions, respectively) containing both mono- and divalent counter-ions reveal that both the monovalent and divalent counter-ions follow the contour of the polymer chains, but that the monovalent cloud is more extended. Separate SANS observations demonstrate that the effects of calcium chloride and strontium chloride, on the one hand, and sodium chloride and rubidium chloride on the other, are indistinguishable. The results show that divalent ions affect the monovalent ion cloud only weakly, even though they accumulate preferentially in the vicinity of the DNA chain and form a tight cloud around it.
ACKNOWLEDGEMENTS
This work was supported by the Intramural Research Program of the NICHD/NIH. The authors acknowledge the support of the National Institute of Standards and Technology, U.S. Department of Commerce, in providing the neutron research facilities used in this work. Access to the NG3 instrument was provided by the Center for High Resolution Neutron Scattering, a partnership between the National Institute of Standards and Technology and the National Science Foundation under Agreement No. DMR-2010792. We are grateful to the European Synchrotron Radiation Facility for access to the French CRG beam line BM02.
APPENDIX
This appendix describes the procedure for normalizing the variation of the ASAXS signal ΔI(q) by the ratio of SAXS intensities I(q) at 15.8 keV measured in the DNA solutions containing 0.1 NaCl plus variable amounts of either SrCl2 or CaCl2. The intensity of the signal far from resonance at values of q such that qR << 1 is proportional to the square of the difference in electron density between the solvent and the solute. Thus
| (A1) |
where r0 is the classical radius of the electron, Zp, Mp and dp are respectively the number of electrons, mass and density of the polymer backbone, Zs, Ms and ds those of the background solvent, while Z1 are v1 are the electron number and ionic volume of the divalent ion, and ZNa and vNa those of the sodium ion. The variable x is the number of divalent counter-ions in the neighborhood of a DNA base pair. On inserting the values47,48 Zp = 320, Mp = 615.4 Da, dp = 2.01 g/cm3, ZSr = 32.6, vSr = −21.2 cm3, ZCa = 18.29, vCa = −20.7 cm3, into Eq A1, and comparing with the measured ratio [ISr(q)/ICa(q)]1/2, the value of x can be computed. These measurements yield x ≈ 1 in the plateau region of the strontium response shown in Figure 10.
Footnotes
Conflict of Interest. There are no conflicts of interest to declare.
In polyelectrolyte solutions phase separation occurs at much higher ion concentration than that in the corresponding gel (bath concentration). In the solution, both the polymer and the ions are distributed throughout the whole volume. A gel, however, in equilibrium with an infinite reservoir of the solvent, is able to withdraw ions from the reservoir. The resulting partitioning raises the ion concentration inside the gel network to well above that in the surrounding bath.
Contributor Information
Ferenc Horkay, Section on Quantitative Imaging and Tissue Sciences, Eunice Kennedy Shriver National Institute of Child Health and Human Development, National Institutes of Health, 13 South Drive, Bethesda, MD 20892, USA.
Peter J. Basser, Section on Quantitative Imaging and Tissue Sciences, Eunice Kennedy Shriver National Institute of Child Health and Human Development, National Institutes of Health, 13 South Drive, Bethesda, MD 20892, USA
Erik Geissler, Laboratoire Interdisciplinaire de Physique, Université Grenoble Alpes and CNRS, F-38000 Grenoble, France.
Data Availability Statement.
The data that support the findings of this study are available from the corresponding author upon reasonable request.
REFERENCES
- 1.Gosule LC; Schellman JA Compact form of DNA induced by spermidine. Nature, 1976, 259, 333–335. [DOI] [PubMed] [Google Scholar]
- 2.Chattoraj DK; Gosule LC; Schellman JA DNA condensation with polyamines: II. Electron microscopic studies. J. Mol. Biol 1978, 121, 327–337. [DOI] [PubMed] [Google Scholar]
- 3.Widom J; Baldwin RL Monomolecular condensation of λ-DNA induced by cobalt hexamine. Biopolymers 1983, 22, 1595–1620. [DOI] [PubMed] [Google Scholar]
- 4.Podgornik R; Rau D,C; Parsegian VA Parametrization of direct and soft steric-undulatory forces between DNA double helical polyelectrolytes in solutions of several different anions and cations. Biophys. J,, 1994, 66, 962–971. [DOI] [PMC free article] [PubMed] [Google Scholar]
- 5.Bloomfield VA DNA condensation by multivalent cations. Biopolymers 1997, 44, 269–282. [DOI] [PubMed] [Google Scholar]
- 6.Kassapidou K; Jesse W; Kuil ME; Lapp A, Egelhaaf S; van.der.Maarel JRC Structure and Charge Distribution in DNA and Poly(styrenesulfonate) Aqueous Solutions Macromolecules 1997, 30, 2671–2684. [Google Scholar]
- 7.Schurr JM Temperature-dependence of the bending elastic constant of DNA and extension of the two-state model. Tests and new insights. Biophysical Chemistry, 2019, 251, 106146. [DOI] [PubMed] [Google Scholar]
- 8.Schurr JM A quantitative model of a cooperative two-state equation of DNA. Experimental tests, insights and predictions. Quarterly Reviews of Biophysiscs, 2021, 54, E5. [DOI] [PubMed] [Google Scholar]
- 9.Langowski J; Hammermann M; Klenin K; May R; Toth K Superhelical DNA studied by solution scattering and computer models. Genetica 1999, 106, 49–55. [DOI] [PubMed] [Google Scholar]
- 10.Borsali R; Nguyen H; Pecora R Small-Angle Neutron Scattering and Dynamic Light Scattering from a Polyelectrolyte Solution: DNA, Macromolecules 1998, 31, 1548–1555. [Google Scholar]
- 11.Ricka J; Tanaka T Swelling of Ionic Gels: Quantitative Performance of the Donnan theory. Macromolecules, 1984, 17, 2916–2921. [Google Scholar]
- 12.de Gennes PG Scaling Concepts in Polymer Physics; Cornell: Ithaca, NY, 1979. [Google Scholar]
- 13.Manning GS Limiting Laws and Counterion Condensation in Polyelectrolyte Solutions II. Self‐Diffusion of the Small Ions. J.Chem.Phys 1969, 51, 934–938. [Google Scholar]
- 14.Muthukumar M Dynamics of polyelectrolyte solutions. J. Chem. Phys 1997, 107, 2619–2635. [Google Scholar]
- 15.Zhang Y; Douglas JF; Ermi BD; Amis E Influence of counterion valency on the scattering properties of highly charged polyelectrolyte solutions. J. Chem. Phys 2001, 114, 3299–3313. [Google Scholar]
- 16.Kirste RG. Oberthür RC in Small Angle X-ray Scattering eds Glatter, Kratky, Academic Press, London: 1982. [Google Scholar]
- 17.des Cloiseaux J Form Factor of an Infinite Kratky-Porod Chain. Macromolecules. 6, 403–407 (1973). [Google Scholar]
- 18.Horkay F; Grillo I, Basser PJ, Hecht AM Geissler E. Experimental Evidence for Two Thermodynamic Length Scales in Neutralized Polyacrylate Gels. J. Chem. Phys 2002, 117, 9103–9106. [Google Scholar]
- 19.Ornstein LS; Zernike F Accidental Deviations of Density and Opalescence at the Critical Point of a Single Substance. Proc. Sect. Sci. K. med. Akad. Wet 1914, 17, 793–806. [Google Scholar]
- 20.Mallam S; Horkay F; Hecht AM; Geissler E Scattering and Swelling Properties of Inhomogeneous Polyacrylamide Gels. Macromolecules 1989, 22, 3356–3361. [Google Scholar]
- 21.Horkay F; Hecht A-M; Mallam S; Geissler E; Rennie AR Macroscopic and Microscopic Thermodynamic Observations in Swollen Poly(vinyl acetate) Networks Macromolecules, 1991, 24, 2896–2902. [Google Scholar]
- 22.Geissler E; Horkay F; Hecht AM Scattering from Network Polydispersity in Polymer Gels. Phys.Rev.Lett 1993, 71, 645–648. [DOI] [PubMed] [Google Scholar]
- 23.Horkay F; Basser PJ; Hecht A-M; Geissler E Chondroitin Sulfate in Solution: Effects of Mono- and Divalent Salts. Macromolecules 2012, 45, 2882–2890. [DOI] [PMC free article] [PubMed] [Google Scholar]
- 24.Shibayama M Structure-mechanical property relationship of tough hydrogels. Soft Matter 2012, 8, 8030–8038. [Google Scholar]
- 25.Shibayama M Small-Angle Neutron Scattering on Polymer Gels: Phase Behavior, Inhomogeneities and Deformation Mechanisms. Polymer Journal 2011, 43, 18–34. [Google Scholar]
- 26.Yang Z; Hemar Y; Hilliou L; Gilbert EP; McGillivray DJ; Williams MAK; Chaieb S Nonlinear Behavior of Gelatin Networks Reveals a Hierarchical Structure. Biomacromolecules 2016, 17, 590–600. [DOI] [PubMed] [Google Scholar]
- 27.Horkay F; Nishi K; Shibayama M Decisive test of the ideal behavior of tetra-PEG gels. The Journal of Chemical Physics 2017, 146, 164905. [DOI] [PMC free article] [PubMed] [Google Scholar]
- 28.Kratky O X-ray small angle scattering with substances of biological interest in diluted solutions, Progress in Biophysics and Molecular Biology, 1963, 13, 105–173. [DOI] [PubMed] [Google Scholar]
- 29.Pfeiffer P; Avnir D Chemistry in noninteger dimensions between two and three. I. Fractal theory of heterogeneous surfaces. J.Chem. Phys 1983, 79, 3558–3565. [Google Scholar]
- 30.Horkay F; Basser PJ; Hecht A-M; Geissler E Osmotic and SANS Observations on Sodium Polyacrylate Hydrogels in Physiological Salt Solutions. Macromolecules 2000, 33, 8329–8333. [Google Scholar]
- 31.Schosseler F; Ilmain F; Candau SJ Structure and properties of partially neutralized poly(acrylic acid) gels. Macromolecules 1991, 24, 225–234. [Google Scholar]
- 32.Sabbagh I, Delsanti MP. Lesieur P Ionic distribution and polymer conformation, near phase separation, in sodium polyacrylate/divalent cations mixtures: small angle X-ray and neutron scattering. Eur. Phys. J. B 12, 253–260 (1999). [Google Scholar]
- 33.Das R, Mills TT, Kwok LW, Maskel GS, Millet IS, Doniach S, Finkelstein KD, Herschlag D, Pollack L Counterion Distribution around DNA Probed by Solution X-Ray Scattering. Phys. Rev. Lett 90, 188103 (2003). [DOI] [PubMed] [Google Scholar]
- 34.Horkay F; Hecht AM; Rochas C; Basser PJ; Geissler E: Anomalous Small Angle X-ray Scattering Determination of Ion Distribution around a Polyelectrolyte Biopolymer in Salt Solution. J. Chem. Phys, 2006, 125, 234904. [DOI] [PubMed] [Google Scholar]
- 35.Sztucki M, DiCola E, Narayanan T: Anomalous small-angle X-ray scattering from charged soft matter. Eur. Phys. J. Special Topics, 2012, 208, 319–331. [Google Scholar]
- 36.Horkay F; Basser PJ Osmotic Observations on Chemically Cross-linked DNA Gels in Physiological Salt Solutions. Biomacromolecules 2004, 4, 232–237. [DOI] [PubMed] [Google Scholar]
- 37.Covington AK, Paabo M, Robinson RA, Bates RG Use of the glass electrode in deuterium oxide and the relation between the standardized pD (paD) scale and the operational pH in heavy water. Anal. Chem, 1968, 40, 700–706. [Google Scholar]
- 38.NIST Cold Neutron Research Facility. NG3 and NG7 30-meter SANS. Instruments Data Acquisition Manual, January 1999.
- 39.Vink H Precision measurements of osmotic pressure in concentrated polymer solutions. Europ. Polym. J 1971, 7, 1411–1419. [Google Scholar]
- 40.Horkay F; Zrinyi M Studies on Mechanical and Swelling Behavior of Polymer Networks Based on the Scaling Concept, 4. Extension of the Scaling Approach for Gels Swollen to Equilibrium in a Diluent of Arbitrary Activity. Macromolecules 1982, 15, 1306–1310. [Google Scholar]
- 41.Förster S, Schmidt M Polyelectrolytes in solution. Adv. Polym. Sci 1995, 120, 51–133. [Google Scholar]
- 42.Förster S, Schmidt M, Antonietti M Static and dynamic light scattering by aqueous polyelectrolyte solutions: effect of molecular weight, charge density and added salt. Polymer, 1990, 31, 781–792. [Google Scholar]
- 43.Odijk T Hexagonally Packed DNA within Bacteriophage T7 Stabilized by Curvature Stress. Biophysical Journal, 1998, 75, 1223–1227. [DOI] [PMC free article] [PubMed] [Google Scholar]
- 44.Ke Y, Voigt NV, Gothelf KV, Shih WM Multilayer DNA Origami Packed on Hexagonal and Hybrid Lattices. J. Am. Chem. Soc 2012, 134, 3, 1770–1774. [DOI] [PMC free article] [PubMed] [Google Scholar]
- 45.Sears VF Neutron scattering lengths and cross sections Neutron News 1992, 3, 26–37. [Google Scholar]
- 46.Flory PJ Principles of Polymer Chemistry, Cornell, Ithaca: 1953. [Google Scholar]
- 47. http://physics.nist.gov/PhysRefData/FFast/html/form.html .
- 48.Marcus Y The Standard Partial Molar Volumes of Ions in Solution. Part 4. Ionic Volumes in Water at 0−100 °C. J. Phys. Chem. B 2009, 113, 10285–10291. [DOI] [PubMed] [Google Scholar]
Associated Data
This section collects any data citations, data availability statements, or supplementary materials included in this article.
Data Availability Statement
The data that support the findings of this study are available from the corresponding author upon reasonable request.