

Abstract
BACKGROUND: Increases in consumer cost sharing lead to decreases in the use of both high- and low-value care. Copay assistance was designed to reduce out-of-pocket (OOP) cost burden. Commercial insurers have recently instituted copay adjustment programs (CAPs), which exclude copay assistance from deductibles and OOP cost maximums, thereby effectively increasing the financial burden on patients. The utilization of these programs by specific demographic populations is unknown.
OBJECTIVE: To assess utilization of copay assistance and CAP exposure in a commercially insured patient population and examine potential differences in the use of each of these programs by non-White and by White patients.
METHODS: A retrospective, cross-sectional study using IQVIA Longitudinal Access and Adjudication Data, linked to Experian Marketing Solutions, LLC consumer data, identified unique patients who were younger than 65 years, covered by commercial insurance, had at least 1 pharmacy claim for treatment within prespecified therapeutic areas, and had full financial data visibility on paid claims (ie, nonmissing data on costs associated with the pharmacy claim and the secondary payer) between January 1, 2019, and September 30, 2021. Analyses of copay card use or CAP exposure (defined as the likelihood to be included in the accumulator or maximizer program) between non-White and White patient populations were adjusted for age, gender, household income, patient state of residence, pharmacy benefit manager, state-level CAP policy, and overall drug cost.
RESULTS: In total, 4,073,599 unique patients (5.6% of the total database population) were included in the copay card analysis. In adjusted analyses, there were no significant differences in copay card utilization between non-White patients and White patients (odds ratio [OR] = 0.995, 95% CI = 0.99-1.00; P = 0.0964). However, among copay card users, non-White patients were significantly more likely to be exposed to CAPs, as either maximizers (OR = 1.27, 95% CI = 1.22-1.33; P < 0.0001) or accumulators (OR = 1.31, 95% CI = 1.26-1.36; P < 0.0001), compared with White patients.
CONCLUSIONS: In an adjusted analysis of this selected sample of a commercially insured population, there was no difference in the use of copay cards between non-White and White patients. CAP exposure, however, was significantly higher among non-White patients. This increased exposure suggests a disproportionate effect due to this reduction in copay assistance benefits, which has the potential to exacerbate racial and ethnic disparities in access to medications.
DISCLOSURES: This study was sponsored by Janssen Scientific Affairs, LLC. Mr Ingham, Dr Sadik, and Dr Song are employees of Janssen Scientific Affairs, LLC. Dr Zhao is an employee of IQVIA. Dr Fendrick is a consultant for AbbVie, Amgen, Bayer, CareFirst BlueCross BlueShield, Centivo, Community Oncology Association, Covered California, EmblemHealth, Exact Sciences, Freedman Health, GRAIL, Harvard University, Health & Wellness Innovations, Health at Scale Technologies, HealthCorum, Hygeia, MedsIncontext, MedZed, Merck, Mercer, Montana Health Cooperative, Pair Team, Penguin Pay, Phathom Pharmaceuticals, Proton Intelligence, Risalto Health, Risk International, Sempre Health, Silver Fern Health, State of Minnesota, Teladoc Health, US Department of Defense, Virginia Center for Health Innovation, Wellth, Wildflower Health, Yale New Haven Health System, and Zansors; received research funds from Agency for Healthcare Research and Quality (AHRQ), Boehringer-Ingelheim, Gary and Mary West Health Policy Center, Arnold Ventures, National Pharmaceutical Council, Patient-Centered Outcomes Research Institute (PCORI), Pharmaceutical Research and Manufacturers of America (PhRMA), Robert Wood Johnson (RWJ) Foundation, State of Michigan/The Centers for Medicare & Medicaid Services (CMS); and has an outside position at the American Journal of Managed Care (AJMC; co-editor), Medicare Evidence Development & Coverage Advisory Committee (MEDCAC) member, VBID Health (partner).
Plain language summary
This data analysis shows that copay card use does not differ by the race and ethnicity of patients; however, the potential for a patient to be included in a copay adjustment program (CAP) is much higher among non-White patients vs White patients. Non-White patients may therefore be more impacted by this loss of copay assistance, resulting in unexpected clinical and economic concerns.
Implications for managed care pharmacy
This study evaluated copay card utilization and CAP exposure among commercially insured patients younger than 65 years. The greater exposure of non-White patients to the potential extra financial burden from CAP exposure is an unintended consequence of these programs. Assuming that managed care organizations do not want to worsen existing health care disparities, this evidence suggests that organizations and payers should reconsider or rescind their use.
Over the past 5 years, patients have faced approximately 25% higher cost sharing for prescription medication, mostly driven by changes in plan design.1-4 Increased consumer cost sharing has been shown to negatively affect evidence-based medication utilization and worsen health disparities.1,5 In an attempt to mitigate the negative clinical impact of out-of-pocket (OOP) costs on medication use, patient assistance programs—usually offered as copay cards—support patients in offsetting cost-sharing components of prescription medication within their health benefits plan.4,6-8 Notably, programs that reduce OOP costs for patients improve medication adherence, facilitate access to preventive care services, and could reduce racial and/or ethnic health disparities.9-11
In recent years, payers (ie, pharmacy benefit managers [PBMs] and insurers) have introduced copay adjustment programs (CAPs) that block the funds provided by copay assistance from applying toward patients’ deductibles and OOP cost maximums.12-14 Two primary forms of CAPs, known as copay accumulators and maximizers, have an impact on patients’ costs in different ways.13,14 In accumulator programs, the payments made with copay cards do not count against the patients’ deductibles or the OOP cost maximums. Therefore, these programs may increase the patients’ total cost-sharing burden and potentially lead to unexpected, substantial midyear expenses.6,15,16 In maximizer programs, the total annual benefit is allowed to increase up to the maximum amount that a manufacturer is willing to reimburse patients for their copay expense.13 This amount is distributed across a patient’s benefit year to equalize the use of these available funds. These maximizer programs still do not count toward a patient’s deductible or OOP cost maximum within a given year and can delay a patient’s ability to reach this benefit threshold, leaving the patient exposed to further costs related to other medications or illnesses. Both accumulator and maximizer programs are associated with a negative impact on treatment adherence and persistence of patients.10,11
Given the potential positive effects of copay assistance and the possible negative effects of CAPs on patient behavior, medication adherence, and health care disparities, it is important to better understand how often these programs are used and how their use varies across patient demographics. Accordingly, this study aims (1) to quantify the use of copay cards and assess their utilization across race and ethnicity groups, and similarly, (2) to measure CAP exposure among copay card users and CAP exposure by race and ethnicity within the commercially insured patient population, across 7 major therapeutic areas in which copay assistance and corresponding CAPs are commonly in place (cardiovascular and metabolic diseases, immunology, infectious diseases, multiple sclerosis, oncology, pulmonary arterial hypertension, and schizophrenia). These therapeutic areas were selected because of their relatively high disease burden, as well as their expected claim volume, to allow copay card and CAP exposure analyses based on retail/specialty pharmacy and commercial mix, and variations in wholesale acquisition cost price within the therapeutic area. According to an August 2020 report on medication spending in the United States,17 the therapeutic areas included here are within the top 10 therapeutic classes for nondiscounted spending.
Methods
DATA SOURCES AND STUDY DESIGN
This retrospective, cross-sectional study used data on paid claims from the IQVIA Longitudinal Access and Adjudication Data (LAAD) 1:1 matched to Experian Marketing Solutions, LLC, consumer data between January 1, 2019, and September 30, 2021 (study period). The IQVIA LAAD is a comprehensive patient longitudinal dataset that captures claims with information on adjudicated dispensed prescriptions sourced from retail, mail, long-term care, and specialty pharmacies. The Experian Marketing Solutions, LLC, consumer data are a multisourced, compiled repository containing known as well as derived and probabilistic information, among adults (aged ≥18 years), and are referred to as consumer marketing attributes data.
PATIENT SELECTION
An adapted version of the CONSORT (Consolidated Standards of Reporting Trials) flowchart, used solely to help visualize the patient selection process for this study, is shown in Figure 1. A checklist for STROBE (STrengthening the Reporting of OBservational studies in Epidemiology) is included in Supplementary Table 1 (available in online article). Patients included in this study were originally sourced from the IQVIA LAAD and (1) were required to be part of a commercial insurance plan with at least 1 pharmacy claim (hence excluding medical buy and bill claims) that included reliable payer information, (2) were required to have a record of an active claim in all 3 years from January 1, 2019, to September 30, 2021, as a proxy of continuous enrollment, and (3) were assigned to a therapeutic area based on receiving treatment within prespecified therapeutic areas of interest (ie, cardiovascular and metabolic diseases, immunology, infectious diseases, multiple sclerosis, oncology, pulmonary arterial hypertension, and schizophrenia) according to the National Drug Codes (Supplementary Table 2). These patients were matched to patients with linkable consumer marketing attributes data. Linking was performed based on a patented and proprietary encryption algorithm by using unique patient identification numbers that were created from patient-level information, including first name, last name, date of birth, gender, and 5-digit zip code.18,19 This deterministic matching algorithm is Health Insurance Portability and Accountability Act (HIPAA)–compliant and achieves a balance between false positive (~2%) and false-negative (~3%) rates. Patients matched to Experian data skewed as slightly older vs those unmatched, as Experian data are limited to adult patients only.
FIGURE 1.

Flowchart of Patient Selection
To assess the risk of patient selection bias, sensitivity analysis focused on areas with the largest attrition losses (ie, when matching to consumer marketing attributes data and when requiring full financial data), in which before and after attrition loss comparisons assessed differential losses by race and ethnicity (and other demographics) that might impact either of the primary comparison cohorts (White vs non-White patients). No systematic underrepresentation was uncovered.
This resulting population was used to generate the 2 analytic populations. (1) Population for copay card analysis: Patients with null or missing data values for age, gender, race and ethnicity, household income, state of residence, PBM, state-level CAP policy, and overall drug cost data (ie, with full financial data visibility and nonmissing primary payment amount), or nonrepresentative age data (ie, excluding those aged ≥65 years or in Medicare/Medicaid plans) were excluded (detailed definitions in Supplementary Table 3). The resulting populations were further categorized into copay card users and non–copay card users. (2) Population for CAP analysis: Among copay card users only, patients with insufficient or incomplete cost data, and null or missing data values for age, gender, race and ethnicity, household income, state of residence, PBM, state-level CAP policy, and overall drug cost data, or nonrepresentative age data, were excluded. The resulting population constituted patients with sufficient data for CAP analysis (CAP-exposed patients vs nonexposed patients). Within this CAP analysis population, patients were categorized into 3 mutually exclusive cohorts in the following order: maximizers, accumulators, or neither.
Product-specific, therapeutic area–specific, and general flagging were conducted according to IQVIA primary and secondary payer identification expertise and corresponding cost data to determine whether the patient ever used a copay card or was exposed to a CAP in a therapeutic area of interest during the study period.
IDENTIFICATION OF PATIENTS USING COPAY CARDS
The National Drug Code numbers recorded in the IQVIA LAAD database identified patients with branded, generic, and biosimilar drug use. Patients were required to have at least 1 claim for each of the 3 years to be flagged as copay card users. Both general and product-specific flagging were used to identify copay card usage. General flagging was based on known copay card vendors (eg, OPUS, Mckesson) flagged and observed in the data. Product-specific flagging was based on a pay-as-little-as amount and buydown amount that aligned with the design parameters of the product-specific copay support design.
IDENTIFICATION OF PATIENTS EXPOSED TO ACCUMULATOR AND MAXIMIZER PROGRAMS
Table 1 summarizes the 3 classified CAP analysis cohorts following the prespecified rules below. Patients were required to have at least 3 claims per year to be flagged as CAP-exposed patients. General flagging for CAP prevalence was based on annual patient cost exposure amounts over the course of a given year. Therapeutic area–specific flagging for CAP prevalence was based on patient cost exposures, patient cost exposures relative to overall treatment cost, and copay card buydown amounts over a given year.
TABLE 1.
Patient CAP Classification
| Patient CAP classificationa,b | Description |
|---|---|
| Maximizers |
|
| Accumulatorsc |
|
| Neither |
|
aAll patients were first identified as commercial copay card users with activity every year from January 1, 2019, to September 30, 2021, with valid payer information of PALA amounts; all categories were mutually exclusive.
bRace and ethnicity was categorized as non-White (African American, Central and Southwest Asian, Far Eastern Polynesian, Hispanic, Native American, Southeast Asian, and other) and White.
cPatients meeting the first criterion and any other criteria were classified as accumulators.
CAP = copay adjustment program; PALA = pay-as-little-as; WAC = wholesale acquisition cost.
The accumulator cohort included (1) patients who were exposed to consistently high OOP costs per claim and (2) patients with annual cumulative OOP costs greater than $10,000 as a reasonable OOP maximum depending on prespecified therapeutic areas (Table 1).
The IQVIA data enable identification of the cost that a patient is asked to pay based on their insurance coverage (primary exposure) as well as any copay card support that the patient is using to offset their costs. Inclusion of patients who repeatedly face greater than 50% of their treatment’s wholesale acquisition cost price ensures they are patients who are not on common commercial coinsurance benefit designs, as average common coinsurance rates for formulary tiers that include the products in this study range from 25% to 37%.20
In addition, the high annual cumulative cost exposure threshold is set to more than $10,000 to ensure the accumulated cost exposure exceeds the OOP maximum limits that have been set by the Affordable Care Act.21 In 2019, the Affordable Care Act OOP maximum limit was $7,900 for self-only coverage. A 2022 Kaiser Family Foundation report on employer health benefits lists the maximum for various types of high-deductible health plans at less than $6,000.20 Hence, this criterion is set to ensure that patients who are in traditional high-deductible health plans (with no accumulator) are not being classified as exposed to accumulators.
The maximizer cohort included patients facing costs consistent with known relevant program annual limits divided by 8 to 12 fills.
Patients who fit into both accumulator and maximizer categories were included in the maximizer cohort. Patients who were not categorized into either CAP program formed the neither cohort (non-CAP cohort).
OUTCOME AND COVARIATES
Patient demographic characteristics (ie, age, gender, and state of residence), PBM, and overall drug cost were reported based on data from the IQVIA LAAD database. Patient household income and race and ethnicity were reported based on the matched consumer marketing attributes data. Overall drug cost was calculated based on total drug costs for a given year across all LAAD medication claims from January 1, 2019, to December 31, 2021. Primary analysis assessed the prevalence differences by race and ethnicity for copay assistance use vs non-copay assistance use and for CAP exposure vs non-CAP exposure cohorts. Per the primary objectives, patients in each cohort were categorized as non-White based on racial and ethnic minority groups vs White. Non-White included patients identified as African American, Central and Southwest Asian, Far Eastern Polynesian, Hispanic, Native American, Southeast Asian, and other. Covariates included age, gender, household income, state of residence, whether that state had an existing legislative ban on CAP programs, drug cost exposure in the previous year, and PBM.
STATISTICAL ANALYSES
All categorical variables were summarized with frequencies and percentages. All continuous variables were summarized with measures of central tendency (mean, median, SD, interquartile range, minimum, and maximum). Multivariable logistic regression and multinomial logistic regression were conducted to examine the association of race and ethnicity with copay card utilization and CAP exposure, respectively, adjusting for age, gender, household income, patient state of residence, PBM, state-level CAP policy, and overall annual drug cost. All analyses were conducted assuming a 2-tailed test of significance and an α level set a priori at 0.05 by using R Release 4.0.3 (R Foundation for Statistical Computing, Vienna).
ETHICS STATEMENT
In this study, the dataset was constructed according to HIPAA-compliant processes. An IQVIA-patented, proprietary encryption algorithm created a unique patient identification number based on actual patient information (first name, last name, date of birth, gender, and zip code). This encryption tool was deployed across IQVIA’s data suppliers (ie, LAAD and Experian in this study) to deidentify patient data at the source. The data subsequently underwent a deterministic matching algorithm process, which used actual patient information, to be assigned a unique and persistent IQVIA patient identification number, which was used to match patients between LAAD and Experian Marketing Solutions, LLC, consumer data. This matching algorithm achieved a balance between false-positive (~2%) and false-negative (~3%) rates. Ethics approval was not required because the study was conducted using HIPAA-compliant, deidentified data.
Results
STUDY POPULATION
Of the 72,548,472 unique patients in the LAAD database, 7,211,361 were eligible for copay card utilization or CAP exposure analyses (Figure 1). The population for copay card analysis included 4,073,599 patients whose data contributed to the multivariable logistic regression model (Figure 1). The population for CAP analysis included 172,374 patients who met inclusion criteria (0.24% of the initial total LAAD database); these patients’ data contributed to the multinomial logistic regression model.
COPAY CARD UTILIZATION BY RACE AND ETHNICITY
Of 4,073,599 patients in the copay card analysis, 1,257,931 patients (30.9%) were classified as copay card users. The demographic distribution of the primary comparison cohorts (White vs non-White patients) for copay card users and non–copay card users, overall and across each therapeutic area studied, is included in Supplementary Table 4. Among non-White patients (n = 805,211), 232,552 (28.9%) were copay card users. Among White patients (n = 3,268,388), 1,025,379 (31.4%) were copay card users. In adjusted analyses, there was no significant difference in use vs nonuse of copay cards between non-White patients and White patients (odds ratio [OR] = 0.995, 95% CI = 0.99-1.00; P = 0.0964) (Figure 2) when adjusting for covariates.
FIGURE 2.
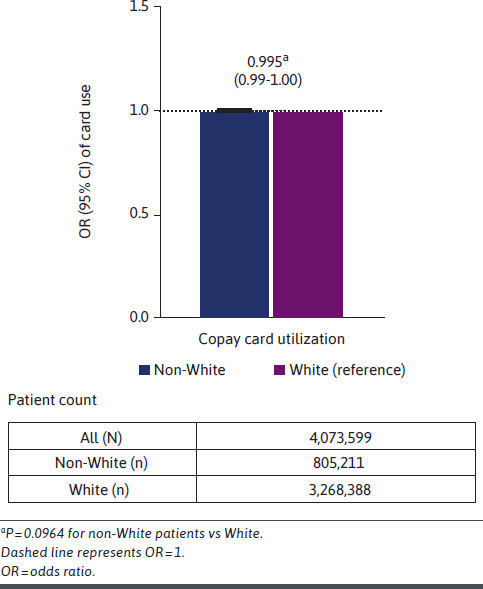
OR of the Likelihood of Copay Card Utilization for Non-White Patients vs White Patients (Adjusted)
CAP EXPOSURE BY RACE AND ETHNICITY
Of 172,374 patients in the CAP analysis, 15,654 (9.1%) patients were exposed to CAPs; 7,298 (4.2%) were classified as maximizers, 8,356 (4.8%) as accumulators, and 156,720 (90.9%) as “neither” (Figure 1). Among non-White patients (n = 28,706), 3,124 (10.9%) were exposed to CAPs. Among White patients (n = 143,668), 12,530 (8.7%) were exposed to CAPs. Non-White patients (n = 28,706; 16.7%) were significantly more likely to be exposed to CAPs as either maximizers (OR = 1.27, 95% CI = 1.22-1.33; P < 0.0001) or accumulators (OR = 1.31, 95% CI = 1.26-1.36; P < 0.0001) (Figure 3) compared with White patients (n = 143,668; 83.3%). Results were adjusted for the same covariates as with the copay prevalence comparisons.
FIGURE 3.

OR of the Likelihood of CAP Exposure for Non-White Patients vs White Patients (Adjusted)
Discussion
This adjusted analysis examined the copay card utilization and CAP exposures and differences between non-White patients and White patients across a range of therapeutic areas for which copay cards and CAPs are commonly implemented. To our knowledge, this is the first study evaluating copay card utilization and CAP exposure by patient demographics, particularly for historically marginalized populations, while accounting for other patient characteristics. Our results showed that there was no significant difference in copay card utilization between non-White patients and White patients. However, compared with White patients, non-White patients were significantly more likely to be exposed to CAPs as either maximizers or accumulators.
A recent online MarketWatch article succinctly highlights the potential patient issues related to CAP exposure.22 The article suggests that the CAP plan provisions are opaque to patients and difficult for them to avoid, even in situations in which there are no less expensive therapeutic alternatives to a prescribed medication, leaving patients unknowingly exposed to high levels of cost sharing and burden. Our current research suggests this exposure may be borne disproportionally by historically marginalized populations. As for consequences, a study by Sherman et al6 suggests that CAP implementation leads to significant reductions in autoimmune specialty-drug adherence and persistence. Related to the potential to increased patient cost sharing, Chandra et al, in a National Bureau of Economic Research working paper,23 demonstrated that whereas random increases in OOP costs of as little as $10.41 per drug caused a 22.6% drop in total drug consumption, it also caused a 32.7% increase in monthly mortality, which was traced to cutbacks in life-saving medications. Furthermore, in a retrospective analysis, Lewey et al24 demonstrated that reducing copayments for statins improved adherence rates, particularly among communities with higher proportions of Black residents (6%; P < 0.0001).
Combining these potential implications of cost burden as a result of CAP application and differential CAP exposure, as found in this study, risks further exacerbation of the effects of health plan designs and cost sharing on historically marginalized racial and ethnic groups.25
LIMITATIONS
This study has a number of important limitations. First, matching patients across 2 different databases may have excluded some patients of interest. In these analyses, this would have biased the results only in the event that the methodologic approach differentially excluded non-White populations. Second, although a proxy for continuous enrollment was used in the study, specific enrollment data cannot be definitively ascertained in the study database, which is often the case with claims-based datasets. Third, given the sample used, the study results may not be generalizable (1) beyond the prespecified therapeutic areas included in the current analysis, (2) at the level of each individual therapeutic area, (3) beyond those younger than 65 years (as data on patients aged 65 years or older were unreliable/incomplete, and, hence, these patients were excluded from the study), or (4) beyond the commercially insured population based on the selected product sample used. Fourth, the study results may be affected by confounding factors (eg, disease severity, comorbidities, and work-type specifics) that were not explicitly captured in the study, although the prior year’s drug cost served as a surrogate for severity/comorbidities. Commercially insured patients were assumed to be employed; however, employer-level data were not available for this study. Fifth, the primary research question sought to compare CAP exposure and is, by necessity, only applicable within the subset of the population that uses a copay card. Last, classifying patients per therapeutic area using National Drug Code numbers vs diagnosis codes may lead to some misclassification, similar to that associated with compiled vs self-reported consumer marketing attributes data. CAP flagging also requires visibility into a minimum number of claims and full cost data, which had an effect on sample size. Although we have used all available financial information, including known details of product-specific copay assistance programs, to assign CAP exposure, and because PBMs and payers do not explicitly identify maximizers and accumulators within the IQVIA LAAD dataset, there remains risk of some CAP misclassification. Some of these limitations could potentially underrepresent CAP prevalence, although we found no clear indication that there is systematic underrepresentation in one population of interest vs the other (eg, non-White vs White) that may impact the primary research question.
Conclusions
This real-world, retrospective, adjusted analysis provided first-of-its-kind evidence that copay card use is not associated with race and ethnicity disparities and that CAP exposure is significantly higher among non-White patients. Non-White patients may therefore be disproportionately impacted by a net financial loss of copay assistance, resulting in unintended clinical and economic consequences. There is currently a national call to action to implement policies to reduce racial and ethnic health disparities. Thus, the CAP exposure risks identified here, including the lack of differential use of copay assistance by race and ethnicity and negative equity effects from CAP exposure, should warrant their reconsideration.
ACKNOWLEDGMENTS
This study was sponsored by Janssen Scientific Affairs, LLC. The authors thank Patrick Mayne, a previous employee of IQVIA, for analysis support. Medical writing support was provided by Panita Maturavongsadit, PhD, of Lumanity Communications Inc., and was funded by Janssen Scientific Affairs, LLC.
REFERENCES
- 1.Goldman DP, Joyce GF, Zheng Y. Prescription drug cost sharing: Associations with medication and medical utilization and spending and health. JAMA. 2007;298(1):61-9. doi:10.1001/jama.298.1.61 [DOI] [PMC free article] [PubMed] [Google Scholar]
- 2.Shrank WH, Fox SA, Kirk A, et al. The effect of pharmacy benefit design on patient-physician communication about costs. J Gen Intern Med. 2006;21(4):334-9. doi:10.1111/j.1525-1497.2006.00402.x [DOI] [PMC free article] [PubMed] [Google Scholar]
- 3.Kaiser Family Foundation. Employer health benefits: 2020 summary of findings. Accessed October 24, 2022. https://files.kff.org/attachment/Summary-of-Findings-Employer-Health-Benefits-2020.pdf
- 4.Wedell K. Is prescription copay assistance contributing to rising drug prices? Why buyers should beware. USA Today. Accessed November 16, 2022. https://www.usatoday.com/story/money/2022/11/01/prescription-copay-assistance-role-rising-drug-prices/10555488002/
- 5.Chernew M, Gibson TB, Yu-Isenberg K, Sokol MC, Rosen AB, Fendrick AM. Effects of increased patient cost sharing on socioeconomic disparities in health care. J Gen Intern Med. 2008;23(8):1131-6. doi:10.1007/s11606-008-0614-0 [DOI] [PMC free article] [PubMed] [Google Scholar]
- 6.Sherman BW, Epstein AJ, Meissner B, Mittal M. Impact of a co-pay accumulator adjustment program on specialty drug adherence. Am J Manag Care. 2019;25(7):335-40. [PubMed] [Google Scholar]
- 7.Howard DH. Drug companies’ patient-assistance programs--helping patients or profits? N Engl J Med. 2014;371(2):97-9. doi:10.1056/NEJMp1401658 [DOI] [PubMed] [Google Scholar]
- 8.Dafny LS, Ody CJ, Schmitt MA. Undermining value-based purchasing - lessons from the pharmaceutical industry. N Engl J Med. 2016;375(21):2013-5. doi:10.1056/NEJMp1607378 [DOI] [PubMed] [Google Scholar]
- 9.Agarwal R, Gupta A, Fendrick AM. Value-based insurance design improves medication adherence without an increase in total health care spending. Health Aff (Millwood). 2018;37(7):1057-64. doi:10.1377/hlthaff.2017.1633 [DOI] [PubMed] [Google Scholar]
- 10.Norris HC, Richardson HM, Benoit MC, Shrosbree B, Smith JE, Fendrick AM. Utilization impact of cost-sharing elimination for preventive care services: A rapid review. Med Care Res Rev. 2022;79(2):175-97. doi:10.1177/10775587211027372 [DOI] [PubMed] [Google Scholar]
- 11.Choudhry NK, Bykov K, Shrank WH, et al. Eliminating medication copayments reduces disparities in cardiovascular care. Health Aff (Millwood). 2014;33(5):863-70. doi:10.1377/hlthaff.2013.0654 [DOI] [PubMed] [Google Scholar]
- 12.Walsh BS, Kesselheim AS. CAAP rule and prescription drug prices. Am J Manag Care. 2021;27(8):312-4. doi:10.37765/ajmc.2021.88613 [DOI] [PubMed] [Google Scholar]
- 13.American Society of Clinical Oncology. Policy brief: Copay accumulators and copay maximizers. Accessed October 14 2022. https://www.asco.org/sites/new-www.asco.org/files/content-files/advocacy-and-policy/documents/2021-AccumulatorsPolicyBrief.pdf
- 14.American Society of Clinical Oncology. Position statement: Copay accumulators and copay maximizers. Accessed October 14 2022. https://www.asco.org/sites/new-www.asco.org/files/content-files/advocacy-and-policy/documents/2021-CopayAccumulatorsStatement.pdf
- 15.Migliara G. Accumulator adjustment programs lead to surprise out-of-pocket costs and nonadherence, analysis finds. PhRMA Foundation. Accessed October 18, 2022. https://catalyst.phrma.org/accumulator-adjustment-programs-lead-to-surprise-out-of-pocket-costs-and-nonadherence-analysis-finds [Google Scholar]
- 16.Ford C. Copay accumulators and the impact on patients. Xcenda. Accessed October 18, 2022. https://www.xcenda.com/insights/copay-accumulators-and-the-impact-on-patients [Google Scholar]
- 17.IQVIA. Medicine spending and affordability in the U.S.: Understanding patients’ costs for medicines. Updated August 4, 2020. Accessed May 30, 2023. https://www.iqvia.com/insights/the-iqvia-institute/reports/medicine-spending-and-affordability-in-the-us
- 18.Ober NS, Grubmuller J, Farrell M, et al. System and method for generating de-identified health care data. US Patent 6,732,113/7,376,677. United States Patent and Trademark Office. January 4, 2011. [Google Scholar]
- 19.Zubeldia K, Romney GW. Anonymously linking a plurality of data records. US Patent 6,397,224. United States Patent and Trademark Office. May 28, 2002. [Google Scholar]
- 20.Kaiser Family Foundation. 2022. Employer health benefits survey. Updated October 27, 2022. Accessed May 30, 2023. https://www.kff.org/health-costs/report/2022-employer-health-benefits-survey/
- 21.US Centers for Medicare & Medicaid Services. Out-of-pocket maximum/limit. Accessed May 30, 2023. https://www.healthcare.gov/glossary/out-of-pocket-maximum-limit/
- 22.Laise E. War over drug-cost assistance traps sickest patients in the middle. MarketWatch. Accessed January 6, 2023. https://www.marketwatch.com/story/war-over-drug-cost-assistance-traps-sickest-patients-in-the-middle-11664818784
- 23.Chandra A, Flack E, Obermeyer Z. The health costs of cost-sharing. National Bureau of Economic Research. Accessed January 6, 2023. https://www.nber.org/papers/w28439 [DOI] [PMC free article] [PubMed] [Google Scholar]
- 24.Lewey J, Shrank WH, Avorn J, Liu J, Choudhry NK. Medication adherence and healthcare disparities: Impact of statin co-payment reduction. Am J Manag Care. 2015;21(10):696-704. [PubMed] [Google Scholar]
- 25.Straw T. Trapped by the Firewall: Policy changes are needed to improve health coverage for low-income workers. Center on Budget and Policy Priorities. Updated December 3, 2019. Accessed December 3, 2019. https://www.cbpp.org/research/health/trapped-by-the-firewall-policy-changes-are-needed-to-improve-health-coverage-for [Google Scholar]