

Abstract
Further advances in cell engineering are needed to increase the efficacy of chimeric antigen receptor (CAR) and other T cell-based therapies1–5. As T cell differentiation and functional states are associated with distinct epigenetic profiles6,7, we hypothesized that epigenetic programming may provide a means to improve CAR T cell performance. Targeting the Ten-Eleven Tranlocation-2 (TET2)8 epigenetic regulator presents an interesting opportunity as its loss may enhance T cell memory9,10, albeit not cause malignancy9,11,12. Here we show that TET2 disruption enhances T cell-mediated tumour rejection in leukaemia and prostate cancer models. However, TET2 loss also enables antigen-independent CAR T cell clonal expansions that may eventually result in prominent systemic tissue infiltration. These clonal proliferations require bi-allelic TET2 disruption and sustained expression of the AP-1 factor, BATF3, to drive a MYC-dependent proliferative program. This proliferative state is associated with reduced effector function that differs from both canonical T cell memory13,14 and exhaustion15,16 states, and is prone to the acquisition of secondary somatic mutations, establishing TET2 as a guardian against BATF3-induced CAR T cell proliferation and ensuing genomic instability. Our findings illustrate the formidable potential of epigenetic programming to enhance T cell immunity but highlight the risk of unleashing unchecked proliferative responses.
CARs are synthetic receptors for antigens that instruct T cell specificity and augment anti-tumour functions2,4. CAR T cell therapy for relapsed and refractory acute lymphoblastic leukaemia, non-Hodgkin lymphoma and multiple myeloma yields a high rate of complete responses, although a large fraction of patients will eventually relapse from their disease3,17. Novel strategies are needed to augment the overall efficacy of CAR T cells to prevent these relapses and tackle solid tumour therapy2,3,18. We hypothesized that epigenome programming could act in concert with CARs to promote CAR T cell activity by supporting T cell proliferation and functional persistence. TET2 is a member of the TET family of epigenetic regulators that successively oxidize 5-methyl cytosine (5mC) in DNA19. A study in T cell receptor transgenic mice9 and a case report of a leukaemia patient with a hypomorphic TET2 allele treated with CAR T cells10 suggest that TET2 loss may enhance T cell responses. Mutations in TET2 are frequent in myeloid and lymphoid malignancies but are not sufficient to establish a malignant state20–22. Here we report unexpected antigen-independent clonal expansions of CAR T cells lacking TET2, which is dependent on sustained BATF3 expression.
Impact of TET2 on CAR T cell efficacy
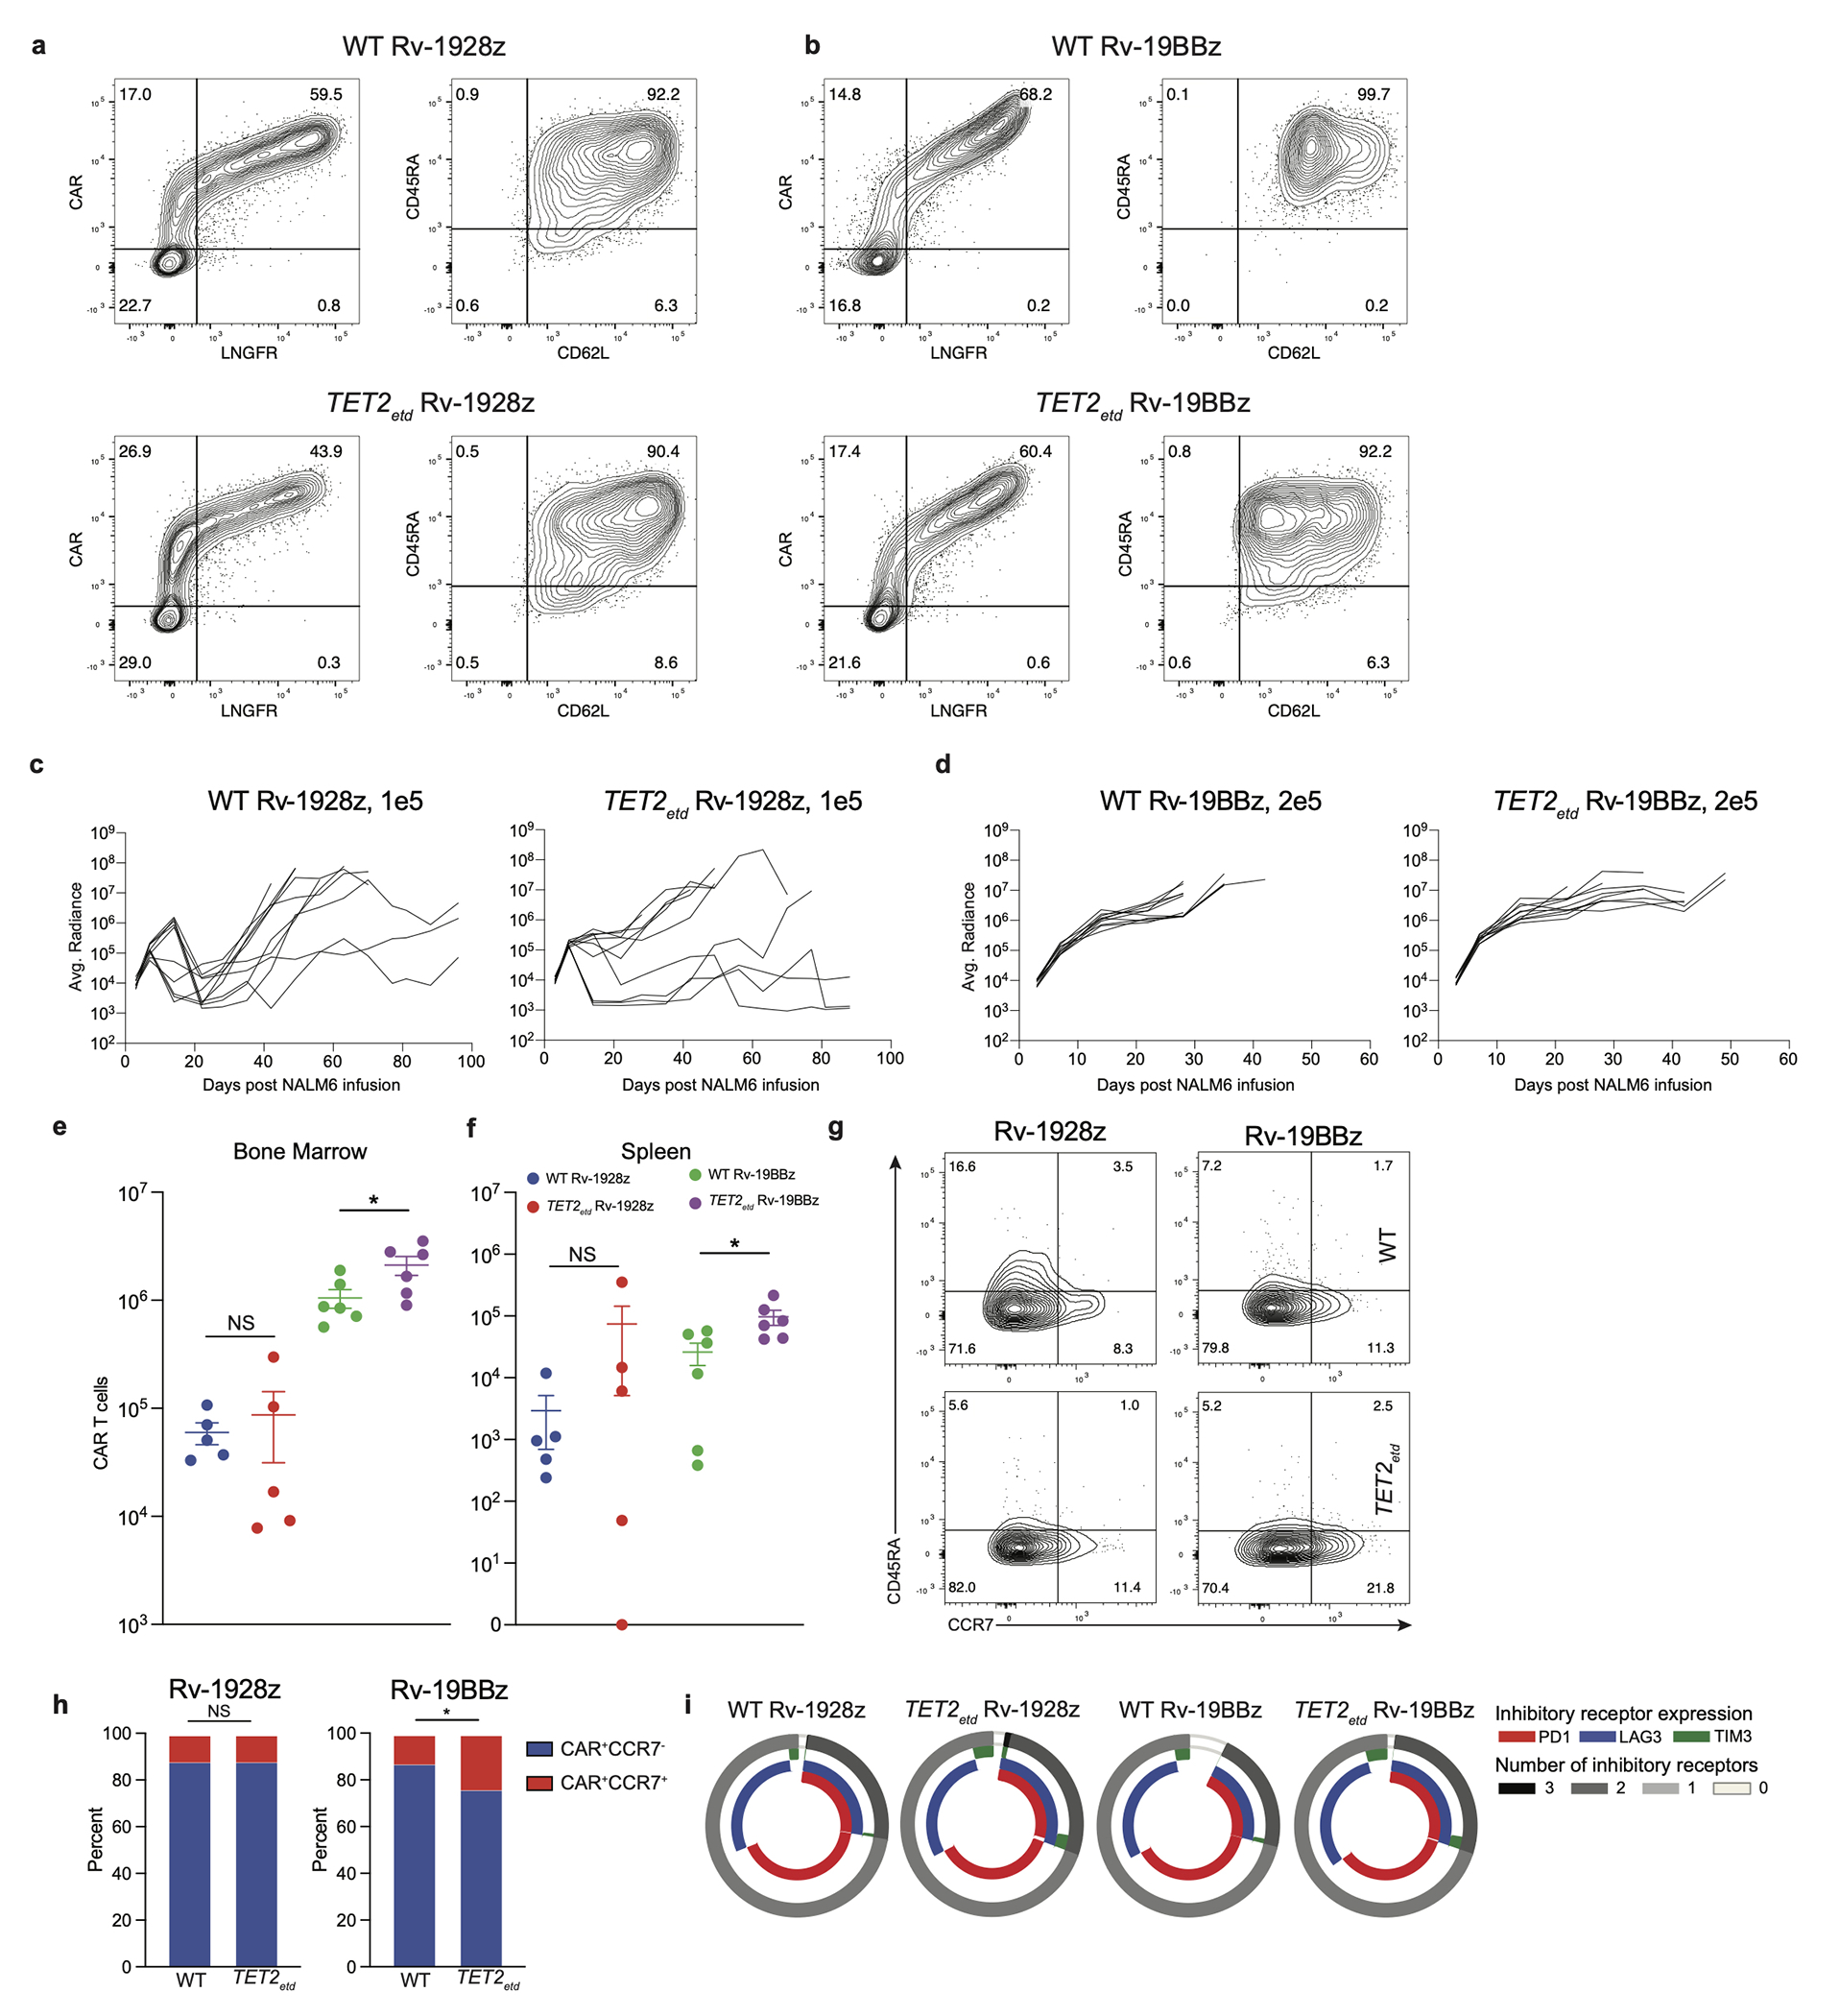
To assess the impact of TET2 on CAR T cell efficacy, we disrupted TET2 in human T cells before retrovirally transducing them with either FDA-approved CD28 or 4-1BB-based CD19 CARs, hereafter designated Rv-1928z and Rv-19BBz, and compared their activity in the well-established B cell acute lymphoblastic leukaemia (B-ALL) NALM6 model in NSG mice (Fig. 1a). Human peripheral blood T cells typically showed a CRISPR/Cas9-mediated TET2 editing efficiency of ~67% (Fig. 1b) and retroviral CAR transduction efficiency on the order of ~50%. No discernable phenotypic differences were observed between infused edited and control CAR T cells (Extended Data Fig. 1a, b). CAR T cells were administered at low doses to better compare their anti-tumour efficacy (“stress test” condition23). TET2-edited Rv-19BBz CAR T cells afforded greater survival of tumour-bearing mice than their unedited counterparts (Fig. 1d. Extended Data Fig. 1d). In contrast, no survival difference was observed between recipients of TET2-edited or unedited Rv-1928z CAR T cells (Fig. 1c. Extended Data Fig. 1c). Flow cytometric quantification and phenotyping of CAR T cells isolated from bone marrow and spleen 3 weeks after their infusion revealed no significant difference in quantity (Extended Data Fig. 1e, f) and differentiation state (Extended Data Fig. 1g, h) between Rv-1928z CAR T cells. TET2-edited Rv-19BBz CAR T cells, on the contrary, were more abundant than their unedited counterparts (Extended Data Fig. 1e, f). TET2-edited CAR T cells showed increased CCR7 expression in Rv-19BBz but not in Rv-1928z CAR T cells (Extended Data Fig. 1g, h), while inhibitory receptor expression (PD1, LAG3 and TIM3) was indistinguishable between unedited and TET2-edited groups for both CAR designs (Extended Data Fig. 1i). Intrigued by the different outcome between the two CARs, we further evaluated the 28z CAR in two distinct contexts that extend 1928z CAR T cell persistence, by either co-expressing 4-1BBL (Rv-1928z+41BBL)23 or by transcribing the CAR from the TRAC locus (TRAC-1928z)24 (Fig. 1a). As with Rv-1928z and Rv-19BBz, TET2 editing did not affect CAR transduction efficiency or pre-infusion T cell phenotype of either CAR T cell populations (Extended Data Fig. 2a, b), but their efficacy was increased relative to their non-edited counterparts (Fig. 1e, f. Extended Data Fig. 2c, d). This increased efficacy was associated with increased CCR7 expression in Rv-1928z+41BBL and TRAC-1928z CAR T cells (Extended Data Fig. 2e, f). Although it did not reach statistical significance for Rv-1928z+41BBL (Extended Data Fig. 2f). Inhibitory receptor expression was similar between WT and TET2-edited groups for both, Rv-1928z+41BBL and TRAC-1928z CARs (Extended Data Fig. 2g. These findings thus established that TET2 disruption could augment therapeutic efficacy of either CAR, albeit depending on CAR expression.
Fig. 1: Effect of TET2 disruption on CAR T cell therapeutic efficacy is dependent on CAR design.
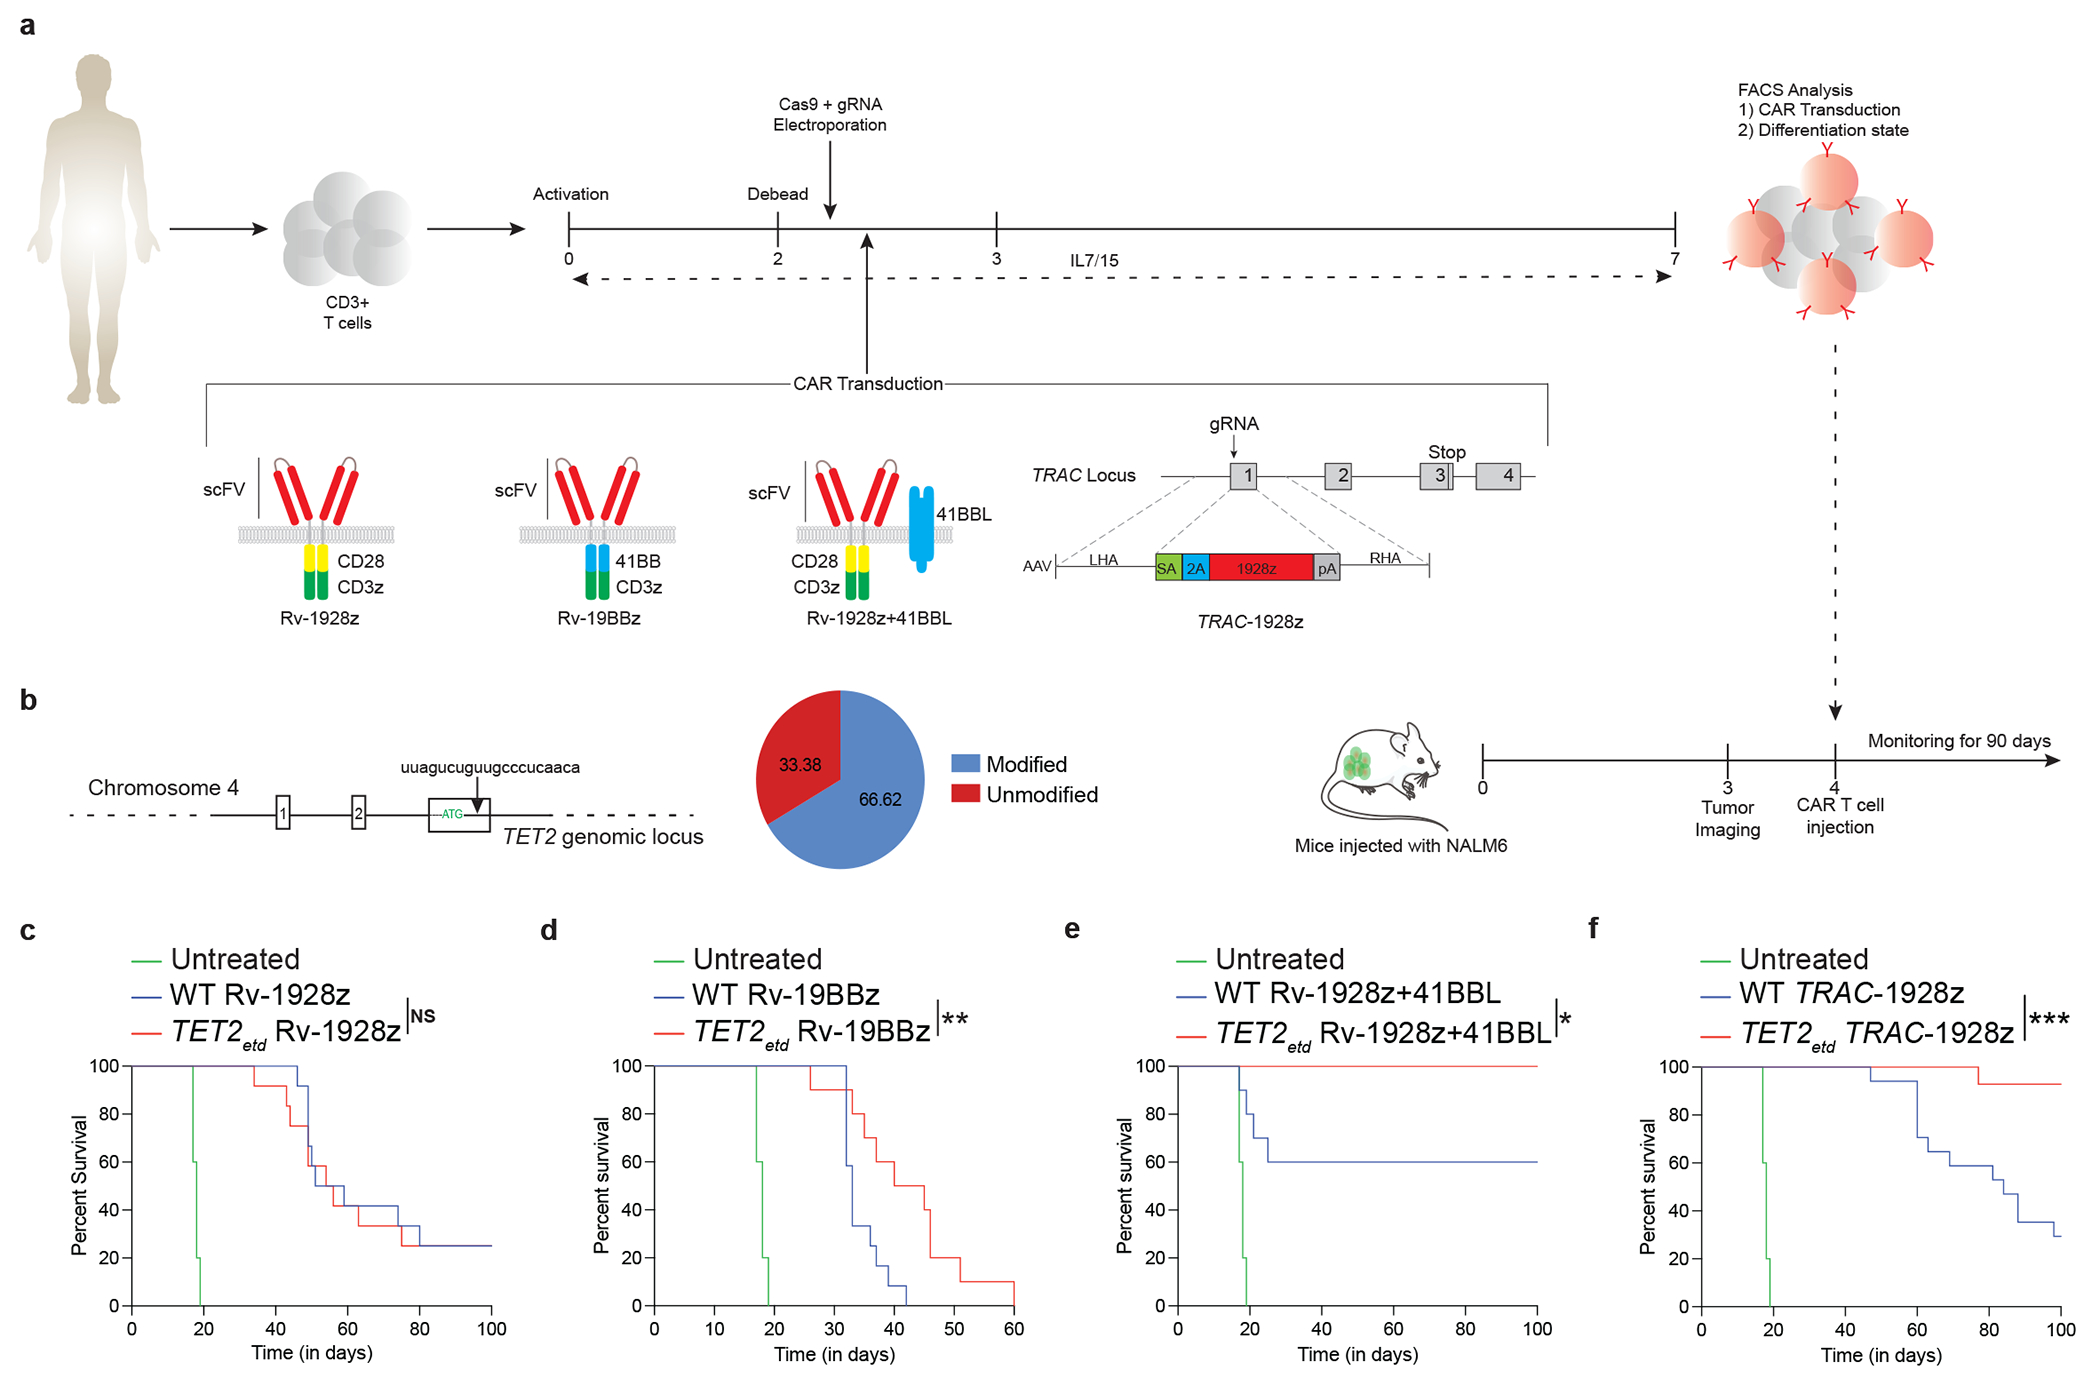
a,b, Schematics of in vitro CAR T cell generation and murine NALM6 model (a). TET2 targeting gRNA and editing efficiency (b). c,d, Mice survival under Rv-1928z (dose: 1e5, n=12) (c) and Rv-19BBz (dose: 2e5, n=12) (d) CAR T cell treatments. e,f, Cancer free survival of mice treated with Rv-1928z+41BBL (dose: 5e4, n=10) (e) and TRAC-1928z (dose: 1e5, n=15) (f) CAR T cells. Data collated from 2 donors. Untreated (n=5). log-rank Mantel–Cox test, p<0.05 was considered statistically significant. p values are denoted: p>0.05, not significant, NS; *, p<0.05; **, p< 0.01; ***, p<0.001 (c-f).
Hyper-proliferative CAR T cells emerge
Continued follow-up of these mice uncovered signs of clinical distress developing after 50 days in the absence of detectable tumour in mice treated with TET2-edited T cells (Fig. 2a. Extended Data Fig. 2c, 2d). Gross pathology revealed an enlarged spleen and liver, pale kidneys, and lungs with extensive T cell infiltration and absence of CD19+ leukaemia. The infiltrating T cells were CAR+ and Ki67+ (Fig. 2b). This prompted us to treat additional cohorts of mice with all four CAR T cell types (Rv-19BBz, Rv-1928z, Rv-1928z+41BBL, TRAC-1928z), administering 2-5x10⁵ CAR T cells to ensure tumour elimination in most mice to allow for long-term follow-up of all 4 groups (Fig. 2c). All CARs maintained long-term tumour remission, with recipients becoming negative by BLI within 2-3 weeks of CAR T cell administration. Mice treated with Rv-CARs were euthanized on day 90 and TRAC-CAR T cells recipients on day 75. Bone marrow and splenic CAR T cell numbers were considerably elevated in mice treated with TET2-edited Rv-19BBz, Rv-1928z+41BBL and TRAC-1928z CAR T cells, compared to their unedited counterparts (Fig. 2d). CAR T cell numbers in recipients of TET2-edited and unedited Rv-1928z in both bone marrow and spleen, however, did not significantly differ (Fig. 2d), except for a single mouse (1 out of 10) that showed an increase in TET2-edited CAR T cells. Flow cytometric analysis of CAR T cells isolated from bone marrow confirmed increased CCR7 expression in TET2-edited Rv-19BBz, Rv-1928z+41BBL and TRAC-1928z CAR T cells, but not in TET2-edited Rv-1928z CAR T cells (Extended Data Fig. 3a, b). Inhibitory receptor expression was again unchanged upon TET2 editing across all 4 CAR designs (Extended Data Fig. 3c). This long-term follow-up thus confirmed that TET2 editing increases therapeutic efficacy and T cell accumulation, but with pathological consequences appearing weeks or months after tumour clearance.
Fig. 2: Effect of CAR design on long term T cell accumulation upon CRISPR/Cas9 editing of TET2 locus.
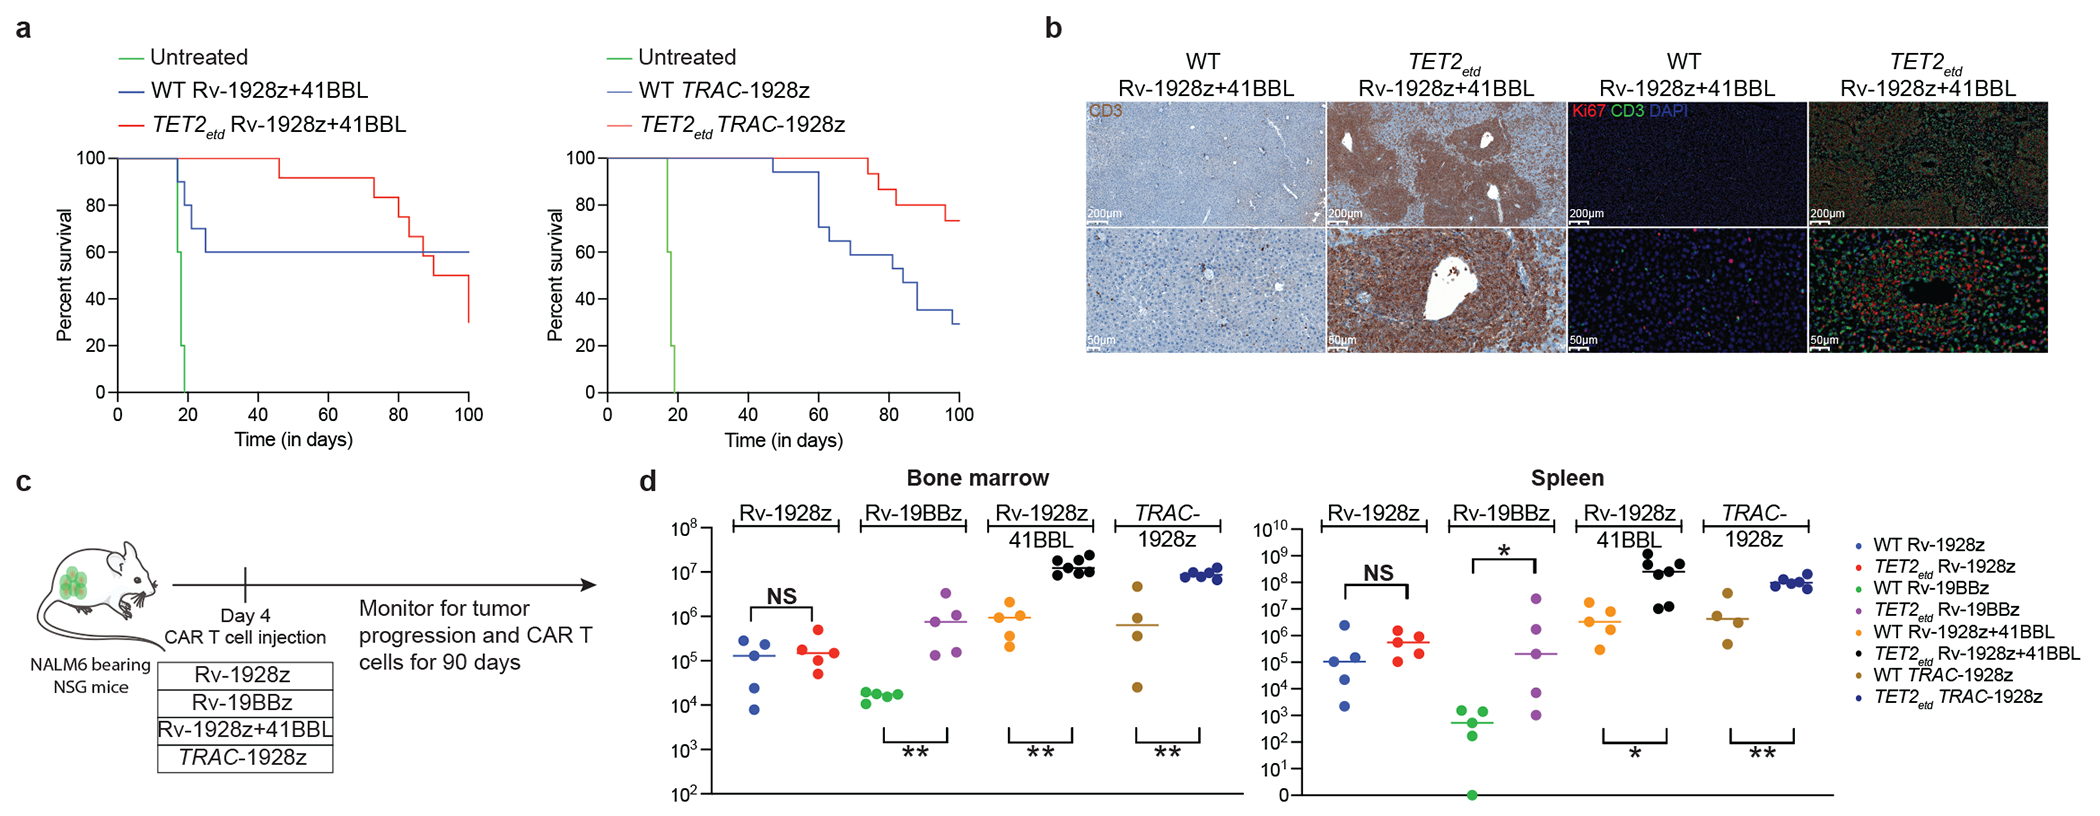
a, Overall survival of NALM6-bearing mice treated with Rv-1928z+41BBL (n=10) and TRAC-1928z (n=15). b, Immunohistochemistry (IHC) and Immunofluorescence (IF) staining of a liver section of mice treated with WT Rv-1928z+41BBL and TET2etd Rv-1928z+41BBL at day 90. Across 4 CARs, IHC and IF were performed for 15 mice treated with WT CAR T cells and 20 mice treated with TET2etd CAR T cells. c, Schematics of long-term CAR T cell and tumor monitoring. Rv-1928z were used at 4e5, Rv-19BBz were used at 5e5, Rv-1928z+ 41BBL were used at 2e5 and TRAC-1928z CAR T cells were used at 4e5 dose. d, CAR T cell quantification in the bone marrow (left panel) and spleen (right panel). Bars show median values. Two-sided Mann-Whitney test [n=5 (Rv-1928z), n=5 (Rv-19BBz), n=5 (WT Rv-1928z+41BBL), n=7 (TET2etd Rv-1928z+41BBL), n=4 (WT TRAC-1928z), n=5 (TET2etd TRAC-1928z)]. p<0.05 was considered statistically significant. p values are denoted: p>0.05, not significant, NS; *, p<0.05; **, p< 0.01. Exact p values are available in SI Table 4 (d).
To ascertain that acquisition of this hyper-proliferative phenotype was not specific to a single tumour model or a particular gRNA, we established a human prostate cancer model in NSG mice (Extended Data Fig. 4a), targeting prostate-specific membrane antigen (PSMA) in PC3 bearing mice with PSMA-28z+41BBL CAR T cells. Peripheral blood PSMA-28z+41BBL CAR T cells edited with either gRNA-g1 or gRNA-g2 were 10-fold more abundant than control PSMA-28z+41BBL CAR T cells edited with a scrambled gRNA by day 30 (Extended Data Fig. 4b). Splenic CAR T cell quantification revealed over 100 million CAR T cells per spleen in recipients of TET2-edited PSMA-28z+41BBL by day 45 (Extended Data Fig. 4c), establishing that late acquisition of a hyper-proliferative phenotype is not specific to a tumour model or guide RNA.
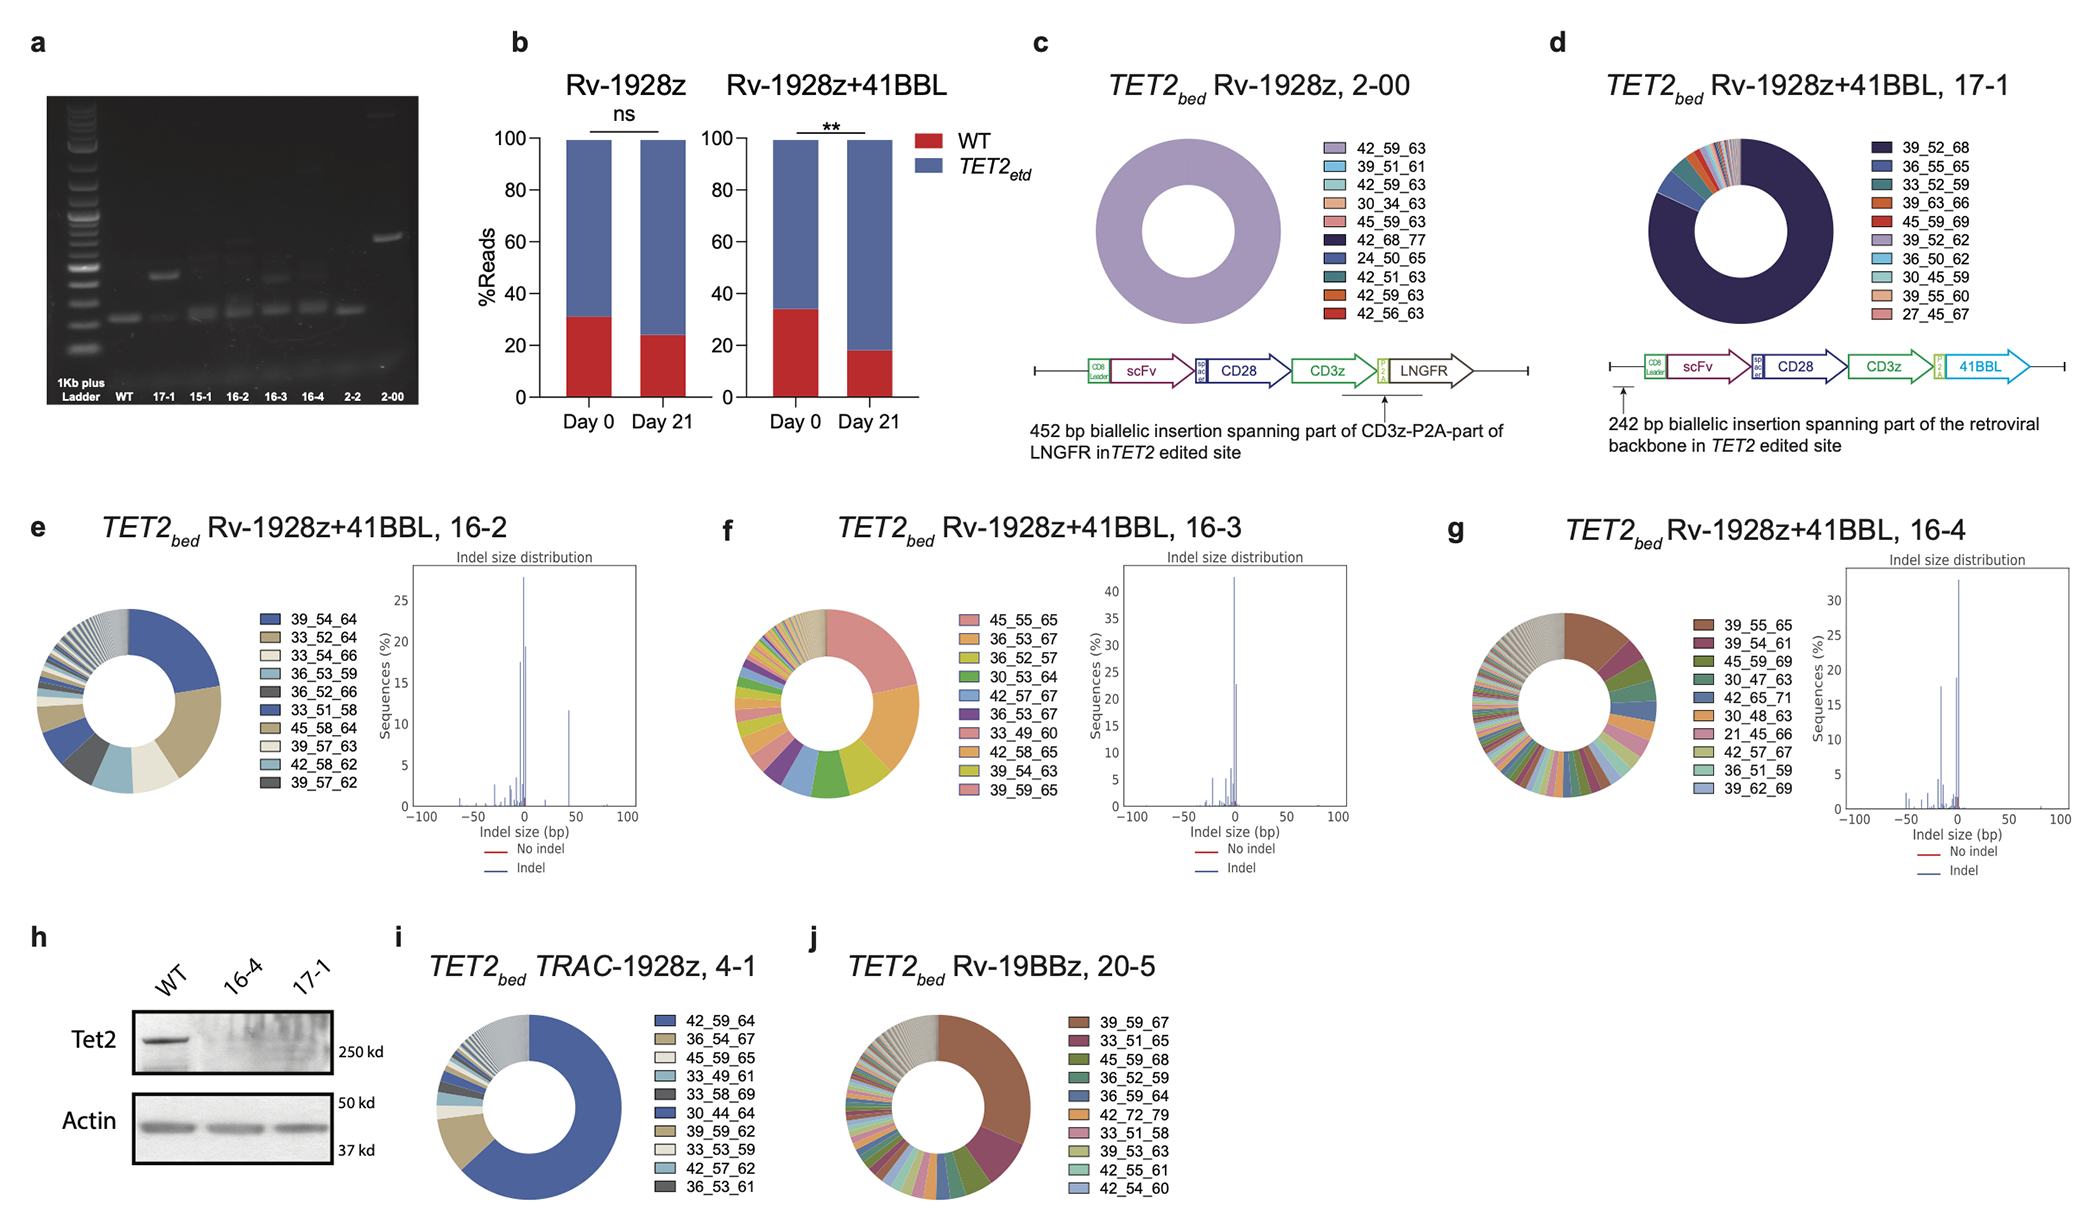
As Cas9-mediated TET2 editing resulted in either unedited, monoallelic or biallelic disruption in individual T cells, we could test whether total loss of TET2 is required for achieving sustained proliferation. For this analysis, we focused on two 19-28z CAR populations yielding different rates of T cell accumulation, Rv-1928z and Rv-1928z+41BBL (Extended Data Fig. 5a, 7a). Pre-infusion, Rv-1928z and Rv-1928z+41BBL CAR T cells showed similar TET2 editing efficiency (Fig. 3a, 3b). By day 21 post infusion, TET2-editing was enriched for Rv-1928z+41BBL but not Rv-1928z (Extended Data Fig. 5b). In subsequent follow-up, very high T cell counts were reached in 12/15 mice treated with TET2-edited Rv-1928z+41BBL, but only in 2 of 15 mice treated with TET2-edited Rv-1928z CART cells, becoming apparent by day 90 and 200. In these latter two cases (2-2 and 2-00), we found a 19bp deletion in both alleles in 2-2 (Fig. 3e) and a biallelic integration of a partial retroviral vector fragment in 2-00 (Extended Data Fig. 5c). Five of the expanded TET2-edited Rv-1928z+41BBL populations harvested at day 90 were randomly selected for analysis and all were found to be nearly entirely (>98%) biallelically TET2-edited (Fig. 3f. Extended Data Fig. 5d–g). Western blot analysis showed absence of TET2 protein in biallelically edited CAR T cells (Extended Data Fig. 5h). Thus, biallelic TET2 editing (TET2bed) is enriched over time, irrespective of CAR design, consistent with it being required for achieving a hyper-proliferative T cell state.
Fig 3: Hyper-proliferative TET2-edited CAR T populations are oligoclonal and biallelically edited for TET2.
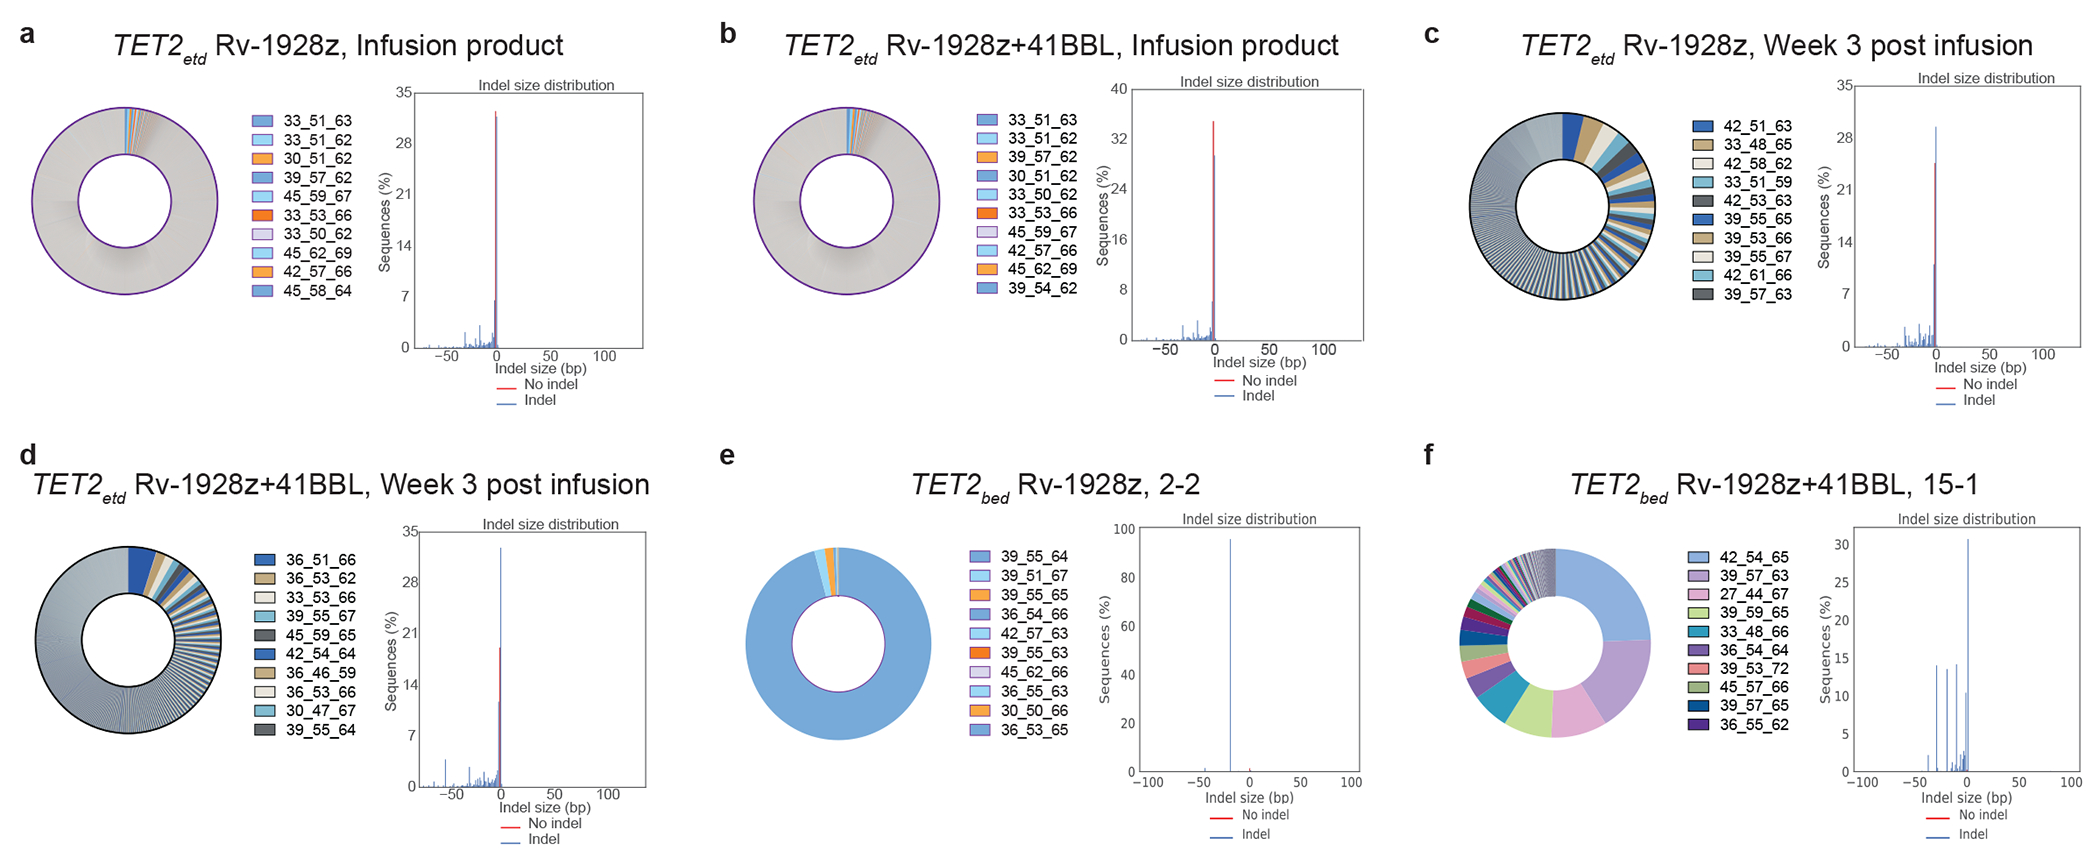
a,b, Pre-infusion TCRvβ sequencing (left panel) and TET2 status (right panel) of Rv-1928z (a) and Rv-1928z+41BBL (b). CAR T cells were generated from the same donor. c,d, TCRvβ sequencing (left panel) and TET2 status (right panel) of Rv-1928z (c) and Rv-1928z+41BBL (d). CAR T cells isolated at week 3 post infusion in mice. e,f, TCRvβ sequencing (left panel) and TET2 status (right panel) of hyper-proliferative Rv-1928z (e) and Rv-1928z+41BBL (f). CAR T cell population reveals multiple clones from the pre-infusion population can become hyper-proliferative but they require biallelic TET2 editing. Hyper-proliferative CAR T cells were isolated at day 90.
We assessed clonal composition in the hyper-proliferative CAR T cell populations by TCRvβ sequencing. All 5 Rv-1928z+41BBL populations were multiclonal, with no clone constituting >50% of the total CAR product, except for sample 17-1 where a single clone accounted for ~82% of the CAR T cells (Fig. 3f, Extended Data Fig. 5d–g). In contrast, both Rv-1928z populations (2-2 and 2-00) largely consisted in a single clone (>95%. Fig. 3e, Extended Data Fig. 5c), consistent with the lesser probability of 1928z CAR T cells achieving clonal expansion. TCRvβ sequencing of hyper-proliferative TRAC-1928z and Rv-19BBz also revealed multiclonal expansion (Extended Data Fig. 5i,j).
Lack of shared TCRs between different hyper-proliferative populations, absence of graft versus host disease (GVHD) in mice bearing hyper-proliferative CAR T cell population, and the emergence of clonal dominance in TRAC-1928z CAR T cell-treated mice (in which CAR T cells lack TCR expression24), strongly suggested that the TCR is not required for acquisition of a hyper-proliferative phenotype. To further exclude a role for TCR in sustained clonal expansion, we ablated TCR expression in conjunction with TET2 disruption before transduction of Rv-1928z+41BBL and compared the frequency of emergence of the hyper-proliferative phenotype in recipient mice. Long-term follow up of TCR+TET2-edited and TCR−TET2-edited Rv-1928z+41BBL CAR T cells revealed no differences in frequency of CAR T cells achieving a hyper-proliferative state and their differentiation state (Extended Data Fig. 6a–c), confirming that TCR is not required for sustained proliferation.
We hypothesized that the increased expansion and clonal diversity imparted by Rv-19BBz, 1928z+41BBL and TRAC-1928z, contrasting with that of Rv-1928z, owed to the CAR and not only the TET2 editing (Fig. 3e, f. Extended Data Fig. 5d–j). To this end, we introduced either Rv-1928z or Rv-1928z+41BBL in the same pool of TET2-edited T cells and compared the fate of common TCRvβ clonotypes expressing either CAR (Extended Data Fig. 7a). Pair-wise analysis of the same vβ clonotypes in different mice revealed major differences in clonal evolution between Rv-1928z and Rv-1928z+41BBL from day 0 (pre-infusion CAR T cells) to day 21 (Extended Data Fig. 7b, c). This divergent evolution is illustrated by tracking the persistence of the 100 most frequent clones in the Rv-1928z pre-infusion cell population, all of which were also present in the Rv-1928z+41BBL pre-infusion product (Extended Data Fig. 7d). By day 21, most (70/100) of these clones were still detected in Rv-1928z+41BBL CAR T cells, while only 3/100 were detectable in recipients of Rv-1928z CAR T cells (Extended Data Fig. 7d). Retro-tracking clones present in hyper-proliferative populations (day 90) to pre-infusion, we found few persisting clones for Rv-1928z in contrast to Rv-1928z+41BBL (Extended Data Fig. 7e, f), even though both Rv-1928z and Rv-1928z+41BBL had similar pre-infusion clonal diversity (Extended Data Fig. 7g). The difference between Rv-1928z and Rv-1928z+41BBL in their respective clonal longevity was further evidenced by tracking the 100 most frequent shared clones from the pre-infusion Rv-1928z and Rv-1928z+41BBL CAR populations up to day 90. None were detected in Rv-1928z (Extended Data Fig. 7h), whereas some of the earliest clones detected on day 0 in the Rv-1928z+41BBL population remained detectable by day 90 (Extended Data Fig. 7i) though they were not dominant (Extended Data Fig. 7j). These tracking data confirmed that the probability of a given clonotype acquiring a hyperproliferative phenotype upon TET2 loss is determined by the CAR and that the relative resistance imparted by Rv-1928z could be overcome upon engaging the 4-1BB pathway by overexpressing 4-1BBL.
Reduced effector function in CAR T cells
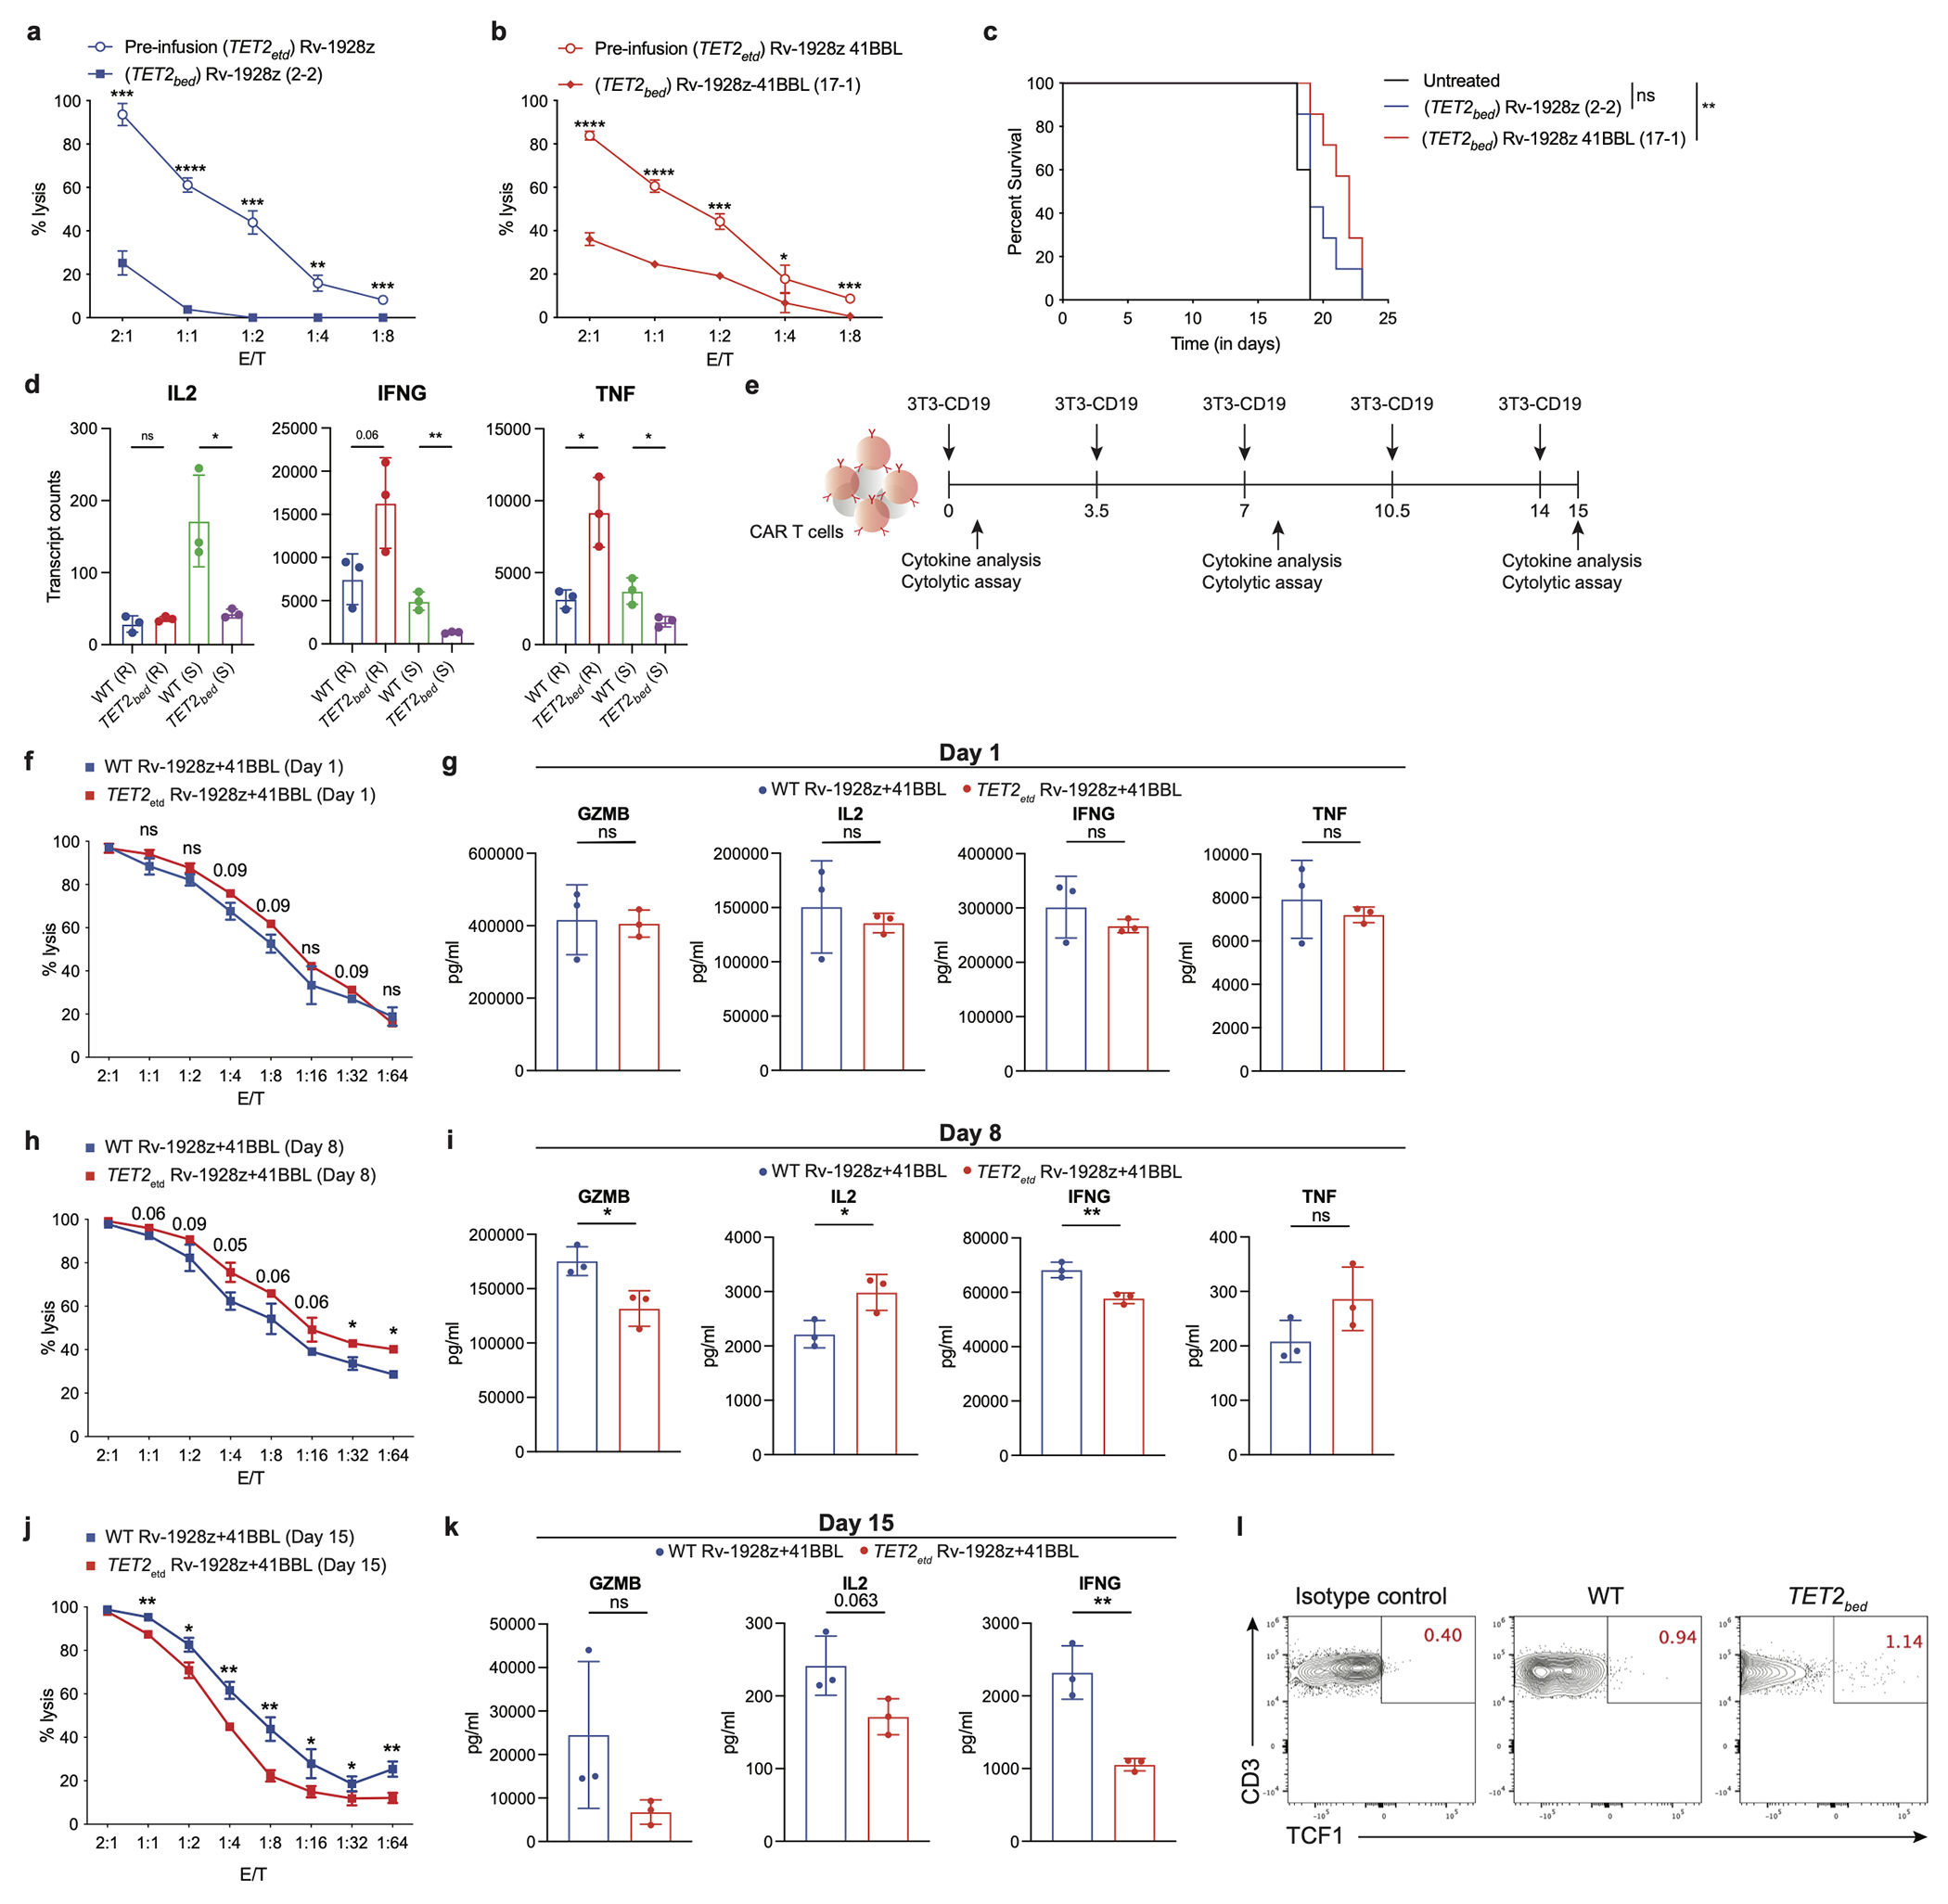
To assess the functional properties of the hyper-proliferative CAR T cell population, we first evaluated the cytolytic function of hyper-proliferative TET2bed CAR T cells in vitro and in vivo. TET2bed CAR T cells demonstrated diminished cytolytic ability and were relatively ineffective for eliminating established NALM6 in vivo (Extended Data Fig. 8a, b. Fig. 4a), requiring a higher CAR T cell dosage to delay tumour progression (Extended Data Fig. 8c). TET2bed CAR T cells, showed a profound loss of effector cytokine secretion upon activation (Fig. 4b). For further molecular characterization, we focused on Rv-1928z+41BBL CAR T cells since the unedited Rv-1928z+41BBL CAR T cells persisted the most among the 4 tested CAR designs and thus could provide a matched, unedited control. Transcriptional profiling of hyper-proliferative TET2bed and WT Rv-1928z+41BBL CAR T cells revealed an increased expression of cell cycle-related factors in the former (Fig. 4c, d). TET2bed Rv-1928z+41BBL CAR T cells demonstrated diminished effector cytokine induction upon activation (Fig. 4e, Extended Data Fig. 8d), which led us to further examine effector function in WT and TET2etd CAR T cells over multiple rounds of antigen stimulation (Extended Data Fig. 8e). Early on, TET2etd and WT CAR T cells displayed indistinguishable cytolytic capacity and effector cytokine secretion (Extended Data Fig. 8f–i). However, after multiple rounds of stimulation (5 stimulations over 14 days), TET2etd CAR T cells exhibited reduced cytolytic function and effector cytokine secretion in comparison to WT CAR T cells (Extended Data Fig. 8j, k). Collectively these observations establish that TET2 deficiency leads to a gradual erosion of effector function but predisposes to the emergence of TET2bed CAR T cell clones that are characterized by sustained proliferation, moderate cytolytic potential and poor cytokine responses.
Fig. 4: Loss of effector function in hyper-proliferative TET2bed CAR T cells.
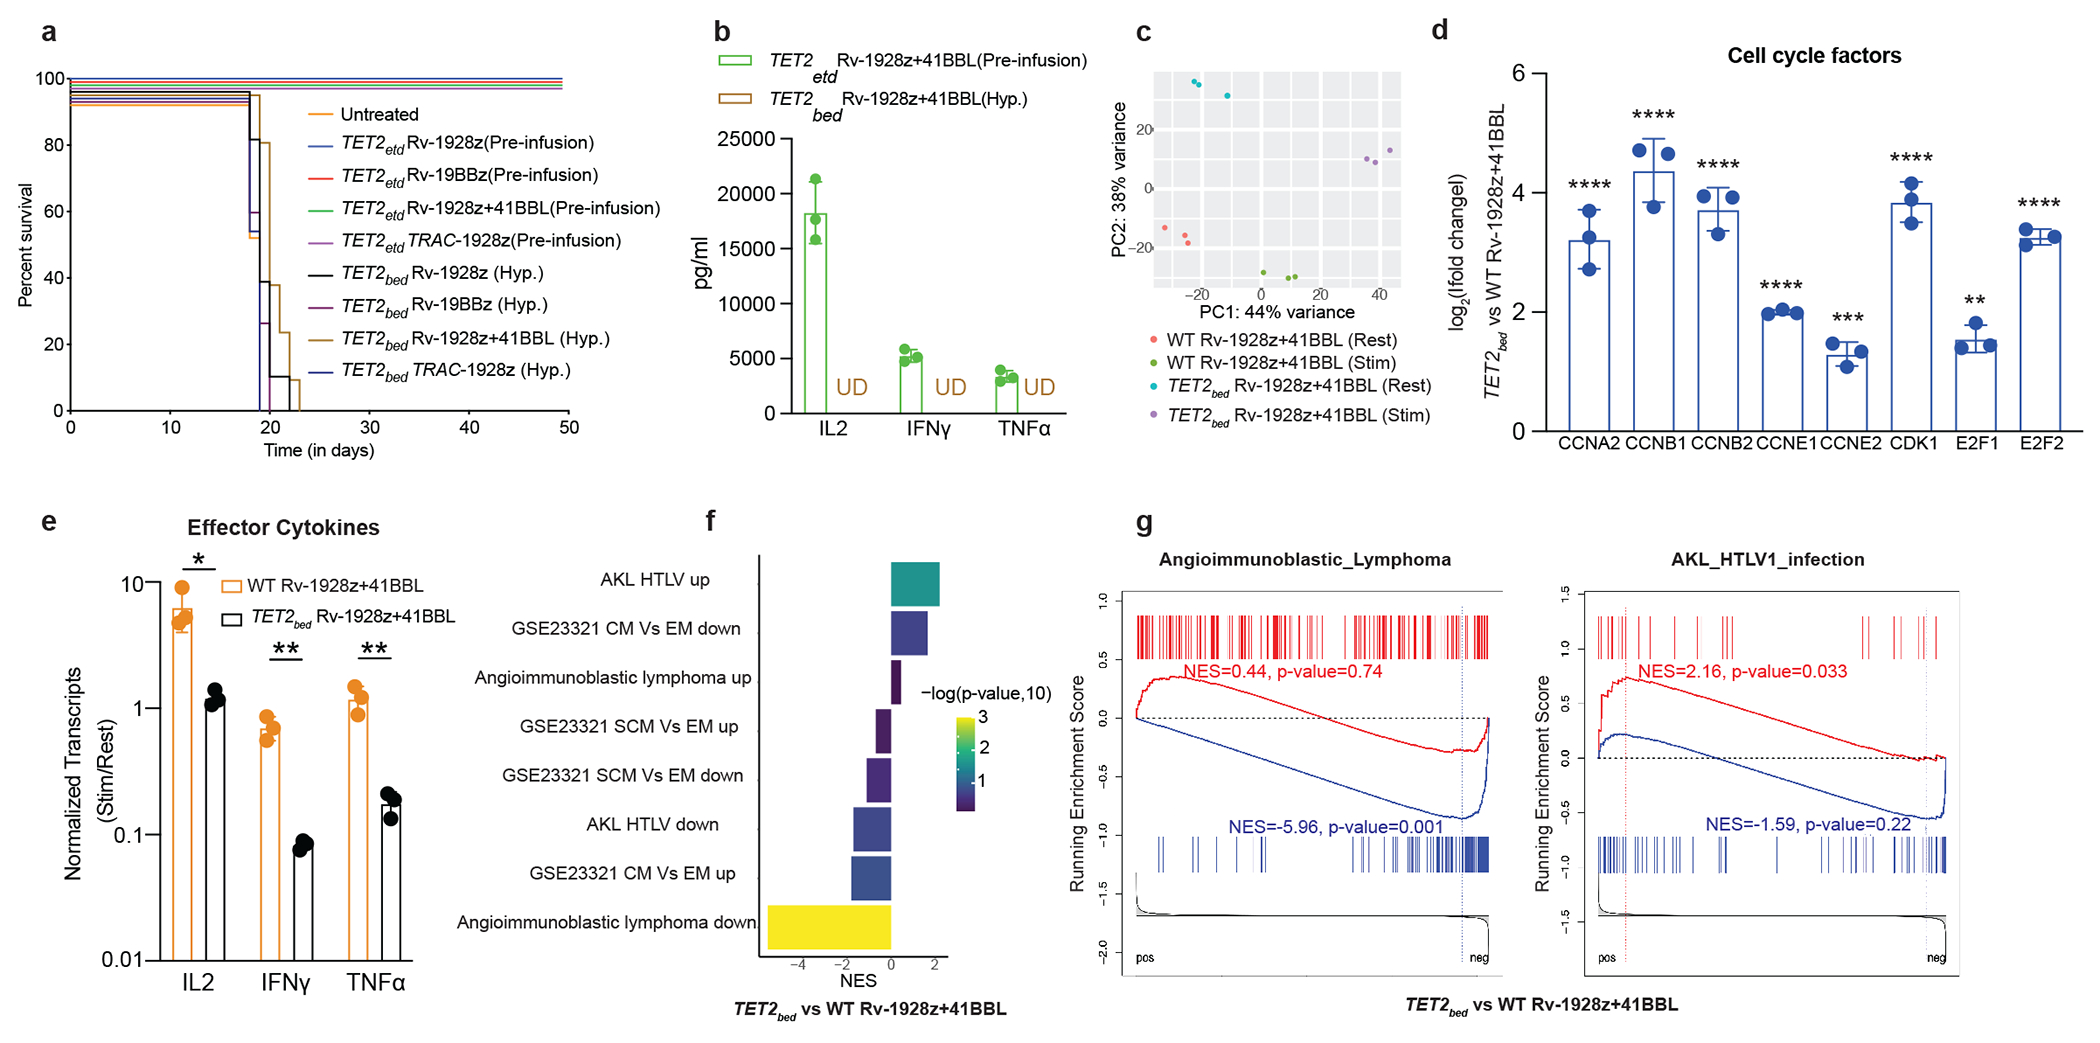
a, NALM6 bearing NSG mice were either treated with 5e5 hyper-proliferative TET2bed Rv-1928z (n=7), Rv-19BBz (n=3), Rv-1928z+41BBL (n=7) and TRAC-1928z (n=5) CAR T cells or pre-infusion TET2-edited Rv-1928z (dose: 4e5), Rv-19BBz (dose: 5e5), Rv-1928z+41BBL (dose: 2e5) and TRAC-1928z (dose: 4e5) (n=5 for all pre-infusion TET2-edited CAR T cells). b, Effector cytokine secretion upon activation of pre-infusion TET2-edited and hyper-proliferative Rv-1928z+41BBL population. Data is represented as mean±SD (n=3). c, Principal component analysis of resting and stimulated (24-hrs post co-culture with CD3/28 beads at 1:1 bead to cell ratio) of WT Rv-1928z+41BBL and TET2bed Rv-1928z+41BBL. d, Elevated levels of cell cycle factors in TET2bed Rv-1928z+41BBL as compared to WT Rv-1928z+41BBL. Data is represented as mean±SD (n=3). p values were determined by Wald test with FDR correction (two-sided). e, Reduced induction of effector cytokines in response to CD3/28 bead stimulation in TET2bed Rv-1928z+41BBL as compared to WT Rv-1928z+41BBL. Data is represented as mean±SD (n=3). p values were determined by two-sided t-test with FDR correction. f,g, Geneset enrichment analysis (GSEA) reveals no enrichment in central memory (CM) and stem cell memory (SCM) compartments for TET2bed Rv-1928z+41BBL as compared to WT Rv-1928z+41BBL (f). Enrichment in Angioimmun-oblastic Lymphoma (AITL) and HTLV-1 driven Adult T cell lymphoma/leukemia genesets of TET2bed Rv-1928z+41BBL (g). p values in f, g were corrected for multiple comparisons by BKY method. p<0.05 was considered statistically significant. p values are denoted: p>0.05, not significant, NS; *, p<0.05; **, p< 0.01; ***, p<0.001; ****, p<0.0001. Exact p values are available in SI Table 4.
Consistent with this functional profile, we did not find expression of the memory associated transcription factor, TCF1 (Extended Data Fig. 8l), or an enrichment of memory gene sets in TET2bed compared to WT Rv-1928z+41BBL (Fig. 4f), despite the increased expression of some memory-associated biomarkers such as CCR7. Instead, we found enrichment in angioimmunoblastic T cell lymphoma (AITL) and HTLV1 T cell leukaemia/lymphoma datasets (Fig. 4g). This led us to search for potential genetic drivers of proliferation and investigate the proliferative potential of TET2bed CAR T cells upon secondary transplant.
BATF3 drives hyper-proliferation
To assess whether TET2bed clones harboured acquired mutations that could account for their clonal dominance, we performed whole exome sequencing in three clones expressing different CARs (Extended Data Fig. 9a, c, e). Numerous non-synonymous point mutations were observed in all 3 dominant clones (Extended Data Fig. 9b, d, f). Analysis of translocations for these 3 samples only identified CAR (CD28/CD3z) fusions (Supplementary Information [SI] Table 1). Some chromosomal amplifications and mega-base scale deletions were observed in a subset of the dominant clone population in samples 17-1 and 4-1 (Extended Data Fig. 9a, e). Given their substantially lower frequency compared to that of the dominant clone, these gross chromosomal defects appeared to be late occurring secondary events. For the retroviral encoded CARs in samples 17-1 and 2-2, we identified the sites of retroviral integration. None of them disrupted or integrated next to cancer-related genes associated with AITL or T cell lymphoma (SI Table 2). Altogether, we find that hyper-proliferative TET2bed T cells are prone to acquiring somatic mutations, but do not bear recurrent genetic mutations or mutations known to be associated with T cell malignancies.
Secondary transplant studies of TET2bed CAR T cells showed that they did not engraft on their own, but could persist with exogenous IL7/15 supplementation, promptly declining after cessation of cytokine administration (Extended Data Fig. 10a, b). Cell numbers remained modest and were barely detectable at day 150 when the study reached its intended end point (Extended Data Fig. 10c). These findings indicate that TET2bed CAR T cells are unable to autonomously sustain their proliferation upon secondary transplant.
The lack of a conserved genetic driver of proliferation of TET2bed CAR T cells prompted us to study whether their epigenetic state enables sustained proliferation. Assay for Transposase-Accessible Chromatin using sequencing (ATAC-seq) analysis revealed significant differences between accessible chromatin regions of WT and TET2bed Rv-1928z+41BBL CAR T cells (SI Fig. 1a). Activator protein (AP-1) family binding motif was the most significantly enriched motif in differentially open chromatin regions of TET2bed CAR T cells (Fig. 5a). Transcriptional analyses in these same cells revealed that, amongst the AP-1 factors, BATF3 was the most significantly upregulated in TET2bed CAR T (Fig. 5b). BATF3 has been previously implicated as a driver of proliferation in T cell leukaemia/lymphoma25–27 in part by inducing a MYC transcriptional program25,26. Distinct promoter and gene body regions of BATF3, with some encompassing consensus AP-1 binding motifs, were found to be more readily accessible in hyper-proliferative TET2bed Rv-1928z+41BBL CAR T cells compared to WT Rv-1928z+41BBL CAR T cells (Fig. 5 c, d. SI Fig. 1b). TET2bed Rv-1928z+41BBL CAR T cells showed a strong enrichment in hallmark MYC targets when compared to WT Rv-1928z+41BBL CAR T cells (Fig. 5e). Flow cytometric analyses of unedited and hyper-proliferative CAR T cells isolated at day 90 show higher fraction of BATF3+MYC+ in hyper-proliferative CAR T cells (Fig. 5f, g). Analysis of BATF3 and MYC expression upon TET2-editing in CAR T cells (SI Fig. 1c) revealed that CAR activation induced BATF3 expression (SI Fig. 1d). Interestingly, BATF3 and MYC levels did not differ between WT and TET2-edited CAR T cells at early time points (Day 1 and 8) (SI Fig. 1e), but increased after 5 rounds of stimulation (Day 15) in the TET2-edited group (BATF3, SI Fig. 1f; MYC, SI Fig. 1g). These observations suggests that TET2 deficiency gradually establishes an epigenetic state conducive to increased BATF3 and MYC expression that may ultimately result in the sustained proliferation of TET2bed CAR T cell clones.
Fig. 5: BATF3/MYC axis drives hyper-proliferation of TET2bed CAR T cells.
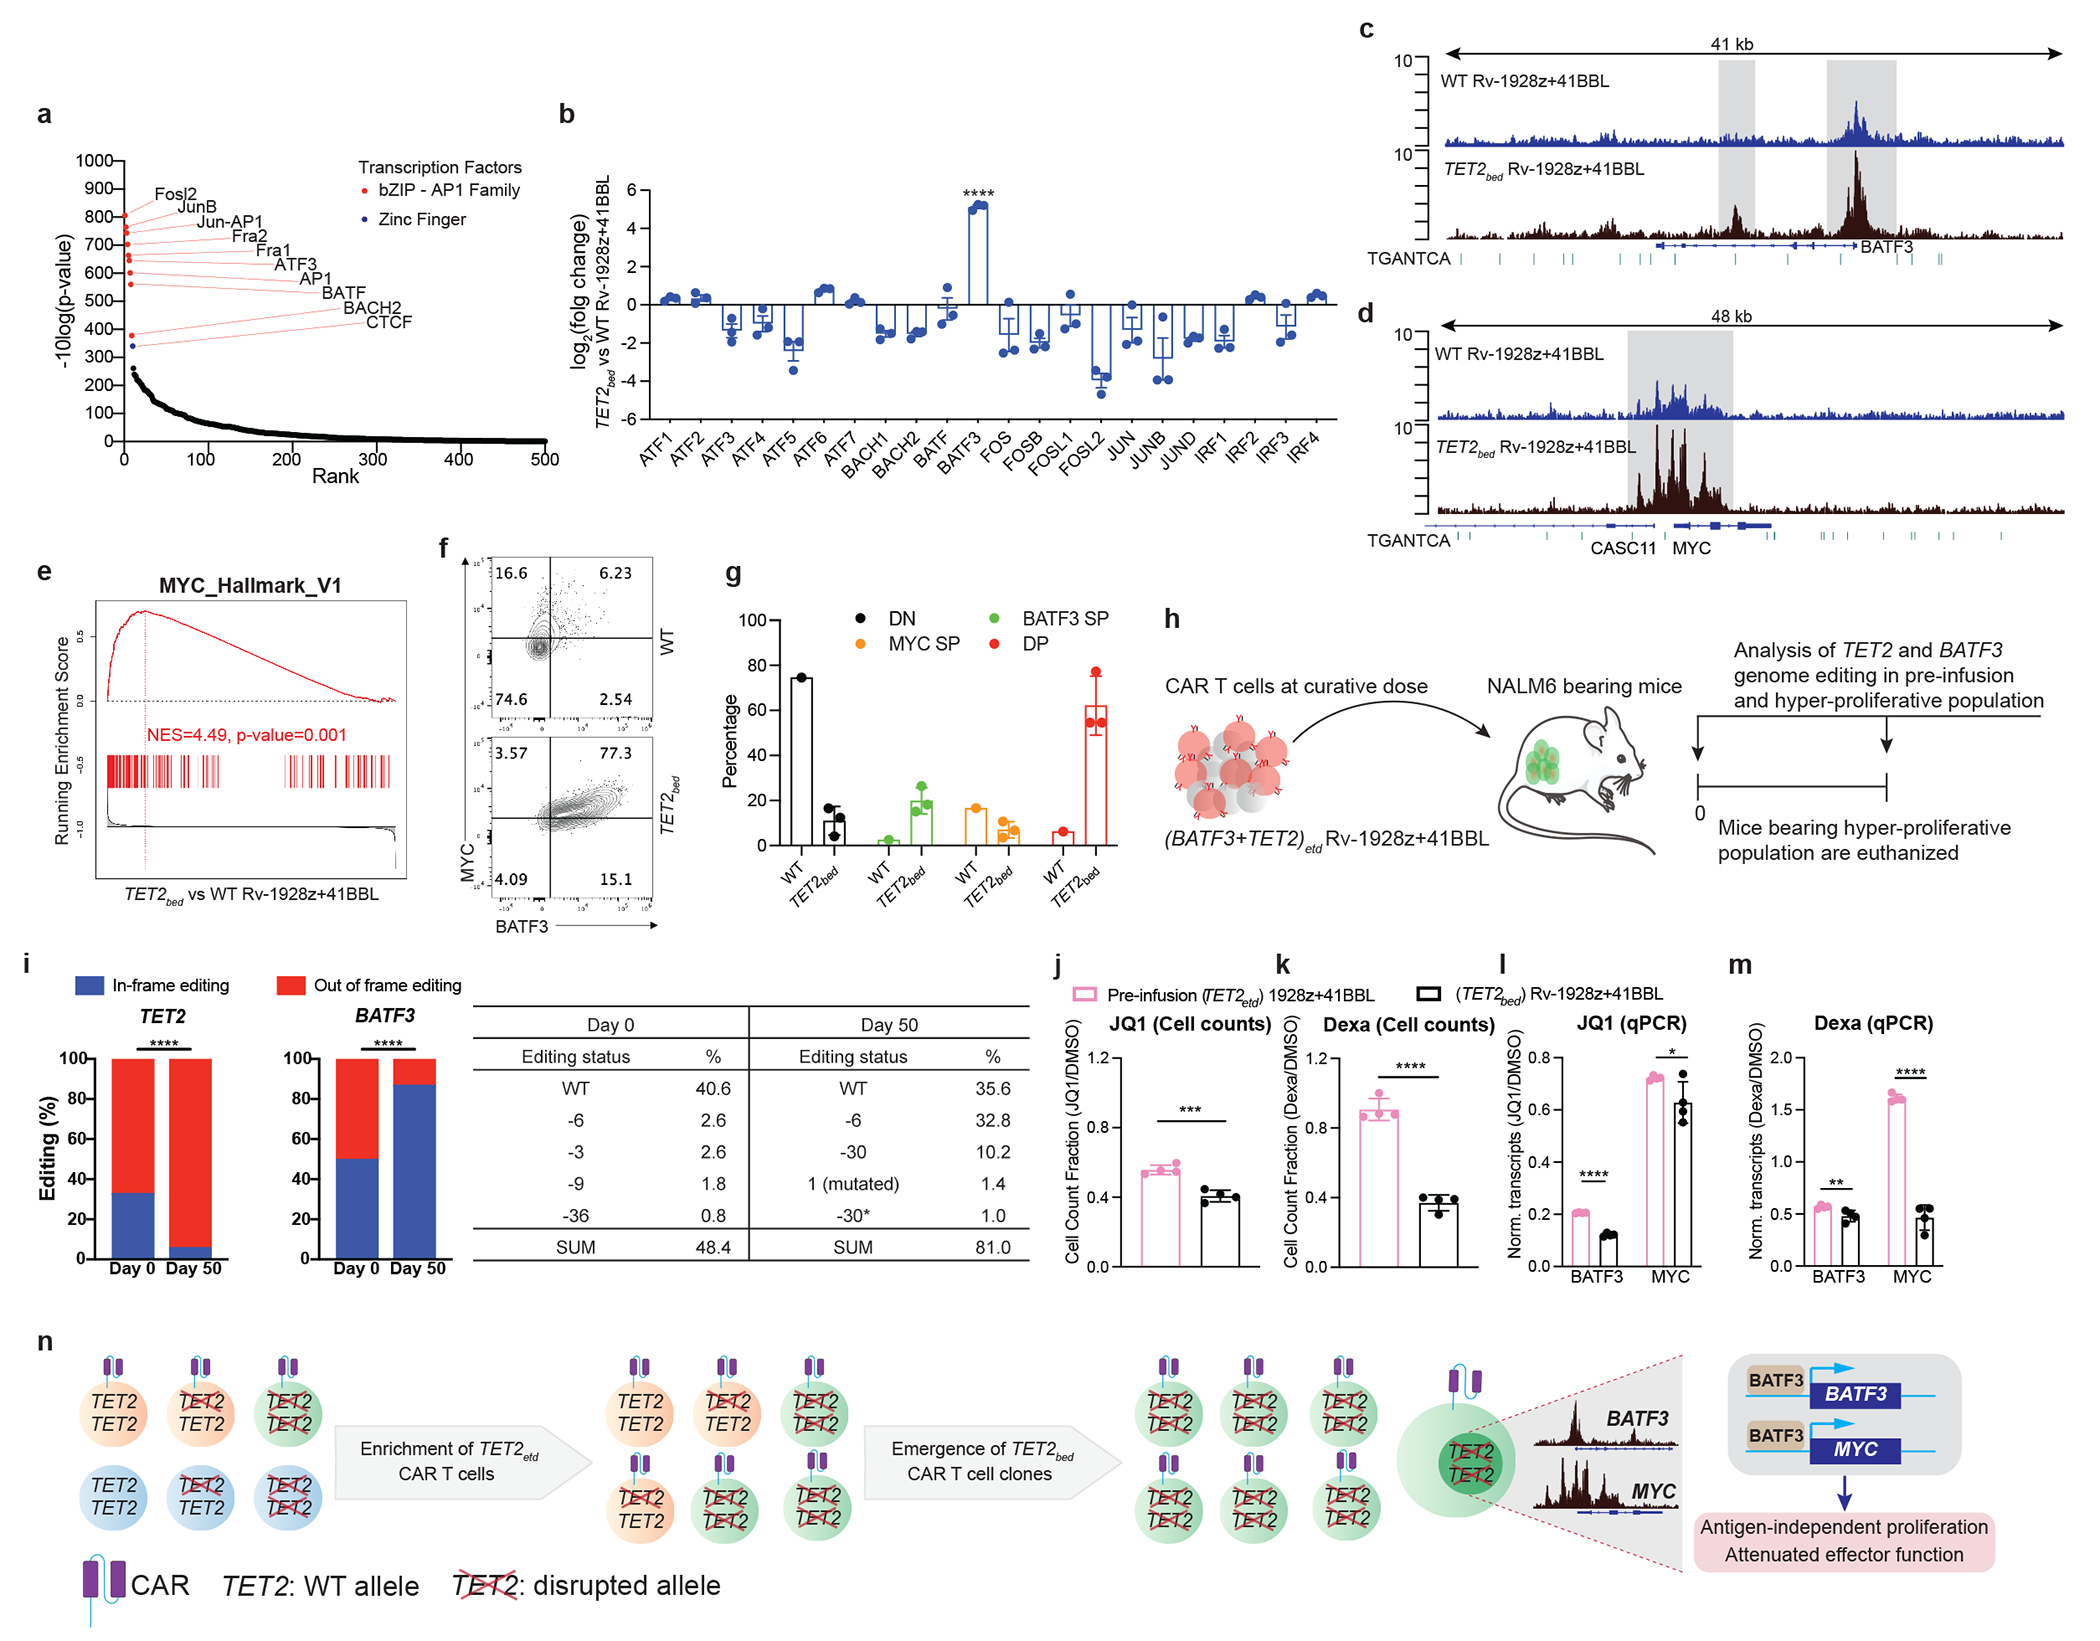
a, AP1 binding motif was most significantly enriched in open chromatin region of TET2bed Rv-1928z+41BBL. b, RNA expression of AP1-family transcriptional factors in TET2bed Rv-1928z+41BBL and WT Rv-1928z+41BBL. Data is represented as mean±SD (n=3). p values were determined by Wald test with FDR correction (two-sided). c,d, Increased genomic accessibility (Highlighted by grey background) in promoter and gene body regions of BATF3 (c) and MYC (d). AP1 binding motif marked by green dashes. e, Geneset enrichment analysis reveals increased MYC signaling in TET2bed Rv-1928z+41BBL as compared to WT Rv-1928z+41BBL. p values were corrected for multiple comparisions by BKY method. f,g, Flow cytometry for BATF3 and MYC in WT and TET2bed Rv-1928z+41BBL CAR T cells at day 90 (f). WT sample was pooled from 10 mice. TET2bed sample is representative population from one mouse in (f). Data in g is summary of 3 mice and is presented as mean±SD. h, Schematics of TET2 and BATF3 dual editing study. i,TET2 and BATF3 editing outcomes were determined at pre-infusion and hyper-proliferation. p-values were determined by two-sided χ2 test (i). j,k, Cells were either treated with DMSO, JQ1 (500nM) or dexamethasone (dexa, 1μm). DMSO normalized cell counts for JQ1 (j) and dexa (k). Data is represented as mean±SD (n=4). p values were determined by two-sided unpaired t-test. l,m, qPCR study for BATF3 and MYC under JQ1 and dexa treatment. Transcripts were normalized to B2M. DMSO normalized BATF3 and MYC levels under JQ1 treatment (l) and dexa (m). Data is represented as mean±SD (n=4). p values were determined by two-sided multiple unpaired t-tests corrected by BKY method. n, Graphical model summarizing the results. p<0.05 was considered statistically significant. p values are denoted: p>0.05, not significant, NS; *, p<0.05; **, p< 0.01; ***, p<0.001; ****, p<0.0001. Exact p values are available in SI Table 4.
To directly test the role of BATF3 in acquisition of hyper-proliferative state, we designed an in vivo study where BATF3 and TET2 are both edited in Rv-1928z+41BBL CAR T cells (SI Fig. 2a), hypothesizing that in-frame BATF3 edits would be enriched, and out-of-frame edits would be counter-selected over time. NALM6-bearing mice were treated with a predictably curative dose of (BATF3 and TET2)etd Rv-1928z+41BBL CAR T cells to allow for long-term monitoring (Fig. 5h). Deep sequencing at both TET2 and BATF3 loci indeed confirmed an enrichment of out-of-frame edits at the TET2 locus and in-frame edits at the BATF3 locus when hyper-proliferative population emerged at day 50 (Fig. 5i), confirming the essential requirement for BATF3 expression to acquire the hyper-proliferative phenotype.
We further corroborated this dependency on BATF3 pharmacologically. JQ1 is an inhibitor of the BET protein BRD4 that has been previously shown to inhibit BATF3 and MYC expression in ATLL cells26. Although JQ1 inhibited proliferation of all tested CAR populations, TET2bed CAR T cells were more sensitive to JQ1 treatment in comparison to pre-infusion TET2-edited CAR T cells (Fig. 5j. SI Fig. 2b, c). This heightened sensitivity to JQ1 was associated with a greater suppression of BATF3 and MYC expression in TET2bed CAR T cells (Fig. 5l. SI Fig. 2d, e). Dexamethasone has been shown to suppress AP-1 factors28,29. Contrary to JQ1, dexamethasone did not limit proliferation of pre-infusion TET2-edited CAR T cells (Fig. 5k. SI Fig. 2e). However, it markedly inhibited proliferation of TET2bed CAR T cells (Fig. 5k. SI Fig. 2e). This increased sensitivity to dexamethasone was associated with reduction of both BATF3 and MYC expression in TET2bed CAR T cells (Fig. 5m. SI Fig. 2f). In contrast, MYC expression remained elevated in pre-infusion TET2-edited CAR T cells despite BATF3 inhibition (Fig. 5m. SI Fig. 2f). This differential MYC expression between pre-infusion TET2-edited CAR T cells and TET2bed CAR T cells upon exposure to dexamethasone further supports the dependency of MYC expression on BATF3 in TET2bed CAR T cells.
Discussion
We find that biallelic TET2 disruption can enhance the efficacy and proliferation of human CAR T cells. The increased efficacy is consistent with earlier observations in murine TCR transgenic T cells9, and a case report of a clonal expansion in a patient treated with a 4-1BB CAR10. The functional enhancement of CAR T cell anti-tumour activity, however, depends on the CAR and not merely the TET2 status. Tumour elimination by TET2-edited T cells was enhanced with Rv-19BBz, Rv-1928z+41BBL and TRAC-1928z but not Rv-1928z. Over time, TET2bed CAR T cells repeatedly emerged in a hyper-proliferative state, consistently associated with CAR expression, albeit not requiring presence of CAR antigen, and independently of the TCR. TCRvβ sequencing identified multiple T cell clones in mice treated with TET2-edited Rv-19BBz, Rv-1928z+41BBL and TRAC-1928z, while hyper-proliferative TET2-edited Rv-1928z CAR T cells were rare and monoclonal when they occurred. These observations underscore a probabilistic fate, wherein the chance of establishing a hyperproliferative state in TET2-edited T cells is low in shorter lived Rv-1928z CAR T cells, rarely allowing rare breakthrough clones, and increased with CAR designs that autonomously promote greater persistence. Hyper-proliferative TET2bed CAR T cells bear secondary mutations, consistent with previous reports that show a role of TET2 in maintaining genomic integrity30,31. However, we did not identify a recurrent mutation amongst different TET2bed CAR T cell populations or mutations known to be associated with T cell leukaemia/lymphoma22. Instead, we identified a strict requirement for BATF3 expression, associated with an epigenetic signature characterized by enhanced BATF3 and MYC accessibility.
AP-1 factors are critically involved in distinct T cell states32–35. BATF over-expression in murine CAR T cells enhances their anti-tumour activity33. BATF3 over-expression in T cells enhances their CCR7 expression and memory formation36,37, although high BATF3 has also been associated with human CAR T cell exhaustion32. We find here that in the context of epigenetic changes brought on by TET2 loss, sustained BATF3 expression programs a hyperproliferative state rather than T cell memory. Furthermore, TET2bed CAR T cells demonstrate reduced cytolytic function and poor cytokine response upon activation, despite maintaining genome accessibility in effector loci (SI Fig. 3), which suggests that effector functions are transcriptionally downregulated. These observations point to a T cell state that differs from both canonically defined T cell exhaustion15,16 and T cell memory13,14. Our findings thus establish TET2 as an epigenetic regulator of BATF3 to prevent unchecked proliferation and maintain T cell genomic integrity.
Several AP-1 factors are known to potentially promote oncogenesis38. cJUN and BATF over-expression can lead to uncontrolled proliferation39,40. BATF3 has been shown to drive proliferation in T cell leukaemia/lymphoma through MYC26 or IL2R27. Sustained BATF3 expression in T cell leukaemia/lymphoma is associated with activated super-enhancers at the BATF3 locus26,27. The hyper-proliferative CAR T cell phenotype we report here underscores the potency of CAR T cell epigenetic programming but reveals long-term safety concerns that may arise from manipulating TET241 and AP-1 factors38. Remarkably, however, TET2bed CAR T cells remained highly sensitive to dexamethasone, which lowered both BATF3 and MYC expression in TET2bed CAR T cells. This high sensitivity may explain the sudden clonal contraction upon corticosteroid administration to manage cytokine release syndrome observed in the patient bearing a TET2-deficient 19BBz CAR T cell clone10. The intentional disruption of TET2 for CAR T cell therapy may nonetheless be concerning, especially in elderly subjects who are more likely to harbour mutations in DNMT3a42 which can synergize with TET2 loss to precipitate T cell oncogenesis43. Screening for pre-existing mutations that predispose to hyper-proliferation or transformation should help mitigate this hazard. Transient or partial suppression of TET2 during CAR T cell production44 may eschew such a risk.
In summary, disruption of TET2 enhances CAR T cell efficacy and promotes sustained T cell accumulation but exposes to the risk of a hyper-proliferative state that is prone to accumulating secondary mutations. These findings demonstrate the formidable potential of epigenetic reprogramming to alter CAR T cell fate and highlight how an AP-1 factor, like BATF3, may direct distinct effector and proliferative states under different epigenetic contexts.
Methods
Data reporting
No statistical methods were used to predetermine sample size. The experiments were not randomized and, unless otherwise stated, the investigators were not blinded to allocation during experiments and outcome assessment.
Retroviral vector constructs and retroviral production
Plasmids encoding the retroviral vector were prepared using standard molecular biology techniques45. LNGFR is a truncated and mutated TNF-R family homolog46 which was used as a control molecule to ensure comparable CAR expression levels from different bicistronic vectors. Synthesis of Rv-1928z, Rv-19BBz, and Rv-1928z+41BBL has been previously described23,47,48. VSV-G pseudotyped retroviral supernatants derived from transfected gpg29 human embryonic kidney 293T (H29) cells were used to construct stable retroviral-producing cell lines as previously described49.
AAV targeting for TRAC-1928z
The TRAC gRNA targets a sequence upstream of the transmembrane domain of the TCRα. This domain is required for the TCRα and β assembly and addressing to the cell-surface. Both, non-homologous end joining (NHEJ) and integration of the CAR by HDR at this locus would then efficiently disrupt the TCR complex23. TRAC-1928z is based on the pAAV-GFP backbone (Cell Biolabs). It contains 1.9 kb of genomic TRAC flanking the gRNA targeting sequence, a self-cleaving P2A peptide in frame with the first exon of TRAC followed by the 1928z CAR used in clinical trials24,50.
Isolation and expansion of human T cells
Buffy coats from anonymous healthy donors were purchased from the New York Blood Centre (institutional review board-exempted) and peripheral blood was obtained from healthy volunteers. All blood samples were handled following the required ethical and safety procedures. Peripheral blood mononuclear cells were isolated by density gradient centrifugation. T cells were then purified by using the Pan T Cell Isolation Kit (Miltenyi Biotec). T cells were then stimulated with CD3/CD28 T cell Activator Dynabeads (Invitrogen) at 1:1 ratio and cultured in RPMI+10% Fetal Bovine Serum (FBS), 5 ng ml−1 interleukin-7 (IL7) and 5 ng ml−1 IL15 (Miltenyi Biotec) for retroviral transduction (Rv-CAR) and gene targeting (TRAC-1928z) experiments. The medium was changed every 2 days, and cells were plated at 106 cells per ml.
Flow cytometry
CAR expression was measured with Alexa-Fluor-647-conjugated goat anti-mouse Fab (Jackson ImmunoResearch, 115-606-072). Flow cytometry antibodies used for cell surface phenotyping are provided in Supplementary Table 1. For intracellular staining, cells were fixed and permeabilized using Foxp3/Transcription Factor staining kit (eBioscience, 00-5523-00) according to manufacturer’s protocol. Flow cytometry antibodies used for intra-cellular studies are provided in Supplementary Table 5. Data was analysed by FlowJo v10.1 (BD). Cell sorting was performed on a BD FACSAria cell sorter. Gating strategies for flow cytometry are provided in SI Figure 4.
Mouse Leukaemia and prostate tumour models
We used 6- to 12-week-old NOD/SCID/IL-2Rγ null mice (The Jackson Laboratory), under a protocol approved by the Memorial Sloan Kettering Cancer Centre (MSKCC) Institutional Animal Care and Use Committee. All relevant animal use guidelines and ethical regulations were followed. NALM6 expressing firefly luciferase-GFP were described previously48. For Leukaemia model, Mice were inoculated with 5e5 FFLuc-GFP NALM6 cells by tail vein injection, CAR T cells were then injected 4 d later at varying doses. For prostate cancer model, Mice were inoculated with 2e6 PC3-PSMA FFLuc-GFP51 cells by tail vein injection, CAR T cells were then injected 4 weeks later. Both NALM6 and PC3 cells produce even tumour burdens, and no mice were excluded before treatment. For TRAC-1928z stress test, long-term CAR T cell assessment (Fig. 2) and prostate cancer model (Extended Data Fig. 4) a scrambled gRNA- GCACUACCAGAGCUAA CUCA was used as a control. No randomization or blinding methods were used. Bioluminescence imaging was performed using the IVIS Imaging System (PerkinElmer) with the Living Image V4.4 software (PerkinElmer) for the acquisition of imaging datasets.
Secondary transplant of TET2bed CAR T cells
A day prior to the transplant, NSG mice were irradiated with a cumulative dose of 200 cGy. 2e6 TET2bed CAR T cells were then injected through tail vein. For IL2 treatment group, mice received 1000U of IL2 twice a week (Intra-peritoneal). For IL7+IL15 treatment group, IL7 was subcutaneously injected at 0.5ug/mouse/week. IL-15 and IL-15ra were pre-incubated at 1:6 weight ratio at 37oC for 30 minutes before injection (IP) in mice at a dose of 2.5ug (1L-15) +15ug (IL-15ra)/week52. Mice received exogenous cytokines for 60 days.
Cytotoxicity assays
The cytotoxicity of T cells transduced with a CAR was determined by luciferase-based assay. NALM6 expressing firefly luciferase-GFP served as target cells. The effector and tumour cells were co-cultured at indicated E/T ratio in the black walled 96 well plates in triplicate manner with 1e5 target cells in a total volume of 100 μl/well. Target cells alone were planted at the same cell density to determine the maximal luciferase expression (relative light units; RLUmax). 18 hr later, 100 μl luciferase substrate (Bright-Glo, Promega) was directly added to each well. Emitted light was measured by luminescence plate reader or Xenogen IVIS Imaging System (Xenogen) with Living Image V4.4 software (Xenogen) for acquisition of imaging data sets. Lysis was determined as [1 − (RLUsample)/(RLUmax)] × 100.
DNA/RNA simultaneous extraction
Cell pellets were resuspended in RLT buffer and nucleic acids were extracted using the AllPrep DNA/RNA Mini Kit (QIAGEN catalogue # 80204) according to the manufacturer’s instructions. RNA was eluted in nuclease-free water and DNA in 0.5X Buffer EB. Phase separation in cells lysed in TRIzol Reagent (ThermoFisher catalogue # 15596018) was induced with chloroform. RNA was precipitated with isopropanol and linear acrylamide and washed with 75% ethanol. The samples were resuspended in RNase-free water.
Transcriptome sequencing
After RiboGreen quantification and quality control by Agilent BioAnalyser, 2ng total RNA with RNA integrity numbers ranging from 7.3 to 9.7 underwent amplification using the SMART-Seq v4 Ultra Low Input RNA Kit (Clonetech catalogue # 63488), with 12 cycles of amplification. Subsequently, 10ng of amplified cDNA was used to prepare libraries with the KAPA Hyper Prep Kit (Kapa Biosystems KK8504) using 12 cycles of PCR. Samples were barcoded and run on a HiSeq 4000 in a PE50 run, using the HiSeq 3000/4000 SBS Kit (Illumina). An average of 40 million paired reads were generated per sample and the percent of mRNA bases per sample ranged from 31% to 69%. DESeq2 was used to normalization and differential analysis of transcriptional data.
TCR sequencing
After PicoGreen quantification and quality control by Agilent BioAnalyser, 188-200ng of genomic DNA were split equally into six reactions and prepared using the immunoSEQ human TCRB Kit (Adaptive Biotechnologies) according to the manufacturer’s instructions. Briefly, multiplex PCR was used to amplify the CDR3 region for 31 cycles. After clean-up, 2μL of PCR product was used as input into library preparation with 8 cycles of PCR. Barcoded samples were pooled by volume and sequenced using custom primers on a NextSeq 500 in a SR155 run, using the NextSeq 500/550 Mid Output Kit v2.5 (150 Cycles) (Illumina). The loading concentration was 1pM and 20% spike-in of PhiX was added to the run to increase diversity and for quality control purposes. Raw BCL files were transferred to the immunoSEQ Analyser for processing and analysis.
Exome capture and sequencing
After PicoGreen quantification and quality control by Agilent BioAnalyser, 250ng of DNA were used to prepare libraries using the KAPA Hyper Prep Kit with 8 cycles of PCR. After sample barcoding, 100ng of library were captured by hybridization using the xGen Exome Research Panel v1.0 (IDT) according to the manufacturer’s protocol. PCR amplification of the post-capture libraries was carried out for 8 cycles. Samples were run on a HiSeq 4000 in a PE100 run, using the HiSeq 3000/4000 SBS Kit (Illumina). Samples were covered to an average of 111X.
ATAC sequencing
Profiling of chromatin was performed by ATAC-Seq as described53. Briefly, 50,000 fresh T cells were washed in cold PBS and lysed. The transposition reaction containing TDE1 Tagment DNA Enzyme (Illumina catalogue # 20034198) was incubated at 37°C for 30 minutes. The DNA was cleaned with the MinElute PCR Purification Kit (QIAGEN catalogue # 28004) and material was amplified for 5 cycles using NEBNext High-Fidelity 2X PCR Master Mix (New England Biolabs catalogue # M0541L). After evaluation by real-time PCR, 8 additional PCR cycles were done. The final product was cleaned by aMPure XP beads (Beckman Coulter catalogue # A63882) at a 1X ratio, and size selection was performed at a 0.5X ratio. Libraries were sequenced on a HiSeq4000 in a PE50 run, using the HiSeq 3000/4000 SBS Kit (Illumina). An average of 108 million paired reads were generated per sample.
S-EPTS/LM-PCR integration site analysis
Shearing-Extension Primer Tag Selection Ligation-Mediated PCR (S-EPTS/LM-PCR) is a shearing DNA based integration site (IS) analysis method in orientation to the original EPTS/LM-PCR54. S-EPTS/LM-PCR starts with shearing of genomic DNA to an intended length of 500 bp using the Covaris M220 instrument. Sheared DNA is split into three equal replicates (500 ng each) and purified, followed by primer extension using two vector, long-terminal-repeat-specific biotinylated primers. The extension product is purified, and biotinylated DNA is being captured by paramagnetic beads. The captured DNA is ligated to linker cassettes including a molecular barcode, and the ligation product is amplified in an exponential PCR using biotinylated vector- and linker-cassette-specific primers. Biotinylated PCR-products are magnetically captured, washed, and used as template for amplification in a second exponential PCR with barcoded primers allowing sequencing by MiSeq technology (Illumina). Final preparation for sequencing is done as previously described55,56. Applied DNA double barcoding allows parallel sequencing of multiple samples in a single sequencing run while minimizing sample cross-contamination. Amplicons are then sequenced on the MiSeq instrument using V2 Reagent Kit (Illumina).
IS computational analysis
Raw sequence data were trimmed according to sequence quality (Phred) and only sequences showing complete identity in both molecular barcodes (linker cassette barcode, sequencing barcodes) were further analysed. An in-house semi-automated bioinformatical data mining pipeline was used to analyse the data57. In brief, quality filtered sequences were trimmed (vector- and linker cassette specific parts removed) and only sequences that showed at least 18 nucleotides of expected, vector-specific sequence were analysed further to ensure the analysis of true vector-genome junctions. Such trimmed sequences were further filtered in a way that only sequences equal or larger than 25 bp were aligned to the human genome (UCSC assembly release number hg38, version 3) by Burrows-Wheeler Aligner (BWA) MEM algorithm (version 0.7.17) for the initial alignment58. It was subsequently followed by mapping of potential IS sequences with BLAST, where minimum alignment identity percentage of 95% is employed, while nearby genes and other integrating features were annotated as previously described according to RefSeq database59. The relative sequence count of each detected IS was calculated in relation to all sequences attributed to corresponding sample.
Statistical analysis
All statistical analyses were performed using the Prism 9 (GraphPad) software. No statistical methods were used to predetermine sample size. Statistical tests are provided in the figure legends. Kolmogorov–Smirnov test was used to determine P values in GSEA analysis. *p<0.05, **p<0.01, ***p<0.0001, ****p<0.00001.
Reporting summary
Further information on research design is available in the Nature Research Reporting Summary linked to this paper.
Data availability
Data generated from RNA-seq and ATAC-seq has been deposited in the GeneExpressionOmnibus (GEO) with accession number GSE220259. The publicly available datasets used in this study are GSE23321 for central memory and effector memory phenotype comparison, AKL_HTLV1_UP (M7705), AKL_HTLV1_DN (M9815), AITL dataset (GSE6338), HALLMARK_MYC_V1 (M5926).
Code availability
Not applicable
Extended Data
Extended Data Fig. 1: Rv-1928z and Rv-19BBz pre-infusion and in vivo CAR T cell phenotyping.
a,b, Pre-infusion transduction efficiency and phenotyping by flow cytometry of Rv-1928z (a) and Rv-19BBz (b) CAR T cells. c,d, Tumour monitoring of NALM6 bearing mice treated with Rv-1928z (c) and Rv-19BBz (d) CAR T cells. e,f, Bone marrow (e) and Splenic (f) CAR T cell quantification at 3 weeks post infusion. Data is represented as mean±SE [n=5 (Rv-1928z), n=6 (Rv-19BBz)]. g,h Differentiation phenotyping of pooled bone marrow CAR T cells at week 3 post infusion. Data from another experiment included in supplementary information. i, CAR T cell inhibitory receptor expression at week 3 post infusion from mouse bone marrow (n=3). p values were determined by two-sided Mann–Whitney test (e,f) and two-sided χ2 test (h). p<0.05 was considered statistically significant. p values are denoted: p>0.05, not significant, NS; *, p<0.05. Replicate information for g,i are available in SI Table 3. Exact p values are available in SI Table 4.
Extended Data Fig. 2: Rv-1928z+41BBL and TRAC-1928z pre-infusion and in vivo CAR T cell phenotyping.
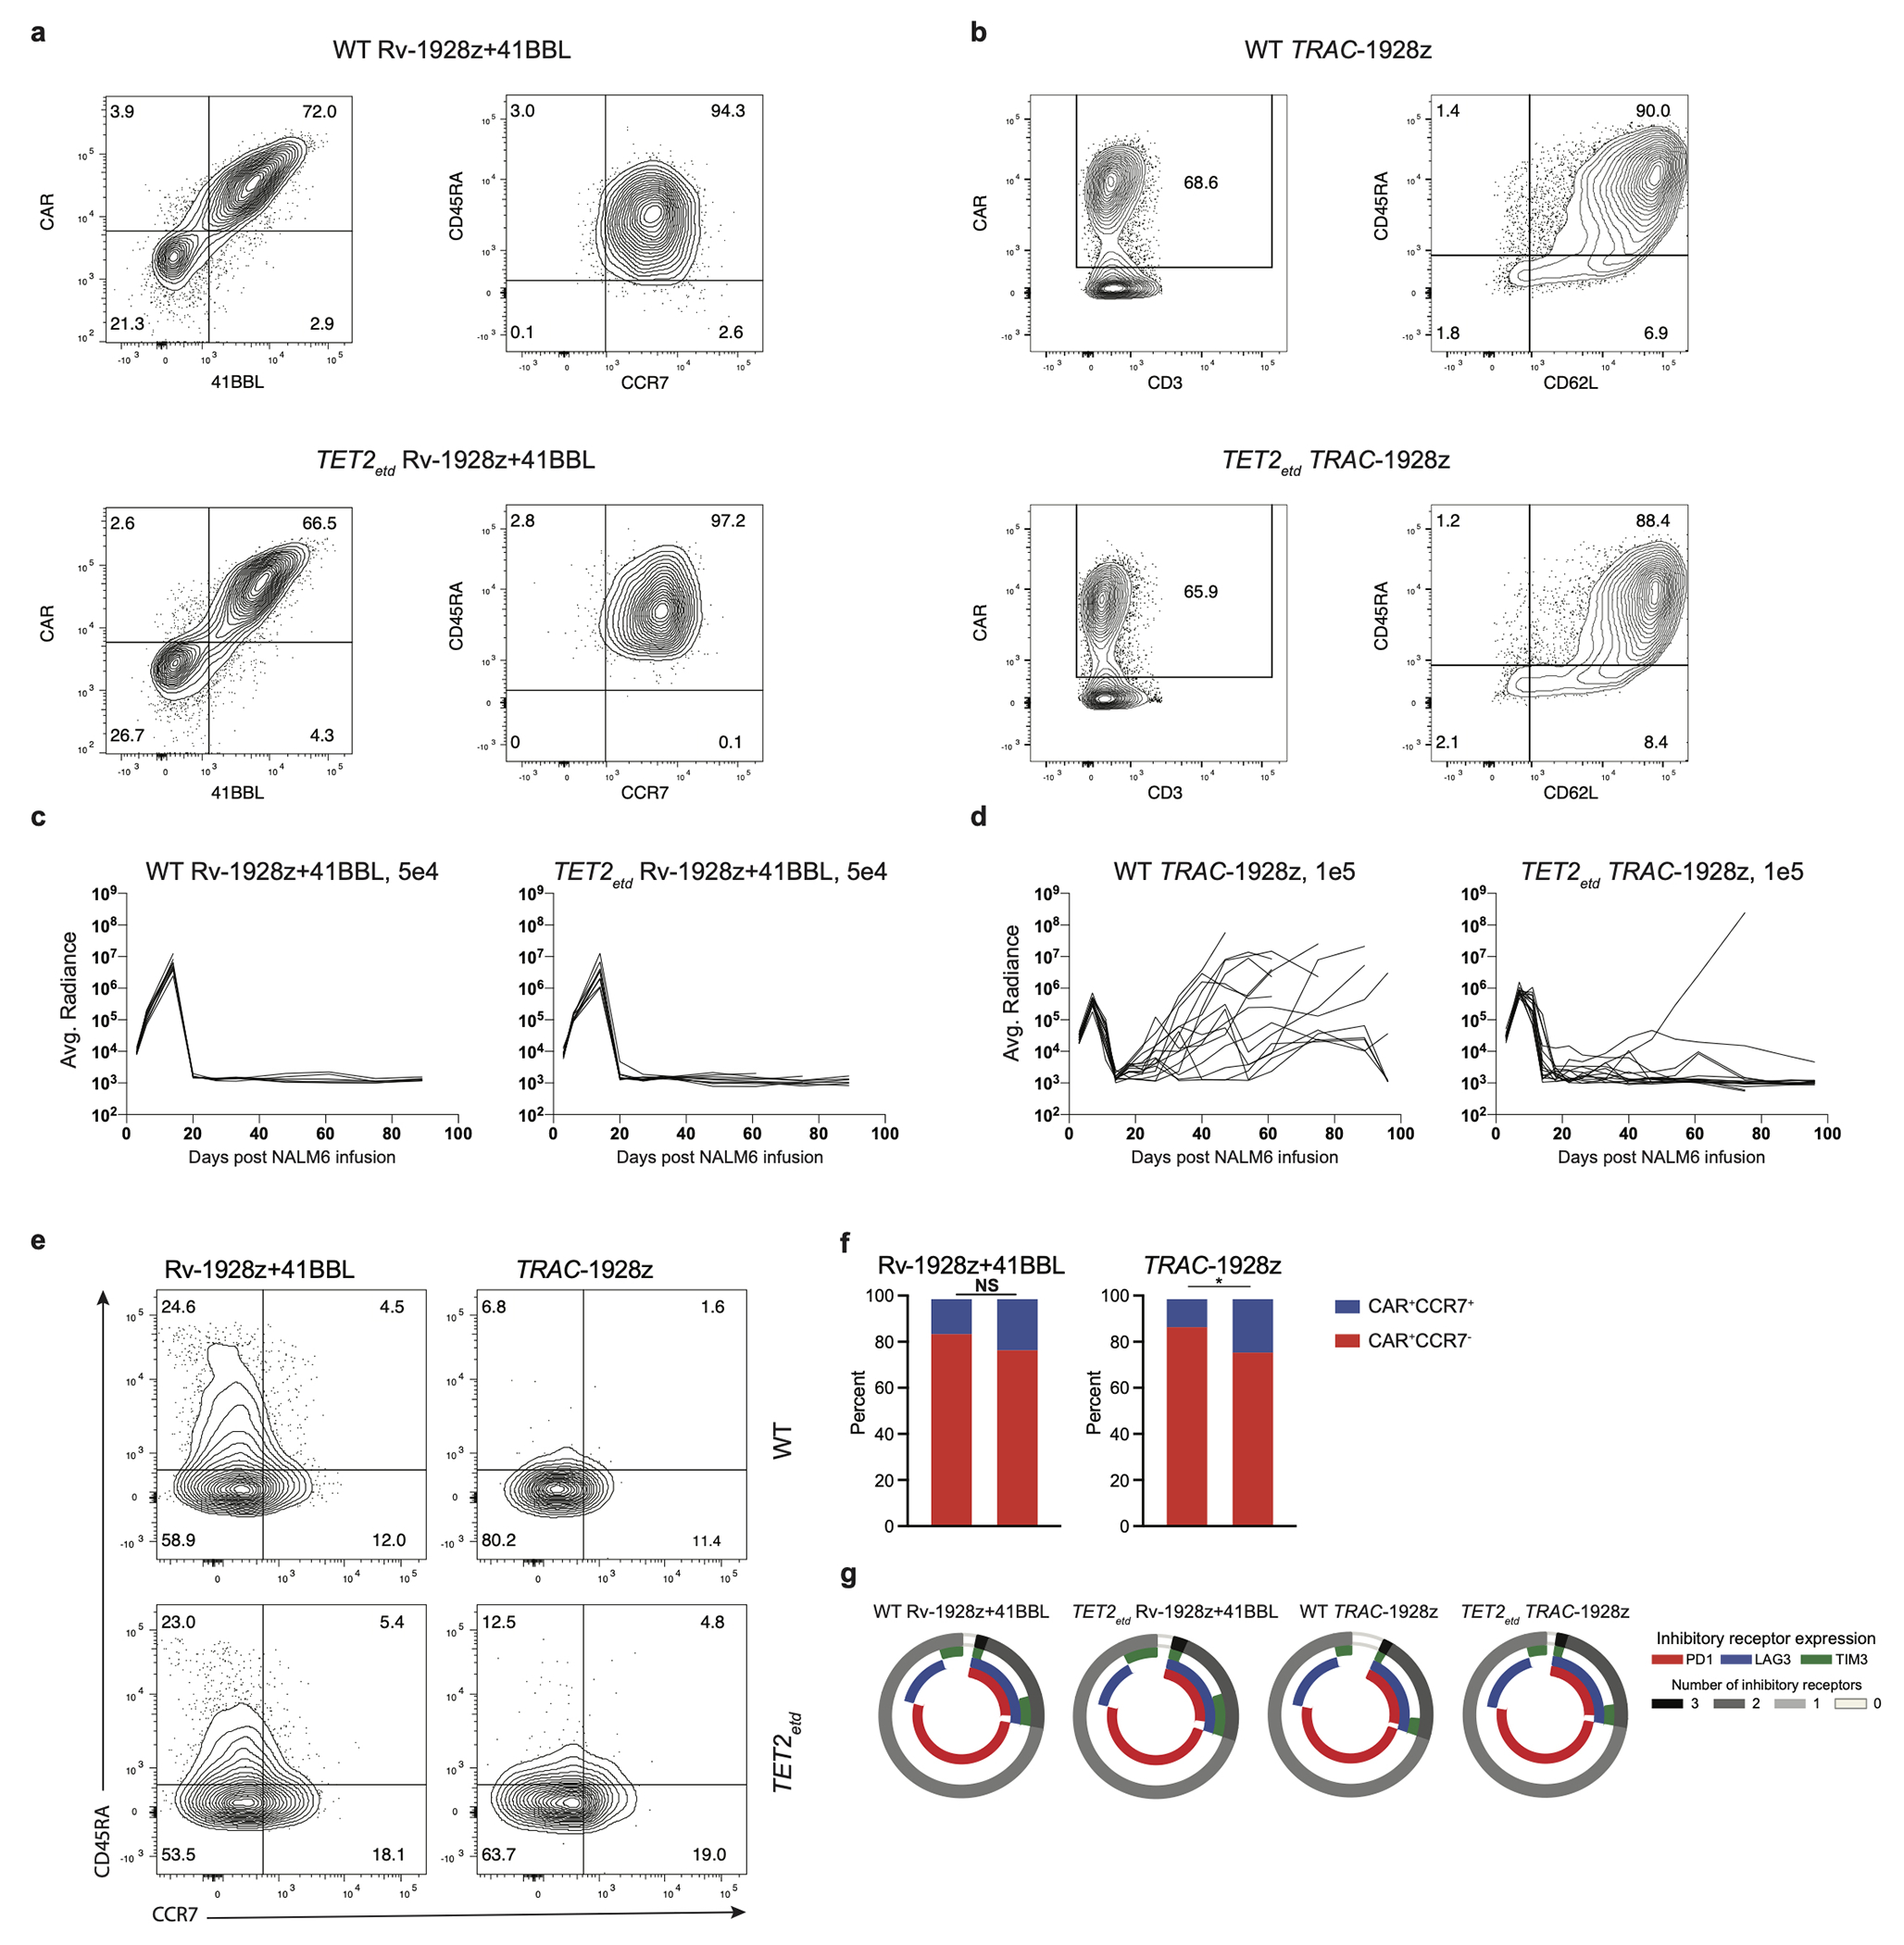
a,b, Pre-infusion transduction efficiency and phenotyping by flow cytometry of Rv-1928z+ 41BBL (a) and TRAC-1928z (b) CAR T cells. c,d, Tumour monitoring of NALM6 bearing mice treated with Rv-1928z+41BBL (c) and TRAC-1928z (d) CAR T cells. e,f, Differentiation phenotyping of pooled bone marrow CAR T cells at week 3 post infusion. Data from another experiment included in supplementary information. g, CAR T cell inhibitory receptor expression at week 3 post infusion from mouse bone marrow (n=3). p values were determined by two-sided χ2 test (f). p<0.05 was considered statistically significant. p values are denoted: p>0.05, not significant, NS; *, p<0.05. Replicate information for e,g are available in SI Table 3.
Extended Data Fig. 3: Long-term CAR T cell phenotypes upon CRISPR/Cas9 editing of TET2 locus.
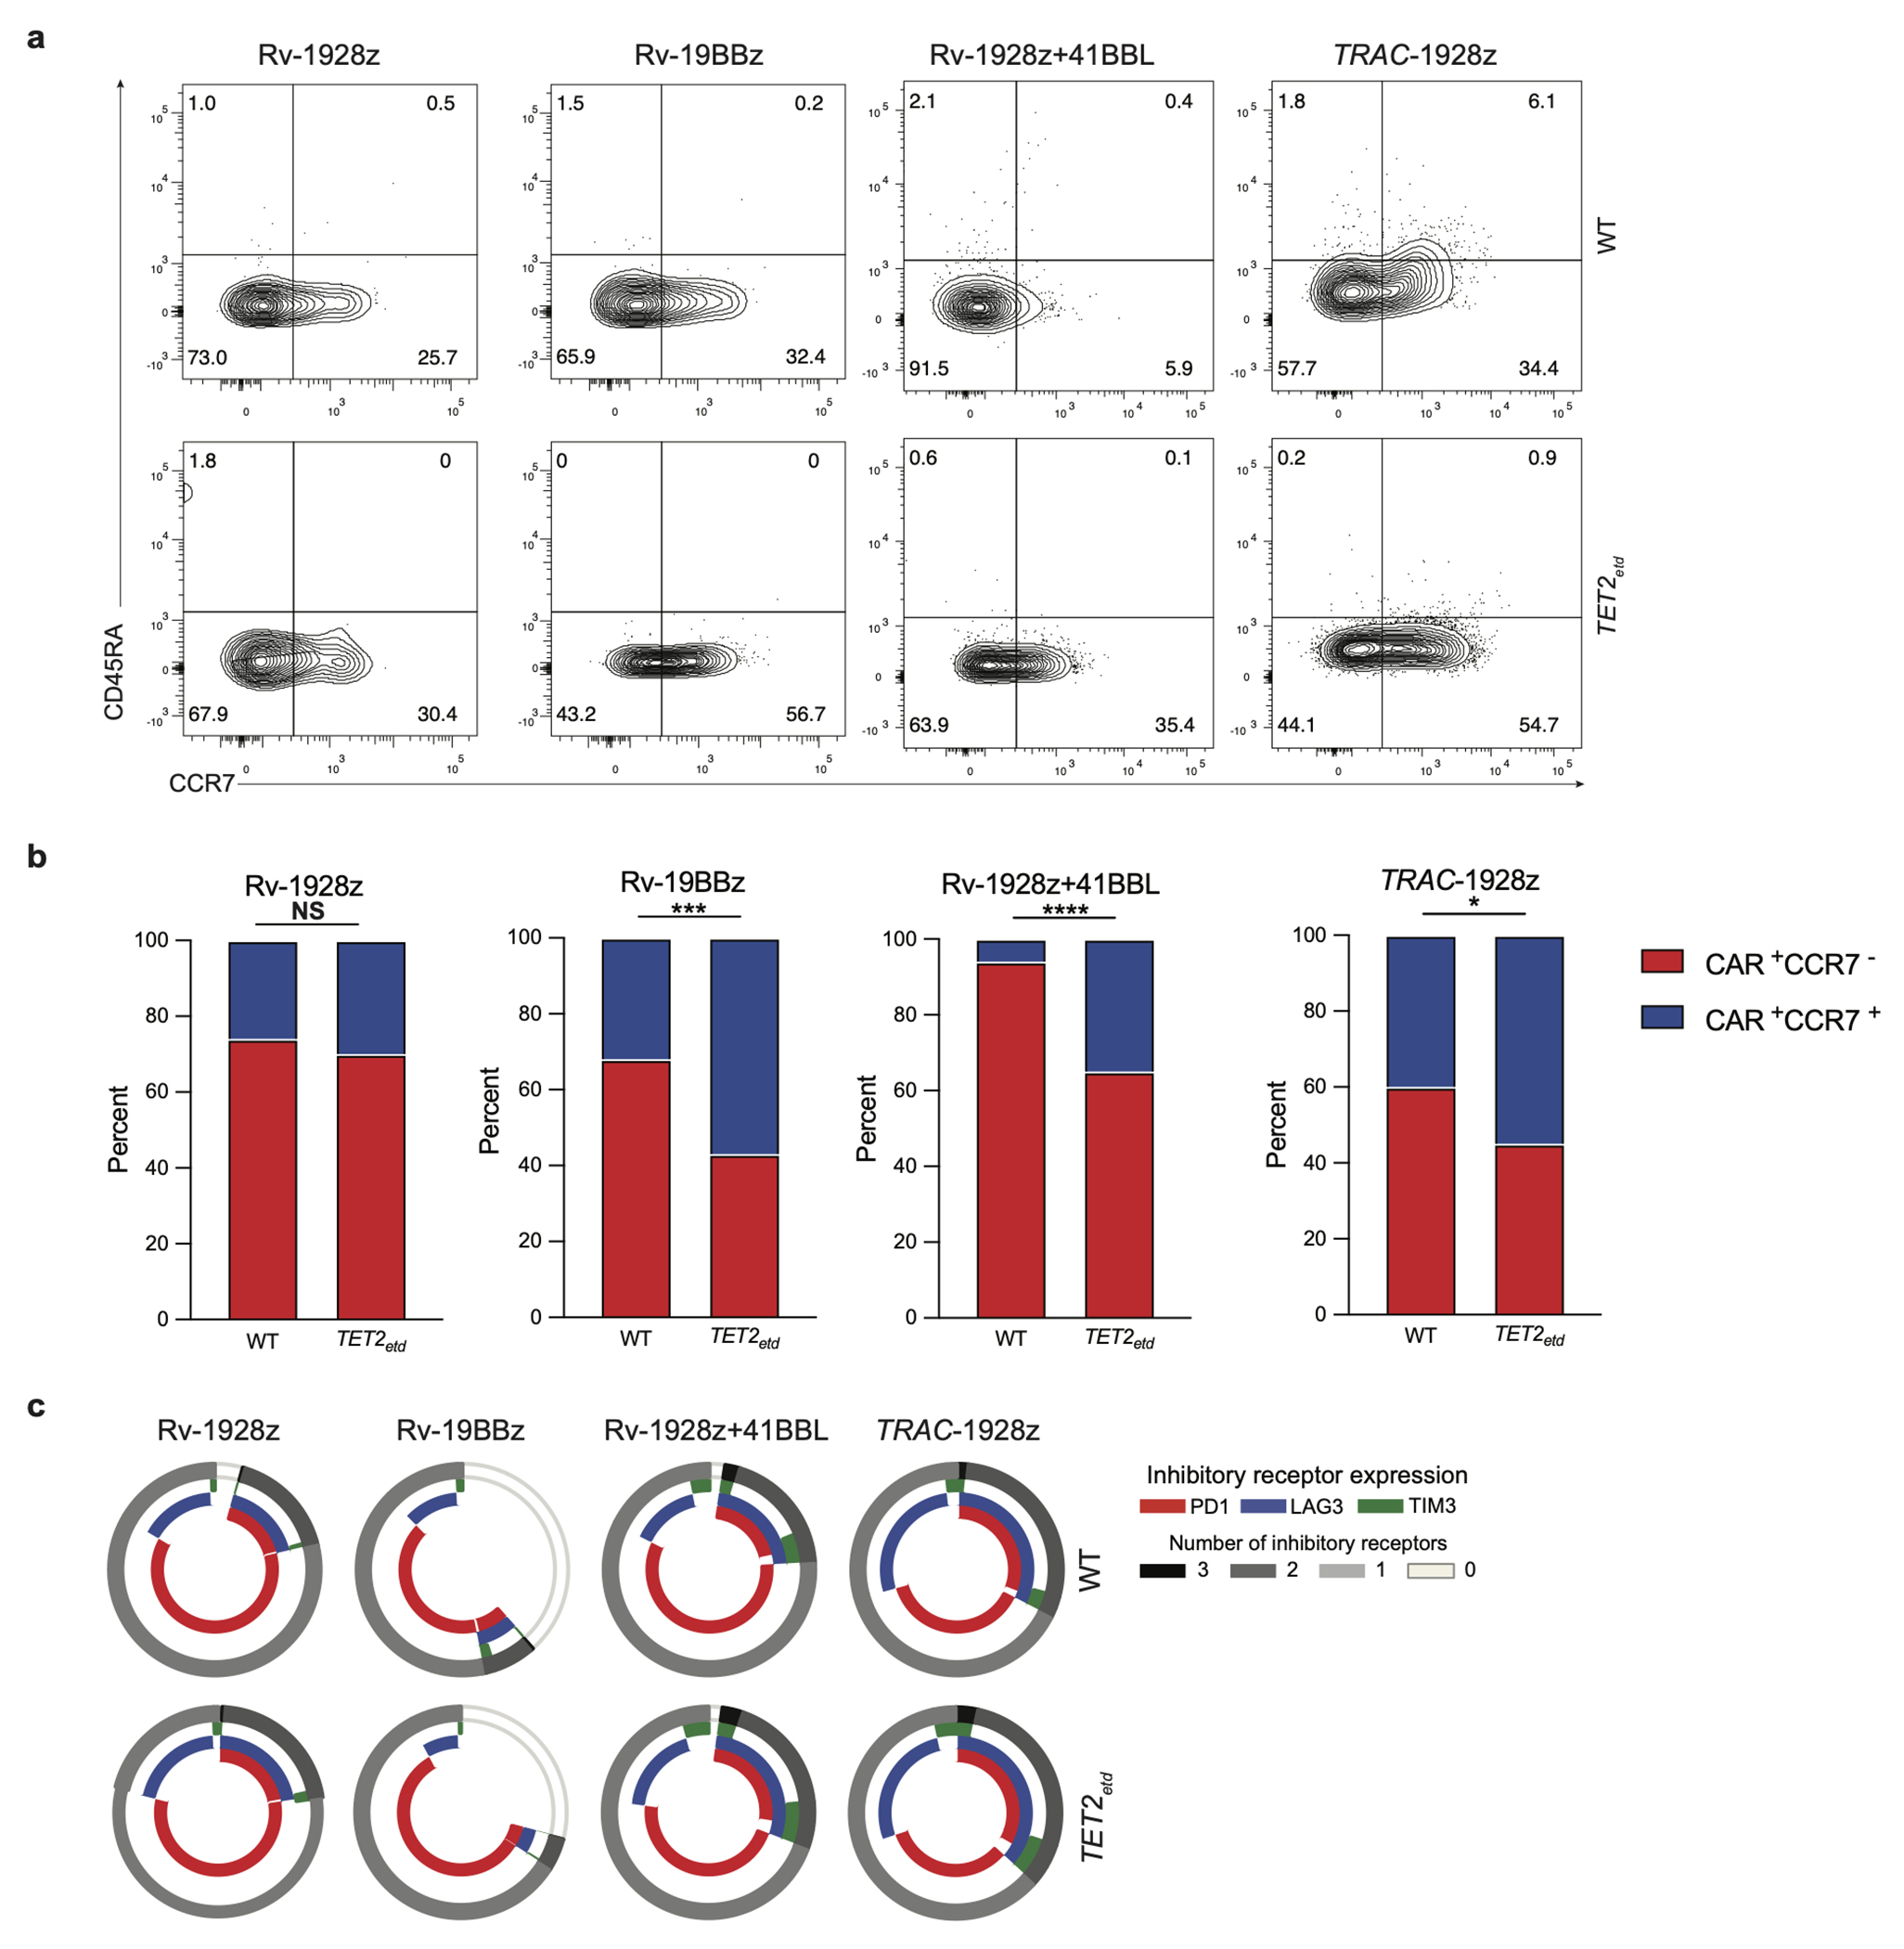
a,b, Differentiation phenotyping of retrovirally encoded CAR T cells (day 90) and TRAC-1928z CAR T cells (day 75) isolated from the bone marrow. c, Inhibitory receptor expression of bone marrow Rv-1928z, Rv-19BBz, Rv-1928z+41BBL (day 90) and TRAC-1928z (day 75) CAR T cells. p values were determined by two-sided χ2 test (b). p<0.05 was considered statistically significant. p values are denoted: p>0.05, not significant, NS; *, p<0.05; **, p< 0.01; ***, p<0.001; ****, p<0.0001. Replicate information for a,c are available in SI Table 3.
Extended Data Fig. 4: Effect of TET2 editing on CAR T cell accumulation in a prostate cancer model.
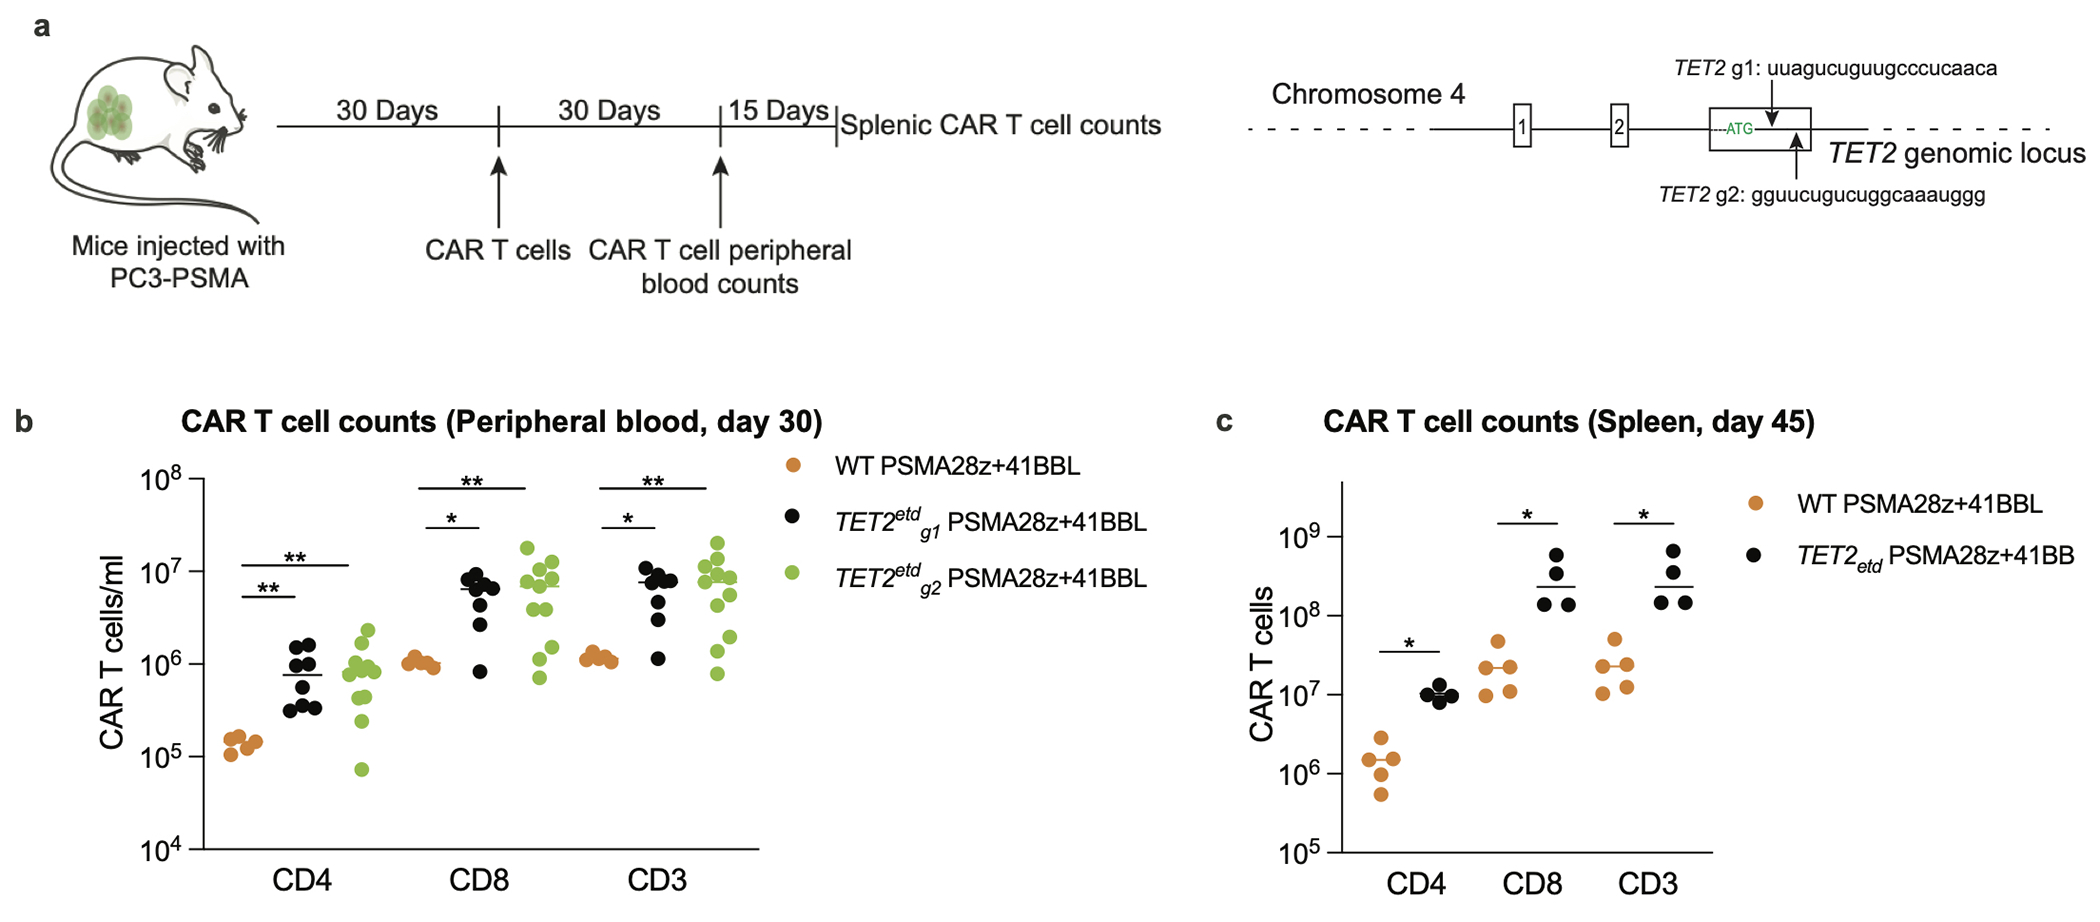
a, Schematics of the prostate cancer experimental design. TET2 was edited with the previously discussed gRNA (g1) and an alternative gRNA (g2). PSMA28z+41BBL (PSMA targeted, CD28 costimulated CAR that expresses 41BBL ligand) was used in this study (Dose: 2e5). b, CAR T cell counts in the peripheral blood 30 days post infusion of T cells. Bars show median values. c, Mice with the top 4 CAR T cell peripheral counts at day 30 across both TET2 targeting gRNA (g1, n=2. g2, n=2) were euthanized at day 45 along with 5 scrambled gRNA treated PSMA28z+41BBL mice and their splenic CAR T cell numbers were quantified. p values were determined by two-sided Mann-Whitney (b, c) [n=5 (WT PSMA28z+41BBL), n=8 (TET2etdg1 PSMA29z+41BBL), n=11 (TET2etdg1PSMA29z+41BBL)]. p<0.05 was considered statistically significant. p values are denoted: *, p<0.05; **, p< 0.01. Exact p values are available in SI Table 4.
Extended Data Fig. 5: Clonal expansion in all 4 hyper-proliferative CAR T cell populations.
a, Gel image of PCR product for WT CAR T cells and hyper-proliferative TET2-edited CAR T cells. The PCR is designed to amplify the site of gRNA editing. b, Enrichment of TET2-editing from pre-infusion (day 0) in mice to day 21 in Rv-1928z and Rv-1928z+41BBL CAR T cells. p values were determined by two-sided χ2 test. c,d, TCRvβ sequencing reveals hyper-proliferative populations that are dominant for a single clone in TET2bed Rv-1928z (c) and Rv-1928z+41BBL (d). Part of the retroviral vector that was inserted in the TET2 alleles of these clones is highlighted in the figures. e-g, Examples of hyper-proliferative Rv-1928z+41BBL CAR T cell populations that are oligoclonal (left panel) with biallelic TET2 editing (right panel). h, Western blot showing total loss of TET2 at protein level in different hyper-proliferative populations. i,j, Examples of oligoclonality in TET2bed TRAC-1928z (i) and Rv-19BBz (j). p<0.05 was considered statistically significant. p values are denoted: p>0.05, not significant, NS; *, p<0.05; **, p< 0.01.
Extended Data Fig. 6: TCR is dispensable for emergence of hyper-proliferative phenotype in TET2-edited Rv-1928z+41BBL CAR T cells.

a,b, Differentiation phenotyping of TCR+TET2ETD RV-1928z+41BBL (a) and TCR−TET2ETD RV-1928z+41BBL (b) CAR T cells. c, Summary of emergence of hyper-proliferative phenotype post CAR T cell infusion in mice for different donors. Mice were monitored for 90 days. 2e5 CAR T cells were used for both the groups.
Extended Data Fig. 7: Properties of the chimeric antigen receptor design determine composition of TET2bed hyper-proliferative populations.
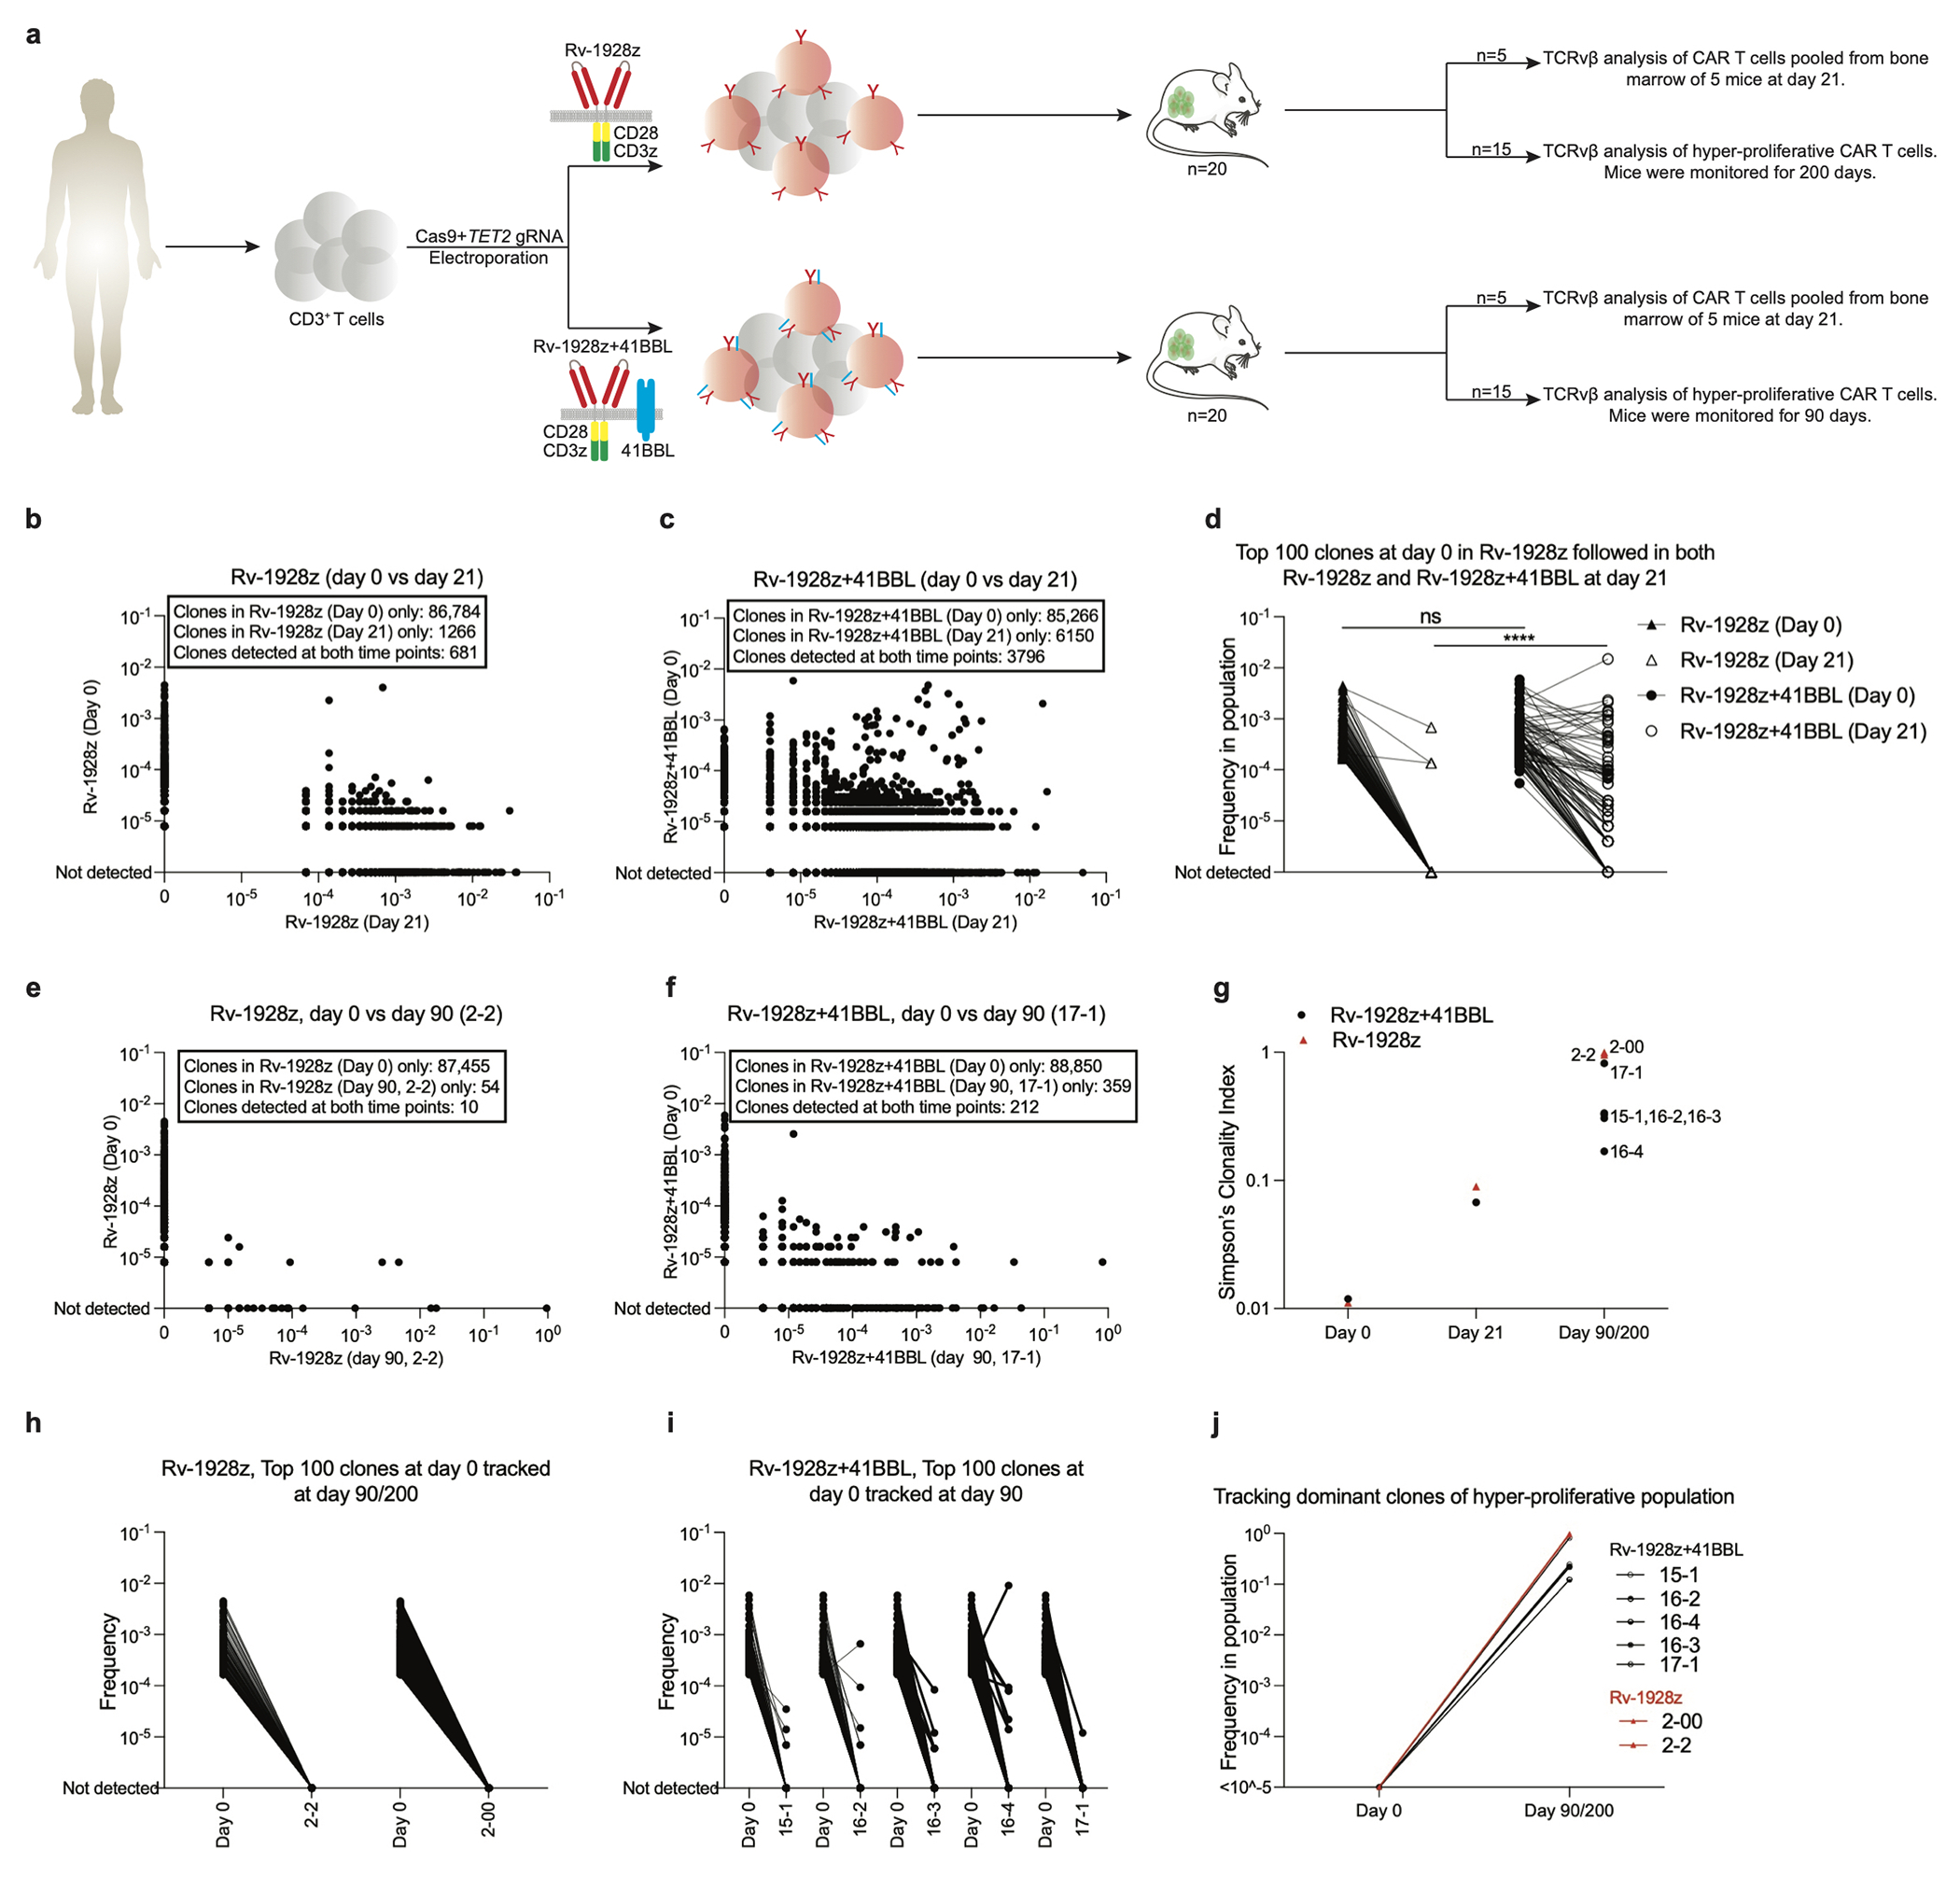
a, Rv-1928z or Rv-1928z+41BBL CAR T cells were generated from the same donor to assess the effect of CAR design on clonal persistence. 5 Mice were euthanized at day 21 to assess clonal diversity post tumour clearance. 15 mice were followed for emergence of a hyper-proliferative phenotype. b,c, Pair-wise analysis of Rv-1928z (b) and Rv-1928z+41BBL (c) at day 0 and day 21. d, Top 100 Rv-1928z clones at infusion were mapped in the Rv-1928z+41BBL infusion product. These clones were then assessed at day 21 for both the CAR receptors. p values were determined by two-tailed Mann-Whitney test. e,f, Pair-wise analysis (day 0 vs day 90) of the lone hyper-proliferative population found at day 90 for Rv-1928z CAR receptor (e). Representative pair-wise analysis (day 0 vs day 90) of a Rv-1928z+41BBL hyper-proliferative population (f). g, Changes in clonality index over time in Rv-1928z and Rv-1928z+41BBL CAR T cells. h,i, Tracking the fate of the 100 most abundant pre-infusion clones in the hyper-proliferative populations of Rv-1928z (h) and Rv-1928z+41BBL (i). (j) Retro-tracking late-stage dominant clones in the infusion product (Day 0). All dominant clones were isolated at day 90 except for 2-00 which was isolated at day 200. p<0.05 was considered statistically significant. p values are denoted: p>0.05, not significant, NS; *, p<0.05; **, p< 0.01; ***, p<0.001; ****, p<0.0001.
Extended Data Fig. 8: In vitro and in vivo effector function assessment of TET2-edited and hyper-proliferative TET2bed CAR T cells.
a,b, In vitro cytolytic activity assessment upon co-culture with NALM6 for 16-hrs as determined by luciferase activity for pre-infusion TET2-edited Rv-1928z (n=3) and hyper-proliferative TET2bed Rv-1928z (2-2) (n=3) (a) and pre-infusion TET2-edited Rv-1928z+41BBL (n=3) and hyper-proliferative TET2bed Rv-1928z+41BBL (17-1) (n=3) (b). Data is represented as mean±SD. c, NALM6 bearing NSG mice were treated with 2e6 hyper-proliferative TET2bed Rv-1928z (n=7) or TET2bed Rv-1928z+41BBL (n=7) CAR T cells to assess their in vivo anti-tumour efficacy. d, Normalized transcript counts of WT Rv-1928z+41BBL and TET2bed Rv-1928z+41BBLCAR T cells isolated from mice at day 90. R=Rest (Transcript counts at isolation). S= Stimulated (Transcript counts 24 hours post CD3/28 stimulation). Data is represented as mean±SD (n=3). e, Schematic of in vitro repeated rechallenge assay for effector function analysis. f, g, Day 1 in vitro cytolytic activity assessment (f) and effector cytokine assessment (g). h, i, Day 8 in vitro cytolytic activity assessment (h) and effector cytokine assessment (i). j, k, Day 15 in vitro cytolytic activity assessment (j) and effector cytokine assessment (k). Data in f-k is represented as mean±SD (n=3). l, TCF1 staining of WT Rv-1928z+41BBL and TET2bed Rv-1928z+41BBL CAR T cells isolated from mice at day 90. WT samples were a pool of 5 mice. TCF1 staining of other hyper-proliferative TET2bed CAR T cells in SI Table 3. p values in a, b, f, h, j were determined by two-sided unpaired t-test corrected by BKY method. p values in c were determined by two-sided Mann-Whitney test. p values in d, g, i, k were determined by two-sided unpaired t-test. p<0.05 was considered statistically significant. p values are denoted: p>0.1, not significant, ns. p<0.1 are indicated. *, p<0.05. **, p<0.01.***, p<0.001.****, p<0.0001. Exact p values are available in SI Table 4.
Extended Data Fig. 9: No conserved secondary genetic mutation between different hyper-proliferative TET2bed CAR T populations dominant for a single clone.
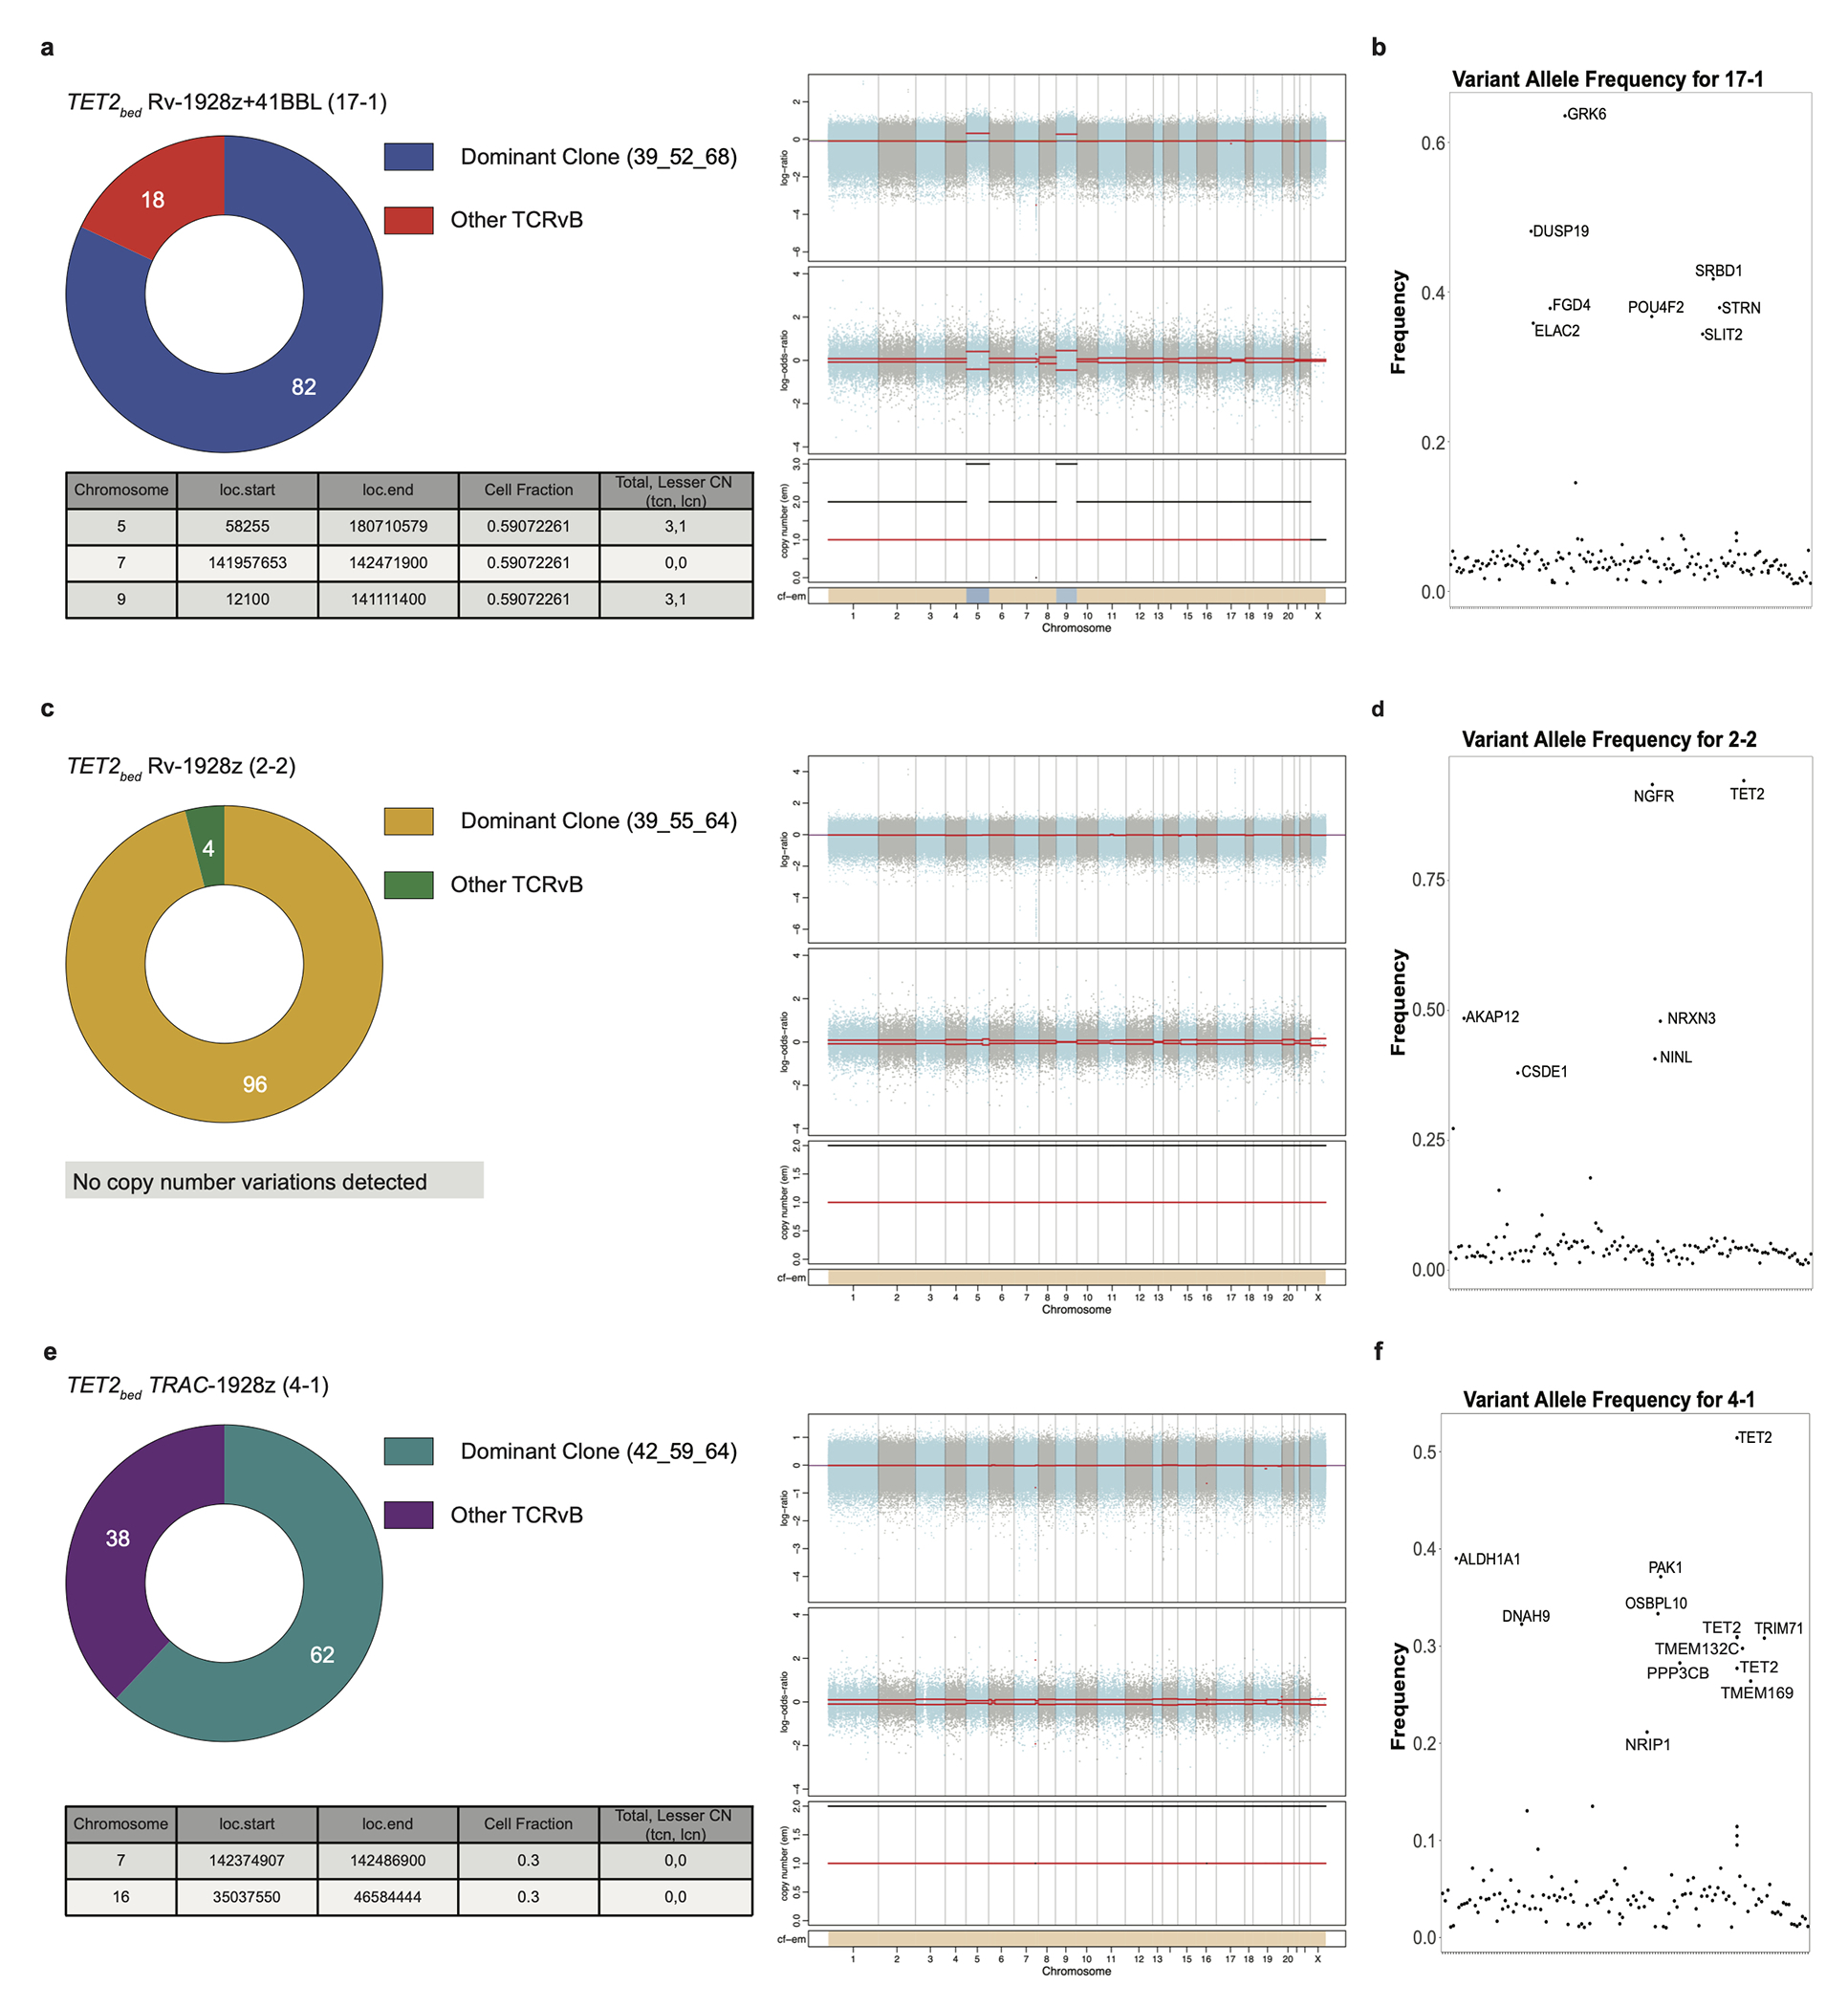
a, (Right panel) Copy number changes in TET2bed Rv-1928z+41BBL (17-1). The top panel displays log (ratio) denoted by “(logR)” with chromosomes alternating in the blue and gray. The middle panel displays log (odds-ratio) denoted by “(logOR)”. Segment means are plotted in red lines. In the bottom panel total (black) and minor (red) copy number are plotted for each segment. The bottom bar shows the associated cellular fraction (cf). Dark blue indicates high cf. Light blue indicates low cf. Beige indicates a normal segment (total=2, minor=1). The table shows genetic events occurring at >0.1 cf. (Left panel) CAR T cell clonality as determined by vβ sequencing in TET2bed Rv-1928z+41BBL (17-1). b, Nonsynonymous acquired point mutations in TET2bed Rv-1928z+41BBL (17-1). Mutations that occur at a frequency > ((dominant TCRvβ frequency/2) −0.1) or >0.3 whichever is lower is annotated. c, (Right panel) Copy number changes in TET2bed Rv-1928z (2-2). (Left panel) CAR T cell clonality as determined by vβ sequencing in TET2bed Rv-1928z (2-2). d, Nonsynonymous acquired point mutations in TET2bed Rv-1928z (2-2). e, (Right panel) Copy number changes in TET2bed TRAC-1928z (4-1). (Left panel) CAR T cell clonality as determined by vβ sequencing in TET2bed TRAC-1928z (4-1). f, Nonsynonymous acquired point mutations in TET2bed TRAC-1928z (4-1).
Extended Data Fig. 10: Hyper-proliferative TET2bed Rv-1928z+41BBL do not achieve uncontrolled proliferative state upon secondary transplant.
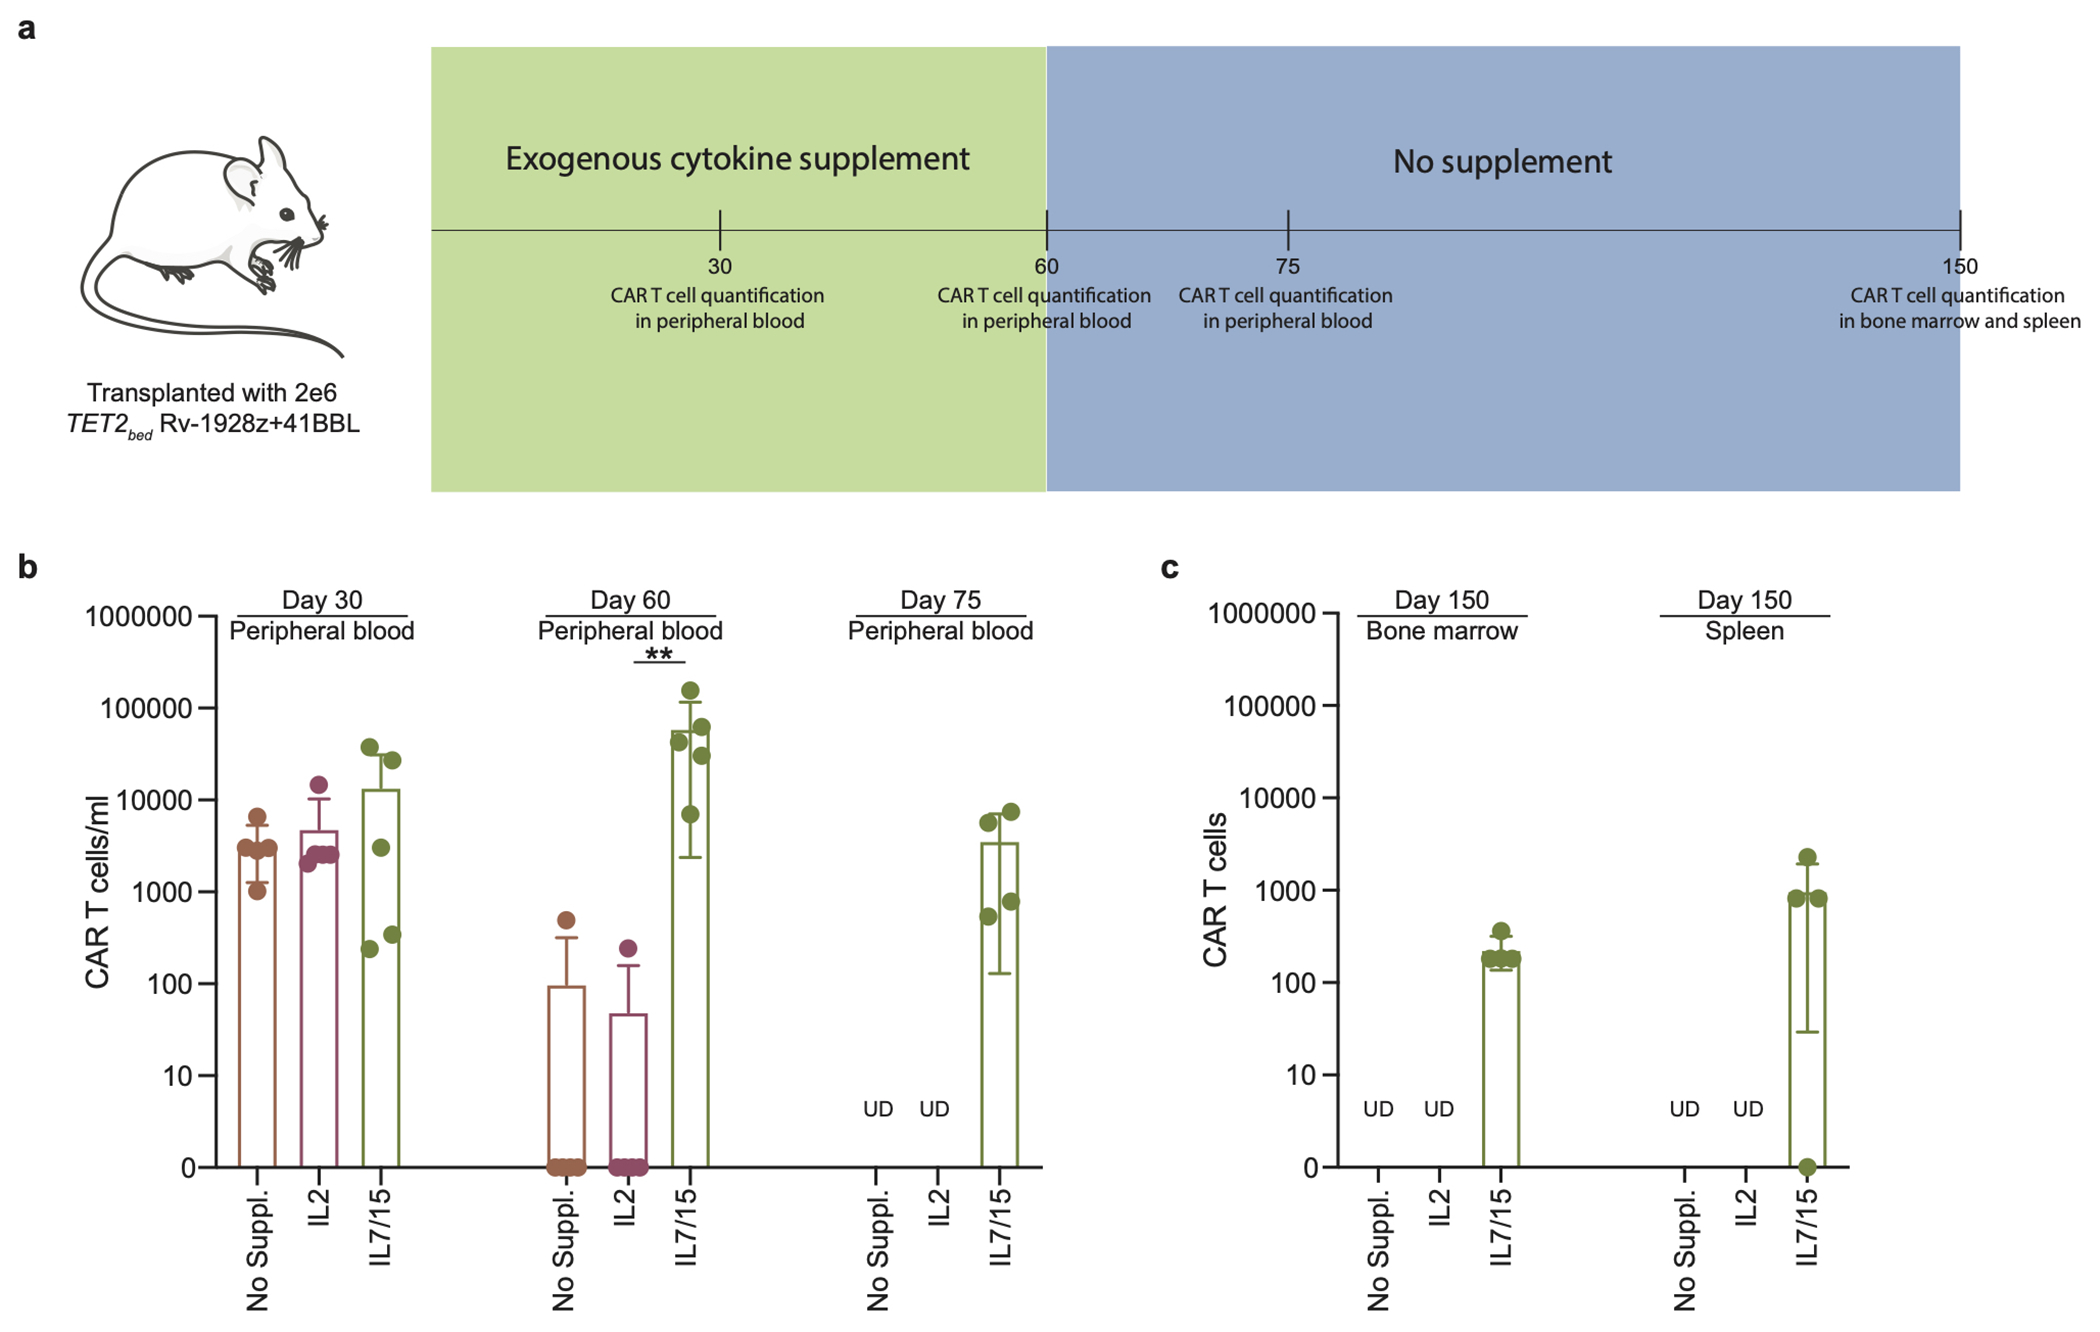
a, Schematics of secondary transplant of hyper-proliferative TET2bed Rv-1928z+41BBL cells. The exogenous cytokine supplement had to be stopped at day 60 due to deteriorating mice condition in response to frequent injections. b, CAR T cell quantification in peripheral blood under different exogenous supplementation at day 30, day 60 and day 75. Each dot represents a mouse. UD: undetected. Data is represented as mean±SD (n=5). c, CAR T cell quantification in bone marrow and spleen at day 150 post CAR T cell infusion. Data is represented as mean±SD (n=5 for no supplement, and IL2. n=4 for IL7/15). p values were determined by two-sided Mann–Whitney test (b). p<0.05 was considered statistically significant. p values are denoted: p>0.05, not significant, NS; *, p<0.05; **, p< 0.01.(b). Exact p values are available in SI Table 4.
Supplementary Material
SI Fig. 1: Kinetics of BATF3 and MYC expression in WT and TET2-edited CAR T cells.
a, Differentially accessible genomic regions between TET2bed Rv-1928z+41BBL and WT Rv-1928z+41BBL. Both samples were isolated from mice at day 90. The red dots are peaks with |fold change| >1.5 and (padj<0.1). b, Differential genomic accessibility in BATF3 and MYC regions ([TET2bed/WT Rv-1928z+41BBL]; padj<0.05). p values in a,b are adjusted for multiple comparisons by BKY method. c, Schematic of in vitro repeated rechallenge assay for BATF3 and MYC FACS analysis. d, CAR T cells were cultured with (stimulated) or without (unstimulated) irradiated 3T3-CD19. 24 hours later, BATF3 and MYC intracellular FACS was performed on pooled CAR T cells (pooled from 3 wells) for each condition. e, Kinetic analysis of BATF3 (top) and MYC (bottom) expression for Rv-1928z+41BBL CAR T cells. Fraction of positive cells is represented in red font; MFI is represented in green font. f, g, Day 15 BATF3 (f) and MYC (g) population fractions for WT and TET2-edited Rv-1928z+41BBL CAR T cells. p values in f,g were determined through two-sided χ2 test. Exact p values are available in SI Table 4.
SI Fig. 2: JQ1 and dexamethasone treatment inhibit TET2bed CAR T cell proliferation.
a, BATF3 gRNA targeting site (left panel). Pre-infusion CAR T cell BATF3 flow cytometry quantification. MFI is indicated. b-d, Schematics of the cell proliferation assay (b). The cells were either treated with DMSO, JQ1 (500nM) or dexamethasone (dexa, 1μm). DMSO normalized cell counts for JQ1 (c) and dexa (d). p-values were determined by two-sided unpaired t-test (c, d). e-g, Schematics of qPCR study (e). CAR T cells were treated with DMSO, JQ1 or dexa at the same dose as cell proliferation assay for 12 hours. Transcripts were normalized to B2M for each sample. DMSO normalized BATF3 and MYC levels under JQ1 treatment (f) and dexa (g). Multiple unpaired unpaired t-tests corrected by BKY method (f, g). Data in c, d, f, g is presented as mean±SD. (n=4). p<0.05 was considered statistically significant. p values are denoted: p>0.05, not significant, NS; *, p<0.05; **, p< 0.01; ***, p<0.001; ****, p<0.0001. Exact p values are available in SI Table 4.
SI Fig. 3: Effector loci accessibility in long-term persisting WT and TET2bed CAR T cells.
a-d, Genome accessibility in WT and TET2bed CAR T cells for IL2 (a), GZMB (b), IFNG (c), and TNF (d). These genome accessibility tracks are representative of n=3.
SI Fig. 4: Flow Cytometry gating strategy.
a, Gating strategy for Extended Data Fig. 1a, 1b, 2a and 2b (left panel). b, Gating strategy for Extended Data Fig. 1a, 1b, 2a, 2b (right panel), 1g, 2eand 3a. c, Gating strategy for Extended Data Fig. 1i, 2g and 3c. d, Gating strategy for Fig. 5f. e, Gating strategy for Extended Data Fig. 8l.
SI Table 5: List of antibodies used in the flow cytometry.
SI Table 4: Exact p values for figures.
4a-i, Exact p values for selected panels in Fig. 2 (a), Fig. 4 (b), Fig. 5 (c), Extended Data Fig. 1 (d), Extended Data Fig. 4 (e), Extended Data Fig. 8 (f), Extended Data Fig. 10 (g), SI Fig. 1 (h), SI Fig. 2 (i).
SI Table 2: Retroviral integration site analysis in hyper-proliferative TET2bed CAR T cells. 2a, Retrovirus integration site analysis for TET2bed Rv-1928z+41BBL (17-1). 2b, Retrovirus integration site analysis for TET2bed Rv-1928z (2-2).
SI Table 3: Replicate information on representative figures.
3a-d, Replicate information for selected panels in Extended Data Fig. 1 (a), Extended Data Fig. 2 (b), Extended Data Fig. 3 (c), and Extended Data Fig. 8 (d).
SI Table 1: Exome analysis of hyper-proliferative TET2bed CAR T cells.
1a, Translocation analysis in TET2bed hyper-proliferative CAR T cells. 1b, Mutation analysis in TET2bed hyper-proliferative CAR T cells. 1c, Copy number analysis in TET2bed hyper-proliferative CAR T cells.
ACKNOWLEDGMENTS
We thank members of the Sadelain lab for helpful discussion and feedback. We thank Dr Caitlin Zebley, Dr Ben Youngblood (Saint Jude Children Research Hospital, Memphis, TN), Dr Kristian Helin (SKI), and the Sloan Kettering Institute Centre of Epigenetics Research for advice on epigenetic analysis. We thank Dr Jacob Boyer (SKI) for Western Blot support. We thank Dr Nicholas Socci (SKI) for advice on exome analysis. We thank Dr Manfred Schmidt (Genewerk GmBH, Heidelberg, Germany) for retroviral Integration Site Analysis. We thank Drs Sébastien Monette and Adam Michel from SKI/CUMC laboratory of Comparative Pathology for conducting pathology analysis. We thank the following SKI core facilities for their support: Flow Cytometry, Centre of Comparative Medicine & Pathology, Anti-tumour assessment, Molecular Cytology, Bioinformatics, Integrated Genomics Operation and Cell Therapy and Cell Engineering. Parts of figure illustrations were generated using Servier Medical Art, provided by Servier, licensed under a Creative Commons Attribution 3.0 unported license. This work was supported by the Pasteur-Weizmann/Servier award, the Leopold Griffuel award, the Leukemia and Lymphoma society (LLS ID: 7014-17), and MSKCC Core Grant (P30 CA008748).
Footnotes
DECLARATION OF INTERESTS
The authors declare no competing interests.
References:
- 1.Kakarla S & Gottschalk S CAR T cells for solid tumors: armed and ready to go? Cancer J 20, 151–155 (2014). 10.1097/PPO.0000000000000032 [DOI] [PMC free article] [PubMed] [Google Scholar]
- 2.Sadelain M, Riviere I & Riddell S Therapeutic T cell engineering. Nature 545, 423–431 (2017). 10.1038/nature22395 [DOI] [PMC free article] [PubMed] [Google Scholar]
- 3.June CH & Sadelain M Chimeric Antigen Receptor Therapy. N Engl J Med 379, 64–73 (2018). 10.1056/NEJMra1706169 [DOI] [PMC free article] [PubMed] [Google Scholar]
- 4.Guedan S, Calderon H, Posey AD Jr. & Maus MV Engineering and Design of Chimeric Antigen Receptors. Mol Ther Methods Clin Dev 12, 145–156 (2019). 10.1016/j.omtm.2018.12.009 [DOI] [PMC free article] [PubMed] [Google Scholar]
- 5.Globerson Levin A, Riviere I, Eshhar Z & Sadelain M CAR T cells: Building on the CD19 paradigm. Eur J Immunol 51, 2151–2163 (2021). 10.1002/eji.202049064 [DOI] [PMC free article] [PubMed] [Google Scholar]
- 6.Philip M et al. Chromatin states define tumour-specific T cell dysfunction and reprogramming. Nature 545, 452–456 (2017). 10.1038/nature22367 [DOI] [PMC free article] [PubMed] [Google Scholar]
- 7.Khan O et al. TOX transcriptionally and epigenetically programs CD8(+) T cell exhaustion. Nature 571, 211–218 (2019). 10.1038/s41586-019-1325-x [DOI] [PMC free article] [PubMed] [Google Scholar]
- 8.Pastor WA, Aravind L & Rao A TETonic shift: biological roles of TET proteins in DNA demethylation and transcription. Nat Rev Mol Cell Biol 14, 341–356 (2013). 10.1038/nrm3589 [DOI] [PMC free article] [PubMed] [Google Scholar]
- 9.Carty SA et al. The Loss of TET2 Promotes CD8(+) T Cell Memory Differentiation. J Immunol 200, 82–91 (2018). 10.4049/jimmunol.1700559 [DOI] [PMC free article] [PubMed] [Google Scholar]
- 10.Fraietta JA et al. Disruption of TET2 promotes the therapeutic efficacy of CD19-targeted T cells. Nature 558, 307–312 (2018). 10.1038/s41586-018-0178-z [DOI] [PMC free article] [PubMed] [Google Scholar]
- 11.Bowman RL & Levine RL TET2 in Normal and Malignant Hematopoiesis. Cold Spring Harb Perspect Med 7 (2017). 10.1101/cshperspect.a026518 [DOI] [PMC free article] [PubMed] [Google Scholar]
- 12.Chiba S Dysregulation of TET2 in hematologic malignancies. Int J Hematol 105, 17–22 (2017). 10.1007/s12185-016-2122-z [DOI] [PubMed] [Google Scholar]
- 13.Kaech SM, Wherry EJ & Ahmed R Effector and memory T-cell differentiation: implications for vaccine development. Nat Rev Immunol 2, 251–262 (2002). 10.1038/nri778 [DOI] [PubMed] [Google Scholar]
- 14.Farber DL, Yudanin NA & Restifo NP Human memory T cells: generation, compartmentalization and homeostasis. Nat Rev Immunol 14, 24–35 (2014). 10.1038/nri3567 [DOI] [PMC free article] [PubMed] [Google Scholar]
- 15.Wherry EJ T cell exhaustion. Nat Immunol 12, 492–499 (2011). 10.1038/ni.2035 [DOI] [PubMed] [Google Scholar]
- 16.Blank CU et al. Defining ‘T cell exhaustion’. Nat Rev Immunol 19, 665–674 (2019). 10.1038/s41577-019-0221-9 [DOI] [PMC free article] [PubMed] [Google Scholar]
- 17.Majzner RG & Mackall CL Clinical lessons learned from the first leg of the CAR T cell journey. Nat Med 25, 1341–1355 (2019). 10.1038/s41591-019-0564-6 [DOI] [PubMed] [Google Scholar]
- 18.Rafiq S, Hackett CS & Brentjens RJ Engineering strategies to overcome the current roadblocks in CAR T cell therapy. Nat Rev Clin Oncol 17, 147–167 (2020). 10.1038/s41571-019-0297-y [DOI] [PMC free article] [PubMed] [Google Scholar]
- 19.Tahiliani M et al. Conversion of 5-methylcytosine to 5-hydroxymethylcytosine in mammalian DNA by MLL partner TET1. Science 324, 930–935 (2009). 10.1126/science.1170116 [DOI] [PMC free article] [PubMed] [Google Scholar]
- 20.Delhommeau F et al. Mutation in TET2 in myeloid cancers. N Engl J Med 360, 2289–2301 (2009). 10.1056/NEJMoa0810069 [DOI] [PubMed] [Google Scholar]
- 21.Tefferi A, Lim KH & Levine R Mutation in TET2 in myeloid cancers. N Engl J Med 361, 1117; author reply 1117–1118 (2009). 10.1056/NEJMc091348 [DOI] [PubMed] [Google Scholar]
- 22.Watatani Y et al. Molecular heterogeneity in peripheral T-cell lymphoma, not otherwise specified revealed by comprehensive genetic profiling. Leukemia 33, 2867–2883 (2019). 10.1038/s41375-019-0473-1 [DOI] [PubMed] [Google Scholar]
- 23.Zhao Z et al. Structural Design of Engineered Costimulation Determines Tumor Rejection Kinetics and Persistence of CAR T Cells. Cancer Cell 28, 415–428 (2015). 10.1016/j.ccell.2015.09.004 [DOI] [PMC free article] [PubMed] [Google Scholar]
- 24.Eyquem J et al. Targeting a CAR to the TRAC locus with CRISPR/Cas9 enhances tumour rejection. Nature 543, 113–117 (2017). 10.1038/nature21405 [DOI] [PMC free article] [PubMed] [Google Scholar]
- 25.Lollies A et al. An oncogenic axis of STAT-mediated BATF3 upregulation causing MYC activity in classical Hodgkin lymphoma and anaplastic large cell lymphoma. Leukemia 32, 92–101 (2018). 10.1038/leu.2017.203 [DOI] [PubMed] [Google Scholar]
- 26.Nakagawa M et al. Targeting the HTLV-I-Regulated BATF3/IRF4 Transcriptional Network in Adult T Cell Leukemia/Lymphoma. Cancer Cell 34, 286–297 e210 (2018). 10.1016/j.ccell.2018.06.014 [DOI] [PMC free article] [PubMed] [Google Scholar]
- 27.Liang HC et al. Super-enhancer-based identification of a BATF3/IL-2R-module reveals vulnerabilities in anaplastic large cell lymphoma. Nat Commun 12, 5577 (2021). 10.1038/s41467-021-25379-9 [DOI] [PMC free article] [PubMed] [Google Scholar]
- 28.Gonzalez MV et al. Glucocorticoids antagonize AP-1 by inhibiting the Activation/phosphorylation of JNK without affecting its subcellular distribution. J Cell Biol 150, 1199–1208 (2000). 10.1083/jcb.150.5.1199 [DOI] [PMC free article] [PubMed] [Google Scholar]
- 29.Patil RH et al. Dexamethasone inhibits inflammatory response via down regulation of AP-1 transcription factor in human lung epithelial cells. Gene 645, 85–94 (2018). 10.1016/j.gene.2017.12.024 [DOI] [PubMed] [Google Scholar]
- 30.Kafer GR et al. 5-Hydroxymethylcytosine Marks Sites of DNA Damage and Promotes Genome Stability. Cell Rep 14, 1283–1292 (2016). 10.1016/j.celrep.2016.01.035 [DOI] [PubMed] [Google Scholar]
- 31.Chen LL et al. SNIP1 Recruits TET2 to Regulate c-MYC Target Genes and Cellular DNA Damage Response. Cell Rep 25, 1485–1500 e1484 (2018). 10.1016/j.celrep.2018.10.028 [DOI] [PMC free article] [PubMed] [Google Scholar]
- 32.Lynn RC et al. c-Jun overexpression in CAR T cells induces exhaustion resistance. Nature 576, 293–300 (2019). 10.1038/s41586-019-1805-z [DOI] [PMC free article] [PubMed] [Google Scholar]
- 33.Seo H et al. BATF and IRF4 cooperate to counter exhaustion in tumor-infiltrating CAR T cells. Nat Immunol 22, 983–995 (2021). 10.1038/s41590-021-00964-8 [DOI] [PMC free article] [PubMed] [Google Scholar]
- 34.Man K et al. The transcription factor IRF4 is essential for TCR affinity-mediated metabolic programming and clonal expansion of T cells. Nat Immunol 14, 1155–1165 (2013). 10.1038/ni.2710 [DOI] [PubMed] [Google Scholar]
- 35.Man K et al. Transcription Factor IRF4 Promotes CD8(+) T Cell Exhaustion and Limits the Development of Memory-like T Cells during Chronic Infection. Immunity 47, 1129–1141 e1125 (2017). 10.1016/j.immuni.2017.11.021 [DOI] [PubMed] [Google Scholar]
- 36.McCutcheon CMR Amador A, Barrera L Humayun & Gersbach C. in ASGCT Annual Meeting 2022. [Google Scholar]
- 37.Ataide MA et al. BATF3 programs CD8(+) T cell memory. Nat Immunol 21, 1397–1407 (2020). 10.1038/s41590-020-0786-2 [DOI] [PubMed] [Google Scholar]
- 38.Eferl R & Wagner EF AP-1: a double-edged sword in tumorigenesis. Nat Rev Cancer 3, 859–868 (2003). 10.1038/nrc1209 [DOI] [PubMed] [Google Scholar]
- 39.Schreiber M et al. Control of cell cycle progression by c-Jun is p53 dependent. Genes Dev 13, 607–619 (1999). 10.1101/gad.13.5.607 [DOI] [PMC free article] [PubMed] [Google Scholar]
- 40.Logan MR, Jordan-Williams KL, Poston S, Liao J & Taparowsky EJ Overexpression of Batf induces an apoptotic defect and an associated lymphoproliferative disorder in mice. Cell Death Dis 3, e310 (2012). 10.1038/cddis.2012.49 [DOI] [PMC free article] [PubMed] [Google Scholar]
- 41.Quivoron C et al. TET2 inactivation results in pleiotropic hematopoietic abnormalities in mouse and is a recurrent event during human lymphomagenesis. Cancer Cell 20, 25–38 (2011). 10.1016/j.ccr.2011.06.003 [DOI] [PubMed] [Google Scholar]
- 42.Couronne L, Bastard C & Bernard OA TET2 and DNMT3A mutations in human T-cell lymphoma. N Engl J Med 366, 95–96 (2012). 10.1056/NEJMc1111708 [DOI] [PubMed] [Google Scholar]
- 43.Zhang X et al. DNMT3A and TET2 compete and cooperate to repress lineage-specific transcription factors in hematopoietic stem cells. Nat Genet 48, 1014–1023 (2016). 10.1038/ng.3610 [DOI] [PMC free article] [PubMed] [Google Scholar]
- 44.Kong W et al. BET bromodomain protein inhibition reverses chimeric antigen receptor extinction and reinvigorates exhausted T cells in chronic lymphocytic leukemia. J Clin Invest 131 (2021). 10.1172/JCI145459 [DOI] [PMC free article] [PubMed] [Google Scholar]
Methods Reference
- 45.Riviere I, Brose K & Mulligan RC Effects of retroviral vector design on expression of human adenosine deaminase in murine bone marrow transplant recipients engrafted with genetically modified cells. Proc Natl Acad Sci U S A 92, 6733–6737, doi: 10.1073/pnas.92.15.6733 (1995). [DOI] [PMC free article] [PubMed] [Google Scholar]
- 46.Gallardo HF, Tan C, Ory D & Sadelain M Recombinant retroviruses pseudotyped with the vesicular stomatitis virus G glycoprotein mediate both stable gene transfer and pseudotransduction in human peripheral blood lymphocytes. Blood 90, 952–957 (1997). [PubMed] [Google Scholar]
- 47.Brentjens RJ et al. Eradication of systemic B-cell tumors by genetically targeted human T lymphocytes co-stimulated by CD80 and interleukin-15. Nat Med 9, 279–286, doi: 10.1038/nm827 (2003). [DOI] [PubMed] [Google Scholar]
- 48.Brentjens RJ et al. Genetically targeted T cells eradicate systemic acute lymphoblastic leukemia xenografts. Clin Cancer Res 13, 5426–5435, doi: 10.1158/1078-0432.CCR-07-0674 (2007). [DOI] [PubMed] [Google Scholar]
- 49.Gong MC et al. Cancer patient T cells genetically targeted to prostate-specific membrane antigen specifically lyse prostate cancer cells and release cytokines in response to prostate-specific membrane antigen. Neoplasia 1, 123–127, doi: 10.1038/sj.neo.7900018 (1999). [DOI] [PMC free article] [PubMed] [Google Scholar]
- 50.Brentjens RJ et al. CD19-targeted T cells rapidly induce molecular remissions in adults with chemotherapy-refractory acute lymphoblastic leukemia. Sci Transl Med 5, 177ra138, doi: 10.1126/scitranslmed.3005930 (2013). [DOI] [PMC free article] [PubMed] [Google Scholar]
- 51.Stephan MT et al. T cell-encoded CD80 and 4-1BBL induce auto- and transcostimulation, resulting in potent tumor rejection. Nat Med 13, 1440–1449, doi: 10.1038/nm1676 (2007). [DOI] [PubMed] [Google Scholar]
- 52.Stoklasek TA, Schluns KS & Lefrancois L Combined IL-15/IL-15Ralpha immunotherapy maximizes IL-15 activity in vivo. J Immunol 177, 6072–6080, doi: 10.4049/jimmunol.177.9.6072 (2006). [DOI] [PMC free article] [PubMed] [Google Scholar]
- 53.Buenrostro JD, Giresi PG, Zaba LC, Chang HY & Greenleaf WJ Transposition of native chromatin for fast and sensitive epigenomic profiling of open chromatin, DNA-binding proteins and nucleosome position. Nat Methods 10, 1213–1218, doi: 10.1038/nmeth.2688 (2013). [DOI] [PMC free article] [PubMed] [Google Scholar]
- 54.Schmidt M et al. Detection and direct genomic sequencing of multiple rare unknown flanking DNA in highly complex samples. Hum Gene Ther 12, 743–749, doi: 10.1089/104303401750148649 (2001). [DOI] [PubMed] [Google Scholar]
- 55.Gabriel R et al. Comprehensive genomic access to vector integration in clinical gene therapy. Nat Med 15, 1431–1436, doi: 10.1038/nm.2057 (2009). [DOI] [PubMed] [Google Scholar]
- 56.Paruzynski A et al. Genome-wide high-throughput integrome analyses by nrLAM-PCR and next-generation sequencing. Nat Protoc 5, 1379–1395, doi: 10.1038/nprot.2010.87 (2010). [DOI] [PubMed] [Google Scholar]
- 57.Afzal S, Wilkening S, von Kalle C, Schmidt M & Fronza R GENE-IS: Time-Efficient and Accurate Analysis of Viral Integration Events in Large-Scale Gene Therapy Data. Mol Ther Nucleic Acids 6, 133–139, doi: 10.1016/j.omtn.2016.12.001 (2017). [DOI] [PMC free article] [PubMed] [Google Scholar]
- 58.Li H & Durbin R Fast and accurate short read alignment with Burrows-Wheeler transform. Bioinformatics 25, 1754–1760, doi: 10.1093/bioinformatics/btp324 (2009). [DOI] [PMC free article] [PubMed] [Google Scholar]
- 59.Altschul SF, Gish W, Miller W, Myers EW & Lipman DJ Basic local alignment search tool. J Mol Biol 215, 403–410, doi: 10.1016/S0022-2836(05)80360-2 (1990). [DOI] [PubMed] [Google Scholar]
Associated Data
This section collects any data citations, data availability statements, or supplementary materials included in this article.
Supplementary Materials
SI Fig. 1: Kinetics of BATF3 and MYC expression in WT and TET2-edited CAR T cells.
a, Differentially accessible genomic regions between TET2bed Rv-1928z+41BBL and WT Rv-1928z+41BBL. Both samples were isolated from mice at day 90. The red dots are peaks with |fold change| >1.5 and (padj<0.1). b, Differential genomic accessibility in BATF3 and MYC regions ([TET2bed/WT Rv-1928z+41BBL]; padj<0.05). p values in a,b are adjusted for multiple comparisons by BKY method. c, Schematic of in vitro repeated rechallenge assay for BATF3 and MYC FACS analysis. d, CAR T cells were cultured with (stimulated) or without (unstimulated) irradiated 3T3-CD19. 24 hours later, BATF3 and MYC intracellular FACS was performed on pooled CAR T cells (pooled from 3 wells) for each condition. e, Kinetic analysis of BATF3 (top) and MYC (bottom) expression for Rv-1928z+41BBL CAR T cells. Fraction of positive cells is represented in red font; MFI is represented in green font. f, g, Day 15 BATF3 (f) and MYC (g) population fractions for WT and TET2-edited Rv-1928z+41BBL CAR T cells. p values in f,g were determined through two-sided χ2 test. Exact p values are available in SI Table 4.
SI Fig. 2: JQ1 and dexamethasone treatment inhibit TET2bed CAR T cell proliferation.
a, BATF3 gRNA targeting site (left panel). Pre-infusion CAR T cell BATF3 flow cytometry quantification. MFI is indicated. b-d, Schematics of the cell proliferation assay (b). The cells were either treated with DMSO, JQ1 (500nM) or dexamethasone (dexa, 1μm). DMSO normalized cell counts for JQ1 (c) and dexa (d). p-values were determined by two-sided unpaired t-test (c, d). e-g, Schematics of qPCR study (e). CAR T cells were treated with DMSO, JQ1 or dexa at the same dose as cell proliferation assay for 12 hours. Transcripts were normalized to B2M for each sample. DMSO normalized BATF3 and MYC levels under JQ1 treatment (f) and dexa (g). Multiple unpaired unpaired t-tests corrected by BKY method (f, g). Data in c, d, f, g is presented as mean±SD. (n=4). p<0.05 was considered statistically significant. p values are denoted: p>0.05, not significant, NS; *, p<0.05; **, p< 0.01; ***, p<0.001; ****, p<0.0001. Exact p values are available in SI Table 4.
SI Fig. 3: Effector loci accessibility in long-term persisting WT and TET2bed CAR T cells.
a-d, Genome accessibility in WT and TET2bed CAR T cells for IL2 (a), GZMB (b), IFNG (c), and TNF (d). These genome accessibility tracks are representative of n=3.
SI Fig. 4: Flow Cytometry gating strategy.
a, Gating strategy for Extended Data Fig. 1a, 1b, 2a and 2b (left panel). b, Gating strategy for Extended Data Fig. 1a, 1b, 2a, 2b (right panel), 1g, 2eand 3a. c, Gating strategy for Extended Data Fig. 1i, 2g and 3c. d, Gating strategy for Fig. 5f. e, Gating strategy for Extended Data Fig. 8l.
SI Table 5: List of antibodies used in the flow cytometry.
SI Table 4: Exact p values for figures.
4a-i, Exact p values for selected panels in Fig. 2 (a), Fig. 4 (b), Fig. 5 (c), Extended Data Fig. 1 (d), Extended Data Fig. 4 (e), Extended Data Fig. 8 (f), Extended Data Fig. 10 (g), SI Fig. 1 (h), SI Fig. 2 (i).
SI Table 2: Retroviral integration site analysis in hyper-proliferative TET2bed CAR T cells. 2a, Retrovirus integration site analysis for TET2bed Rv-1928z+41BBL (17-1). 2b, Retrovirus integration site analysis for TET2bed Rv-1928z (2-2).
SI Table 3: Replicate information on representative figures.
3a-d, Replicate information for selected panels in Extended Data Fig. 1 (a), Extended Data Fig. 2 (b), Extended Data Fig. 3 (c), and Extended Data Fig. 8 (d).
SI Table 1: Exome analysis of hyper-proliferative TET2bed CAR T cells.
1a, Translocation analysis in TET2bed hyper-proliferative CAR T cells. 1b, Mutation analysis in TET2bed hyper-proliferative CAR T cells. 1c, Copy number analysis in TET2bed hyper-proliferative CAR T cells.
Data Availability Statement
Data generated from RNA-seq and ATAC-seq has been deposited in the GeneExpressionOmnibus (GEO) with accession number GSE220259. The publicly available datasets used in this study are GSE23321 for central memory and effector memory phenotype comparison, AKL_HTLV1_UP (M7705), AKL_HTLV1_DN (M9815), AITL dataset (GSE6338), HALLMARK_MYC_V1 (M5926).