

SUMMARY
Recent studies have revealed the heterogeneous nature of astrocytes; however, how diverse constituents of astrocyte-lineage cells are regulated in adult spinal cord after injury and contribute to regeneration remains elusive. We perform single-cell RNA sequencing of GFAP-expressing cells from sub-chronic spinal cord injury models and identify and compare with the subpopulations in acute-stage data. We find subpopulations with distinct functional enrichment and their identities defined by subpopulation-specific transcription factors and regulons. Immunohistochemistry, RNAscope experiments, and quantification by stereology verify the molecular signature, location, and morphology of potential resident neural progenitors or neural stem cells in the adult spinal cord before and after injury and uncover the populations of the intermediate cells enriched in neuronal genes that could potentially transition into other subpopulations. This study has expanded the knowledge of the heterogeneity and cell state transition of glial progenitors in adult spinal cord before and after injury.
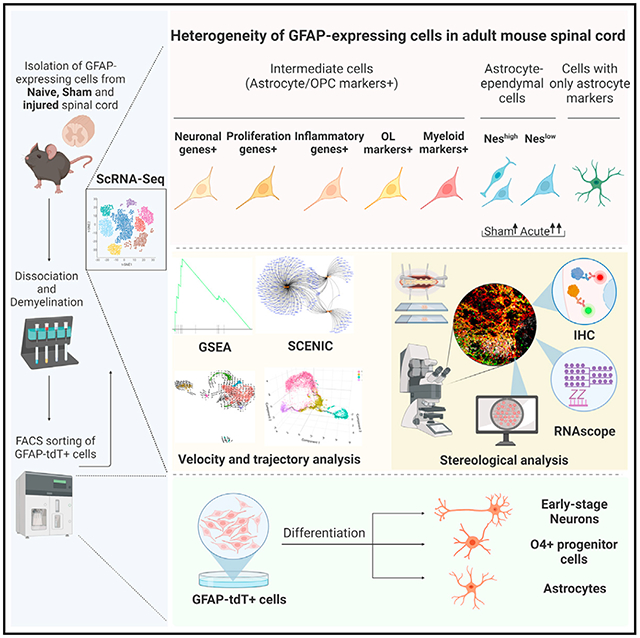
Graphical abstract
In brief
Wei et al. report the identification of the subpopulations of GFAP-expressing cells in healthy and injured adult spinal cords using single-cell RNA-seq. Bioinformatic and functional investigations of these subpopulations revealed the signature, location, morphology, and proliferation and differentiation abilities of the resident progenitors in the spinal cord.
INTRODUCTION
Spinal cord injury (SCI) leads to permanent, devastating loss of sensorimotor and autonomic functions.1-3 Astrocytes are the predominant cellular component of the scar after SCI. Astro-cyte-lineage cells respond to the injury microenvironment and become reactive.2,4-6 They secrete inhibitory factors that may limit neuroregeneration but they also play a crucial role in neural protection and repair.6-11 Defining the complex astroglia and astroglial precursor response to injury will be important to delineate the protective and regenerative pathways from those that restrict plasticity and could lead to the development of improved therapeutics to target specific astroglial subpopulations/states.
Although recent studies in brain and spinal cord have revealed that astrocyte-lineage cells are more heterogeneous than previously thought,12-17 the understanding of the dynamics of astrocyte-lineage cells after SCI is still limited. For example, the combinations of molecular signatures of astroglial subpopulations or states and their morphological features in adult spinal cord have yet to be fully described. We have previously studied gene expression using RNA sequencing (RNA-seq) in both tissue sample and fluorescence-activated cell sorting (FACS)-purified GFAP-expressing cells from adult spinal cord using GFAP-Cre:R26-tdTomato (tdT) transgenic mouse model over a time course.18-20 Although the global SCI RNA-seq analysis provided important information on the transcriptional profiles of the spinal cord and astrocyte lineage in general, these analyses did not define the diverse constituents of astrocyte-lineage cells and how they may be regulated after injury or contribute to regeneration. Interestingly, glial progenitors and neural stem cells (NSCs) can express astrocyte markers such as GFAP during development21-24; however, the identities of GFAP-expressing progenitors in adult spinal cord have not been studied in detail.
Single-cell RNA-seq (scRNA-seq) offers a sensitive and unbiased tool for detecting cell types/subpopulations. Lately, this technology has been used to classify the cell compositions of various tissues, including different mouse and human brain regions.25-27 As the majority of patients suffering from SCI are in the chronic or sub-chronic stages, in the current study we dissected the cellular heterogeneity of GFAP-expressing cells using scRNA-seq from a clinically relevant, sub-chronic injury model. We compared injury data with sham (laminectomy) and naive mouse models. Additionally, a recent scRNA-seq study revealed the transcriptional states of cells isolated from spinal cord tissue from the early stages of SCI,28 providing a beneficial resource; however, the heterogeneity/states of astrocyte-lineage cellswere not fully analyzed and their molecular signatures were not characterized. Therefore, we re-analyzed these data and compared them with subpopulations in our sub-chronic SCI dataset. We observed that the main astrocyte-lineage-cell populations identified in sub-chronic stage were also detectable in acute stage, although the transcriptional states and proliferation properties of some populations differed. We characterized the cell subpopulation/states by establishing a gene marker panel (molecular signature) specific for each subpopulation. Interestingly, we have uncovered the populations of intermediate cells in adult spinal cord expressing both astrocyte and oligodendrocyte precursor cell (OPC) markers, among which we found subtypes enriched in neuronal, proliferative, inflammation, oligodendrocyte, or myeloid cell markers. Specific intermediate cell subpopulations depicted an increase in the proportion of cells in the S+G2M cell-cycle phase after injury. We have also identified cell populations expressing both astrocyte and ependymal cell markers and cells expressing only astrocyte markers. These cells increased significantly in the acute injury phase compared with the uninjured. We validated the existence of the subpopulations by histological confirmation of cell morphology and RNA/protein localization.
It has been reported by others that ependymal cells in the central canal of spinal cord exhibited multipotency after injury.29-31 Intriguingly, the stereological analysis showed the presence of astrocyte-ependymal subpopulations outside of the central canal not only in injured samples but also in naive samples. These resident astrocyte-ependymal cells in naive animals were distributed preferentially in white matter (WM) and to a lesser degree in gray matter (GM). The number of astrocyte-ependymal cells increased following sham surgery and further expanded after acute injury. Interestingly, our analyses and experimentation uncovered an astrocyte-ependymal-Nestin (Nes)high population. The molecular signatures, enhanced proportion of S+G2M cell-cycle phase, radial-glia-like morphologies, and higher signaling entropy rate (SR) score of astrocyte-ependymal-Neshigh cells indicate these cells may be neural progenitor cell (NPC)/NSC-like cells that are de-differentiated from astrocyte-ependymal cells in the adult spinal cord.
Overall, our studies demonstrated the molecular divergence and dynamics of glial progenitor subpopulations in healthy and injured adult spinal cords. Additionally, we characterized their differentiation capability in the presence of differentiation signals. The transcription factors (TFs) and regulons defining the cell identity were analyzed. scRNA-seq and immunostaining results also revealed that laminectomy sham surgery was sufficient to induce the activation of astrocyte-lineage cells, suggesting careful considerations are necessary when using sham as a baseline control for SCI.32
RESULTS
scRNA-seq reveals distinct subpopulations of GFAP-expressing cells in sub-chronic stage after SCI
It has been demonstrated that astrocytes play important roles in scar formation and repair after SCI.33,34 Here we purified GFAP-expressing cells from adult GFAP-Cre:R26-tdT spinal cord encompassing epicenter at 1 month after moderate compression injury (SCI1M) and from the corresponding regions of the naive and sham controls (Figure S1A). We dissected the cellular heterogeneity of GFAP-expressing cells using scRNA-seq (Figure 1A). By comparing the expression of tdT with endogenous GFAP protein expression using SCI spinal cord tissue, we verified the tdT+ cells overlapped with the GFAP immunostaining very well in vivo (Figure S1B). To further confirm the quality of the FACS-sorted tdT+ cells from our transgenic models, we quantified the percentage of GFAP+/tdT+ double-positive cells among FACS-sorted cells with immunocytochemistry. We found that 79% of tdT+ cells expressed detectable GFAP protein (Figure S1C, the top row). This is likely an underestimate given that cells are fragile after dissociation and may have decreased protein expression and/or undergone protein degradation. This confirms that the majority of tdT+ cells have detectable GFAP protein, which agrees with the histological result and is consistent with the extensive characterization of this mouse model by the Sofroniew group.35-38
Figure 1. scRNA-seq of GFAP-expressing cells from naive, sham, and SCI1M samples.

(A) Scheme of the experimental workflow.
(B) UMAP visualization showing clustering of astrocyte-lineage cells. Colors depict different clusters identified.
(C) Heatmap representing the gene expression of the top 10 DEGs in each cluster. Gene expression levels are color coded, ranging from dark blue (low expression levels) to red (high expression levels).
(D) Dot plot displaying the average expression levels of marker genes identified in each cluster.
(E) GSEA depicting p value and normalized enrichment scores (NES) of some examples of significantly enriched functions in cluster 0/1/2/4.
(F) Visualization of the RNA-velocity analysis overlaid on the UMAP embedding of GFAP-expressing cells. Colors correspond to clusters identified in each of the three conditions. Arrows represent the velocity vectors (speed and direction) of gene expression changes.
Subsequently, the cells with multiple known astrocyte markers (e.g., Aldoc, Atp1b2, Ndrg2, S100b, or Slc1a2) were retained and further analyzed.39-42 Clustering analysis showed seven astrocyte-lineage-cell clusters (cluster 0~6) visualized by unsupervised Uniform Manifold Approximation and Projection (UMAP) (Figure 1B). We identified differentially expressed genes (DEGs) in each cluster compared with all other clusters using the Seurat package.43 The expression patterns of the top 10 DEGs in each cluster exhibited significant differences among the subpopulations/states (Figure 1C). The expression of selected cell-type marker genes indicated diverse subpopulations/states of GFAP-expressing cells in the spinal cord (Figure 1D). Cluster 3 cells (referred to as cells with only astrocyte markers in the later part of the article) were only enriched in various astrocyte markers such as Atp1b2, Ndrg2, Aldoc, and Slc1a2. Although we have removed doublets by eliminating cells with unusually high gene numbers, we found cell clusters that were characterized by co-expression of OPC marker genes (e.g., Pdgfra, Olig1, Olig2, Cspg4, and/or Sox10),44 in addition to the astrocytic markers. Given this dual marker expression, we defined cells in these clusters (0, 2, 4, 5, and 6) as intermediate cells. Interestingly, intermediate populations expressed genes such as Ascl1 and Tubb3 (Figures S2C-S2D). As a major intermediate subpopulation, cluster 0 shared some commonality in gene expression patterns with other intermediate cell clusters (Figure 1C). In addition, proliferation markers (e.g., Pcna and Mki67)45 also expressed in cluster 2 (referred to as intermediate cells with proliferation markers). The immune-related genes (e.g., Ifit3, Isg15, and Irf7)46-48 enriched in cluster 4 (referred to as intermediate cells with inflammation markers). Besides astrocyte and OPC markers, cluster 5 cells (referred to as intermediate cells with oligodendrocyte markers) also expressed known markers of oligodendrocyte (e.g., Plp1 and Fyn).49,50 Cluster 6 cells (referred to as intermediate cells with myeloid markers) were enriched in microglia markers (e.g., Ccl3, Tnf, Cd68, Aif1, Ptprc, and Itgam).51-53 Cluster 1 cells (referred to as astrocyte-ependymal cells) were enriched in astrocyte markers and ependymal markers (e.g., Foxj1, Dnah11, Rfx2, and Rfx3).15,54,55 The aforementioned clusters were found in naive, sham, and SCI1M conditions, although clusters 4 and 6 were minimally present in naive.
To infer the functional characteristics of these subpopulations, we performed a gene set enrichment analysis (GSEA) using DEGs in each subpopulation.56 Distinct gene sets were significantly enriched (p < 0.05) in specific subpopulations/states (Figures 1E, S2A, and S2B). For example, the gene sets “synapse assembly,” “neurotransmitter receptor complex,” and “neuron markers” were enriched in cluster 0 cells (referred to as intermediate cells with neuronal genes). Cluster 1 DEGs from astrocyte-ependymal cells were enriched in gene sets related to “motile cilium” and “response to interferon gamma.” “Cell cycle” and “DNA metabolic process” were enriched in intermediate cells with proliferation markers (cluster 2). “Astrocyte projection” and “calcium ion transmembrane import to cytosol” were enriched in cells with only astrocyte markers (cluster 3). Intermediate cells with inflammation markers (cluster 4) yielded the enrichment of “response to type I interferon” and “regulation of production of molecular mediator of immune response.” Additionally, intermediate cells with oligodendrocyte markers (cluster 5) were enriched in “myelin sheath” and “oligodendrocyte differentiation” gene sets, whereas intermediate cells with myeloid marker (cluster 6) DEGs resulted in the enrichment of “inflammatory response” and “cell activation involved in immune response.”
Single-cell trajectory analysis by RNA-velocity and pseudotemporal reconstruction
Powerful scRNA-seq analysis methods have been developed to study the dynamics of cells based on gene expression.57,58 We implemented RNA-velocity analysis for naive, sham, and SCI1M samples (Figure 1F). We observed differences in both speed and direction of the velocity vectors identified in astrocyte-lineage-cell clusters in naive, sham, and SCI1M samples. The size of the arrows in intermediate cells with proliferation markers (cluster 2) was small in naive conditions, depicting a nearly static gene expression, whereas, in sham and SCI1M, velocity vectors had a higher speed. This directional flow was stronger in SCI1M than in sham samples. Results also suggested a transition between intermediate cells (cluster 0/2/4/5), as indicated by the velocity vectors. Interestingly, the velocity vectors originating from cluster 0 in the naive sample depicted a cycling pattern, suggesting transcriptional changes within the same cluster. However, in sham and SCI1M samples, velocity vector arrows depicted outward flows, implying that GFAP-expressing cells in cluster 0 were in an intermediate stage and could potentially transition to other cellular states. These results suggest that injury alters the transitional stages of GFAP-expressing cells in the spinal cords.
Using Seurat’s CellCycle Scoring function,43 we calculated cell-cycle scores of subpopulations of the sub-chronic stage and found a significant increase (p < 0.001) in the proportion of cells in the S+G2M cell-cycle phase between SCI1M, sham, and naive samples in cluster 2 and 4 cells (Figure S2E). Cluster 2 cells were enriched in astrocyte, OPC, and proliferation marker genes, whereas cluster 4 cells were characterized by the expression of astrocyte, oligodendrocyte, and immune marker genes. The remaining clusters depicted no significant proportion changes in cell cycle.
scRNA-seq data can be used to infer pseudotemporal relationships between cell transcriptomes and predict transitions between cell stages.59 Analysis using Monocle2 revealed a single-cell bifurcating trajectory with three branches (Figures S2F and S2G). By overlaying astrocyte-lineage-cell cluster information onto Monocle2 trajectory, we observed that cells assigned to cluster 0 were located in two different branches (2 and 3), suggesting that these cells were at an intermediate stage with two potential transcriptional programs. Cells in clusters 2, 4, 5, and 6 followed similar pseudotemporal locations with slight variations in their distributions, suggesting also their intermediate cell-type identities. The majority of cells belonging to clusters 2, 4, and 5 were located in branch 3, denoting possible transitions between clusters within the same branch. We could also infer a potential transition between cells of clusters 0 and 2, as observed from the overlaps in branches 2 and 3. Similarly, the location of cluster 5 cells in the pseudotemporal trajectory was adjacent and overlapping to cluster 0 cells mainly in branch 3, suggesting potential transitions between these cellular identities. The remaining clusters (1 and 3) were located at the endpoints of different branches, suggesting either start or end stages. Overall, these results demonstrate that intermediate cell clusters transition to states expressing more specialized cell markers, for example, oligodendrocyte marker Plp1 in cluster 5, potentially as a result of injury.
Identifying key factors regulating specific subpopulations
To identify the potential master regulators that drive the cellular heterogeneity of astrocyte-lineage-cell subpopulations/states, we used the single-cell regulatory network inference and clustering (SCENIC) pipeline.60 A separation among subpopulations was observed in the clustered binary regulon activity matrix (Figure 2A). SCENIC predicted subpopulation-specific master regulons. For instance, cluster 1 contained stemness and ependymal-related regulons, such as Sox2, Myb, Foxj1, and Pax6. In cluster 2, proliferation-related regulons (e.g., E2f1) were enriched. Cluster 3 (astrocyte) included astrocyte-related regulons such as Klf15 and Rorb, which participates in the astrocytic development, maturation, and antioxidant response. Immune-related regulons were enriched in cluster 6 (e.g., Relb and Mef2c), which was also consistent with the functional enrichment analysis results of the clusters (Figures 2A and S3). There were also regulons shared by two clusters; for example, Sox9 was enriched in cluster 1 and cluster 3; Irf7, Stat1, and Irf9 were enriched in cluster 4 and cluster 6 (Figures 2A and S3). One interesting observation was that regulons Sox2, Sox9, and Foxj1 were activated in cluster 1 (enriched in astrocyte and ependymal markers) (Figure 2B) and their regulatory networks were connected (Figure 2C) by shared target genes (for example, Foxo1 and Nkx6-1, which are important regulators of embryonic stem cell pluripotency).61,62
Figure 2. GRN of astrocyte-lineage-cell subpopulations predicted subpopulation-specific master regulons.

(A) Clustered binary regulon activity matrix depicting subpopulation-specific master regulons. Important regulons are shown for the various subpopulations (right).
(B) Representation of area under the curve (AUC) scores of selected key regulons (Sox9/Foxj1/Sox2) in the astrocyte-ependymal cluster. Scores are depicted in the UMAP representation of clusters. The intensity of blue depicts high AUCell scores.
(C) Regulon network for the astrocyte-ependymal cluster.
Data-mining of scRNA-seq datasets of acute SCI stages reveals insights into astrocyte-lineage cells
Our scRNA-seq identified heterogeneous GFAP-expressing cells at 1 month after SCI with potentially distinct functions. This raised the question of whether these subpopulations could also be detected at acute stages. Therefore, we re-analyzed the published scRNA-seq datasets of acute SCI stages28 and compared astrocyte-lineage-cell subpopulations with those found in sub-chronic SCI. In the study by Milich et al., uninjured samples (naive according to unpublished data from the authors; we will refer to these as uninjured from now on) and moderate contusive SCI models (adult C57BL/6J mice injured at T8 level) were used. Injured cords were harvested at 1 day post injury (dpi), 3 dpi, and 7 dpi. scRNA-seq data of (1) dissociated various cell-types from the spinal cord tissue sample, and (2) purified astrocyte-lineage cells using anti-ACSA-2 Miltenyi microbeads were generated. We re-analyzed their purified astrocyte-line-age-cell data and described the findings in this section.
Using the same pipeline for sub-chronic SCI to process acute SCI purified astrocyte-lineage-cell data, we identified 23 clusters (Figure S4A). Subsequently, we removed contaminating cell types and obtained 12 astrocyte-lineage-cell clusters (cluster 0~11), which expressed the core set of astrocyte markers described previously (Figures S4B-S4E). Based on the expression of known marker genes, we found that clusters 0/4/7/8 expressed astrocyte and ependymal marker genes, clusters 1/5 depicted an enriched expression of astrocyte and OPC marker genes, and cells in cluster 9 contained astrocyte and myeloid marker genes. Cluster 10 included astrocyte, OPC, and myeloid marker genes. Also, there was an enrichment in cluster 5 of proliferation marker genes (e.g., Pcna and Mki67). These results showed that most of the astrocyte-lineage-cell subpopulations/states in sub-chronic SCI were also present in the acute stages of SCI.
Cell proliferation occurs right after injury and peaks between 3 and 7 days.63,64 In order to explore the process of these subpopulations after SCI, we evaluated the expression of gene sets related to cell-cycle stages. We obtained the cell-cycle scores of each defined cluster and time point for each of the G1/G2M/S phases43 (Figure 3A). We found that cells in cluster 3 (cells with astrocyte markers only) and clusters 1 and 5 (intermediate cells) depicted a significant (p < 0.05) increase in the proportion of cells in the S+G2M cell-cycle phase between 7 dpi and uninjured samples (Figure 3B). These results suggest that cells in these clusters are in a proliferative phase, with their proportions increasing after injury.
Figure 3. The diversity of astrocyte-ependymal cells at acute stages.

(A) Phases of the cell cycle based on expression patterns of selected cell-cycle-specific genes, shown on the UMAP embedment (astrocyte-lineage cells).
(B and C) Proportion of cells in the S+G2M phase. Barplots represent proportions of cells with astrocyte markers only and intermediate cells (cluster 1/3/5) (B) and astrocyte-ependymal clusters (cluster 0/4/7/8) (C) from acute stage.
(D) UMAP representation of astrocyte-ependymal cells obtained from acute stage.
(E) Trajectory analysis of astrocyte-ependymal cells by Monocle3 on Seurat object in a 3D UMAP space. Colors represent clusters.
(F) SR scores calculated for astrocyte-ependymal cells in uninjured and at 3 dpi. Boxplots show the density distribution of SR values at each subpopulation of astrocyte-ependymal cells.
Previous studies have reported that ependymal cells are multipotent cells that become activated and proliferate after SCI.30,65 We calculated cell-cycle scores of astrocyte-ependymal cells (cluster 0/4/7/8) identified in the combined samples of the acute SCI datasets. Only cluster 4 cells depicted a significant increase (p < 0.001) in proliferation, according to the S+G2M cell-cycle score (Figure 3C). Additionally, cells in cluster 4 had the highest expression of Nes (astrocyte-ependymal-Neshigh), a neuroepithelial stem cell marker, compared with cluster 0/7/8 cells (astrocyte-ependymal-Neslow). To elucidate the functional identities and relationships of these astrocyte-ependymal cell clusters, we analyzed them separately using Monocle 3 (Figures 3D and 3E), and then performed GSEA using DEGs. Cluster 8 cells expressed ependymal markers and genes related to motile cilium (e.g., Spef2, Ak7, Spag6, Nme5, Mns1), cluster 0 and 7 cells expressed ependymal markers (e.g., Fam183b, Rarres2, and Tmem212) and astrocyte markers (e.g., Aldoc, Atp1b2, and Ndrg2), whereas ependymal marker expressions were lower in cluster 4 cells and genes were enriched in functions related to cell cycle and cell division (e.g., Ccnd1, Tuba1c, and Zwint).
To further assess the differences between these clusters, we inferred their differentiation potency through their SR scores.66 Intriguingly, in uninjured samples, the entropy scores of astrocyte-ependymal cells were very similar, whereas, at 3 dpi, cluster 4 cells depicted a significantly higher p value (<0.05) entropy score than cluster 0/7/8 (Figure 3F). Given that cluster 0, 7, and 8 cells had ependymal-like properties and low Nes expression, whereas cluster 4 cells depicted high Nes expression, higher entropy score, and proliferation potential, astrocyte-ependymal cells may de-differentiate after injury, transitioning to a more primitive NSC-like subpopulation (cluster 4), which also expressed stem cell markers such as Sox2, Pax6, Cd44, and S100a6.
Histological characterization of subpopulations Characterization of intermediate cell subtypes (acute cluster 1/5/10 or sub-chronic cluster 0/2/4)
scRNA-seq results showed that subpopulations could be separated by a discrete combination of markers (Figures 1D, S4D, and S5A), and functional enrichment suggested cell clusters bin into specific functional phenotypes. Prospective identification of protein marker combinations in astrocyte-lineage-cell subpopulations/states and their morphological features in adult spinal cord have yet to be fully described. Based on the marker gene expression from scRNA-seq data (Figures 1D and S4D), we utilized a combination of GFAP or S100b staining in order to visualize the proximal processes and soma of astrocytes in naive, sham, and injury environments.67 We validated the intermediate cells that were GFAP/S100β immunoreactive and also expressed OPC marker platelet-derived growth factor receptor alpha (PDGFRα) (Figures 4A1, 4A2, and S5B).
Figure 4. Histological validation of intermediate cell subpopulations and cells with myeloid markers.

(A) Intermediate cells (arrows) assessed by the colocalization of tdT, GFAP (blue), and PDGFRα (green) in all the groups. Images were captured (A1) in the ventral column at 600–800 μm from epicenter in sham, 7 dpi, and SCI1M, and (A2) in ventral horn (GM) and lateral column (WM).
(B) Intermediate cells with proliferation markers (arrows) identified by the colocalization of tdT (red), GFAP (blue), PDGFRα (green), and proliferative marker Ki67 (white) in ventral horn or ventral column at 600 μm (7 dpi) and 1,000 μm (SCI1M) caudal from epicenter.
(C) Combined RNAscope and immunofluorescence of Ifit3 (red), S100b (blue), and PDGFRα (green) expression in intermediate cells with inflammation markers (arrows) in ventral horn at the segment adjacent to the injury site.
(D and E) Cells with myeloid marker assessed by CD68 (green, D) or IBA1 (green, E) expression in tdT+ GFAP-expressing cells (red) at lateral horn or lateral column at 7 dpi (D1, at 200 μm rostral from the epicenter; D2, at the epicenter; E1, at 800 μm caudal from the epicenter; E2, at 400 μm caudal from the epicenter).
(F and G) The expression pattern of phagocytosis gene Mertk at acute (F) and sub-chronic (G) stages. Scale bar, 10 μm (A, B, D, and E); scale bar (orthogonal views in A, and C), 5 μm.
We found that intermediate cells were present in naive, sham, and injured groups (Figure 4A1), although they were rare in naive samples, and distributed in both GM and WM (Figures 4A2). PDGFRα was expressed at the cell surface and its immunoreactivity was surrounding/wrapping around tdT+ cell soma body (Figures 4A1, 4A2, and S5B). In sham and injured groups, PDGFRα immunoreactivity also showed dot- or filament-like patterns at the processes of some intermediate cells found at laminectomy segment or adjacent segment to the lesion core (Figures 4A1, A2, and S5B). Morphologically, the intermediate cells showed various appearances. They could have a progenitor-like shape with round soma and short processes or show a stellate astrocyte- or a fibrous astrocytes-like morphology with distended bodies and long filamentous processes following injury (Figures 4A1, 4A2, and S5B).
Additionally, we were able to confirm that a fraction of intermediate cells expressed proliferation markers by counterstaining tdT, GFAP, PDGFRα, and Ki67 (Figure 4B). Moreover, scRNA-seq identified a subpopulation with inflammation markers (cluster 4) present in naive, sham, and SCI1M, but the cell numbers in naive and sham spinal cords were very low. This subpopulation showed enrichment of interferon pathway-related genes (Figure 1D). By conducting a co-detection assay, we found Ifit3+/ S100β+/PDGFRα+ cells in injured samples but not in naive and sham samples. Ifit3+ cells could be observed at the adjacent segment of the injury site (Figure 4C). Ifit3 was expressed in both nuclei and perinuclear regions (Figure 4C).
Identification of cells with myeloid markers (cluster 9/10 at acute and cluster 6 at sub-chronic stages)
scRNA-seq data showed a subpopulation of intermediate cells with astrocyte, OPC, and myeloid markers (acute cluster 10 and sub-chronic cluster 6), and a subpopulation with astrocyte and myeloid markers but not OPC markers (acute cluster 9) (Figures 1D and S4D). We performed a co-staining of IBA1 with GFAP on sorted tdT+ cells at 7 dpi. We found IBA1+ was colocalized with GFAP and tdT+ instead of doublets (Figure S1C, bottom row). To determine whether some GFAP-expressing cells could truly colocalize with myeloid markers, we conducted the co-staining of PDGFRα with IBA1 or CD68 in all groups. CD68 is known as a myeloid-specific surface marker, especially amply expressed by macrophages. IBA1 is a cytoplasmic protein and is primarily expressed in microglia.68 We observed scattered tdT+/IBA1+ and tdT+/CD68+ cells in the SCI 7 dpi group around the lesion area and confirmed colocalization of tdT with IBA1 or CD68 in the cytoplasmic compartment around the nucleus in orthogonal views (Figures 4D1, 4E2, S5C, and S5D), even though there were few cells present. tdT+/IBA1+ cells showed uni-polarized processes, and these directional processes might indicate cell migration induced by injury (Figures 4E1, E2, and S5D). Some tdT+/CD68+ cells displayed a shape of ameboid phagocytes (Figures 4D1, 4D2, and S5C). Some CD68+/tdT+ and IBA1+/tdT+ cells demonstrated vacuolated morphology (Figures 4D2 and S5C). scRNA-seq showed phagocytosis gene Mertk69 was enriched in cluster 9/10 at the acute stage (Figure 4F) and in cluster 6 at the sub-chronic stage (Figure 4G). We were not able to detect either tdT+/IBA1+ or tdT+/CD68+ in naive, sham, and SCI1M samples, reflecting the very limited number of this subpopulation. We did not observe the colocalization of tdT+/IBA1+ cells with PDGFRα staining or tdT+/CD68+ cells with PDGFRα staining, which could also be very rare.
Validation of astrocyte-ependymal-Neslow (acute cluster 0/7/8 and sub-chronic cluster 1) and astrocyte-ependymal-Neshigh subpopulations (acute cluster 4)
The scRNA-seq data analysis identified the astrocyte-ependymal subpopulations expressing both astrocyte and ependymal markers at all sample stages and some co-expressing Nes (astrocyte-ependymal-Neshigh cells) at acute stages (Figures 1D, S4D, and S5A). Therefore, we performed immunohistochemistry (IHC) using antibodies against SOX9 and FOXJ1 to characterize astrocyte-ependymal subpopulations in vivo (Figure 5A). Our immunostaining results verified the presence of SOX9+/FOXJ1+ astrocyte-ependymal cells not only in SCI 7 dpi and SCI1M but also in naive and sham groups (Figure 5B), which were consistent with our scRNA-seq results (Figures 1D and S4D). Unbiased cell counting showed more astrocyte-ependymal cells existed in WM than in GM (excluding central canal) in naive samples with statistical significance in the caudal region, and the same trend but not statistically significant in the rostral region, even though the density of astrocyte-ependymal cells was low (Figure 5C). In sham samples, the density of astrocyte-ependymal cells increased by 2-fold compared with naive samples, and more such cells were found in WM than in GM with statistical significance at the rostral region (Figure 5C), while the tdT+ cells showed similar density between GM and WM in all groups at both rostral and caudal regions at the corresponding cord segment. In the SCI 7 dpi group, the total number of astrocyte-ependymal cells significantly augmented and the cells showed similar density in WM and GM (Figure 5C). Among all tdT+ cells, the proportion of astrocyte-ependymal cells increased robustly at 7 dpi in both rostral and caudal regions from the epicenter (Figure 5D).
Figure 5. Histological validation of astrocyte-ependymal cell subtypes and cells with only astrocyte markers, and the demonstration of cell activation induced by laminectomy in mouse spinal cord.

(A) Astrocyte-ependymal-Nes cells (arrow) co-expressed GFAP+ (red), SOX9+ (blue), FOXJ1+ (green), and Nestin+ (violet) in lateral column from 7 dpi (at 1,200 μm rostral from epicenter) samples.
(B) Astrocyte-ependymal-Neslow cells (arrows) co-expressed SOX9 (blue) and FOXJ1 (green) in the ventral column from naive, sham, 7 dpi (at 1,200 μm rostral from epicenter), and SCI1M (at epicenter) samples.
(C–E) Histological analysis illustrating the number of astrocyte-ependymal cells (C), the proportion of astrocyte-ependymal and astrocyte-ependymal-Neshigh subpopulations among tdT+ cells (D), and the number of astrocyte-ependymal-Neshigh cells (E) in naive, sham, and 7 dpi groups at 800–1,200 μm rostral and caudal from the epicenter.
(F) Astrocyte-ependymal-Neshigh cells (arrows) co-expressed SOX9 (blue), FOXJ1 (green), and NES (white) in the lateral column.
(G) Confocal images and 3D reconstruction of the cells with only astrocyte markers (arrows) by staining with DAPI (blue), AGT (green), and GFAP (white) in ventral column from all groups (7 dpi, at epicenter; SCI1M, at 800 μm rostral from epicenter).
(H) (H1) GFAP (green) and tdT (red) expression in ventral column from naive and sham groups (at 600 μm rostral from the epicenter). (H2) Histological analysis demonstrated the number of tdT+ cells in naive, sham, and 7 dpi groups at 800–1,200 μm rostral and caudal from the epicenter. N = 3–4 mice per group. Barplots represent mean ± SEM. Independent t tests. *p < 0.05; **p < 0.01, ***p < 0.001 compared with other group; GM, gray matter; WM, white matter; Ast-Epe, astrocyte-ependymal cell; Ast-Epe-Neshigh, astrocyte-ependymal-Neshigh cell. Scale bar, 20 μm.
As discussed above, one of the subpopulations with ependymal and astrocyte markers had enriched Nes expression (acutestage cluster 4). Cluster 0/7/8 (acute stage) also had some Nes expression but at a lower level. We observed SOX9+/FOXJ1+/NES+ astrocyte-ependymal-Neshigh cells in naive, sham, and injured adult spinal cord, although these cells were minimal in naive (Figure 5E) and at very low number in SCI1M based on staining results (data not shown). This was consistent with scRNA-seq results (Figures 1D and S4D). Among the astro-cyte-ependymal-Neshigh cells in 7 dpi samples, NES stained the intermediate filaments and colocalized with FOXJ1 immunoreactivity particularly on cell processes or surrounding the cell body (Figure 5F). Morphologically, some cells showed a radialglia-like appearance (Figure 5F).70 These astrocyte-ependymal-Neshigh cells resided in the WM with the elongated, bipolar, or unipolar processes oriented longitudinally within the plane of the fiber bundles (Figure 5F). Others displayed astrocytic stellate-like appearance (Figure 5F). Histological analysis demonstrated that the astrocyte-ependymal-Neshigh cells were induced by sham surgery or injury (Figure 5E). In sham samples, astrocyte-ependymal-Neshigh cells increased with more cells in WM than GM at the rostral region (Figure 5E). At 7 dpi, astrocyte-ependymal-Neshigh cell numbers in GM greatly increased and showed distribution at similar density between GM and WM (Figure 5E). Similar to astrocyte-ependymal cells, the proportion of astrocyte-ependymal-Neshigh cells among tdT+ cells significantly increased after injury at 7 dpi (Figure 5D). Furthermore, we analyzed 30 factors reported to negatively or positively regulate axon regeneration and synaptogenesis. We found astrocyte-ependymal and astrocyte-ependymal-Neshigh cells expressed genes of known neurotrophic growth factors, growth promoting extracellular matrix factors (such as Bdnf, Gpc3, Lgals1, and Spp1), and few growth inhibitors in both SCI 7 dpi and SCI1M (Figures S5E and S5F).7,8,20,71-74
Validation of cells with only astrocyte markers (cluster 3 at both acute and sub-chronic stages)
To validate the subpopulation enriched with only astrocyte markers before and after injury (Figures 1D and S4D), we conducted IHC using antibodies against angiotensinogen (AGT) and GFAP. Images confirmed this subpopulation existed in all stages (Figure 5G). Agt gene has been shown to be specifically expressed in a subpopulation of astrocytes in adult mouse brain.13 Astrocytic AGT plays a critical role in maintaining the blood-brain barrier after brain injury and regulating blood pressure.75,76 AGT was expressed in both cell soma and processes (Figure 5G). The GFAP+/AGT+ cells in WM displayed typical fibrous astrocyte morphology with elongated cell shapes and long processes in sham, 7 dpi, and SCI1M samples (Figure 5G). 3D reconstructions of astrocyte filaments revealed cells with only astrocyte markers acquiring more complex processes following injury (Figure 5G). The analysis of axon permissive and inhibitory factors indicated this subpopulation expressed similar numbers of known axon inhibitors and permissive molecules (Figures S5E and S5F).
Astrocyte-lineage cells were activated after laminectomy surgery
scRNA-seq and immunostaining results revealed that astrocyte-lineage cells were activated after laminectomy surgery in the sham group compared with naive control. For example, the intermediate subpopulations with inflammation markers, proliferation markers in the sub-chronic data, and astrocyte-ependymal-Neshigh cells in acute data increased (Figures 5D and S2E). Stereological quantification also showed the GFAP expression and tdT+ cell number increased after sham surgery even at adjacent segments to the epicenter (Figures 5H1 and 5H2).
Experiments assessing the proliferation and differentiation abilities of GFAP-expressing cells before and after injury
To assess the proliferation activity of potential resident NSC/NPC populations such as the astrocyte-ependymal subpopulations, we performed EdU (5-ethynyl-2’-deoxyuridine) labeling and immunostaining against FOXJ1 in the adult spinal cord before and after injury (Figure S6A). The proportion of FOXJ1+/tdT+ cells after SCI significantly increased (Figure S6B), while there was a trend of increasing proportion of FOXJ1+/tdT+ cells after sham laminectomy, which is consistent with our stereological data. Quantification of FOXJ1+/tdT+/EdU+ cells among all tdT+ cells demonstrated that there was an increased proliferation of the astrocyte-ependymal subtype after injury, although the proliferating proportion in the sham sample was not significantly increased, suggesting the proliferation of astrocyte-ependymal cells slowed down at 7 days from the hyperacute stage.
To identify the stem cell property and characterize the differentiation potential of GFAP-expressing cells, we cultured the sorted tdT+ cells isolated from naive, sham, and SCI 7 dpi samples under differentiation conditions (Figure 6). As the culture condition for differentiation from these cell types is unknown, we applied a standard panel of differentiation signals known to FACS-sorted tdT+ cells to induce neural progenitors toward neuronal, astrocyte, or oligodendrocyte fates. The short-term differentiation potential of these cells was accessed by IHC. The tdT+ cells from all samples were able to generate O4+ progenitor cells, early neurons, and astrocytes after culturing in corresponding differentiation media. These data support the predicted progenitor identity among tdT+ cells from the adult spinal cord of naive, sham, and SCI 7 dpi mice and reveal their differentiation capability in the presence of differentiation signals.
Figure 6. Immunocytochemistry of FACS-sorted tdT+ cells from naive, sham, and 7 dpi mouse spinal cords differentiated under oligodendrocyte, neuron, and astrocyte differentiation conditions.

(A–C) tdT+ cells (A) differentiated in the oligodendrocyte differentiation medium were stained with progenitor marker O4 (green) (scale bar, 50 μm); (B) in the neuron differentiation medium were stained with neuron marker TUJ1 (violet) and MAP2 (green) (scale bar, 25 μm); (C) in the astrocyte differentiation medium were stained with astrocyte marker aldolase C (ALDOC) (violet) and GFAP (green) (scale bar, 100 μm).
DISCUSSION
Herein, we performed an scRNA-seq analysis of purified GFAP-expressing cells in naive, sham, and SCI1M samples and identified multiple subpopulations including interesting adult progenitors. We also re-analyzed the acute-stage scRNA-seq data published by others.28 Although the purification methods are different, we found that the main astrocyte-lineage-cell populations identified in the sub-chronic stage were also detectable in the acute stage, and the proliferation properties of some subpopulations differed at each time point (Figures 3B, 3C, and S2E). We observed SOX9+/FOXJ1+/NES+ astrocyte-ependymal-Neshigh cells in naive, sham, and injured adult spinal cord, even though these cells were minimal in naive (Figure 5D) and very low number in SCI1M based on staining results. We conclude that the number of astrocyte-ependymal cells increased following sham surgery and this population further expanded after acute injury. Importantly, we found astrocyte-lineage-cell/progenitor subpopulations had distinct functional enrichment and could be regulated by cluster-specific TFs identified as regulons. Our analyses revealed the molecular signature, location, and morphologies of potential resident NSCs/NPCs in the adult spinal cord before and after injury and the intermediate cells enriched in neuronal genes that could potentially transition into other subpopulations. Differentiation experiments of FACS-sorted tdT+ cells, and EdU injection of naive, sham, and injured animals, followed by IHC and quantification provided more insight into their differentiation and proliferation characteristics.
Phenotypes and trajectories of intermediate precursor populations
Researchers have demonstrated the existence of a progenitor population classified as B cells expressing PDGFRα and GFAP in the subventricular zone (SVZ).77 B cells can give rise to transient amplifying NPCs that generate neuroblasts and differentiate into neurons and glia in vivo. Our data uncovered the subpopulations (the intermediate cells) that expressed both astrocyte and OPC markers in the adult spinal cord. Immunostaining confirmed that the GFAP+/PDGFRα+ intermediate cell subpopulations were present in injured and naive adult mouse spinal cords, although rare in naive samples. Intriguingly, the gene expression of these intermediate cell subpopulations was enriched in neuronal, proliferation, inflammation, myeloid, or oligodendrocyte markers. The intermediate subpopulations with proliferation and inflammation markers significantly increased in SCI samples. Pseudotime trajectory analysis showed that cluster 0 was located at the intermediate stage with two potential transcriptional trajectories. After SCI, cluster 0 cells exhibited a higher vector velocity and arrow direction predicting outward flows after injury, suggesting a transition to other intermediate populations. Further experiments are necessary to better dissect their neurogenesis potential and the cell fate transitions after injury.
Myeloid markers in astrocyte-lineage subpopulations
One of the astrocyte-lineage subpopulations expressed myeloid markers confirmed histologically by CD68 and IBA1 staining. Studies by others demonstrated that CD68+ cells expressed GFAP in the primary culture of promicro-glioblasts isolated from neonatal rat forebrain.78 Another scRNA-seq study of a peripheral nerve injury model reported a proportion of cells expressing both macrophages and satellite glial cell genes referred to as imooglia.79 Interestingly, we and others have shown that a transient, phagocytic subtype of astrocyte progenitor appeared within the first week after spinal cord contusion injury or demyelination.80 The majority of early proliferative astrocyte-like cells are derived from an endogenous population and not from the blood, as determined by analysis of mitotic populations in a GFP hematopoietic chimeric mouse.81 Based on these findings, it is plausible that these cells are a functional subtype of astrocytes or astrocyte states that exhibit phagocytosis.78,82 An alternative hypothesis suggested by others states that microglia may become multipotent and express glial marker genes such as GFAP,83 or GFAP-expressing cells might undergo inflammatory transcriptional transition by expressing myeloid markers following CNS injury.79 However, the possibility of cross-lineage conversion is still debatable. For example, Rao et al. reported that ectopic expression of NeuroD1 cannot induce microglia-to-neuron cross-lineage conversion.84 It is also possible that macrophages and microglia have phagocytosed tdT+ cells. Additionally, we only observed subpopulations with astrocyte and myeloid markers but not intermediate subpopulations with myeloid markers via immunostaining. Therefore, this should be interpreted with caution, and further studies are needed in order to define the origin and identity of these subpopulations.
Astrocyte-ependymal precursors
Previous studies by others reported that ependymal cells in the central canal exhibited multipotency and could give rise to astrocytes and oligodendrocytes in vivo after dorsal funiculus incision, and also to neurons in vitro.30,31,85 In the present study, we found that astrocyte-ependymal subpopulations co-expressed ependymal markers and astrocyte markers not only in injured samples but also in naive samples, although the cell numbers in naive spinal cord were low. Besides the central canal, the resident astrocyte-ependymal cells confirmed by IHC in naive mice were distributed preferentially in WM compared with GM. Quantitative histologic analysis demonstrated that astrocyte-ependymal cell populations significantly expanded following sham surgery, indicating that laminectomy is sufficient to activate these cells, and they further amplified at 7 dpi. From the EdU injection data, we observed a trend of increasing proportion of FOXJ1+/tdT+ cells (quantified from areas in both WM and GM) after sham laminectomy, although this did not reach statistical significance. Note that the increase in the stereological data for the sham sample was only significant in WM. Therefore, the observations are consistent using different methods. In addition, the proliferating proportion in the sham sample was not significantly increased at 7 dpi, suggesting the proliferation of astrocyte-ependymal cells has already slowed down at 7 days from the hyperacute stage.
Moreover, our scRNA-seq and immunostaining identified astrocyte-ependymal-Neshigh cells that expressed astrocyte markers, ependymal markers, and NSC markers. The astrocyte-ependymal-Neshigh cells were rare in naive spinal cord and were induced in both sham and SCI animals. Astrocyte-ependymal-Neshigh cells distributed more in WM in sham samples and expanded after SCI, resulting in similar densities in WM and GM. Interestingly, astrocyte-ependymal cells expressed many known axon permissive factors and few inhibitory molecules in both 7 dpi and SCI1M samples. The molecular growth permissive expression signature, enhanced proportion of S+G2M cell-cycle phase, radial-glia-like morphologies, and entropy analysis of astrocyte-ependymal-Neshigh cells indicate this population may be NSC/NPC-like cells. The increase of astrocyte-ependymal cells was detected at the acute stage but this population was reduced at the sub-chronic stage, indicating loss or differentiation. Studies to enhance the number or promote de-differentiation toward NSC/NPC-like cells in a chronic injury setting could have important consequences for enhancing cell regeneration and plasticity.
The implication of Troy expression in populations with only astrocyte markers
In addition to ependymal cells, another study reported a neurogenic program from astrocytes that can be initiated after Notch signaling was blocked in Cx30-CreER:Rbpj-κfl/fl mice by Rbpj-knockout.86 These cortical astrocytes can transit to an NSC-like state and further to a self-amplifying progenitor-like state after stab brain injury.87 A recent single-cell transcriptome analysis reported a subpopulation of ependymal (EpA) cells that expressed Troy (official gene symbol Tnfrsf19) in the adult spinal cord.31 These Troy-CreER recombined EpA cells could de-differentiate and transit to a stem-cell-like state.31,88 Consistent with our study, Troy cells expressed Nes and Gfap at 3 dpi after injury. Interestingly, scRNA-seq data demonstrated that Troy was maximally expressed in the cell subpopulation with only astrocyte markers at both acute and sub-chronic stages. Troy is expressed, but to a lesser degree, in astrocyte-ependymal cells. The purified brain cell RNA-seq data (http://jiaqianwulab.org/braincell/RNASeq.html; https://www.brainrnaseq.org/) also showed that Troy was highly enriched in astrocytes.53 It is possible that, after SCI, in addition to ependymal cells, astrocytes in the adult spinal cord may undergo a de-differentiation process and acquire NSC/NPC properties.89 Consistent with this hypothesis, when we projected the RNA-velocity analysis onto the first two principal components obtained from the Monocle trajectory analysis, we observed high velocity vectors originating from the subpopulation with only astrocyte markers (cluster 3), pointing to cluster 0, which is an intermediate population (Figure S2H). To verify the direction of this population in terms of de-differentiation and validate this hypothesis, in vivo lineage mapping will be required in future experimentation.
Cell-type cluster regulations, predictions, and potential caveats
Gene regulatory network (GRN) analysis identified cluster-specific regulons that are predicted to control subpopulation-specific transcriptional programs and inform cell identity. For example, the TFs identified in astrocyte-ependymal cells were interlinked in a regulatory network by shared target genes important for stem cell pluripotency. Additionally, gene set enrichment results showed cluster 2 cells (intermediate cells with proliferation markers) were enriched in cell-cycle and DNA metabolic processes. The proportion of cluster 2 cells in the S+G2M cell-cycle phase increased in SCI1M more than in naive samples. The GRN in cluster 2 showed regulon activity corresponding to proliferation-related TFs (e.g., E2f1).
The GFAP-Cre mouse line 73.12 we used has been verified by the donating investigator lab and other labs as a faithful reporter line in adult mouse spinal cord.35-38,90 The analysis of the reporter protein GFP in combination with immunofluorescence of GFAP in both GM and WM of the adult spinal cord demonstrated 99% correspondence of GFP-expressing cells with GFAP immunolabeling. Conversely, 97% of cells that expressed GFAP expressed GFP as well. In brain, even if forebrain contained restricted populations of juvenile and adult neural progenitors that expressed GFAP in line 73.12, the authors verified that mGfap-cre was largely restricted to postnatal astrocytes throughout the CNS.37,38 These observations are consistent with our quantitative immunocytochemistry results of GFAP+/tdT+ double-positive cells using FACS-sorted tdT+ cells. These validation experiments confirm that the majority of tdT+ cells have detectable GFAP protein and agree with our histological result (Figure S1B) whereby we see a high concordance of GFAP and tdT in spinal tissue. Importantly, we also showed by immunostaining results that GFAP staining colocalized with the intermediate cells and the astrocyte-ependymal cells (Figures 4A, 4B, and 5A). According to ours and others’ studies, Gfap RNA expression decreased after acute injury stages but GFAP protein persisted. Given that scRNA-seq measures RNA levels while immunostaining detects protein, RNA and protein expression do not necessarily correlate temporally due to the different half-lives of RNA and proteins as well as post-transcriptional and translational modifications.91-93 This should be taken into consideration for how data are interpreted.
It is significant that our analysis and experiments uncovered progenitor subpopulations such as potential NSC/NPC-like astrocyte-ependymal-Neshigh cells and intermediate cells. This reveals exciting possible sources/pools of resident stem cells/progenitors in adult spinal cord, as we know GFAP+ cells are NSCs during development and can be differentiated into neurons and glia.21,94 In adult mammalian brains, NSCs also express Gfap.21,22,90 Consistently, our experiments showed that the FACS-sorted tdT+ cells from adult spinal cord samples before and after injury were able to generate O4+ progenitor cells, early neurons, and astrocytes in the presence of differentiation signals. Regardless of the stemness potential shown by the transcriptional profiles of astrocyte-ependymal-Neshigh subpopulation or intermediate cells mentioned above, mature neurons were not observed in vivo,30,31,95 possibly due to repressive signals from the adult spinal cord microenvironment. Continued investigation of the signaling pathways that inhibit endogenous neurogenesis in the adult spinal cord could lead to strategies to augment regeneration and assist in the repair of the damaged area.
Limitations of the study
This study provides an essential overview of heterogeneity and transcriptional dynamics of GFAP-expressing cells in the adult spinal cord before and after injury. It is important to note that GFAP promoter is not only active in astrocytes but also in progenitors. Thereby, the FACS purification of tdT+ cells yielded not only astrocytes but also other progenitor populations. For a sub-chronic pseudotemporal ordering analysis, we set the astrocyte-ependymal subpopulation (cluster 1 at sub-chronic stage) as the root. Note that, unlike during development, the injury environment exhibits cell subpopulations/states that could be present in parallel in reality. Cell-trajectory analysis and the key factors regulating specific subtypes are bioinformatic predictions. The goal is to generate hypotheses. Our experiments assessed the proliferation and differentiation abilities of GFAP-expressing cells before and after injury, but physiological functions of these cell types after SCI are not yet dissected. Additionally, whether the heterogeneity of astrocyte-lineage cells reflects different cell species or different functional states needs further investigation. In the future, we plan to use reporter systems that will allow us to assess physiologic signatures of individual subtypes and eliminate or block differentiation of specific subtypes to better understand their functions. Studies on the sources of heterogeneity of the subpopulations and their derived progenies are necessary to accurately delineate the lineage relationship of these cells and to better understand adult stem cell/progenitor biology in SCI.
STAR★METHODS
RESOURCE AVAILABILITY
Lead contact
Further information and requests for resources and reagents should be directed to and will be fulfilled by the lead contact, Jia Qian Wu (Jiaqian2009.wu@gmail.com).
Materials availability
We will make the materials developed available to the scientific community. This includes transgenic animals, reagents and cells. We may request reasonable payment for maintenance and transport of materials, and/or a completed materials transfer agreement.
Data and code availability
Sequencing data have been deposited in the GEO (Database: GSE202627).
This paper does not report original code.
Any additional information required to reanalyze the data reported in this paper is available from the lead contact upon request.
EXPERIMENTAL MODEL AND SUBJECT DETAILS
Mouse models
All animal care and surgical interventions were undertaken in strict accordance with the approval of the Animal Welfare Committee at the University of Texas Health Science Center at Houston (UTHealth) and the Institutional Animal Care and Use Committee at the Houston Methodist Research Institute. Animals were housed in standard laboratory conditions with 12 light/12 dark cycles and with free access to water and food. To obtain purified GFAP-expressing lineage cells for scRNA-Seq, transgenic mouse model GFAP-Cre:R26-tdT (4–6 months old) was generated by mating homozygous GFAP-Cre (B6.Cg-Tg(Gfap-cre)73.12Mvs/J) mice (JAX, Stock No. 012886)90 with R26-tdT (B6.Cg- Gt(ROSA)26Sortm9 (CAG-tdTomato)Hze/J) mice (also known as Ai9 or Ai9 (RCL-tdT) (JAX, Stock No.007909))19. Both male and female mice were used in experiments and were assigned to experimental groups in age- and sex-matched manner.
METHOD DETAILS
Surgery procedure
We performed a compression injury model adapted from a calibrated forceps model of SCI.98,99 In this model, we used a dumont forceps attached to a pressure gauge to create a light to moderate injury in the T10 spinal segment, a region with limited GM and an abundance of long-tract and propriospinal axonal fibers. Briefly, a laminectomy was performed and bilateral transverse processes were dissected out to allow calibrated forceps entry into the vertebral channel. The forceps were then closed to 500 μm pressure for 40 s to produce a compression of the exposed spinal cord. After completion of the compression injury surgery, muscle layers were sutured together and the skin was closed using surgical staples. Bladder, hydration, and nutritional support were performed at least twice a day or as needed to aid recovery. Sham control animals were subjected to laminectomy only, followed by muscles closed and skin stapled. Naive control group was not subjected to any procedures but was housed in similar conditions. Additionally, contusive SCI mouse models for immunostaining were prepared using the methods as described previously.18-20 Compression and contusion injured cords were harvested at 1 month and 7 days after injury, respectively. Sham samples were harvested at 7dpi.
Tissue dissociation
One-centimeter segment encompassing the epicenter of the injury or matched non-injured area was harvested for tissue dissociation (including 18 cords in Naive, 9 cords in Sham, and 8 cords in SCI1M group). After the mice were euthanized, transcardial perfusion with cold PBS was performed and cords were dissociated using a mixed digestion solution of papain, trypsin-EDTA, DNase I, and L-cysteine in Dulbecco’s modified Eagle’s medium (DMEM) supplemented with BSA at 37°C under gentle shaking for 15 min. After the digestion solution was removed by centrifugation, cells were triturated with fire-polished glass Pasteur pipettes in fresh DMEM supplemented with 0.5% BSA. The supernatant containing cells were separated from the undissociated tissue at the bottom and stored at 4°C. The undissociated tissue was processed through above steps once more. Cell suspensions were collected, passed through a 70-μm strainer, and purified by density gradient centrifugation with 4% BSA-supplemented DMEM to eliminate remaining tissue clots and dead cells. To remove myelin, cells were then resuspended in a cold DPBS supplemented with 0.5% BSA containing Myelin Removal Beads II (Miltenyi Biotec; cat #130-096-733) following the manufacturer’s protocol. Next, tdT+/DAPI-cells for scRNA library preparation were collected by FACS using a BD FACS Aria II flow cytometer (BD Biosciences) with a 100 μm nozzle at 4°C. Samples were then washed in DMEM with 10% fetal bovine serum to reach the concentration at 400–1000 cells per μl. Cells from each sample were stained with Trypan Blue and cell viability was calculated on hemocytometer before loading on 10x Chromium. As it is difficult to dissociate adult spinal cords and capture live cells for scRNA-Seq, we dissociated the tissue samples using a mixed digestion solution of papain and trypsin-EDTA. There is the possibility that a subpopulation of cells that are sensitive to the procedure is lost during preparation.
For in vitro culture and differentiation experiments, the dissociation protocol was optimized to increase cell culture viability by purchasing GentleMACS Octo Dissociator with heaters (program 37C_ABDK_02) (Miltenyi Biotec; cat #130-096-427). The enzymatic tissue dissociation was performed by using adult brain tissue dissociation kit (Miltenyi Biotec; cat #130-107-677) as per manufactures instruction. Thereafter, collected cell suspensions were passed through a 70-μm strainer and purified by density gradient centrifugation with debris removal solution followed by RBS lysis. The cell pellet was then resuspended in DMEM/F-12 media (Invitrogen; cat #11330032) and FACS sorting was performed using a BD FACS Aria II flow cytometer (BD Biosciences) with a 100 μm nozzle at 4°C.
scRNA-Seq
Naive, Sham, and SCI1M samples were sequenced. Sample libraries were prepared by The University of Houston Sequencing and Editing Core (UH-SNEC) based on Chromium Single Cell 3′ Library and Gel Bead Kit instructions (v3-v3.1). All samples were indexed with Single Index Kit T Set A (10X Genomics; PN-1000213) or Chromium i7 Multiplex Kits (10X Genomics; PN-120262). Paired-end sequencing was performed using the NovaSeq6000 or NextSeq500 sequencing instrument at recommended settings (R1:28 cycles; i7 index: 8 cycles; i5 index: none; and R2: 91 cycles).
Immunohistochemistry (IHC) and RNAscope of spinal cord tissue
Spinal cord samples for IHC were prepared as described previously.20 Briefly, serial, coronal sections of spinal cord were cut at 20 μm with a Leica cryostat (Leica Microsystems, Wetzlar, Germany; Leica CM1950). For unbiased assessment, 1 in 10 series were processed for IHC in one of two sets. Two sets of slides were used for immunostaining or RNAscope assays following published procedures.20 The primary antibodies used in this study included rabbit anti-GFAP (Agilent; cat #Z0334; 1:500), rat anti-GFAP (Invitrogen; cat #13–0300; 1:400), chicken anti-GFAP (EMD Millipore; cat # ab5541; 1:500), rabbit anti-SOX9 (Chemicon; cat #AB3353; 1:500), goat anti-FOXJ1 (R&D; cat # AF3619; 1:250), mouse anti-Nestin (Abcam; cat #ab6142; 1:200), rabbit anti-S100b (Abcam; cat #41548; 1:500), goat anti-PDGFRα (R&D; cat #AF-1062, 1:300), rat anti-PDGFRα (Abcam; cat #ab90967, 1:100), rabbit anti-Ki67 (Thermo Fisher Scientific; cat #MA5-14520; 1:50), mouse anti-PCNA (Thermo Fisher Scientific; cat #13–3900; 1:250), rabbit anti-AGT (Thermo Fisher Scientific; cat #PA5-21520; 1:400), rabbit anti-IBA1 (WAKO; cat #019–19741; 1:400) and rat anti-CD68 (Bio-Rad; cat #MCA1957GA; 1:500). DAPI (Santa Cruz Biotechnology; cat #SC3598; 1:1000) and TO-PRO3 (Thermo Fisher Scientific; cat #T3605) were used for nuclear staining. For RNA- Protein Co-Detection Assays, RNAscope Multiplex Fluorescent V2 Assay (ACD), probes Mm-Ifit3 (ACD; cat #508251) and negative control probe DapB (ACD; cat #310043) were used in this study.
Immunocytochemistry of FACS-sorted tdT+ cells
For preparation mounting FACS-sorted tdT + cells Cytospin centrifugation was used. TdT positive cells were suspended in 100 μL of neurosphere media containing DMEM/F-12 supplemented with 5 μg/mL Heparin, N2, and B27. Those cells were placed on charged glass histology slide with filter adapter for the cytospin centrifuge. After spinning at 300 rpm for 5 min, sides were airdried for 15 min followed by fixation with 4% PFA at room temperature for 15 min. Immunocytochemistry was then performed as described below.
Immunocytochemistry was performed according to the following protocol. After fixation cells were incubated in blocking buffer (5% donkey serum and 0.2% Triton X-100) for 45 min. Cells were then incubated in primary antibodies diluted in blocking buffer at 4°C overnight. Appropriate secondary antibodies were used for single and double labeling. All secondary antibodies were tested for cross-reactivity and nonspecific immunoreactivity. The following primary antibodies were used: mouse anti-beta III-tubulin (TUJ1), (Millipore; cat #MAB1637; 1:500), chicken anti-MAP2 (Millipore; cat #AB5543; 1:500), rat anti-GFAP (Invitrogen; cat #13–0300; 1:400), rabbit anti-Aldolase C (Thermofisher; cat #14884-1-AP; 1:100), mouse anti-O4 (R&D; cat #MAB1326; 1:400) and goat anti-IBA-1(Novus; cat #nb100-1028; 1:400).
Direct differentiation culture of FACS-sorted tdT + cells
Spinal cords from adult Naive, Sham, and 7 dpi mice were dissected and dissociated as described above. FACS-sorted tdT + cells were directly plated in poly-d-lysin and laminin coated well chamber slides in the differentiation conditions. Astrocyte differentiation media contained DMEM/F-12 media supplemented with 10% fetal bovine serum (FBS; Sigma-Aldrich; cat #16000044) and 1% P/S. Neuronal differentiation media contained DMEM/F-12 media supplemented with 5 μg/mL Heparin, N2, 2% B27, 20 ng/mL NT3 (Stemcell Technologies; cat #78074), 20 ng/mL brain-derived neurotrophic factor (BDNF; Stemcell Technologies; cat. #78005) and 1% P/S. Oligodendrocyte differentiation media contained (DMEM)/F-12 media supplemented with 5 μg/mL Heparin, N2, B27, 20 ng/mL 3,3′,5-Triiodo-L-thyronine (T3; Sigma-Aldrich; cat #T6397), 20 ng/mL human recombinant platelet-derived growth factor (PDGF-AA; Stemcell Technologies; cat #78095), 20 ng/mL NT3 and 1% P/S. Cells were maintained at 37°C with 5% CO2 in a humidified incubator with media changed every 2–3 days. Cells were fixed with 4% PFA for 20 min between 7 and 14 days after plating and then stained with the immunocytochemistry protocol described above.
Confocal microscopy and 3D cell reconstruction
Confocal z stack images were captured using either a Leica confocal microscope with 63X oil objective with frame size at 1024× 1024 and bit depth at 8 or a Nikon AR Confocal Microscope with 40x water objective with frame size at 2048× 2048 and a bit depth of 12 (Nikon Instruments Inc., USA). The z stack (1 μm step size) images were taken encompassing the whole section or the regions of interest. Images were imported to Neurolucida 360 (MBF Bioscience). Orthogonal review for individual cells in z-projected images was generated with 3D overview module. The 3D objects of tdT + astrocytes were then analyzed with the 3D reconstruction using tdT and DAPI fluorescence. Cells’ processes were manually traced with the use of the dendrite tracing.
Quantitative analysis of astrocyte-ependymal subpopulations
To measure the cell number of verified astrocyte-ependymal subpopulations, the total number of tdT + cells per 20 μm section was determined from coronal sections using fractionator (MicroBrightField Inc). A 1 in 10 series was processed for IHC to quantify the number of tdT+ astrocyte-ependymal subpopulations by double-immunofluorescence of SOX9 and FOXJ1 (Cluster0/4/7/8), and the number of tdT+ astrocyte-ependymal-Neshigh subpopulations by triple-immunofluorescence of SOX9, FOXJ1 and NES (Cluster4) in Naive, Sham, and 7dpi groups. To characterize these cells’ distribution in adjacent segments, we quantified serial sections at 800 μm, 1000 μm and 1,200 μm from epicenter in WM, GM, and central canal. We selected these positions because: (1) they are adjacent to the lesion epicenter and contain a significant amount of injury-induced cells, and (2) central canal is disrupted by contusive injury, which affects cell morphology and cell counting at the proximal region. At 800 μm-1,200 μm, GM and WM and the central canal are spared and can be easily demarcated by creating electronic templates for regional analyses. Pial cells were excluded from counting. Cells were counted using a mechanical stage attached to an Olympus (Melville, NY) BH-2 microscope under 63X oil lense and Dage (Michigan City, IN) MTI CCD-300TIFG video camera. At least 20 labeled cells from each sample were counted. Cell counts were recorded using Stereo Investigator Software (MicroBrightfield, Colchester, VT) as previously described with some modifications.80,81,100 In each section, contours of GM, preserved WM, and central canal were digitally outlined using Stereo investigator. The stereologic probe fractionator was applied to count the cell number per contour area. Estimates were calculated based on an average mounted section thickness of 20 μm. Because of section thickness shrinkage due to fixation and processing, counted frame tissue sections are below the recommended minimum operational thickness of 20 μm for optical fractionator and therefore total cell estimates may be minimally overestimated but consistent between groups. Cells were counted in contours of an average of seven 20 μm sections per spinal cord segment in a 1 in 5 series (e.g., each tissue slice spaced 80 μm apart). A 250 μm × 250 μm grid was generated for the placement of fractionator probes, and 75 μm × 75 μm optical counting frames were placed by StereoInvestigator within each contoured region of interest (ROI). The total number of tdT + cells, and SOX9+/FOXJ1+ and SOX9+/FOXJ1+/NES+ cells that were tdT+ were counted in optical frames using the fractionator probe and total cell number per region volume calculated. Data was analyzed for statistical significance and presented as either (1) estimated total cell number, defined as the estimated number of marker-labeled cells per volume of segment sampled or (2) cell proportion, defined as the proportion of total tdT + cells immunola-beled for sub-population markers. The above experiments were performed in Naive, Sham and injured groups. Two independent and blinded observers were selected for stereology and analysis. At least three independent biological replicates were used per group.
For quantification of EdU-labeled astrocyte-ependymal cells, Naive, Sham, and SCI 7dpi mice were given one IP injection of EdU at a concentration of 50 mg/kg (Invitrogen; cat #C1033712 h prior to harvesting based on the protocol as described previously.101 Spinal cord sections were obtained as described above. EdU labeling for imaging was conducted as per manufacturers recommendations (Invitrogen; cat #C10337). Hoechst was used to confirm nuclear localization of EdU in the nucleus. Confocal z stack images with approximately 50% gray and 50% white matter centered at the lateral edge of the ventral horn were taken using a Nikon AR Confocal Microscope with 40x water objective. Four fields were counted per sample. NIS elements general analysis 3 (Nikon NIS-Elements HC Ver 5.41.02 Build 1711, Nikon Instruments Inc., USA) was used to create a 3D recipe to quantify the number of cells with overlapping immunofluorescent signal of the 4 channels which was applied to the z stack images taken with the same parameters. We quantified the proportion of FOXJ1+/tdT + double-positive cells among all tdT + cells at the level of 600–800 μm rostral to the epicenter.
Single-cell RNA sequencing data processing
Raw scRNA-Seq reads of samples were processed individually according to 10x Genomics CellRanger software (cellranger-5.0.1)96 and mapped to the mm10 genome with default parameters. Each sample was imported into Seurat R package43 and merged. We filtered out cells with fewer than 400 detected expressed genes, or more than 3,500 genes to prevent empty cells and doublets respectively. Genes that were expressed in less than 3 cells were filtered out. In order to control for dead or damaged cells, cells with over 10% of raw reads mapping to mitochondrial genes were filtered out. Mitochondrial genes were also removed from the gene expression matrix.
After quality control filtering, we obtained 20,833 cells in total (Naive: 4,458; Sham: 6,538; SCI1M: 9,837). Each dataset was normalized by Seurat with default parameters.43 In this process, the FindIntegrationAnchors function of Seurat was used to create potential Anchors with default parameters. Subsequently, IntegrateData function was used to integrate data and create a new matrix, in which potential batch effect was regressed out. To reduce the dimensionality of the scRNA-Seq dataset, principal component analysis (PCA) was performed on an integrated data matrix and top 30 PCs were selected for downstream analysis. Clustering was then performed by Seurat’s FindClusters function, with resolution res = 0.1 and then visualization was performed by 2D UMAP plots. Conventional markers described were used to categorize each cluster into known biological cell-types: astrocyte (Slc1a2, Aldoc, S100β, Ndrg2, and Atp1b2), OPC (Pdgfra, Olig1, Olig2, Cspg4, and Sox10), NFO (Enpp6 and Nfasc), MO (Plp1, Mog, Mbp, and Fyn), microglia (Ccl3, Tnf, Cd68, Aif1, Ptprc, and Itgam), ependymal cell (Foxj1, Dnah11, Rfx2, and Rfx3), and proliferation markers (Pcna and Mki67). Subsequently, astrocyte-lineage cells were further clustered into subpopulations to detect heterogeneity. Cell cycle scoring was performed as previously described.102 We calculated the proportion of cells in the S+G2M cell cycle phase compared to the number of cells from all clusters at the same time point. We performed a Pearson’s chi-squared statistical test to determine if the proportions of the combined phases S+G2M changed for each cluster between the different time points. The differentiation potency scores were calculated by LandSCENT.66 Signaling entropy rate scores use cells’ transcriptional profiles to quantify the relative activation levels of protein-protein interaction pathways. The same pipeline was used for the scRNA-Seq analysis of acute SCI samples (GSE162610).
Functional analysis using gene set enrichment analysis (GSEA)
The DEGs in each astrocyte subpopulation were analyzed by Seurat Findallmarker function. Gene sets considered in this analysis include all MSigDB C5 signature sets.56 GSEA was performed using the fgsea package (v1.16.0) with 1000 permutations.97 The gene sets with pP-value <0.05 were considered significant.
Single-cell pseudotime trajectory analysis
Ordering GFAP-expressing cells by transcriptional similarity may provide insights into the transcriptional dynamics associated with the transitions among the identified cell clusters. The process of ordering cells in silico is named pseudotemporal reconstruction. Monocle2 and 3 packages were used to construct single-cell trajectories.59 The differentialGeneTest function was used to identify significant genes (qval <0.1, num_cells_expressed >10). Cell ordering was then conducted on these genes. The trajectories were visualized using DDRTree method.
RNA-velocity-analysis
The expression of spliced and unspliced transcripts of each gene was determined by Velocyto.py.58 All cells and genes remaining in the Seurat results were used for RNA-velocity-analysis. Briefly, by calculating the relative abundance of unspliced (pre-mRNAs) and spliced (mRNAs) species, RNA-velocity captures the transcriptional dynamics of cell state transitions. We used the R implementation “velocyto.R” to perform RNA-velocity-analysis (https://github.com/velocyto-team/velocyto.R). RNA-velocity was estimated using a gene-relative model with k-nearest neighbor cell pooling (k = 10). Velocity fields were then projected onto UMAP generated by Seurat.
Single-cell regulatory network inference and clustering using SCENIC
The gene regulatory networks across astrocyte subclusters were analyzed by SCENIC.60 SCENIC is a computational workflow that predicts TF activities from scRNA-Seq data. It constructs the gene regulation networks based on TF and candidate target genes coexpression, DNA motif analysis, and then calculates TF activated scores by AUCell algorithm for each TF. All cells and genes remaining in the Seurat results were passed into the SCENIC analysis using the normalized gene matrix as the gene expression values. The co-expression networks were generated by GENIE3. The cisTarget mouse motif database v9103 was used for the enrichment of gene signatures and pruned for targets from this signature based on cis-regulatory cues with default settings. The activity of regulons is scored and binarized with AUCell. All cells were colored according to their Seurat cluster identities. Regulon-specific modules were identified from the network inference output using Gephi (https://gephi.org/).
QUANTIFICATION AND STATISTICAL ANALYSIS
All statistical analyses were performed with Microsoft Excel and GraphPad Prism 5.0 software. Specific statistical details are indicated in the corresponding figure legends. The number of animals per group was based on the previous experience and calculated with StatMate software (GraphPad) to provide at least 80% calculable power with the following parameters: probability of type I error (0.05), conservative effect size (0.25). The values of n refer to the number of mice used in the animal experiments. In other sections, n refers to the number of experimental repeats. Data is presented as the mean ± standard error of the mean (SEM) or mean ± standard deviation (SD). Differences between experimental groups were analyzed using independent t test (paired, two-sided). A p value less than 0.05 was considered statistically significant. For all imaging and quantifications, personnel quantifying the results were blinded to the experimental groups.
Supplementary Material
KEY RESOURCES TABLE
| REAGENT or RESOURCE | SOURCE | IDENTIFIER |
|---|---|---|
| Antibodies | ||
| Rabbit polyclonal anti-GFAP | Agilent | Cat# Z0334; RRID: AB_10013382 |
| Rat monoclonal anti-GFAP | Invitrogen | Cat# 13–0300; RRID: AB_2532994 |
| Chicken polyclonal anti-GFAP | Chemicon | Cat# AB5541; RRID: AB_177521 |
| Mouse monoclonal anti-tubulin, beta III isoform (TUJ1) | Millipore | Cat# MAB1673; RRID: AB_2210524 |
| Chicken monoclonal anti-MAP2 | Millipore | Cat# AB5543; RRID: AB_571049 |
| Rabbit polyclonal anti-Aldolase C | Invitrogen | Cat# 14884-1-AP; RRID: AB_2226691 |
| Mouse monoclonal anti-O4 | R & D System | Cat# MAB1326; RRID: AB_357617 |
| Rabbit polyclonal anti-SOX9 | Chemicon | Cat# AB5535; RRID: AB_2239761 |
| Human/Mouse monoclonal anti-FOXJ1 | Invitrogen | Cat# 14-9965-82; RRID: AB_1548835 |
| Goat polyclonal anti-FOXJ1 | R&D Systems | Cat# AF3619; RRID: AB_2105870 |
| Mouse monoclonal anti-Nestin | Abcam | Cat# AB6142; RRID: AB_305313 |
| Rabbit polyclonal anti-S100β | Abcam | Cat# 41548; RRID: AB_956280 |
| Goat polyclonal anti-PDGFRα | R&D Systems | Cat# AF-1062; RRID: AB_2236897 |
| Rat monoclonal anti-PDGFRα | Abcam | Cat# AB90967; RRID: AB_2049372 |
| Rabbit monoclonal anti-Ki67 | Invitrogen | Cat# MA5-14520; RRID: AB_10979488 |
| Rabbit polyclonal anti-AGT | Invitrogen | Cat# PA5-21520; RRID: AB_11153449 |
| Rabbit polyclonal anti-IBA1 | FUJIFILM Wako | Cat#019–19741; RRID: AB_839504 |
| Rat monoclonal anti-CD68 | Bio-rad | Cat# MCA1957; RRID: AB_322219 |
| Donkey anti-chicken FITC | Jackson Immuno Research Labs | Cat# 703-095-155; RRID: AB_2340356 |
| Donkey anti-rabbit Cy5 | Jackson Immuno Research Labs | Cat# 711-175-152; RRID: AB_2340607 |
| Donkey anti-rabbit DyLight 405 | Jackson Immuno Research Labs | Cat# 711-475-152; RRID: AB_2340616 |
| Donkey anti-goat Alexa Fluor 488 | Jackson Immuno Research Labs | Cat# 705-545-003; RRID: AB_2340428 |
| Donkey anti-rat AMCA | Jackson Immuno Research Labs | Cat# 712-155-153; RRID: AB_2340663 |
| Donkey anti-rat Cy5 | Jackson Immuno Research Labs | Cat# 712-175-153; RRID: AB_2340672 |
| Donkey anti-mouse Cy5 | Jackson Immuno Research Labs | Cat# 715-175-151; RRID: AB_2340820 |
| Goat anti-rabbit Alexa Fluor 488 | Invitrogen | Cat# A11034; RRID: AB_ 2576217 |
| Goat anti-Mouse Alexa Fluor 647 | Invitrogen | Cat# A-21236; RRID: AB_2535805 |
| Goat anti-rat Alexa Fluor 647 | Invitrogen | Cat# A21247; RRID: AB_141778 |
| Biological samples | ||
| Adult GFAP-Cre spinal cords | This paper | N/A |
| Adult R26-tdT spinal cords | This paper | N/A |
| Adult GFAP-Cre:R26-tdT spinal cords | This paper | N/A |
| Purified GFAP-expressing cells from adult GFAP-Cre:R26-tdT spinal cords | This paper | N/A |
| Chemicals, peptides, and recombinant proteins | ||
| Laminin Mouse Protein | Thermofisher | 23017015 |
| Poly-d-lysin | Millipore | A-003-E |
| Papain | Worthington Biochemical | LS003126 |
| Trypsin-EDTA (0.25%) | Thermofisher | 25200056 |
| Deoxyribonuclease I (DNase I) | Worthington Biochemical | LS002138 |
| L-Cysteine, Hydrochloride | Calbiochem | 2430 |
| DMEM | Corning | 10-013-CM |
| DMEM/F-12 | Invitrogen | 11330032 |
| Bovine serum albumin (BSA) | Thermofisher | BP9706100 |
| DPBS | Thermofisher | 14190144 |
| Fetal bovine serum | Thermofisher | 16140–071 |
| Penicillin streptomycin | Thermofisher | 15140122 |
| Human epidermal growth factor (h-EGF) | PeproTech | AF-100-15 |
| Fibroblast Growth Factor-basic (FGF-b) | Millipore | GF003 |
| Heparin | Stemcell Technologies | 07980 |
| N2 | Invitrogen | 17502014 |
| B-27 | Invitrogen | 12587010 |
| NT3 | Stemcell Technologies | 78074 |
| BDNF | Stemcell Technologies | 78005 |
| 3,3′,5-Triiodo-L-thyronine (T3) | Sigma-Aldrich | T6397 |
| Myelin Removal Beads II | Miltenyi Biotec | 130-096-733 |
| Human recombinant platelet-derived growth factor (PDGF-AA) | Stemcell Technologies | 78095 |
| DAPI | Santa Cruz | sc-3598 |
| Hoechst33342 | Thermofisher | C10337 G |
| TO-PRO3 | Thermofisher | T3605 |
| Trypan Blue | Invitrogen | T10282 |
| Critical commercial assays | ||
| Chromium Single Cell 3′ Reagents | 10x Genomics | V3-V3.1 |
| RNAscope Multiplex Fluorescent V2 Assay | Advanced Cell Diagnostics | 323100 |
| RNAscope Probe Mm-Ifit3 | Advanced Cell Diagnostics | 508251 |
| RNAscope negative control probe DapB | Advanced Cell Diagnostics | 310043 |
| Click-iT™ EdU Cell Proliferation Kit | Invitrogen | C10337 |
| Adult Brain Tissue Dissociation Kit | Miltenyi Biotec | 130-107-677 |
| Deposited data | ||
| Raw sequencing data | This paper | Database: GSE202627 |
| Experimental models: Organisms/strains | ||
| Mouse: GFAP-Cre (B6.Cg-Tg(Gfap-cre) 73.12Mvs/J) | Jackson Laboratory | Strain #:012886 RRID: IMSR_JAX:012886 |
| Mouse: R26-tdT (B6.Cg-Gt(ROSA) 26Sortm9 (CAG-tdTomato)Hze/J) | Jackson Laboratory | Strain #:007909 RRID: IMSR_JAX:007909 |
| Mouse: GFAP-Cre:R26-tdT | This paper | N/A |
| Software and algorithms | ||
| ImageJ/Fiji | NIH | https://imagej.nih.gov/ij/index.html; RRID: SCR_003070 |
| Prism 5.0 | GraphPad Software | http://www.graphpad.com; RRID:SCR_002798 |
| Neurolucida 360 | MBF Bioscience | https://www.mbfbioscience.com/products/neurolucida-360 |
| Stereo Investigator | MBF Bioscience | https://www.mbfbioscience.com/stereo-investigator |
| R Studio | R Studio | https://rstudio.com/ |
| MSigDB | Subramanian et al.56 | https://www.gsea-msigdb.org/gsea/index.jsp |
| cellranger-5.0.1 | Zheng et al.96 | https://support.10xgenomics.com/single-cell-gene-expression/software/pipelines/latest/using/tutorials |
| Seurat | Stuart et al.43 | https://satijalab.org/seurat/ |
| fgsea | Gennady Korotkevich97 | https://github.com/ctlab/fgsea |
| Monocle2 and 3 | Trapnell et al.59 | http://cole-trapnell-lab.github.io/monocle-release/ |
| Velocyto.py | La Manno et al.58 | http://velocyto.org/velocyto.py/tutorial/analysis.html |
| velocyto.R | N/A | https://github.com/velocyto-team/velocyto.R |
| SCENIC | Van de Sande et al.60 | https://scenic.aertslab.org/ |
| Gephi | N/A | https://gephi.org/ |
| LandSCENT | Teschendorff and Enver66 | https://github.com/ChenWeiyan/LandSCENT |
| Nikon NIS-Elements HC | Nikon Instruments Inc., USA | Ver 5.41.02 Build 1711 |
| Other | ||
| BD FACS Aria II flow cytometer | BD Biosciences | https://www.bdbiosciences.com/en-us |
| Infinite Horizons Impactor | Precision Systems and Instrumentation | IH-0400 Impactor |
| Leica cryostat | Leica Microsystems | CM1950 |
| Illumina Novaseq6000 | Genomic and RNA Profiling Core at Baylor College of Medicine | https://www.bcm.edu/research/atc-core-labs/genomic-and-rna-profiling-core |
| NextSeq500 | The University of Houston Sequencing and Editing Core | https://seqnedit.nsm.uh.edu/ |
| Olympus BH-2 microscope | Olympus America Inc | https://www.olympus-lifescience.com/en/ |
| Leica DMI8 inverted confocal microscope | Leica Microsystems | https://www.leica-microsystems.com/ |
| GentleMACS Octo Dissociator with heaters | Miltenyi Biotec | 130-096-427 |
| Nikon AX-R confocal microscope | Nikon Instruments Inc., USA | https://www.microscope.healthcare.nikon.com/products/confocal-microscopes/ax |
| Thermo Cytospin 4 | Thermoscientific | A78300101 |
Highlights.
scRNA-seq revealed GFAP+ populations with distinct functional enrichment and dynamics
Regulatory network analysis predicted regulons defining specific subpopulations
Laminectomy sham surgery was sufficient to induce the activation of astrocyte-lineage cells
This study unveiled additional sources/pools of resident progenitors in adult spinal cord
ACKNOWLEDGMENTS
We thank Drs. Benjamin Deneen, Dwight E. Bergles, and Qi-Lin Cao for discussion. We also thank Drs. Ville Meretoja, Zhengmei Mao, Yiyan Zheng, Michihiro Kobayashi, Matthew K. Hogan, Laura Montier, Michael D. Monterey, and Ms. Frances Humes for technical assistance. This study was supported by grants from the NIH, United States (R01 NS088353 and R21 NS113068), the Amy and Edward Knight Fund, the UTHSC Senator Lloyd Bentsen Center for Stroke Research, and Mission Connect—a program of The Institute for Rehabilitation and Research (TIRR) Foundation.
Footnotes
SUPPLEMENTAL INFORMATION
Supplemental information can be found online at https://doi.org/10.1016/j.celrep.2023.112486.
DECLARATION OF INTERESTS
The authors declare no competing interests.
INCLUSION AND DIVERSITY
We support inclusive, diverse, and equitable conduct of research.
REFERENCES
- 1.Hachem LD, and Fehlings MG (2021). Pathophysiology of spinal cord injury. Neurosurg. Clin 32, 305–313. 10.1016/j.nec.2021.03.002. [DOI] [PubMed] [Google Scholar]
- 2.Okada S, Hara M, Kobayakawa K, Matsumoto Y, and Nakashima Y (2018). Astrocyte reactivity and astrogliosis after spinal cord injury. Neurosci. Res 126, 39–43. 10.1016/j.neures.2017.10.004. [DOI] [PubMed] [Google Scholar]
- 3.Silva NA, Sousa N, Reis RL, and Salgado AJ (2014). From basics to clinical: a comprehensive review on spinal cord injury. Prog. Neurobiol 114, 25–57. 10.1016/j.pneurobio.2013.11.002. [DOI] [PubMed] [Google Scholar]
- 4.Ding S. (2014). Dynamic reactive astrocytes after focal ischemia. Neural Regen. Res 9, 2048–2052. 10.4103/1673-5374.147929. [DOI] [PMC free article] [PubMed] [Google Scholar]
- 5.Filous AR, and Silver J (2016). Targeting astrocytes in CNS injury and disease: a translational research approach. Prog. Neurobiol 144, 173–187. 10.1016/j.pneurobio.2016.03.009. [DOI] [PMC free article] [PubMed] [Google Scholar]
- 6.Zamanian JL, Xu L, Foo LC, Nouri N, Zhou L, Giffard RG, and Barres BA (2012). Genomic analysis of reactive astrogliosis. J. Neurosci 32, 6391–6410. 10.1523/JNEUROSCI.6221-11.2012. [DOI] [PMC free article] [PubMed] [Google Scholar]
- 7.Anderson MA, Burda JE, Ren Y, Ao Y, O’Shea TM, Kawaguchi R, Coppola G, Khakh BS, Deming TJ, and Sofroniew MV (2016). Astrocyte scar formation aids central nervous system axon regeneration. Nature 532, 195–200. 10.1038/nature17623. [DOI] [PMC free article] [PubMed] [Google Scholar]
- 8.Anderson MA, O’Shea TM, Burda JE, Ao Y, Barlatey SL, Bernstein AM, Kim JH, James ND, Rogers A, Kato B, et al. (2018). Required growth facilitators propel axon regeneration across complete spinal cord injury. Nature 561, 396–400. 10.1038/s41586-018-0467-6. [DOI] [PMC free article] [PubMed] [Google Scholar]
- 9.Freeman MR, and Rowitch DH (2013). Evolving concepts of gliogenesis: a look way back and ahead to the next 25 years. Neuron 80, 613–623. 10.1016/j.neuron.2013.10.034. [DOI] [PMC free article] [PubMed] [Google Scholar]
- 10.Haas C, and Fischer I (2013). Human astrocytes derived from glial restricted progenitors support regeneration of the injured spinal cord. J. Neurotrauma 30, 1035–1052. 10.1089/neu.2013.2915. [DOI] [PMC free article] [PubMed] [Google Scholar]
- 11.Paukert M, Agarwal A, Cha J, Doze VA, Kang JU, and Bergles DE (2014). Norepinephrine controls astroglial responsiveness to local circuit activity. Neuron 82, 1263–1270. 10.1016/j.neuron.2014.04.038. [DOI] [PMC free article] [PubMed] [Google Scholar]
- 12.Batiuk MY, Martirosyan A,Wahis J, de Vin F, Marneffe C, Kusserow C, Koeppen J, Viana JF, Oliveira JF, Voet T, et al. (2020). Identification of region-specific astrocyte subtypes at single cell resolution. Nat. Commun 11, 1220. 10.1038/s41467-019-14198-8. [DOI] [PMC free article] [PubMed] [Google Scholar]
- 13.Bayraktar OA, Bartels T, Holmqvist S, Kleshchevnikov V, Martirosyan A, Polioudakis D, Ben Haim L, Young AMH, Batiuk MY, Prakash K, et al. (2020). Astrocyte layers in the mammalian cerebral cortex revealed by a single-cell in situ transcriptomic map. Nat. Neurosci 23, 500–509. 10.1038/s41593-020-0602-1. [DOI] [PMC free article] [PubMed] [Google Scholar]
- 14.John Lin CC, Yu K, Hatcher A, Huang TW, Lee HK, Carlson J, Weston MC, Chen F, Zhang Y, Zhu W, et al. (2017). Identification of diverse astrocyte populations and their malignant analogs. Nat. Neurosci 20, 396–405. 10.1038/nn.4493. [DOI] [PMC free article] [PubMed] [Google Scholar]
- 15.Rosenberg AB, Roco CM, Muscat RA, Kuchina A, Sample P, Yao Z, Graybuck LT, Peeler DJ, Mukherjee S, Chen W, et al. (2018). Single-cell profiling of the developing mouse brain and spinal cord with split-pool barcoding. Science 360, 176–182. 10.1126/science.aam8999. [DOI] [PMC free article] [PubMed] [Google Scholar]
- 16.Russ DE, Cross RBP, Li L, Koch SC, Matson KJE, Yadav A, Alkaslasi MR, Lee DI, Le Pichon CE, Menon V, and Levine AJ (2021). A harmonized atlas of mouse spinal cord cell types and their spatial organization. Nat. Commun 12, 5722. 10.1038/s41467-021-25125-1. [DOI] [PMC free article] [PubMed] [Google Scholar]
- 17.Khakh BS, and Deneen B (2019). The emerging nature of astrocyte diversity. Annu. Rev. Neurosci 42, 187–207. 10.1146/annurev-neuro-070918-050443. [DOI] [PubMed] [Google Scholar]
- 18.Chen K, Deng S, Lu H, Zheng Y, Yang G, Kim D, Cao Q, and Wu JQ (2013). RNA-seq characterization of spinal cord injury transcriptome in acute/subacute phases: a resource for understanding the pathology at the systems level. PLoS One 8, e72567. 10.1371/journal.pone.0072567. [DOI] [PMC free article] [PubMed] [Google Scholar]
- 19.Duran RCD, Yan H, Zheng Y, Huang X, Grill R, Kim DH, Cao Q, and Wu JQ (2017). The systematic analysis of coding and long non-coding RNAs in the sub-chronic and chronic stages of spinal cord injury. Sci. Rep 7, 41008. 10.1038/srep41008. [DOI] [PMC free article] [PubMed] [Google Scholar]
- 20.Wei H, Wu X, You Y, Duran RCD, Zheng Y, Narayanan KL, Hai B, Li X, Tallapragada N, Prajapati TJ, et al. (2021). Systematic analysis of purified astrocytes after SCI unveils Zeb2os function during astrogliosis. Cell Rep. 34, 108721. 10.1016/j.celrep.2021.108721. [DOI] [PMC free article] [PubMed] [Google Scholar]
- 21.Dimou L, and Götz M (2014). Glial cells as progenitors and stem cells: new roles in the healthy and diseased brain. Physiol. Rev 94, 709–737. 10.1152/physrev.00036.2013. [DOI] [PubMed] [Google Scholar]
- 22.Dulken BW, Leeman DS, Boutet SC, Hebestreit K, and Brunet A (2017). Single-cell transcriptomic analysis defines heterogeneity and transcriptional dynamics in the adult neural stem cell lineage. Cell Rep. 18, 777–790. 10.1016/j.celrep.2016.12.060. [DOI] [PMC free article] [PubMed] [Google Scholar]
- 23.Merkle FT, Tramontin AD, García-Verdugo JM, and Alvarez-Buylla A (2004). Radial glia give rise to adult neural stem cells in the subventricular zone. Proc. Natl. Acad. Sci. USA 101, 17528–17532. 10.1073/pnas.0407893101. [DOI] [PMC free article] [PubMed] [Google Scholar]
- 24.Weng Q, Wang J, Wang J, He D, Cheng Z, Zhang F, Verma R, Xu L, Dong X, Liao Y, et al. (2019). Single-cell transcriptomics uncovers glial progenitor diversity and cell fate determinants during development and gliomagenesis. Cell Stem Cell 24, 707–723.e8. 10.1016/j.stem.2019.03.006. [DOI] [PMC free article] [PubMed] [Google Scholar]
- 25.Darmanis S, Sloan SA, Zhang Y, Enge M, Caneda C, Shuer LM, Hayden Gephart MG, Barres BA, and Quake SR (2015). A survey of human brain transcriptome diversity at the single cell level. Proc. Natl. Acad. Sci. USA 112, 7285–7290. 10.1073/pnas.1507125112. [DOI] [PMC free article] [PubMed] [Google Scholar]
- 26.Pollen AA, Nowakowski TJ, Shuga J, Wang X, Leyrat AA, Lui JH, Li N, Szpankowski L, Fowler B, Chen P, et al. (2014). Lowcoverage single-cell mRNA sequencing reveals cellular heterogeneity and activated signaling pathways in developing cerebral cortex. Nat. Biotechnol 32, 1053–1058. 10.1038/nbt.2967. [DOI] [PMC free article] [PubMed] [Google Scholar]
- 27.Zeisel A, Muñoz-Manchado AB, Codeluppi S, Lönnerberg P, La Manno G, Juréus A, Marques S, Munguba H, He L, Betsholtz C, et al. (2015). Brain structure. Cell types in the mouse cortex and hippocampus revealed by single-cell RNA-seq. Science 347, 1138–1142. 10.1126/science.aaa1934. [DOI] [PubMed] [Google Scholar]
- 28.Milich LM, Choi JS, Ryan C, Cerqueira SR, Benavides S, Yahn SL, Tsoulfas P, and Lee JK (2021). Single-cell analysis of the cellular heterogeneity and interactions in the injured mouse spinal cord. J. Exp. Med 218, e20210040. 10.1084/jem.20210040. [DOI] [PMC free article] [PubMed] [Google Scholar]
- 29.Llorens-Bobadilla E, Chell JM, Le Merre P, Wu Y, Zamboni M, Bergenstråhle J, Stenudd M, Sopova E, Lundeberg J, Shupliakov O, et al. (2020). A latent lineage potential in resident neural stem cells enables spinal cord repair. Science 370, eabb8795. 10.1126/science.abb8795. [DOI] [PubMed] [Google Scholar]
- 30.Meletis K, Barnabé-Heider F, Carlén M, Evergren E, Tomilin N, Shupliakov O, and Frisén J (2008). Spinal cord injury reveals multilineage differentiation of ependymal cells. PLoS Biol 6, e182. 10.1371/journal.pbio.0060182. [DOI] [PMC free article] [PubMed] [Google Scholar]
- 31.Stenudd M, Sabelström H, Llorens-Bobadilla E, Zamboni M, Blom H, Brismar H, Zhang S, Basak O, Clevers H, Göritz C, et al. (2022). Identification of a discrete subpopulation of spinal cord ependymal cells with neural stem cell properties. Cell Rep. 38, 110440. 10.1016/j.celrep.2022.110440. [DOI] [PubMed] [Google Scholar]
- 32.Cuevas-Diaz Duran R, Li Y, Garza Carbajal A, You Y, Dessauer CW, Wu J, and Walters ET (2022). Major differences in transcriptional alterations in dorsal root ganglia between spinal cord injury and peripheral neuropathic pain models. J. Neurotrauma 10.1089/neu.2022.0238. [DOI] [PMC free article] [PubMed] [Google Scholar]
- 33.Sofroniew MV (2018). Dissecting spinal cord regeneration. Nature 557, 343–350. 10.1038/s41586-018-0068-4. [DOI] [PubMed] [Google Scholar]
- 34.Squair JW, Gautier M, Sofroniew MV, Courtine G, and Anderson MA (2021). Engineering spinal cord repair. Curr. Opin. Biotechnol 72, 48–53. 10.1016/j.copbio.2021.10.006. [DOI] [PubMed] [Google Scholar]
- 35.Herrmann JE, Imura T, Song B, Qi J, Ao Y, Nguyen TK, Korsak RA, Takeda K, Akira S, and Sofroniew MV (2008). STAT3 is a critical regulator of astrogliosis and scar formation after spinal cord injury. J. Neurosci 28, 7231–7243. 10.1523/JNEUROSCI.1709-08.2008. [DOI] [PMC free article] [PubMed] [Google Scholar]
- 36.Farhy-Tselnicker I, Boisvert MM, Liu H, Dowling C, Erikson GA, Blanco-Suarez E, Farhy C, Shokhirev MN, Ecker JR, and Allen NJ (2021). Activity-dependent modulation of synapse-regulating genes in astrocytes. Elife 10, e70514. 10.7554/eLife.70514. [DOI] [PMC free article] [PubMed] [Google Scholar]
- 37.Tao J, Wu H, Lin Q, Wei W, Lu XH, Cantle JP, Ao Y, Olsen RW, Yang XW, Mody I, et al. (2011). Deletion of astroglial Dicer causes non-cell-autonomous neuronal dysfunction and degeneration. J. Neurosci 31, 8306–8319. 10.1523/JNEUROSCI.0567-11.2011. [DOI] [PMC free article] [PubMed] [Google Scholar]
- 38.Hill SA, Blaeser AS, Coley AA, Xie Y, Shepard KA, Harwell CC, Gao WJ, and Garcia ADR (2019). Sonic hedgehog signaling in astrocytes mediates cell type-specific synaptic organization. Elife 8, e45545. 10.7554/eLife.45545. [DOI] [PMC free article] [PubMed] [Google Scholar]
- 39.Batiuk MY, de Vin F, Duqué SI, Li C, Saito T, Saido T, Fiers M, Belgard TG, and Holt MG (2017). An immunoaffinity-based method for isolating ultrapure adult astrocytes based on ATP1B2 targeting by the ACSA-2 antibody. J. Biol. Chem 292, 8874–8891. 10.1074/jbc.M116.765313. [DOI] [PMC free article] [PubMed] [Google Scholar]
- 40.Flügge G, Araya-Callis C, Garea-Rodriguez E, Stadelmann-Nessler C, and Fuchs E (2014). NDRG2 as a marker protein for brain astrocytes. Cell Tissue Res. 357, 31–41. 10.1007/s00441-014-1837-5. [DOI] [PMC free article] [PubMed] [Google Scholar]
- 41.Raponi E, Agenes F, Delphin C, Assard N, Baudier J, Legraverend C, and Deloulme JC (2007). S100B expression defines a state in which GFAP-expressing cells lose their neural stem cell potential and acquire a more mature developmental stage. Glia 55, 165–177. 10.1002/glia.20445. [DOI] [PMC free article] [PubMed] [Google Scholar]
- 42.Yang L, Li Z, Liu G, Li X, and Yang Z (2022). Developmental origins of human cortical oligodendrocytes and astrocytes. Neurosci. Bull 38, 47–68. 10.1007/s12264-021-00759-9. [DOI] [PMC free article] [PubMed] [Google Scholar]
- 43.Stuart T, Butler A, Hoffman P, Hafemeister C, Papalexi E, Mauck WM 3rd, Hao Y, Stoeckius M, Smibert P, and Satija R (2019). Comprehensive integration of single-cell data. Cell 177, 1888–1902.e21. 10.1016/j.cell.2019.05.031. [DOI] [PMC free article] [PubMed] [Google Scholar]
- 44.Horiuchi M, Suzuki-Horiuchi Y, Akiyama T, Itoh A, Pleasure D, Carstens E, and Itoh T (2017). Differing intrinsic biological properties between forebrain and spinal oligodendroglial lineage cells. J. Neurochem 142, 378–391. 10.1111/jnc.14074. [DOI] [PMC free article] [PubMed] [Google Scholar]
- 45.Whitfield ML, George LK, Grant GD, and Perou CM (2006). Common markers of proliferation. Nat. Rev. Cancer 6, 99–106. 10.1038/nrc1802. [DOI] [PubMed] [Google Scholar]
- 46.Honda K, Yanai H, Negishi H, Asagiri M, Sato M, Mizutani T, Shimada N, Ohba Y, Takaoka A, Yoshida N, and Taniguchi T (2005). IRF-7 is the master regulator of type-I interferon-dependent immune responses. Nature 434, 772–777. 10.1038/nature03464. [DOI] [PubMed] [Google Scholar]
- 47.Perng YC, and Lenschow DJ (2018). ISG15 in antiviral immunity and beyond. Nat. Rev. Microbiol. 16, 423–439. 10.1038/s41579-018-0020-5. [DOI] [PMC free article] [PubMed] [Google Scholar]
- 48.Wu CE, Yu CW, Chang KW, Chou WH, Lu CY, Ghelfi E, Wu FC, Jan PS, Huang MC, Allard P, et al. (2017). Comparative global immune-related gene profiling of somatic cells, human pluripotent stem cells and their derivatives: implication for human lymphocyte proliferation. Exp. Mol. Med 49, e376. 10.1038/emm.2017.134. [DOI] [PMC free article] [PubMed] [Google Scholar]
- 49.Kim D, An H, Fan C, and Park Y (2021). Identifying oligodendrocyte enhancers governing Plp1 expression. Hum. Mol. Genet 30, 2225–2239. 10.1093/hmg/ddab184. [DOI] [PMC free article] [PubMed] [Google Scholar]
- 50.Sperber BR, and McMorris FA (2001). Fyn tyrosine kinase regulates oligodendroglial cell development but is not required for morphological differentiation of oligodendrocytes. J. Neurosci. Res 63, 303–312. . [DOI] [PubMed] [Google Scholar]
- 51.Jurga AM, Paleczna M, and Kuter KZ (2020). Overview of general and discriminating markers of differential microglia phenotypes. Front. Cell. Neurosci 14, 198. 10.3389/fncel.2020.00198. [DOI] [PMC free article] [PubMed] [Google Scholar]
- 52.Perego C, Fumagalli S, and De Simoni MG (2011). Temporal pattern of expression and colocalization of microglia/macrophage phenotype markers following brain ischemic injury in mice. J. Neuroinflammation 8, 174. 10.1186/1742-2094-8-174. [DOI] [PMC free article] [PubMed] [Google Scholar]
- 53.Zhang Y, Chen K, Sloan SA, Bennett ML, Scholze AR, O’Keeffe S, Phatnani HP, Guarnieri P, Caneda C, Ruderisch N, et al. (2014). An RNA-sequencing transcriptome and splicing database of glia, neurons, and vascular cells of the cerebral cortex. J. Neurosci 34, 11929–11947. 10.1523/JNEUROSCI.1860-14.2014. [DOI] [PMC free article] [PubMed] [Google Scholar]
- 54.Gillen AE, Riemondy KA, Amani V, Griesinger AM, Gilani A, Venkataraman S, Madhavan K, Prince E, Sanford B, Hankinson TC, et al. (2020). Single-cell RNA sequencing of childhood ependymoma reveals neoplastic cell subpopulations that impact molecular classification and etiology. Cell Rep. 32, 108023. 10.1016/j.celrep.2020.108023. [DOI] [PMC free article] [PubMed] [Google Scholar]
- 55.Li X, Floriddia EM, Toskas K, Chalfouh C, Honore A, Aumont A, Vallières N, Lacroix S, Fernandes KJL, Guérout N, and Barnabé--Heider F (2018). FoxJ1 regulates spinal cord development and is required for the maintenance of spinal cord stem cell potential. Exp. Cell Res 368, 84–100. 10.1016/j.yexcr.2018.04.017. [DOI] [PubMed] [Google Scholar]
- 56.Subramanian A, Tamayo P, Mootha VK, Mukherjee S, Ebert BL, Gillette MA, Paulovich A, Pomeroy SL, Golub TR, Lander ES, and Mesirov JP (2005). Gene set enrichment analysis: a knowledge-based approach for interpreting genome-wide expression profiles. Proc. Natl. Acad. Sci. USA 102, 15545–15550. 10.1073/pnas.0506580102. [DOI] [PMC free article] [PubMed] [Google Scholar]
- 57.Bergen V, Lange M, Peidli S, Wolf FA, and Theis FJ (2020). Generalizing RNA velocity to transient cell states through dynamical modeling. Nat. Biotechnol 38, 1408–1414. 10.1038/s41587-020-0591-3. [DOI] [PubMed] [Google Scholar]
- 58.La Manno G, Soldatov R, Zeisel A, Braun E, Hochgerner H, Petukhov V, Lidschreiber K, Kastriti ME, Lönnerberg P, Furlan A, et al. (2018). RNA velocity of single cells. Nature 560, 494–498. 10.1038/s41586-018-0414-6. [DOI] [PMC free article] [PubMed] [Google Scholar]
- 59.Trapnell C, Cacchiarelli D, Grimsby J, Pokharel P, Li S, Morse M, Lennon NJ, Livak KJ, Mikkelsen TS, and Rinn JL (2014). The dynamics and regulators of cell fate decisions are revealed by pseudotemporal ordering of single cells. Nat. Biotechnol 32, 381–386. 10.1038/nbt.2859. [DOI] [PMC free article] [PubMed] [Google Scholar]
- 60.Van de Sande B, Flerin C, Davie K, De Waegeneer M, Hulselmans G, Aibar S, Seurinck R, Saelens W, Cannoodt R, Rouchon Q, et al. (2020). A scalable SCENIC workflow for single-cell gene regulatory network analysis. Nat. Protoc 15, 2247–2276. 10.1038/s41596-020-0336-2. [DOI] [PubMed] [Google Scholar]
- 61.Rezania A, Bruin JE, Xu J, Narayan K, Fox JK, O’Neil JJ, and Kieffer TJ (2013). Enrichment of human embryonic stem cell-derived NKX6.1-expressing pancreatic progenitor cells accelerates the maturation of insulin-secreting cells in vivo. Stem Cell. 31, 2432–2442. 10.1002/stem.1489. [DOI] [PubMed] [Google Scholar]
- 62.Zhang X, Yalcin S, Lee DF, Yeh TYJ, Lee SM, Su J, Mungamuri SK, Rimmelé P, Kennedy M, Sellers R, et al. (2011). FOXO1 is an essential regulator of pluripotency in human embryonic stem cells. Nat. Cell Biol 13, 1092–1099. 10.1038/ncb2293. [DOI] [PMC free article] [PubMed] [Google Scholar]
- 63.Tran AP, Warren PM, and Silver J (2018). The biology of regeneration failure and success after spinal cord injury. Physiol. Rev 98, 881–917. 10.1152/physrev.00017.2017. [DOI] [PMC free article] [PubMed] [Google Scholar]
- 64.Wanner IB, Anderson MA, Song B, Levine J, Fernandez A, Gray-Thompson Z, Ao Y, and Sofroniew MV (2013). Glial scar borders are formed by newly proliferated, elongated astrocytes that interact to corral inflammatory and fibrotic cells via STAT3-dependent mechanisms after spinal cord injury. J. Neurosci 33, 12870–12886. 10.1523/JNEUROSCI.2121-13.2013. [DOI] [PMC free article] [PubMed] [Google Scholar]
- 65.Takahashi M, Arai Y, Kurosawa H, Sueyoshi N, and Shirai S (2003). Ependymal cell reactions in spinal cord segments after compression injury in adult rat. J. Neuropathol. Exp. Neurol 62, 185–194. 10.1093/jnen/62.2.185. [DOI] [PubMed] [Google Scholar]
- 66.Teschendorff AE, and Enver T (2017). Single-cell entropy for accurate estimation of differentiation potency from a cell’s transcriptome. Nat. Commun 8, 15599. 10.1038/ncomms15599. [DOI] [PMC free article] [PubMed] [Google Scholar]
- 67.Escartin C, Galea E, Lakatos A, O’Callaghan JP, Petzold GC, Serrano-Pozo A, Steinhäuser C, Volterra A, Carmignoto G, Agarwal A, et al. (2021). Reactive astrocyte nomenclature, definitions, and future directions. Nat. Neurosci 24, 312–325. 10.1038/s41593-020-00783-4. [DOI] [PMC free article] [PubMed] [Google Scholar]
- 68.Hopperton KE, Mohammad D, Trépanier MO, Giuliano V, and Bazinet RP (2018). Markers of microglia in post-mortem brain samples from patients with Alzheimer’s disease: a systematic review. Mol. Psychiatr 23, 177–198. 10.1038/mp.2017.246. [DOI] [PMC free article] [PubMed] [Google Scholar]
- 69.Damisah EC, Hill RA, Rai A, Chen F, Rothlin CV, Ghosh S, and Grutzendler J (2020). Astrocytes and microglia play orchestrated roles and respect phagocytic territories during neuronal corpse removal in vivo. Sci. Adv 6, eaba3239. 10.1126/sciadv.aba3239. [DOI] [PMC free article] [PubMed] [Google Scholar]
- 70.Schmid RS, McGrath B, Berechid BE, Boyles B, Marchionni M, Sestan N, and Anton ES (2003). Neuregulin 1-erbB2 signaling is required for the establishment of radial glia and their transformation into astrocytes in cerebral cortex. Proc. Natl. Acad. Sci. USA 100, 4251–4256. 10.1073/pnas.0630496100. [DOI] [PMC free article] [PubMed] [Google Scholar]
- 71.Blanchette CR, Perrat PN, Thackeray A, and Bénard CY (2015). Glypican is a modulator of netrin-mediated axon guidance. PLoS Biol. 13, e1002183. 10.1371/journal.pbio.1002183. [DOI] [PMC free article] [PubMed] [Google Scholar]
- 72.Doyu M, Sobue G, Ken E, Kimata K, Shinomura T, Yamada Y, Mitsuma T, and Takahashi A (1993). Laminin A, B1, and B2 chain gene expression in transected and regenerating nerves: regulation by axonal signals. J. Neurochem 60, 543–551. 10.1111/j.1471-4159.1993.tb03183.x. [DOI] [PubMed] [Google Scholar]
- 73.Hobson MI, Green CJ, and Terenghi G (2000). VEGF enhances intraneural angiogenesis and improves nerve regeneration after axotomy. J. Anat 197, 591–605. 10.1046/j.1469-7580.2000.19740591.x. [DOI] [PMC free article] [PubMed] [Google Scholar]
- 74.Liauw J, Hoang S, Choi M, Eroglu C, Choi M, Sun GH, Percy M, Wildman-Tobriner B, Bliss T, Guzman RG, et al. (2008). Thrombospondins 1 and 2 are necessary for synaptic plasticity and functional recovery after stroke. J. Cerebr. Blood Flow Metabol 28, 1722–1732. 10.1038/jcbfm.2008.65. [DOI] [PubMed] [Google Scholar]
- 75.Sherrod M, Liu X, Zhang X, and Sigmund CD (2005). Nuclear localization of angiotensinogen in astrocytes. Am. J. Physiol. Regul. Integr. Comp. Physiol 288, R539–R546. 10.1152/ajpregu.00594.2004. [DOI] [PubMed] [Google Scholar]
- 76.Wosik K, Cayrol R, Dodelet-Devillers A, Berthelet F, Bernard M, Moumdjian R, Bouthillier A, Reudelhuber TL, and Prat A (2007). Angiotensin II controls occludin function and is required for blood brain barrier maintenance: relevance to multiple sclerosis. J. Neurosci 27, 9032–9042. 10.1523/JNEUROSCI.2088-07.2007. [DOI] [PMC free article] [PubMed] [Google Scholar]
- 77.Jackson EL, Garcia-Verdugo JM, Gil-Perotin S, Roy M, Quinones-Hinojosa A, VandenBerg S, and Alvarez-Buylla A (2006). PDGFR alpha-positive B cells are neural stem cells in the adult SVZ that form glioma-like growths in response to increased PDGF signaling. Neuron 51, 187–199. 10.1016/j.neuron.2006.06.012. [DOI] [PubMed] [Google Scholar]
- 78.Yokoyama A, Sakamoto A, Kameda K, Imai Y, and Tanaka J (2006). NG2 proteoglycan-expressing microglia as multipotent neural progenitors in normal and pathologic brains. Glia 53, 754–768. 10.1002/glia.20332. [DOI] [PubMed] [Google Scholar]
- 79.Avraham O, Feng R, Ewan EE, Rustenhoven J, Zhao G, and Cavalli V (2021). Profiling sensory neuron microenvironment after peripheral and central axon injury reveals key pathways for neural repair. Elife 10, e68457. 10.7554/eLife.68457. [DOI] [PMC free article] [PubMed] [Google Scholar]
- 80.Sellers DL, Maris DO, and Horner PJ (2009). Postinjury niches induce temporal shifts in progenitor fates to direct lesion repair after spinal cord injury. J. Neurosci 29, 6722–6733. 10.1523/JNEUROSCI.4538-08.2009. [DOI] [PMC free article] [PubMed] [Google Scholar]
- 81.Horky LL, Galimi F, Gage FH, and Horner PJ (2006). Fate of endogenous stem/progenitor cells following spinal cord injury. J. Comp. Neurol 498, 525–538. 10.1002/cne.21065. [DOI] [PMC free article] [PubMed] [Google Scholar]
- 82.Lee SY, and Chung WS (2021). The roles of astrocytic phagocytosis in maintaining homeostasis of brains. J. Pharmacol. Sci 145, 223–227. 10.1016/j.jphs.2020.12.007. [DOI] [PubMed] [Google Scholar]
- 83.Solga AC, Pong WW, Walker J, Wylie T, Magrini V, Apicelli AJ, Griffith M, Griffith OL, Kohsaka S, Wu GF, et al. (2015). RNA-sequencing reveals oligodendrocyte and neuronal transcripts in microglia relevant to central nervous system disease. Glia 63, 531–548. 10.1002/glia.22754. [DOI] [PMC free article] [PubMed] [Google Scholar]
- 84.Rao Y, Du S, Yang B, Wang Y, Li Y, Li R, Zhou T, Du X, He Y, Wang Y, et al. (2021). NeuroD1 induces microglial apoptosis and cannot induce microglia-to-neuron cross-lineage reprogramming. Neuron 109, 4094–4108.e5. 10.1016/j.neuron.2021.11.008. [DOI] [PubMed] [Google Scholar]
- 85.Barnabé-Heider F, Göritz C, Sabelström H, Takebayashi H, Pfrieger FW, Meletis K, and Frisén J (2010). Origin of new glial cells in intact and injured adult spinal cord. Cell Stem Cell 7, 470–482. 10.1016/j.stem.2010.07.014. [DOI] [PubMed] [Google Scholar]
- 86.Santopolo G, Magnusson JP, Lindvall O, Kokaia Z, and Frisen J (2020). Blocking notch-signaling increases neurogenesis in the striatum after stroke. Cells 9. 10.3390/cells9071732. [DOI] [PMC free article] [PubMed] [Google Scholar]
- 87.Zamboni M, Llorens-Bobadilla E, Magnusson JP, and Frisén J (2020). A widespread neurogenic potential of neocortical astrocytes is induced by injury. Cell Stem Cell 27, 605–617.e5. 10.1016/j.stem.2020.07.006. [DOI] [PMC free article] [PubMed] [Google Scholar]
- 88.Basak O, Krieger TG, Muraro MJ, Wiebrands K, Stange DE, Frias-Aldeguer J, Rivron NC, van de Wetering M, van Es JH, van Oudenaarden A, et al. (2018). Troy+ brain stem cells cycle through quiescence and regulate their number by sensing niche occupancy. Proc. Natl. Acad. Sci. USA 115, E610–E619. 10.1073/pnas.1715911114. [DOI] [PMC free article] [PubMed] [Google Scholar]
- 89.Gabel S, Koncina E, Dorban G, Heurtaux T, Birck C, Glaab E, Michelucci A, Heuschling P, and Grandbarbe L (2016). Inflammation promotes a conversion of astrocytes into neural progenitor cells via NF-kappaB activation. Mol. Neurobiol 53, 5041–5055. 10.1007/s12035-015-9428-3. [DOI] [PMC free article] [PubMed] [Google Scholar]
- 90.Garcia ADR, Doan NB, Imura T, Bush TG, and Sofroniew MV (2004). GFAP-expressing progenitors are the principal source of constitutive neurogenesis in adult mouse forebrain. Nat. Neurosci 7, 1233–1241. 10.1038/nn1340. [DOI] [PubMed] [Google Scholar]
- 91.Halbeisen RE, Galgano A, Scherrer T, and Gerber AP (2008). Post-transcriptional gene regulation: from genome-wide studies to principles. Cell. Mol. Life Sci 65, 798–813. 10.1007/s00018-007-7447-6. [DOI] [PMC free article] [PubMed] [Google Scholar]
- 92.Wei H, Dong X, You Y, Hai B, Duran RCD, Wu X, Kharas N, and Wu JQ (2021). OLIG2 regulates lncRNAs and its own expression during oligodendrocyte lineage formation. BMC Biol. 19, 132. 10.1186/s12915-021-01057-6. [DOI] [PMC free article] [PubMed] [Google Scholar]
- 93.You Y, Cuevas-Diaz Duran R, Jiang L, Dong X, Zong S, Snyder M, and Wu JQ (2018). An integrated global regulatory network of hematopoietic precursor cell self-renewal and differentiation. Integr. Biol 10, 390–405. 10.1039/c8ib00059j. [DOI] [PMC free article] [PubMed] [Google Scholar]
- 94.Laywell ED, Rakic P, Kukekov VG, Holland EC, and Steindler DA (2000). Identification of a multipotent astrocytic stem cell in the immature and adult mouse brain. Proc. Natl. Acad. Sci. USA 97, 13883–13888. 10.1073/pnas.250471697. [DOI] [PMC free article] [PubMed] [Google Scholar]
- 95.Su Z, Niu W, Liu ML, Zou Y, and Zhang CL (2014). In vivo conversion of astrocytes to neurons in the injured adult spinal cord. Nat. Commun 5, 3338. 10.1038/ncomms4338. [DOI] [PMC free article] [PubMed] [Google Scholar]
- 96.Zheng GXY, Terry JM, Belgrader P, Ryvkin P, Bent ZW, Wilson R, Ziraldo SB, Wheeler TD, McDermott GP, Zhu J, et al. (2017). Massively parallel digital transcriptional profiling of single cells. Nat. Commun 8, 14049. 10.1038/ncomms14049. [DOI] [PMC free article] [PubMed] [Google Scholar]
- 97.Korotkevich G, Sukhov V, Budin N, Shpak B, Artyomov MN, and Sergushichev A (2021). Fast gene set enrichment analysis. Preprint at bioRxiv 10.1101/060012. [DOI] [Google Scholar]
- 98.Cheriyan T, Ryan DJ, Weinreb JH, Cheriyan J, Paul JC, Lafage V, Kirsch T, and Errico TJ (2014). Spinal cord injury models: a review. Spinal Cord 52, 588–595. 10.1038/sc.2014.91. [DOI] [PubMed] [Google Scholar]
- 99.McDonough A, Monterrubio A, Ariza J, and Martínez-Cerdeño V (2015). Calibrated forceps model of spinal cord compression injury. J. Vis. Exp 10.3791/52318. [DOI] [PMC free article] [PubMed] [Google Scholar]
- 100.Horner PJ, Power AE, Kempermann G, Kuhn HG, Palmer TD, Winkler J, Thal LJ, and Gage FH (2000). Proliferation and differentiation of progenitor cells throughout the intact adult rat spinal cord. J. Neurosci 20, 2218–2228. 10.1523/JNEUROSCI.20-06-02218.2000. [DOI] [PMC free article] [PubMed] [Google Scholar]
- 101.Chehrehasa F, Meedeniya ACB, Dwyer P, Abrahamsen G, and Mackay-Sim A (2009). EdU, a new thymidine analogue for labelling proliferating cells in the nervous system. J. Neurosci. Methods 177, 122–130. 10.1016/j.jneumeth.2008.10.006. [DOI] [PubMed] [Google Scholar]
- 102.Tirosh I, Izar B, Prakadan SM, Wadsworth MH 2nd, Treacy D, Trombetta JJ, Rotem A, Rodman C, Lian C, Murphy G, et al. (2016). Dissecting the multicellular ecosystem of metastatic melanoma by single-cell RNA-seq. Science 352, 189–196. 10.1126/science.aad0501. [DOI] [PMC free article] [PubMed] [Google Scholar]
- 103.Janky R, Verfaillie A, Imrichová H, Van de Sande B, Standaert L, Christiaens V, Hulselmans G, Herten K, Naval Sanchez M, Potier D, et al. (2014). regulon: from a gene list to a gene regulatory network using large motif and track collections. PLoS Comput. Biol 10, e1003731. 10.1371/journal.pcbi.1003731. [DOI] [PMC free article] [PubMed] [Google Scholar]
Associated Data
This section collects any data citations, data availability statements, or supplementary materials included in this article.
Supplementary Materials
Data Availability Statement
Sequencing data have been deposited in the GEO (Database: GSE202627).
This paper does not report original code.
Any additional information required to reanalyze the data reported in this paper is available from the lead contact upon request.