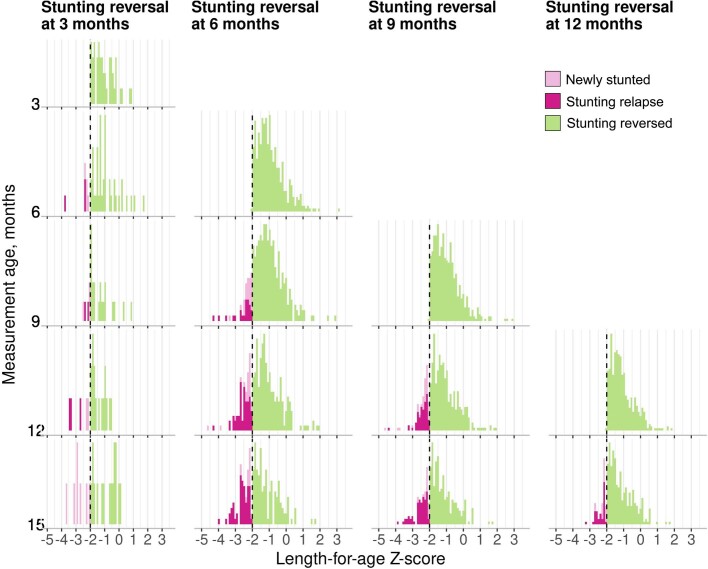
Extended Data Fig. 13. Distribution of LAZ at subsequent measurements after stunting reversal.
Includes data from 21 cohorts in 10 countries with at least monthly measurement (N = 11,271 children). All panels contain data up to age 15 months because in most cohorts, measurements were less frequent above 15 months. The underlying data is equivalent to that displayed in Fig. 5a; this figure uses a different color palette to emphasize observations in which children experienced new stunting, stunting relapse, or stunting reversal.

