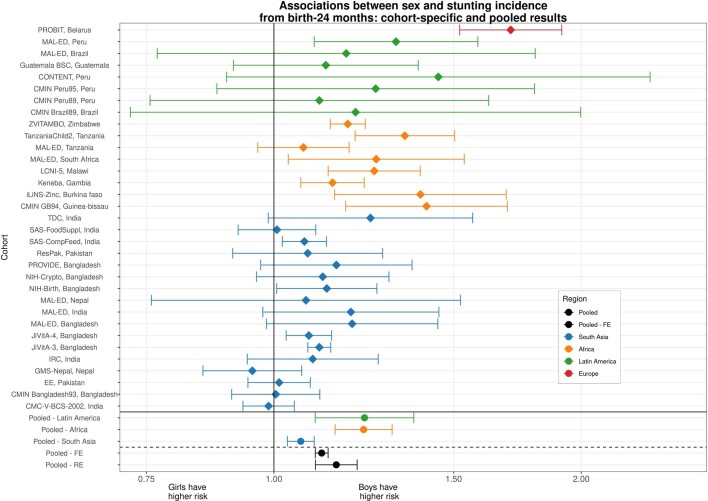
Extended Data Fig. 1. Example forest plot of cohort-specific and pooled parameter estimates.
Cohort-specific estimates of the cumulative incidence ratio of stunting are plotted on each row, comparing the risk of any stunting from birth to 24 months among boys compared to a reference level of girls. Below the solid horizontal line are region-specific pooled measures of association, pooled using random-effects models. Below the dashed line are overall pooled measures of association, comparing pooling using random or fixed effects models. The primary results reported throughout the manuscript are overall (not region stratified) estimates pooled using random effects models.

