Abstract
The complexity of biologic tissues, with multiple compartments each with its own diffusion and relaxation properties, requires complex formalisms to model water signal in most magnetic resonance imaging or magnetic resonance spectroscopy experiments. In this article, we describe a magnetic susceptibility-induced shift in the resonance frequency of extracellular water by the introduction of a gadolinium contrast agent to medium perfusing a hollow fiber bioreactor. The frequency shift of the extracellular water (+185 Hz at 9.4 T) uncovers the intracellular water and allows direct measurement of motional and relaxation properties of the intracellular space. The proposed method provides a unique tool for understanding the mechanisms underlining diffusion and relaxation in the intracellular space.
Keywords: bioreactor, intracellular water, diffusion, bulk susceptibility, relaxation
The MR signal in imaging (MRI) or spectroscopy (MRS) of water in living tissue usually consists of a single resonance reflecting an ensemble of water in multiple complex compartments, such as cell cytoplasm, cell nuclei, extravascular/extracellular, and vascular spaces. This resonance is broadened by ill-defined mechanisms contributing to T2 and T2* processes and likely includes distinct behaviors in distinct compartments and intercompartmental exchange. In rare cases, water in these distinct compartments can be independently interrogated and has been shown to have behaviors that are different from, but contribute to, the ensemble of signals from whole tissue. For example, single voxels can be placed wholly within the large nuclei of invertebrate neurons, and parameters such as the apparent diffusion coefficient can be measured (1). In high-resolution spectroscopic imaging, some voxels in biologic tissues can contain multiple water resonances that are magnetically distinct, although these have not yet been ascribed to specific compartments (2). In order to fully understand how individual compartments contribute to the ensemble of spins that make up tissue water, it would be desirable to measure signal from individual compartments where relaxational, motional, and exchange properties may yield valuable information on the physiologic status of the tissue.
A clear example where water in different compartments exhibits distinct behaviors is the case of diffusion-weighted MRI (DWMRI). Measuring water diffusion in tissue by MRI has emerged as a powerful tool both in clinical and in preclinical research. Applications range from the early detection of ischemic stroke to the monitoring of chemotherapeutic response in tumors (3,4). In the case of acute stroke, the apparent diffusion coefficient (ADC) of water, as measured by DWMRI, declines by 30–60% within minutes after the onset of ischemia and a number of biologic mechanisms have been proposed to explain the ADC changes. Among them are an increase in the intracellular water volume fraction (5), an increase in tortuosity of the extracellular water (6), and/or a decrease in energy-dependent intracellular microcirculation (7) (cytoplasmic streaming). Changes in the ADC have also been used as an early marker of the chemotherapeutic response in tumors both in clinical (8) and in preclinical (9-11) settings. In this case, an increase in the ADC of tumor water is correlated with tumor response and is postulated to arise from a loss in cellularity, either by necrosis and/or by apoptosis.
Extraction of quantitative parameters from DWMRI experiments is complicated because the measured MR signal comes from water within multiple exchanging compartments, each of which may have different diffusion, relaxation, and geometric properties (12). In DWMRI of living tissues, distinct components with fast and slow diffusion have been observed (13). However, the assignment of these various pools to particular physiologic compartments remains a subject of debate (14). Sophisticated models have been used to account for all contributing factors, yet these are completely dependent on estimated values for diffusion within, and exchange between, compartments (15-17). Values for the intracellular diffusion coefficient have been estimated from these models, interpolated from the measured diffusion of intracellular metabolites (18), or directly measured in extremely large invertebrate neurons (19).
In this article, we demonstrate that the extracellular and intracellular water signals can be spectrally separated by the addition of a common contrast agent (Gd-DTPA, Magnevist, referred as Gd-DTPA below) to mammalian cells cultured in a geometrically defined hollow-fiber bioreactor (HFBR). The spectral resolution of intracellular and extracellular water allows a direct measurement of relaxivity and diffusivity properties within their specific compartment.
MATERIALS AND METHODS
HFBR
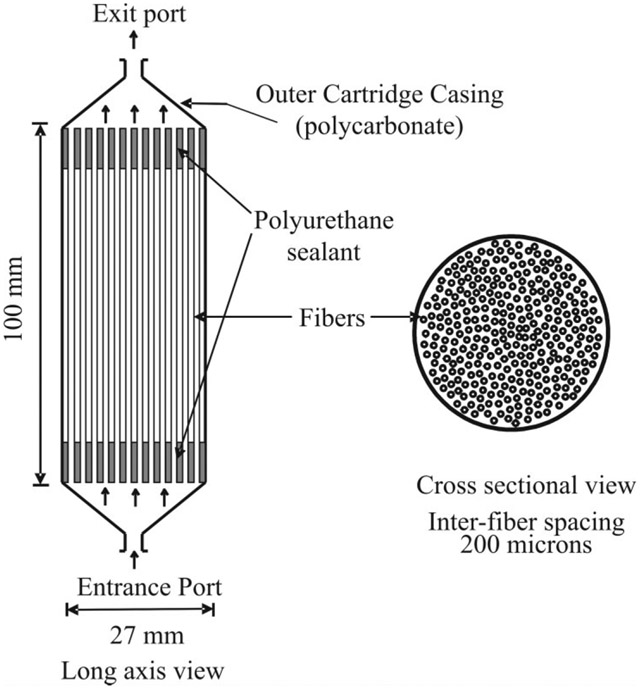
The HFBR system shown in Fig. 1 was constructed by Microgon (Laguna Hills, CA, USA). It consists of a 27-mm-OD polycarbonate casing containing approximately 450 0.32-mm-ID cellulose acetate/cellulose nitrate copolymer microporous hollow fibers with average pore sizes of 0.2 μm. In this system, cells are grown to tissue density in the interfiber spaces and are supplied with nutrients by continuous flowing of oxygenated medium through the lumen of the fibers at a stabilized flow rate of 150 mL/min. The medium velocity through each fiber was calculated to be ~3 cm/s. HFBRs are specifically designed to minimize the existence of nutrient/O2 gradients within the bioreactor. The average fiber spacing is 200 μm. Hence, cells are nominally no further than 100 μm from a fiber supplying oxygenated medium. This configuration has been shown to maintain all cells in a well-oxygenated environment (20). The temperature and gas composition of the perfusate was maintained by a perfusion system described elsewhere (21). The current system was modified to incorporate a second parallel perfusion circuit to allow for rapid and complete medium switching as less than 1 min. Aeration was achieved with a defined gas mixture of 60% O2, 35% N2, and 5% CO2.
FIG. 1.
The hollow fiber bioreactor (HFBR). The HFBR consists of a 27-mm polyurethane casing containing approximately 450 0.5-mm-ID highly porous fibers. The perfusate consisting of DMME supplemented with 10% FBS serum is pumped through the fibers at a flow rate of 150 mL/min. Cells grow outside the fibers. The various compartments of a bioreactor are as follows: (1) the fiber lumen where the medium is flowing, (2), the fiber walls, highly porous, and (3) the extrafiber space that contains both intracellular and extracellular (nonflowing) spaces whose ratio is a function of cell growth.
Bioreactor Compartments
HFBR systems present three spatially distinct physical compartments: (1) the hollow-fibers lumen where the perfusate is flowing, (2) the porous fibers walls, and (3) the extrafiber space in which the cells are grown. Note that in presence of cells the extrafiber space will contain both intracellular and extracellular spaces with their respective volume fraction depending on the stage of growth.
Cell Culture
Rat glioma cells (C6) were obtained from American Type Culture Collection and routinely cultured in Dulbecco’s modified Eagle’s medium (Sigma) supplemented with 10% fetal bovine serum (FBS, Sigma). An inoculum of ~4 × 10⁸ cells was infused into the extrafiber space at the beginning of the experiment through an inoculation port machined in the side of the HFBR. The medium was supplemented with 5 mM dimethylmethylphosphonate (DMMP) used as in internal reference and to measure volume fractions (22). The 5 mM Gd-DTPA-containing medium was made from the same original preparation in order to have the same DMMP concentration. A glass capillary tube filled with 500 mM 3-aminopropylphosphonic acid (3-APP, Sigma, 20 μL total volume) was secured to the outside of the HFBR as an external standard.
MRI/MRS
All experiments were carried out at 9.4 T on a Bruker Avance spectrometer (Karlsruhe, Germany) equipped with self-shielded orthogonal imaging gradients (1000 mT/m max strength and 150 μs rise time). A custom made 27-mm dual-tuned (31P/1H) birdcage RF probe was used for excitation and reception in all experiments (Bruker). Fully relaxed 31P MR spectra were obtained via a one-pulse sequence using a 30° pulse every 1 sec and collecting 4096 points over a spectral width of 100 ppm. Either 3600 or 7200 averages were collected resulting in experiment times of 0.5 or 1 h. Separate 31P spectra were collected with a 60-s repetition time (TR) and Waltz-4 decoupling during acquisition to obtain a fully relaxed and 1H decoupled spectrum of DMMP, which was used to calculate the intracellular volume fractions (22).
High-resolution DWMRI images were obtained using a conventional diffusion-weighted stimulated-echo pulse sequence with the following parameters: TR/TE = 1500/30 ms, b = 5000 mm2/s with Δ = 40 ms, δ = 7 ms.
1H MRS was carried out to monitor the effect of Gd-DTPA infusion into the HFBR. Spectra were obtained under nonsaturating conditions with a single average one-pulse excitation (10° flip angle) repeated every 1 s. These experiments were initiated before the infusion of medium containing 5 mM Gd-DTPA and carried out over 20 min following the start of infusion. Once the spectra had stabilized, diffusivity and relaxivity properties of the observed signals were characterized using standard diffusion-weighted and inversion recovery spectroscopic pulse sequences. Inversion recovery curves in the presence of 5 mM Gd-DTPA were obtained with 16 inversion times (TI) ranging from 2 to 2500 ms. DWMRS experiments were carried out using 34 linearly spaced gradient strengths ranging from 0 to 850 mT/m for three diffusion times (Δ = 20,30,50 ms), using a standard diffusion-weighted stimulated echo pulse sequence. Other parameters included δ = 7 ms, TE = 20 ms, and TR = 2.5 s.
RESULTS
Cell Growth
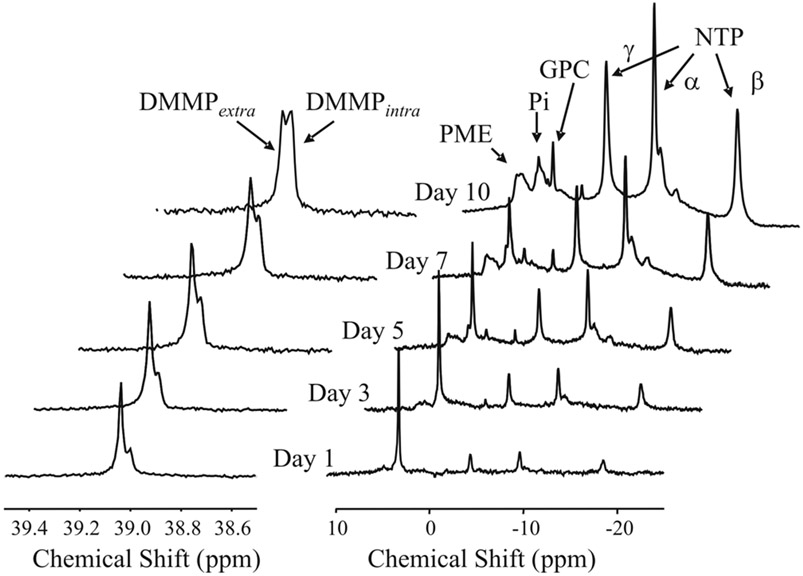
Figure 2 shows a series of 31P MR spectra collected during the growth of C6 cells in the HFBR. The series of spectra on the left are 1H decoupled 31P spectra of the upfield region containing DMMP shown at different times following inoculation. Signals from intracellular and extracellular DMMP are chemically shifted due to differential hydrogen bonding and allow for noninvasive measurement of cell volume fraction (22). The series of spectra on the right are the corresponding coupled 31P spectra of the energetic metabolite region. Signals from nucleoside triphosphates (NTP), glycerolphosphorylcholine (GPC), inorganic phosphate (Pi), and phosphomonoesters (PMEs) can be easily identified at the later time points. Cell growth can be accurately monitored by the area of the β-NTP peak. 31P MRS of DMMP and β-NTP indicates that C6 cells within the HFBR typically reach confluence within 8–10 days after inoculation. The energetic profile has been shown to be remarkably stable during cell growth (20). In particular, the nonbroadening of the Pi resonance indicates the absence of pH gradients within the bioreactor, suggesting homogeneous perfusion and nutrient/O2 delivery.
FIG. 2.
Cell growth as monitored by 31P MRS. The 1H-decoupled spectra of DMMP seen on the left were obtained immediately following the acquisition of the 31P NMR spectra shown on the right. DMMP, dimethylmethylphosphonate; GPC, glycerophosphorylcholine; NTP, nucleoside triphosphates; Pi, inorganic phosphate; PME, phosphomonoesters.
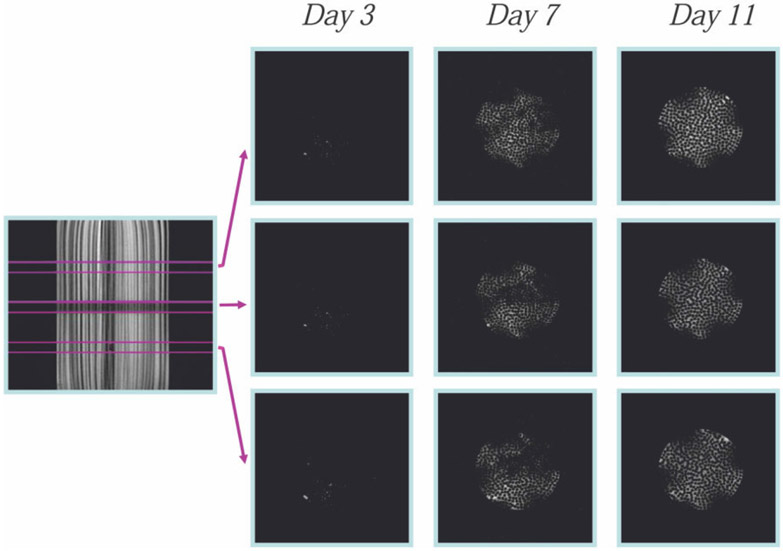
These increases in intracellular 31P signals (DMMP and NTP) were paralleled by an increase in diffusionally restricted water. Figure 3 shows high b-value (5000 s/mm2) cross-sectional diffusion-weighted MR images at three locations within the HFBR during cell growth. At a b-value of 5000 s/mm2 the signal from unrestricted extracellular water becomes virtually undetectable (no signal could be detected in the high b-value images recorded in the absence of cells, data not shown). Hence, only signal from slowly diffusing and/or highly restricted water is observable under these conditions (16) and, as shown below, this most likely represents intracellular water. The images in Fig. 3 were obtained at different times after inoculation and demonstrate that the distribution of restricted water is heterogeneous at low and intermediate growth stages but reaches confluence and homogeneity by day 11. The dark areas at the edge of the HBFR were due to dropoff of signal receptivity between elements of the birdcage coil. We interpret these observations to indicate that, within the limits of spatial resolution, the extrafiber space is homogeneously filled up with highly restricted water (i.e., cells).
FIG. 3.
Cross-sectional diffusion-weighted images at high b-values (5000 s/mm2) at different heights in the bioreactor and at different growth periods. The intensity in the images arises from diffusionally restricted water and represents cell growth.
Gd-DTPA Infusion
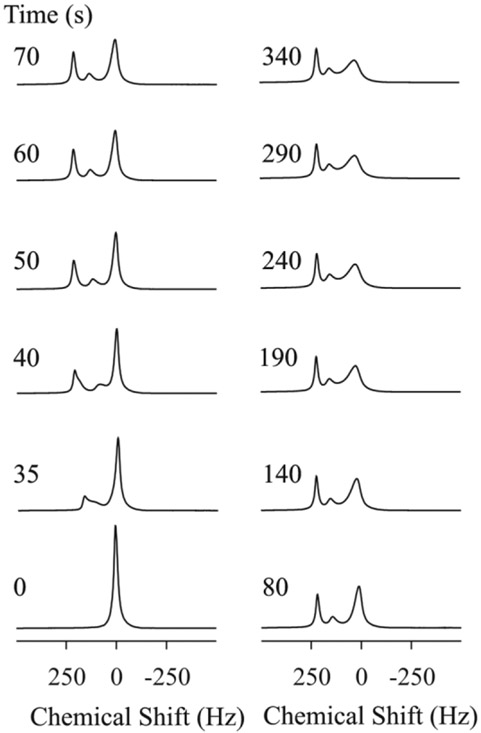
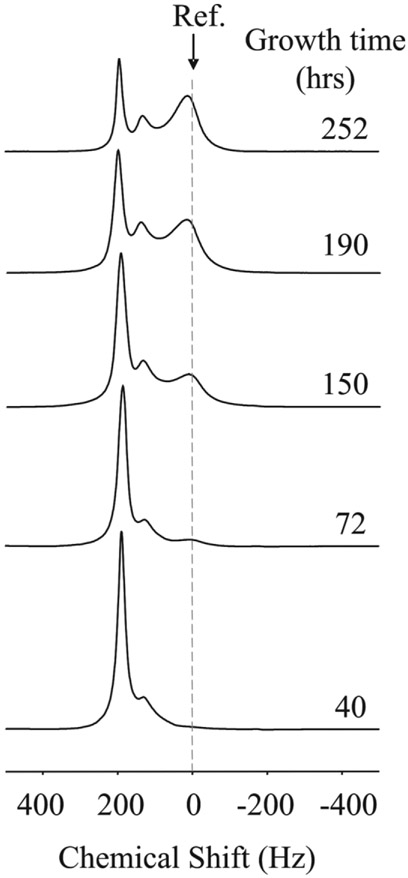
A series of fully relaxed (TR = 1 sec, flip angle = 5°) proton spectra, which were collected from a confluent HFBR after introduction of 5 mM/L Gd-DTPA to the main media vessel, are shown in Fig. 4. Within 35 s, Gd-DTPA triggered a splitting of the water resonance that resulted in three spectrally stable and resolved components within 300 s. There is one upfield peak at +185 Hz (relative to the starting chemical shift), a smaller intermediate resonance at +130 Hz, and one relatively broadened and minimally shifted resonance (~20 Hz). The upfield peak was the first to shift, followed by the +130 Hz peak. Figure 5 shows the equilibrium 1H spectra obtained in the presence of Gd-DTPA at five different stages of growth (days 2, 4, 6, 8, and 10). As cells grow, there is a decrease in the amplitude of the +185 Hz signal and a concomitant increase in the area of the unshifted peak. Note that the chemical shifts of the three peaks are only slightly dependent on cell growth. Interestingly, the extracellular DMMP signal was also shifted by 80 Hz upfield in presence of 5 mM Gd-DTPA (data not shown).
FIG. 4.
Kinetics of Gd-DTPA infusion by 1H MRS at day 11. At 0 sec, the perfusate is switched to a 5 mM Gd-DTPA-containing medium. At a 3 mL/min flow rate the Gd-DTPA containing medium reaches the bioreactor in ~35 s. The total exchange of medium within the bioreactor extrafiber space is completed within 5 min.
FIG. 5.
1H spectrum in the presence of 5 mM Gd-DTPA at various stages of growth. The magnitude of the unshifted signal increases with growth, while the magnitude of the leftmost peak decreases. Ref: Signal position prior the 5 mM Gd-DTPA injection.
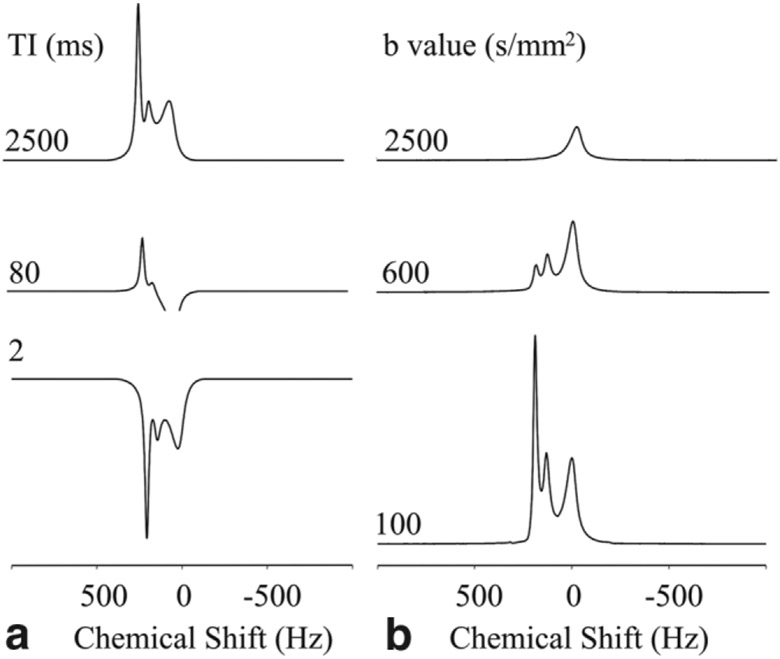
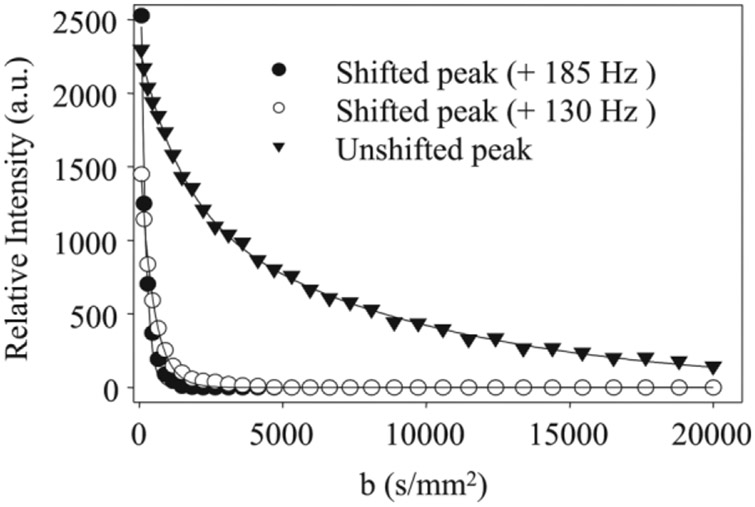
After stabilization of the signals in the presence of Gd-DTPA, the diffusion and relaxation properties of these resonances were investigated by MRS. Figure 6a shows a series of representative spectra from an inversion recovery experiment obtained at three different inversion recovery times (TI = 2, 80, and 2500 ms) on day 10 of the experiment. At recovery time of 80 ms, the two upfield resonances have relaxed significantly, consistent with an interaction with Gd-DTPA. Note that the unshifted peak has only minimally relaxed at 80 ms, indicating that it is not significantly influenced by the Gd-DTPA. The T1 values for the shifted resonances were similar (62 ± 4 and 68 ± 5 ms for the +185 and +130 Hz resonances, respectively), indicating similar concentrations of Gd-DTPA, whereas the T1 of the unshifted resonance was longer, at 251 ± 5 ms. Figure 6b shows a series of spectra obtained at three different b-values (100, 600, 2500 s/mm2) at a diffusion time Δ = 30 ms. At a b-value of 2500 s/mm2, only the unshifted peak was observable. Figure 7 shows the peak areas of the three resonances plotted as a function of b-value along with fits to monoexponential (shifted resonances) and biexponential decays (unshifted peak). The most shifted signal showed a nonmonoexponential behavior composed of a flow component and fast diffusing component. The flow component was strongly attenuated for b-value above 75 s/mm2 and data above this value were fitted to a monoexponential decay with an apparent diffusivity of 3.7 ± 0.8 μm2/ms. The diffusivity measured for the +130 Hz peak was 2.9 ± 0.3 μm2/ms (monoexponential fit). The unshifted peak showed a nonmonoexponential behavior and was only fitted by a biexponential decay (Fig. 7). The apparent diffusivities extracted from the fit were relatively low (0.11 and 0.71 μm2/ms) and exhibited a dependence on the diffusion time (see Table 1). The apparent diffusivities measured for the shifted resonances did not show a dependence on the diffusion time (data not shown).
FIG. 6.
Representative spectra from (a) inversion recovery and (b) diffusion-weighted experiments in the presence of Gd-DTPA obtained at day 11 of the experiment.
FIG. 7.
Diffusion-weighted signal decays of water signals in presence 5 mM Gd-DTPA. The data were obtained at day 11 of the experiment using a diffusion time of 30 ms. The unshifted (intracellular) water resonance (▼) showed nonmonoexponential behavior. The solid line (—) represents a biexponential fit to the data with the following parameters: S(b) = Vf1e−bADC1 + Vf2e−bADC2 with Vf1 = 0.44, ADC1 = 0.71 μm2/ms, Vf2 = 0.56, and ADC2 = 0.11 μm2/ms. The shifted peaks +185 Hz (●) and +130 Hz (○) showed monoexponential behavior with measured ADCs of 3.7 ± 0.8 and 2.9 ± 0.3 μm2/ms, respectively.
Table 1.
Diffusion Time Dependence of ADCs (Unshifted Resonance)
| Δ (ms) | ADC1 (μm2/ms) |
Vf1 (%) | ADC2 (μm2/ms) |
Vf2 (%) |
|---|---|---|---|---|
| 20 | 0.77 ± 0.05 | 0.41 ± 0.02 | 0.18 ± 0.04 | 0.59 ± 0.03 |
| 30 | 0.71 ± 0.05 | 0.44 ± 0.03 | 0.11 ± 0.03 | 0.56 ± 0.03 |
| 50 | 0.61 ± 0.04 | 0.50 ± 0.03 | 0.08 ± 0.02 | 0.50 ± 0.03 |
Note. Apparent diffusivities (ADC1, ADC2) and associated volume fractions (Vf1, Vf2) of the unshifted (intracellular) water resonance were measured at three diffusion time (Δ). The parameters were obtained by fitting the data obtained as shown in Figure 7 to a biexponential decay (S(b) = Vf1e−bADC1 + Vf2e−bADC2).
DISCUSSION
Peak Assignments
From the above observations, we propose the following assignments for the three observed resonances: The +185 Hz resonance comes from water within the lumen of the fibers (flowing medium) and from water located in the extrafiber/extracellular space. This is consistent with the fast appearance of this peak after the addition of contrast (Fig. 4), the decrease in the relative magnitude of this peak with cell growth (Fig. 5), the observed decrease in T1 after addition of Gd-DTPA (Fig. 6a), and the presence of a non-flowing but fast diffusing component (Fig. 7).
The intermediate resonance (+130 Hz) arises from the water within the fiber walls. This component is seen with or without the presence of cells (spectra not shown) and its relative magnitude remains constant during the course of cell growth. It is also slightly slower to appear than the +185 Hz peak, but has similar T1 relaxation and fast diffusion. Moreover, localized 1H spectra obtained from volumes in HBFR that were devoid of fibers did not contain this resonance (data not shown).
Finally, the unshifted resonance arises from water in the intracellular space. The resonance is not observed without cells; its magnitude increases with cell growth (Fig. 5); it has a long relaxation time in presence Gd-DTPA and slow apparent diffusion coefficients. The slower relaxation rate for this resonance indicate that it is not in direct contact with gadolinium and the dependence of its ADC values on diffusion time (Table 1) is compatible with restricted diffusion. The broadening of this peak compared to the others is likely the result of molecular diffusion within magnetic field gradients near the surface of the cell and/or partial exchange with the extracellular space.
Volume Fractions
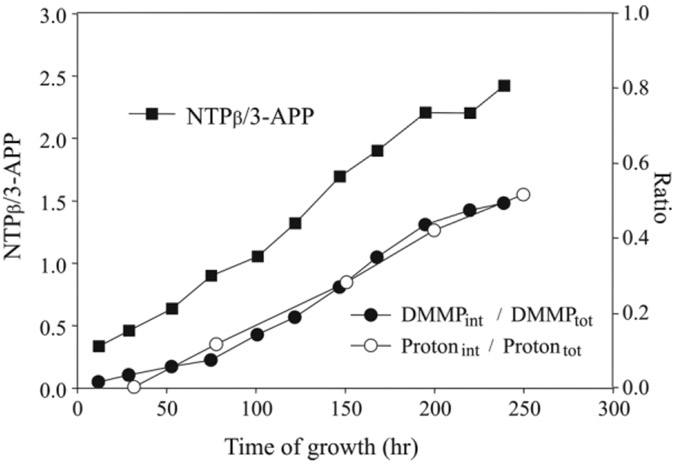
The calculated volume fraction of the unshifted resonance obtained from the 1H spectra (defined as the ratio between the unshifted peak and the sum of shifted resonances) correlated well with the same volume fraction calculated from the DMMP signals (Fig. 8). Moreover, the magnitude of the intracellular/unshifted resonance was also highly correlated to the bioreactor cell mass as monitored by 31P MRS (Fig. 8). Overall, these data suggest that the three observed water peaks correspond to four identifiable bioreactor compartments: the extrafiber/extracellular space (EES) and intrafiber luminal space (which combines to give the downfield resonance at +185 Hz), the fiber walls themselves (+130 Hz), and the intracellular space, which remains minimally shifted. The coresonance of the EES and luminal water was surprising, as we would expect that the EES and cells would coexist in a similar magnetic environment and, hence, experience the same susceptibility. However, the decrease of this resonance with increased cell density is compelling evidence that the EES coresonates with the upfield peak.
FIG. 8.
Cell growth and volume cell fractions as a function of time. Cell growth was determined by the increase in the ratio of β-NTP signal (normalized to the external standard, 3-APP) over time (■, left side scale). The cell volume fractions derived from the 1H spectrum in presence of Gd-DTPA (○, right side scale), are defined as the ratio of the unshifted signal to shifted signals The cell volume fractions derived from the 31P spectrum of DMMP (●, right side scale) are defined as the ratio of the upfield signal (extracellular) to downfield signals (intracellular).
Diffusion Behavior of the Unshifted Peak
Figure 7 shows that the signal decay curves for the unshifted signal deviates significantly from monoexponentiality. Nonmonoexponentiality of signal decay curves has been observed and predicted for a single compartment with boundaries (23), for two compartments in presence of exchange (24), or in the presence of a combination of restriction and exchange (12,25). In vivo data collected over an extended range of b-values (with a maximum b-value up to 10000 s/mm2) can often be phenomenologically fitted to a biexponential decay. This is true for data obtained for brain (26) or implanted tumors (27). At even higher b-values (up to 5.8 × 10⁵ s/mm2), multiexponential terms are needed to fit data in brain tissues (28,29). Theory predicts that biexponential fit is essentially phenomenological, wherein each component does not necessarily correspond to a specific tissue compartment (25,30). In all previous studies, however, the signal undergoing analysis was a combination of water signals originating from various compartments including the extracellular space. The fit in the present work is specifically from the intracellular space and still exhibits non monoexponential behavior. A phenomenological biexponential fit to the data from the unshifted/intracellular peak shown in Fig. 7 yielded two distinct components with relatively low ADCs. As mentioned above, this nonmonexponentiality is compatible with restricted diffusion and/or with exchange between subcellular compartments. The observed dependence of these ADCs on the diffusion time is consistent with such effects (Table 1). Interestingly, results from previous studies on isolated cells have reported similar low diffusivity components using biexponential or multiexponential analysis. Pilatus et al. could fit data from various cell lines to a biexponential decay over a moderate b-range (0–~12000 s/mm2), yielding “slow component” diffusivities ranging from 0.22 ± 0.02 to 0.47 ± 0.05 μm2/ms depending on diffusion time (31). Smouha and Neeman reported similar “slow” diffusivities ranging from 0.11 ± 0.02 to 0.74 ± 0.01 μm2/ms (depending on diffusion time) from a biexponential fit over a smaller b-value range (0–5000 mm2/ms) (32). However, at a higher range of b-values (0–25000 s/mm2), data obtained from perfused C6 glioma cells could no longer be fit to a biexponential decay (16). To fully characterize the nature of the nonmonoexponentiality of the intracellular signal decay, further experimental data, including relaxivity studies at different b-values and diffusion times (33), and the use of more complex analytical models will be required (12,25). Considering that the intracellular and extracellular water signals can be resolved, we can also conclude that these water pools are in relatively slow exchange within the NMR timescale.
Mechanisms of Frequency Shift: Bulk Susceptibility
The use of shift reagent to separate intracellular and extracellular information has been an active fields of research for the past 20 years (34-37). A great deal of the research has focused on the relative contribution of bulk magnetic susceptibility and hyperfine interactions to the observed chemical shift (34). A full description of the mechanisms behind the contrast agent induced shift is beyond the scope of this paper. However, the shifts are consistent with changes in the bulk magnetic susceptibility caused by the presence of Gd-DTPA in the cylindrical geometries of the HFBR (34). The HFBR can be considered to be filled with an effective susceptibility given by the volume fraction of cells to medium (with Gd-DTPA). In order for the line center of the extrafiber/extracellular peak to be shifted relative to the intracellular peak, the average geometry of the cells should be nonspherical and elongated along the direction of fibers. Cell alignment in a magnetic field has been reported for red blood cells (38) but we know of no such observation in other cell type. Further studies are underway to characterize the mechanisms underlining the observed frequency shifts.
The most significant result of these findings is that the HFBR system allows intracellular water to be directly interrogated in cell cultures. There are many applications where this ability will prove useful. In the area of diffusion-weighted MRI and MRS, intracellular and extracellular spaces can be investigated individually. In this report, the intracellular water diffusion was found to have biexponential-like behavior consistent with restricted diffusion and/or exchange within the cellular boundaries. The ability to individually investigate intracellular water will also be useful in the context of q-space analysis, which aims to measure the distribution of the average mean distance traveled by water during a given diffusion time (39). In the absence of gadolinium, all water populations contribute to the signal, and the diffusion distance distributions include both extracellular and intracellular water, which complicates the interpretations of distribution of mean averaged distances. Using the HFBR, separate water compartments can be investigated independently. The spectral resolution of water resonance could also allow the use of magnetization transfer techniques to directly measure exchange between the two pools of water. It is also important to note that these measurements require a relatively inexpensive gadolinium-based shift reagent which can be used “off the shelf” with no toxic effects. This is particularly relevant for cell culture experiments for which paramagnetic shift reagent toxicity has been an issue (40).
CONCLUSIONS
The HFBR described herein allows cell cultures to be grown to high cell density in a well-controlled and easily manipulated environment. The unique geometry of the HFBR also allows intracellular water to be separated from extracellular water using a common MR contrast agent. The first direct measurement of the T1 relaxation and diffusional motion of chemically separated intracellular water in mammalian cells have been reported. We believe that HFBR systems, with their ability to maintain high-density cell cultures and unique cylindrical geometry, have the potential to become an important tool to study a number of biophysical properties including intracellular diffusion and its relation to cellular energetic metabolism in the context of ischemia and/or chemotherapeutic response.
ACKNOWLEDGMENTS
The authors thank Robert Sandoval for his assistance in data processing.
Grant sponsor: NIH; Grant numbers: RO1CA88285 (JPG) and GM57270 (TPT).
REFERENCES
- 1.Hsu EW, Aiken NR, Blackband SJ. Nuclear magnetic resonance microscopy of single neurons under hypotonic perturbation. Am J Physiol 1996;271:C1895–C1900. [DOI] [PubMed] [Google Scholar]
- 2.Gillies RJ, Raghunand N, Karczmar GS, Bhujwalla ZM. MRI of the tumor microenvironment.[erratum appears in J Magn Reson Imaging 2002 Dec;16(6):751]. J Magn Reson Imaging 2002;16:430–450. [DOI] [PubMed] [Google Scholar]
- 3.Moseley M, Cohen Y, Mintorovitch J, Chileuitt L, Shimizu H, Kucharczyk J, Wendland M, Weinstein PR. Early detection of regional cerebral ischemia in cats: comparison of diffusion- and T2-weighted MRI and spectroscopy. Magn Reson Med 1990;14:330–346. [DOI] [PubMed] [Google Scholar]
- 4.Kauppinen RA. Monitoring cytotoxic tumour treatment response by diffusion magnetic resonance imaging and proton spectroscopy. NMR Biomed 2002;15:6–17. [DOI] [PubMed] [Google Scholar]
- 5.van Gelderen P, de Vleeschouwer MH, DesPres D, Pekar J, van Zijl PC, Moonen CT. Water diffusion and acute stroke. Magn Reson Med 1994; 31:154–163. [DOI] [PubMed] [Google Scholar]
- 6.Sykova E, Svoboda J, Polak J, Chvatal A. Extracellular volume fraction and diffusion characteristics during progressive ischemia and terminal anoxia in the spinal cord of the rat. J Cereb Blood Flow Metab 1994; 14:301–311. [DOI] [PubMed] [Google Scholar]
- 7.van der Toorn A, Dijkhuizen RM, Tulleken CA, Nicolay K. Diffusion of metabolites in normal and ischemic rat brain measured by localized 1H MRS. Magn Reson Med 1996;36:914–922. [DOI] [PubMed] [Google Scholar]
- 8.Chenevert TL, Stegman LD, Taylor JM, Robertson PL, Greenberg HS, Rehemtulla A, Ross BD. Diffusion magnetic resonance imaging: an early surrogate marker of therapeutic efficacy in brain tumors. J Natl Cancer Inst 2000;92:2029–2036. [DOI] [PubMed] [Google Scholar]
- 9.Galons JP, Altbach MI, Paine-Murrieta GD, Taylor CW, Gillies RJ. Early increases in breast tumor xenograft water mobility in response to paclitaxel therapy detected by non-invasive diffusion magnetic resonance imaging. Neoplasia (New York) 1999;1:113–117. [DOI] [PMC free article] [PubMed] [Google Scholar]
- 10.Zhao M, Pipe JG, Bonnett J, Evelhoch JL. Early detection of treatment response by diffusion-weighted 1H-NMR spectroscopy in a murine tumour in vivo. Br J Cancer 1996;73:61–64. [DOI] [PMC free article] [PubMed] [Google Scholar]
- 11.Chenevert TL, McKeever PE, Ross BD. Monitoring early response of experimental brain tumors to therapy using diffusion magnetic resonance imaging. Clin Cancer Res 1997;3:1457–1466. [PubMed] [Google Scholar]
- 12.Karger J, Pfeifer H, Heink W. Principles and application of self diffusion measurements by nuclear magnetic resonance. Adv Magn Reson 1988;12:1–89. [Google Scholar]
- 13.Norris DG, Niendorf T. Interpretation of DW-MR data: dependence on experimental conditions. NMR Biomed 1995;8:280–288. [DOI] [PubMed] [Google Scholar]
- 14.Sehy JV, Ackerman JJ, Neil JJ. Evidence that both fast and slow water ADC components arise from intracellular space. Magn Reson Med 2002;48:765–770. [DOI] [PubMed] [Google Scholar]
- 15.Latour LL, Svoboda K, Mitra PP, Sotak CH. Time-dependent diffusion of water in a biological model system. Proc Natl Acad Sci USA 1994; 91:1229–1233. [DOI] [PMC free article] [PubMed] [Google Scholar]
- 16.Pfeuffer J, Flogel U, Dreher W, Leibfritz D. Restricted diffusion and exchange of intracellular water: theoretical modelling and diffusion time dependence of 1H NMR measurements on perfused glial cells. NMR Biomed 1998;11:19–31. [DOI] [PubMed] [Google Scholar]
- 17.Szafer A, Zhong J, Gore JC. Theoretical model for water diffusion in tissues. Magn Reson Med 1995;33:697–712. [DOI] [PubMed] [Google Scholar]
- 18.Duong TQ, Ackerman JJ, Ying HS, Neil JJ. Evaluation of extra- and intracellular apparent diffusion in normal and globally ischemic rat brain via 19F NMR. Magn Reson Med 1998;40:1–13. [DOI] [PubMed] [Google Scholar]
- 19.Hsu EW, Aiken NR, Blackband SJ. A study of diffusion isotropy in single neurons by using NMR microscopy. Magn Reson Med 1997;37: 624–627. [DOI] [PubMed] [Google Scholar]
- 20.Chresand TJ, Gillies RJ, Dale BE. Optimum fiber spacing in a hollow fiber bioreactor. Biotechnol Bioeng 1988;32:983–992. [DOI] [PubMed] [Google Scholar]
- 21.Gillies RJ, Galons JP, McGovern KA, Scherer PG, Lien YH, Job C, Ratcliff R, Chapa F, Cerdan S, Dale BE. Design and application of NMR-compatible bioreactor circuits for extended perfusion of high-density mammalian cell cultures. NMR Biomed 1993;6:95–104. [DOI] [PubMed] [Google Scholar]
- 22.Barry JA, McGovern KA, Lien YH, Ashmore B, Gillies RJ. Dimethyl methylphosphonate (DMMP): a 31P nuclear magnetic resonance spectroscopic probe of intracellular volume in mammalian cell cultures. Biochemistry 1993;32:4665–4670. [DOI] [PubMed] [Google Scholar]
- 23.Helmer KG, Dardzinski BJ, Sotak CH. The application of porous-media theory to the investigation of time-dependent diffusion in in vivo systems. NMR Biomed 1995;8:297–306. [DOI] [PubMed] [Google Scholar]
- 24.Lee JH, Springer CS Jr. Effects of equilibrium exchange on diffusion-weighted NMR signals: the diffusigraphic “shutter-speed”. Magn Reson Med 2003;49:450–458. [DOI] [PubMed] [Google Scholar]
- 25.Meier C, Dreher W, Leibfritz D. Diffusion in compartmental systems. I. A comparison of an analytical model with simulations Magn Reson Med 2003;50:500–509. [DOI] [PubMed] [Google Scholar]
- 26.Niendorf T, Dijkhuizen RM, Norris DG, van Lookeren Campagne M, Nicolay K. Biexponential diffusion attenuation in various states of brain tissue: Implication for Diffusion-Weighted Imaging. Magn Reson Med 1996;36:847–857. [DOI] [PubMed] [Google Scholar]
- 27.Hakumaki JM, Poptani H, Puumalainen AM, Loimas S, Paljarvi LA, Yla-Herttuala S, Kauppinen RA. Quantitative 1H nuclear magnetic resonance diffusion spectroscopy of BT4C rat glioma during thymidine kinase-mediated gene therapy in vivo: identification of apoptotic response. Cancer Res 1998;58:3791–3799. [PubMed] [Google Scholar]
- 28.Assaf Y, Cohen Y. Non-mono-exponential attenuation of water and N-acetyl aspartate signals due to diffusion in brain tissue. J Magn Reson 1998;131:69–85. [DOI] [PubMed] [Google Scholar]
- 29.Meier C, Dreher W, Leibfritz D. Diffusion in compartmental systems. II. Diffusion-weighted measurements of rat brain tissue in vivo and postmortem at very large b-values Magn Reson Med 2003;50:510–514. [DOI] [PubMed] [Google Scholar]
- 30.Stanisz GJ. Diffusion MR in biological tissue: tissue compartments and exchange. Isr J Chem 2003;43:33–44. [Google Scholar]
- 31.Pilatus U, Shim H, Artemov D, Davis D, van Zijl PC, Glickson JD. Intracellular volume and apparent diffusion constants of perfused cancer cell cultures, as measured by NMR. Magn Reson Med 1997;37:825–832. [DOI] [PubMed] [Google Scholar]
- 32.Smouha E, Neeman M. Compartmentation of intracellular water in multicellular tumor spheroids: diffusion and relaxation NMR. Magn Reson Med 2001;46:68–77. [DOI] [PubMed] [Google Scholar]
- 33.Stanisz GJ, Li JG, Wright GA, Henkelman RM. Water dynamics in human blood via combined measurements of T2 relaxation and diffusion in the presence of gadolinium. Magn Reson Med 1998;39: 223–233. [DOI] [PubMed] [Google Scholar]
- 34.Chu SC, Xu Y, Balschi JA, Springer CS, Jr. Bulk magnetic susceptibility shifts in NMR studies of compartmentalized samples: use of paramagnetic reagents. Magn Reson Med 1990;13:239–262. [DOI] [PubMed] [Google Scholar]
- 35.Eleff SM, McLennan IJ, Hart GK, Maruki Y, Traystman RJ, Koehler RC. Shift reagent enhanced concurrent 23Na and 1H magnetic resonance spectroscopic studies of transcellular sodium distribution in the dog brain in vivo. Magn Reson Med 1993;30:11–17. [DOI] [PubMed] [Google Scholar]
- 36.Naritomi H, Kanashiro M, Sasaki M, Kuribayashi Y, Sawada T. In vivo measurements of intra- and extracellular Na+ and water in the brain and muscle by nuclear magnetic resonance spectroscopy with shift reagent. Biophys J 1987;52:611–616. [DOI] [PMC free article] [PubMed] [Google Scholar]
- 37.Springer CS Jr., Pike MM, Balschi JA, Chu SC, Frazier JC, Ingwall JS, Smith TW. Use of shift reagents for nuclear magnetic resonance studies of the kinetics of ion transfer in cells and perfused hearts. Circulation 1985;72:IV89–IV93. [PubMed] [Google Scholar]
- 38.Kuchel PW, Durrant CJ, Chapman BE, Jarrett PS, Regan DG. Evidence of red cell alignment in the magnetic field of an NMR spectrometer based on the diffusion tensor of water. J Magn Reson 2000;145:291–301. [DOI] [PubMed] [Google Scholar]
- 39.Cory DG, Garroway AN. Measurement of translational displacement probabilities by NMR: an indicator of comparmentation. Magn Reson Med 1990;14:435–444. [DOI] [PubMed] [Google Scholar]
- 40.Boulanger Y, Fleser A, Amarouche R, Ammann H, Bergeron M, Vinay P. Monitoring of the effects of dysprosium shift reagents on cell suspensions. NMR Biomed 1992;5:1–10. [DOI] [PubMed] [Google Scholar]


