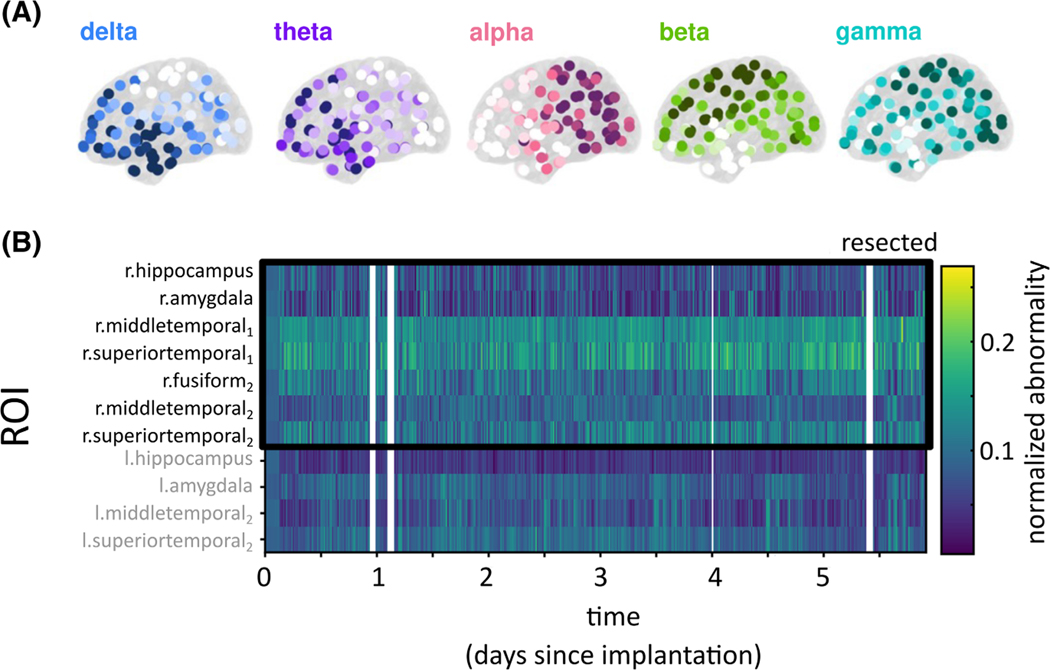
FIGURE 3.
Normative band power maps and abnormality mapping in an example patient. (A) Intracranial electroencephalographic (iEEG) normative band power maps in five frequency bands derived from >200 patients and >21 000 electrode contacts.55 (B) iEEG band power abnormality for an example patient calculated as a function of brain region and time. Band power abnormality is persistently higher in the resected tissue; the patient was seizure-free after surgery. However, band power abnormality can also fluctuate, for example, in the midtemporal area in a circadian rhythm. l, left; r, right; ROI, region of interest.

